global ehs auditing benchmark report 2016 ehs auditin… · global ehs auditing benchmark report...
TRANSCRIPT

////////////////////////////////////////////////////////////////////////////////////////////////////////////////////////////////////////////////////////////
GLOBAL EHS AUDITINGBENCHMARK REPORT 2016EXECUTIVE SUMMARYPresented by: Bloomberg BNA & Enhesa in Association with The Auditing Roundtable

A
Global EHS AuditingBenchmark Report 2016
Executive SummaryPresented by:
Bloomberg BNA and Enhesain association with
The Auditing Roundtable
�2015 The Bureau of National Affairs, Inc. • Arlington, Virginia
Global EHS Auditing Benchmark Report 2016 Executive Summary
ISBN 978-1-63359-089-2
‘‘This publication is designed to provide accurate and authoritative information in regard to thesubject matter covered. It is sold with the understanding that the publisher is not engaged inrendering legal, accounting or other professional service. If legal advice or other expert assistanceis required, the services of a competent professional person should be sought.’’ − From aDeclaration of Principles, jointly adopted by a Committee of the American Bar Association and aCommittee of Publishers and Associations.
For inquiries about purchasing multiple copies of this report, pleasecontact:
Gail Moorstein, Editorial Director([email protected])
Executive SummaryExecutive Summary
A

s Executive Summary
Overview
This second survey by Bloomberg BNA and Enhesa, in cooperation with theAuditing Roundtable, of organizations’ global environmental, health and safety(EHS) auditing activities shows that EHS auditing continues to grow and evolvein important ways.
In comparison with our 2013 survey, the 2015 exercise demonstrates that moreorganizations are starting to audit, and many more say they plan to start soon.Audits also are evolving to include more topical areas in addition to the originalenvironment protection and occupational health and safety issues, and while moreorganizations are developing their own audit protocols, they also are relying moreon professional auditing consultants to help with their audits. These changesindicate EHS auditing is becoming more complicated and challenging, especiallyin an economy that is increasingly globalized.
In a world that is paying greater attention to ecological and human health, it isbecoming increasingly difficult for organizations operating under various globaljurisdictions to comply with environmental, health and safety requirements.
Below is an overview of how the 2015 Bloomberg BNA /Enhesa survey of auditingpractices was conducted, along with a summary of some key trends and how thosetrends have changed since 2013, when the first Bloomberg BNA /Enhesa auditingreport was published.
Notably, for example, more than twice as many organizations reported includingtopics such as the Globally Harmonized System of Classification and Labeling ofChemicals (GHS) in their audits, according to the 2015 survey compared with2013. And while the environment and safety remain the two most frequentlyaudited topics, compared with two years ago the number of respondents whoinclude quality, extended producer responsibility (for products) and energyefficiency almost has doubled. Big increases also were found for topics such assecurity, transportation, emergency planning and corporate social responsibility.Auditing of an organization’s supply chain also appears to be a growing trend.
Most organizations continue to perform their own audits, but a big increase wasnoticed in the use of third-party consultancies and/or trained external auditors,either to perform the audits or augment organizations’ own resources. In addition,the number of organizations that require specific auditing experience of their
�2015 The Bureau of National Affairs, Inc. • Arlington, Virginia 5

auditors is growing, while the number that require no experience reduced bymore than a quarter. Almost 90 percent of organizations surveyed now say theyrequire at least one year of auditing experience. More organizations now reportthey also require professional certification of their auditors, with 90 percentdemanding such certification of their lead auditor—a massive increase comparedwith 2013.
A large percentage of respondents said they base their audits on local andnational regulatory requirements, and many reported seeing at least moderategrowth in the number of these laws and regulations in the countries in which theyoperate. Many also expressed concern about compliance. As one respondent saidin explaining these concerns, ‘‘There are so many regulatory requirements comingout very quickly, it is hard to keep up with them. It is very difficult to keep yourfacilities and employees up-to-date and trained on the newest requirements, whichopens you up to compliance issues.’’ Nearly 20 percent said they are only slightlyor not at all prepared to manage their compliance risks in many of the countriesin which they operate. And for those respondents with operations in China, morethan three-quarters expressed major concerns about their compliance.
The tools that organizations use to conduct their audits also are changing.Although more organizations are using an EHS auditing protocol they developedinternally, more also are using customized protocols developed by an auditingconsultancy and/or off-the-shelf protocols from commercial providers either toconduct a formal audit or augment their own tools. Significantly more respondentsin 2015 said they also use these tools compared with 2013.
More organizations also are using risk analysis in connection with their auditfindings, up almost 10 percent in 2015 over 2013.
About the Survey
The survey for the Global EHS Auditing Benchmark Report 2016 was conductedonline between February 13 and March 13, 2015. The survey was sent toorganizations worldwide and drew 487 respondents (a 77 percent increase over2013), 402 of which currently audit. Of the 85 who currently don’t audit, morethan half said they plan to start auditing in the next one to three years.
The 2015 survey adds extensive new information about how and why companiesaudit in the jurisdictions in which they operate.
Global EHS Auditing Benchmark Report 2016 Executive Summary
6 � 2015 The Bureau of National Affairs, Inc. • Arlington, Virginia

Survey participants reported having operations in almost all (185) of the world’scountries, with 40 percent operating in a single country and 40 percent operatingin six or more countries. Another 8 percent reported operating in more than 30countries.
A majority of respondents—63 percent—reported having headquarters in the U.S.Sixteen percent said they were based in Europe, 9 percent in Asia-Pacificcountries, 3 percent in Africa and the Middle East and 2 percent in Latin America(including Mexico).
Respondent Profile
Typical Respondent: The typical respondent in this survey represents a NorthAmerica-headquartered manufacturing organization with about 38 facilities world-wide and about 1,000 to 2,500 employees. The typical respondent has an ad-equate annual budget for audits. He/she uses corporate personnel and acompany-developed protocol for audits, but often supplement these with proto-cols from vendors, such as AECOM or Enhesa. Audits are based on corporateEHS standards, as well as national or local laws and regulations. The respondenthas at least some concerns about compliance in the various jurisdictions inwhich he/she operates. Audits typically aren’t conducted on an annual basis.
Of the respondents to the 2015 BBNA /Enhesa survey, 57 percent represented themanufacturing industry, 37 percent were nonmanufacturing and 7 percent werenonbusiness. Chemical companies accounted for 67 of the 276 manufacturingorganizations. Of the 178 nonmanufacturers, 62 were consulting companies and 33were utilities.
Figure 1If Organization Does Not Audit, Does It Plan to do so within Next 1 to 3 Years?
53%46%
1%
Yes
No
No response
Source: Bloomberg BNA A BNA Graphic/ehsf8g01
�2015 The Bureau of National Affairs, Inc. • Arlington, Virginia 7
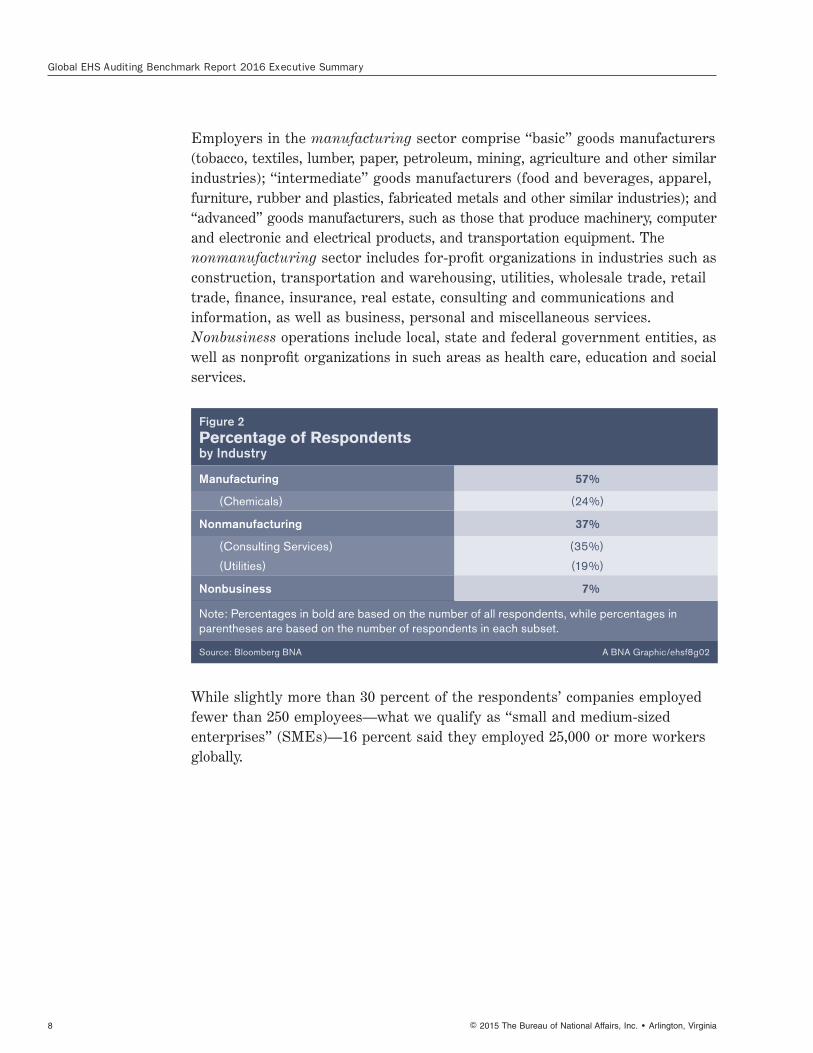
Employers in the manufacturing sector comprise ‘‘basic’’ goods manufacturers(tobacco, textiles, lumber, paper, petroleum, mining, agriculture and other similarindustries); ‘‘intermediate’’ goods manufacturers (food and beverages, apparel,furniture, rubber and plastics, fabricated metals and other similar industries); and‘‘advanced’’ goods manufacturers, such as those that produce machinery, computerand electronic and electrical products, and transportation equipment. Thenonmanufacturing sector includes for-profit organizations in industries such asconstruction, transportation and warehousing, utilities, wholesale trade, retailtrade, finance, insurance, real estate, consulting and communications andinformation, as well as business, personal and miscellaneous services.Nonbusiness operations include local, state and federal government entities, aswell as nonprofit organizations in such areas as health care, education and socialservices.
While slightly more than 30 percent of the respondents’ companies employedfewer than 250 employees—what we qualify as ‘‘small and medium-sizedenterprises’’ (SMEs)—16 percent said they employed 25,000 or more workersglobally.
Figure 2Percentage of Respondentsby Industry
Manufacturing 57%
(Chemicals) (24%)
Nonmanufacturing 37%
(Consulting Services) (35%)
(Utilities) (19%)
Nonbusiness 7%
Note: Percentages in bold are based on the number of all respondents, while percentages in parentheses are based on the number of respondents in each subset.
Source: Bloomberg BNA A BNA Graphic/ehsf8g02
Global EHS Auditing Benchmark Report 2016 Executive Summary
8 � 2015 The Bureau of National Affairs, Inc. • Arlington, Virginia
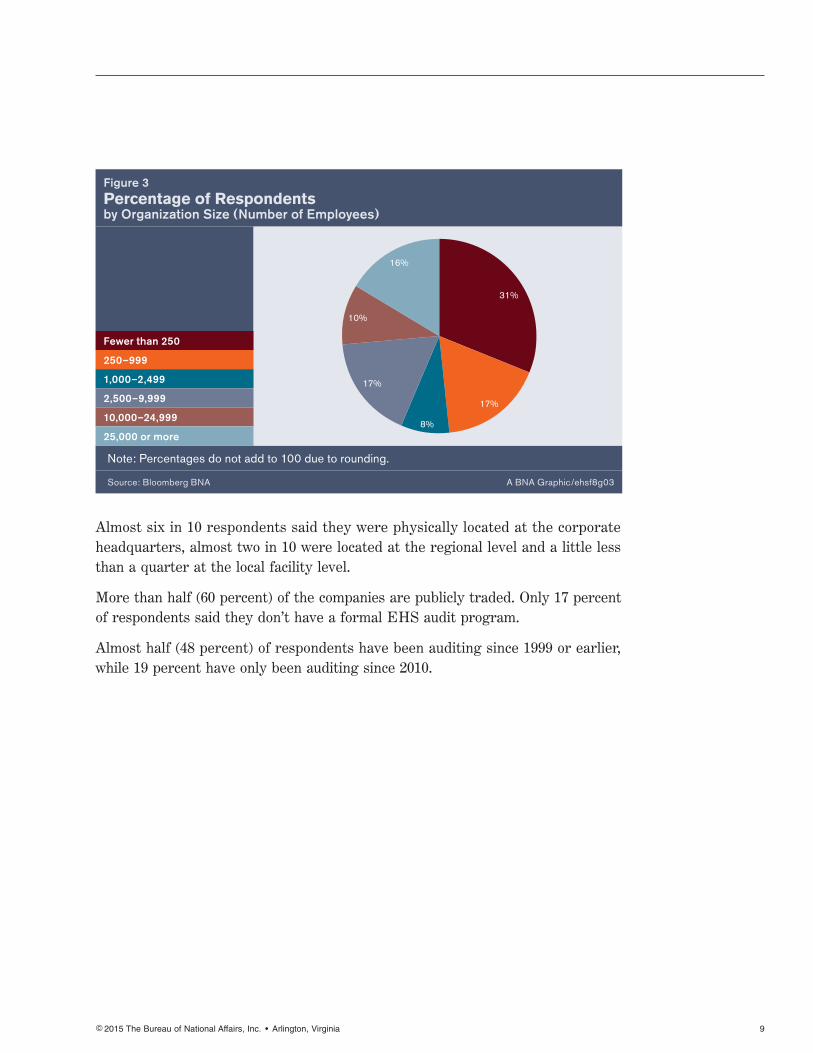
Almost six in 10 respondents said they were physically located at the corporateheadquarters, almost two in 10 were located at the regional level and a little lessthan a quarter at the local facility level.
More than half (60 percent) of the companies are publicly traded. Only 17 percentof respondents said they don’t have a formal EHS audit program.
Almost half (48 percent) of respondents have been auditing since 1999 or earlier,while 19 percent have only been auditing since 2010.
Figure 3Percentage of Respondents by Organization Size (Number of Employees)
31%
8%
17%
16%
10%
17%
Fewer than 250
250–999
1,000–2,499
2,500–9,999
10,000–24,999
25,000 or more
Note: Percentages do not add to 100 due to rounding.
Source: Bloomberg BNA A BNA Graphic/ehsf8g03
�2015 The Bureau of National Affairs, Inc. • Arlington, Virginia 9
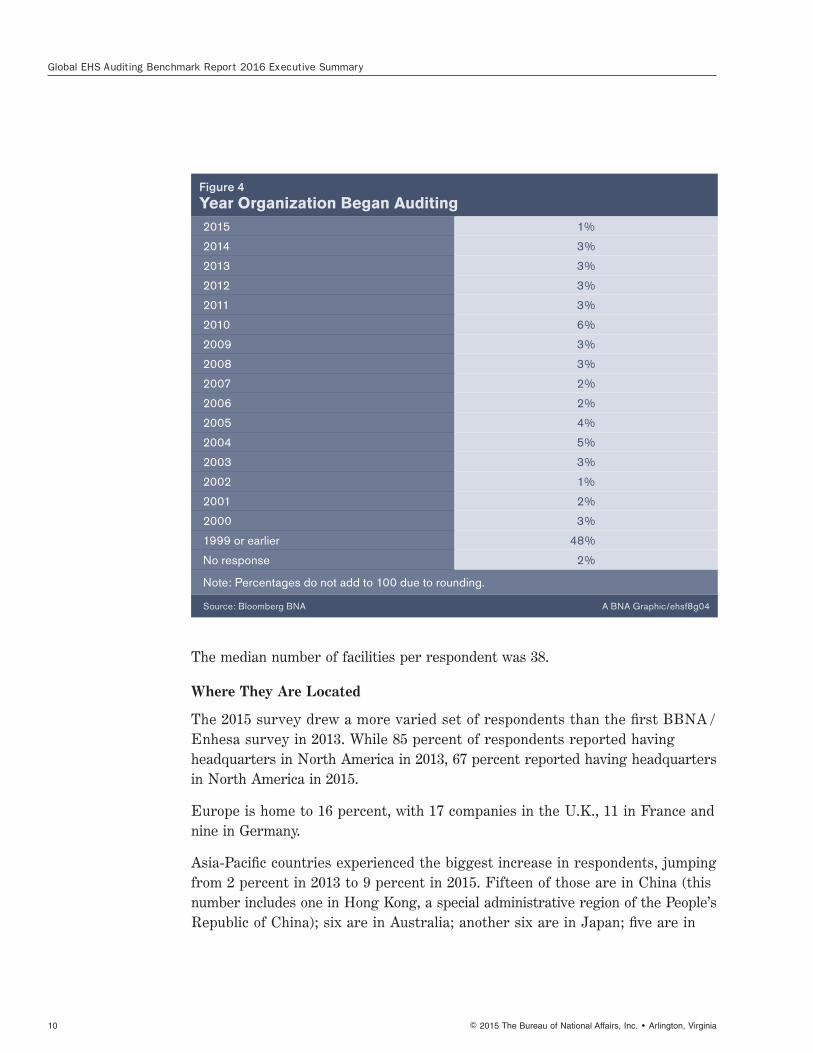
The median number of facilities per respondent was 38.
Where They Are Located
The 2015 survey drew a more varied set of respondents than the first BBNA /Enhesa survey in 2013. While 85 percent of respondents reported havingheadquarters in North America in 2013, 67 percent reported having headquartersin North America in 2015.
Europe is home to 16 percent, with 17 companies in the U.K., 11 in France andnine in Germany.
Asia-Pacific countries experienced the biggest increase in respondents, jumpingfrom 2 percent in 2013 to 9 percent in 2015. Fifteen of those are in China (thisnumber includes one in Hong Kong, a special administrative region of the People’sRepublic of China); six are in Australia; another six are in Japan; five are in
Figure 4Year Organization Began Auditing 2015 1%
2014 3%
2013 3%
2012 3%
2011 3%
2010 6%
2009 3%
2008 3%
2007 2%
2006 2%
2005 4%
2004 5%
2003 3%
2002 1%
2001 2%
2000 3%
1999 or earlier 48%
No response 2%
Note: Percentages do not add to 100 due to rounding.
Source: Bloomberg BNA A BNA Graphic/ehsf8g04
Global EHS Auditing Benchmark Report 2016 Executive Summary
10 � 2015 The Bureau of National Affairs, Inc. • Arlington, Virginia

Singapore; another five are in India; and Fiji, Indonesia, Malaysia, the Philippines,Taiwan and Vietnam are each home to one corporation.
Africa and the Middle East also saw some growth, from less than one-half percentin 2013 to 3 percent in 2015, with three companies based in Kuwait and anotherthree in South Africa.
Latin America (including Mexico) remained roughly the same between 2013 and2015, accounting for 2 percent of companies.
�2015 The Bureau of National Affairs, Inc. • Arlington, Virginia 11
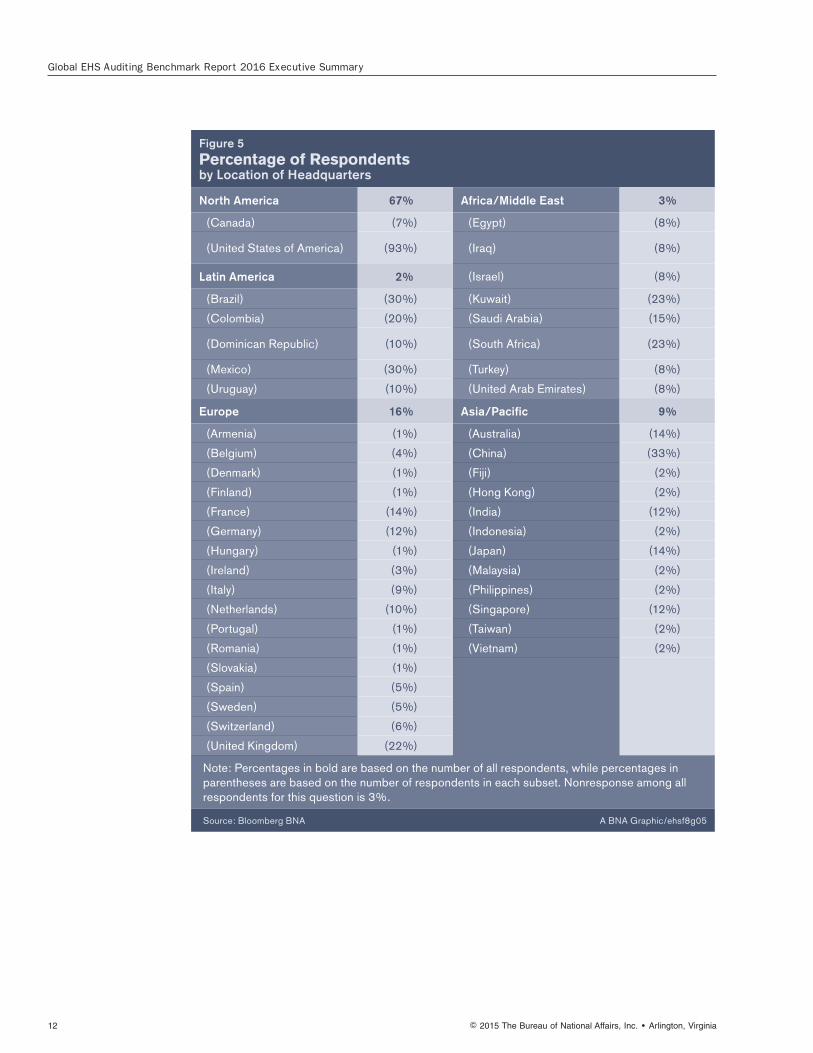
Figure 5Percentage of Respondentsby Location of Headquarters
North America 67% Africa/Middle East 3%
(Canada) (7%) (Egypt) (8%)
(United States of America) (93%) (Iraq) (8%)
Latin America 2% (Israel) (8%)
(Brazil) (30%) (Kuwait) (23%)
(Colombia) (20%) (Saudi Arabia) (15%)
(Dominican Republic) (10%) (South Africa) (23%)
(Mexico) (30%) (Turkey) (8%)
(Uruguay) (10%) (United Arab Emirates) (8%)
Europe 16% Asia/Pacific 9%
(Armenia) (1%) (Australia) (14%)
(Belgium) (4%) (China) (33%)
(Denmark) (1%) (Fiji) (2%)
(Finland) (1%) (Hong Kong) (2%)
(France) (14%) (India) (12%)
(Germany) (12%) (Indonesia) (2%)
(Hungary) (1%) (Japan) (14%)
(Ireland) (3%) (Malaysia) (2%)
(Italy) (9%) (Philippines) (2%)
(Netherlands) (10%) (Singapore) (12%)
(Portugal) (1%) (Taiwan) (2%)
(Romania) (1%) (Vietnam) (2%)
(Slovakia) (1%)
(Spain) (5%)
(Sweden) (5%)
(Switzerland) (6%)
(United Kingdom) (22%)
Note: Percentages in bold are based on the number of all respondents, while percentages in parentheses are based on the number of respondents in each subset. Nonresponse among all respondents for this question is 3%.
Source: Bloomberg BNA A BNA Graphic/ehsf8g05
Global EHS Auditing Benchmark Report 2016 Executive Summary
12 � 2015 The Bureau of National Affairs, Inc. • Arlington, Virginia

Respondents reported having facilities throughout the world, in locationsrepresenting almost every country and political jurisdiction. Although manyreported operating in one country only, many others said they operated in 30 ormore jurisdictions.
Basis and Reasons for Audits
While 88 percent of respondents had said they based their audits on corporateEHS requirements in 2013, this figure jumped to 92 percent in 2015. Conversely,while 95 percent had said they based their EHS requirements on local andnational regulatory standards in 2013, this figure fell to 87 percent in 2015(respondents could choose more than one answer.) In both the 2013 and 2015surveys, many respondents based in Europe and the U.S. cited EU and U.S.regulatory requirements, respectively.
‘‘It is difficult to keep up with regulatory requirements and changes to thoserequirements considering the number of countries we operate in,’’ onerespondent said. Another respondent stated, ‘‘Maintaining ongoing knowledge ofrapidly changing regulatory landscapes can make this difficult. We track not onlytraditional regulatory (HS&E), but also product related issues.’’
Why Organizations Audit
Almost all respondents cited compliance assurance as one of their top overallobjectives in conducting audits. They also cited risk management and corporatereputation as important factors, although fewer respondents cited these objectivesthan in 2013. About 45 percent also mentioned meeting stakeholder expectations,with only a slightly smaller number saying that demonstrating sustainablebehavior was one of their overall objectives. Answers to this question differedaccording to the type of organization and organizational size.
Figure 6 Overall Auditing ObjectivesCompliance assurance
EHS risk management
Maintain or improve company reputation
Meet stakeholder expectations
Demonstrate sustainable behavior
Other
0 10 20 30 40 50 60 70 80 90 100
Note: Multiple responses were accepted.
Source: Bloomberg BNA A BNA Graphic/ehsf8g06
95%
89%
60%
45%
45%
6%
�2015 The Bureau of National Affairs, Inc. • Arlington, Virginia 13
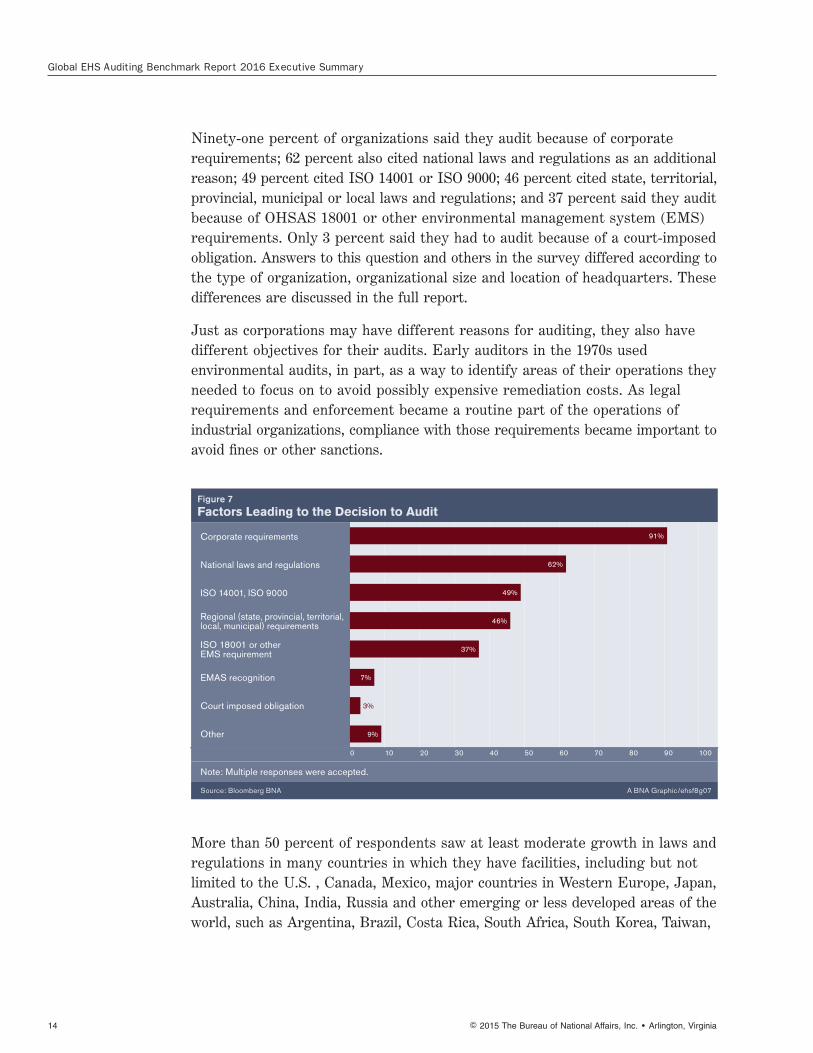
Ninety-one percent of organizations said they audit because of corporaterequirements; 62 percent also cited national laws and regulations as an additionalreason; 49 percent cited ISO 14001 or ISO 9000; 46 percent cited state, territorial,provincial, municipal or local laws and regulations; and 37 percent said they auditbecause of OHSAS 18001 or other environmental management system (EMS)requirements. Only 3 percent said they had to audit because of a court-imposedobligation. Answers to this question and others in the survey differed according tothe type of organization, organizational size and location of headquarters. Thesedifferences are discussed in the full report.
Just as corporations may have different reasons for auditing, they also havedifferent objectives for their audits. Early auditors in the 1970s usedenvironmental audits, in part, as a way to identify areas of their operations theyneeded to focus on to avoid possibly expensive remediation costs. As legalrequirements and enforcement became a routine part of the operations ofindustrial organizations, compliance with those requirements became important toavoid fines or other sanctions.
More than 50 percent of respondents saw at least moderate growth in laws andregulations in many countries in which they have facilities, including but notlimited to the U.S. , Canada, Mexico, major countries in Western Europe, Japan,Australia, China, India, Russia and other emerging or less developed areas of theworld, such as Argentina, Brazil, Costa Rica, South Africa, South Korea, Taiwan,
Figure 7 Factors Leading to the Decision to Audit
Corporate requirements
National laws and regulations
ISO 14001, ISO 9000
Regional (state, provincial, territorial, local, municipal) requirements
ISO 18001 or other EMS requirement
EMAS recognition
Court imposed obligation
Other
0 10 20 30 40 50 60 70 80 90 100
Note: Multiple responses were accepted.
Source: Bloomberg BNA A BNA Graphic/ehsf8g07
91%
62%
49%
46%
37%
7%
9%
3%
Global EHS Auditing Benchmark Report 2016 Executive Summary
14 � 2015 The Bureau of National Affairs, Inc. • Arlington, Virginia
Thailand, Ukraine and the United Arab Emirates. Many respondents in thesejurisdictions also reported at least moderate enforcement activity.
In addition, many reported significant concern over compliance. Of thoserespondents with operations in China, 78 percent said they either were very orextremely concerned about compliance, more so than in any other country.Indeed, 60 percent of those with operations in China said they felt moderately,very or extremely exposed to regulatory or compliance risks, as did an almostequal percentage of those operating in the U.S., as well as half of those withoperations in India and almost half of those in Brazil, Mexico and the U.K.Between 10 percent and 20 percent of respondents in many countries said theywere only slightly prepared or not at all prepared to manage those risks.
Preparing and Conducting an Audit
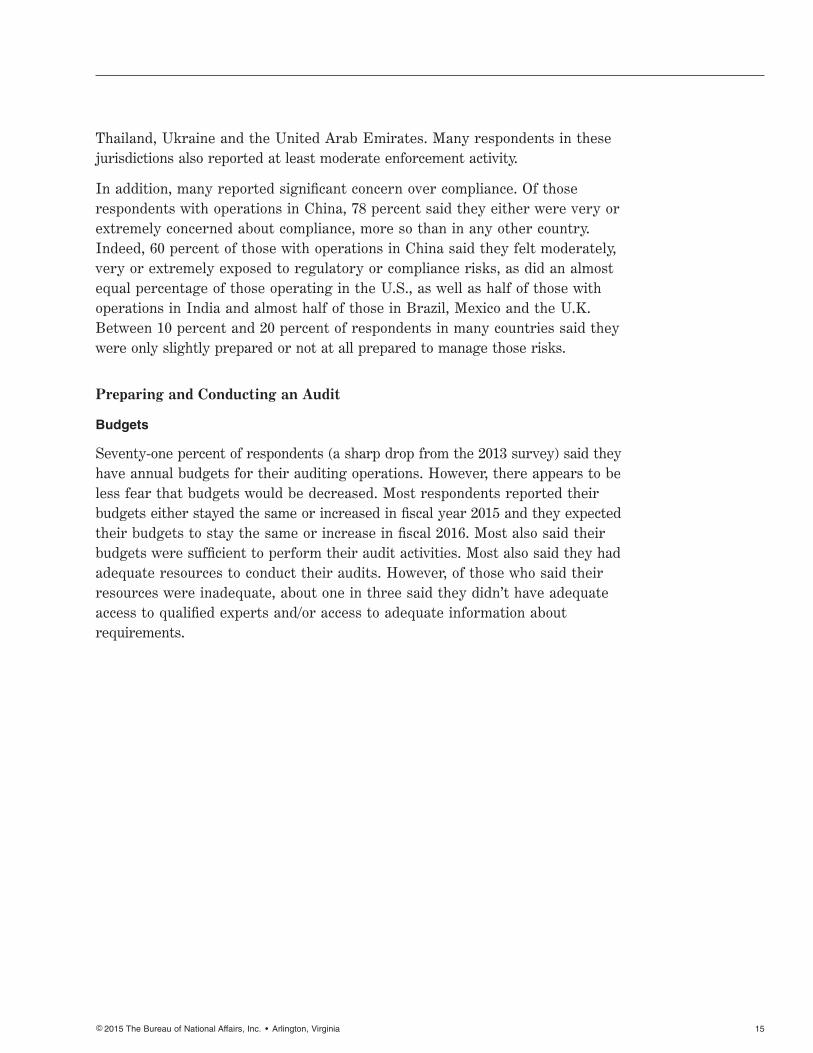
Budgets
Seventy-one percent of respondents (a sharp drop from the 2013 survey) said theyhave annual budgets for their auditing operations. However, there appears to beless fear that budgets would be decreased. Most respondents reported theirbudgets either stayed the same or increased in fiscal year 2015 and they expectedtheir budgets to stay the same or increase in fiscal 2016. Most also said theirbudgets were sufficient to perform their audit activities. Most also said they hadadequate resources to conduct their audits. However, of those who said theirresources were inadequate, about one in three said they didn’t have adequateaccess to qualified experts and/or access to adequate information aboutrequirements.
�2015 The Bureau of National Affairs, Inc. • Arlington, Virginia 15
Figure 8Auditing Budget Change 2014 to 2015
24%
14%
61%
1%
Increased
Stayed the same
Decreased
No response
Note: Percentages are based on the number of respondents who have an annual budget for audits.
Source: Bloomberg BNA A BNA Graphic/ehsf8g08
Figure 9Expected Auditing Budget Change 2015 to 2016
21%12%
1%
8%
58%
Increase
Stay the same
Decrease
Don't know/not sure
No response
Note: Percentages are based on the number of respondents who have an annual budget for audits.
Source: Bloomberg BNA A BNA Graphic/ehsf8g09
Global EHS Auditing Benchmark Report 2016 Executive Summary
16 � 2015 The Bureau of National Affairs, Inc. • Arlington, Virginia

Frequency of Audits
Many factors can affect how often an organization chooses to audit particularfacilities. Such factors include the facility’s age, risk it poses to the environment orworker safety and health, its location and risk of compliance violation. Notsurprisingly, high-risk facilities are audited most frequently, and low-risk facilitiesare audited the least. More than half of respondents said they audit high-riskfacilities annually, while more than 30 percent said they audit low-risk facilitiesless than once every three years. However, more than 40 percent said theyperform a less formal self-assessment of their facilities between regularlyscheduled audits. And more than half said these self-assessments are required atregular intervals. Among respondents with at least 25 facilities in a single country,47 percent of those in the U.S. were audited annually, the highest rate of anyjurisdiction. Other countries with high annual auditing rates included China (31percent), Malaysia (31 percent), Mexico (30 percent), Norway (31 percent) and theU.K. (31 percent).
Figure 10Frequency of Audits by Risk of Facility
High-risk
Medium-risk
Low-risk
0 10 20 30 40 50 60 70 80 90 100
Annually Once every two years Once every three years
Less often than once every three years Not applicable No response
Note: Percentages may not add to 100 due to rounding.
Source: Bloomberg BNA A BNA Graphic/ehsf8g10
52%
31%
24%
22%
23%
13%
16%
31%
23%
9%
31%
8%
5%
6%
2%
2%
3%
1%
Figure 11Frequency of Audits by Type of Nonmanufacturing or Corporately Owned Facility
Offices/warehouses
Retail stores
Supply chain
0 10 20 30 40 50 60 70 80 90 100
Annually Once every two years Once every three years
Less often than once every three years Not applicable No response
Source: Bloomberg BNA A BNA Graphic/ehsf8g11
26%
11%
19%
12%
4%
7%
19%
7%
14%
28%
10%
21%
13%
63%
35%
5%
4%
2%
�2015 The Bureau of National Affairs, Inc. • Arlington, Virginia 17

Conducting the Audit
Almost three-quarters of organizations said their corporate office has chiefresponsibility for EHS audits, with 13 percent saying regional offices and an equalnumber saying local facilities have that obligation. Combined EHS departmentsare mentioned most frequently as the department where the auditing functionsare housed (43 percent), followed by health and safety departments (17 percent),legal departments (9 percent) and environment departments (9 percent). Otherdepartments include audit, risk management, human resources and finance.
The actual audit in most of the organizations who responded tends to beconducted using internal resources, but many respondents reported augmentingthose internal resources with third-party consultancies (45 percent) or trainedexternal auditors (33 percent). This is a big increase over the number ofrespondents who reported using third-party consultancies or external auditors inthe first survey. The reasons for this increase are unknown but can’t be accountedfor solely by the number of organizations who have only recently started to audit,who often have little experience. A possible explanation is that organizationsrecognize the added value these trained external professionals bring in terms ofexperience and training. In addition, more than one-half of respondents said theyuse in-country resources when they audit in foreign countries.
Of those who said that any auditor they use must have professional certificationfrom an organization such as BEAC or IEMA, almost 90 percent said theyrequired their lead auditor to be certified. Of those who said they don’t requirecertification, almost all said their auditors must have at least some specific audittraining and/or pertinent subject-matter knowledge. About two-thirds said theirauditors must have at least three years of experience.
Figure 12 People or Organizations Used to Conduct EHS Audits
Corporate EHS department/staff
Corporate auditing department/staff (internal audits)
Third-party consultancy
Trained external auditor
Other
0 10 20 30 40 50 60 70 80 90 100
Note: Multiple responses were accepted.
Source: Bloomberg BNA A BNA Graphic/ehsf8g12
69%
51%
45%
33%
11%
Global EHS Auditing Benchmark Report 2016 Executive Summary
18 � 2015 The Bureau of National Affairs, Inc. • Arlington, Virginia

Audit Tools
Company-developed EHS audit protocols were used by a majority of respondents(83 percent), up from 59 percent in 2013. However, 24 percent of respondents alsoreported using either custom-developed protocols from auditing consultancies,such as AECOM or Enhesa, while 19 percent reported using off-the-shelfprotocols from providers or vendors, such as AECOM, Enhesa or BloombergBNA.
Most respondents said they perform their audits using some combination ofspreadsheets; paper-based, audit-specific software modules; and handheld devices,such as tablets, PDAs or smart phones. Spreadsheets (Microsoft Excel, forexample) were the most popular tool.
For tracking and managing audit findings and observations, Excel also was themost popular tool. A little over one-third of respondents said they also use anaudit management module in a software system or other commercial off-the-shelfsoftware.
Figure 13 Tools Used to Perform Formal EHS Audits
A corporate EHS audit protocol developed by your organization
Custom audit protocol developed by auditing consultancy (e.g., AECOM, Enhesa)
Local protocols (e.g., country, state, province, municipality)
Off-the shelf audit protocol from provider or vendors (e.g., AECOM, Enhesa)
Other
0 10 20 30 40 50 60 70 80 90 100
Note: Multiple responses were accepted.
Source: Bloomberg BNA A BNA Graphic/ehsf8g13
83%
24%
23%
18%
5%
�2015 The Bureau of National Affairs, Inc. • Arlington, Virginia 19
Audit Findings & Closure
Risk Analysis and Metrics
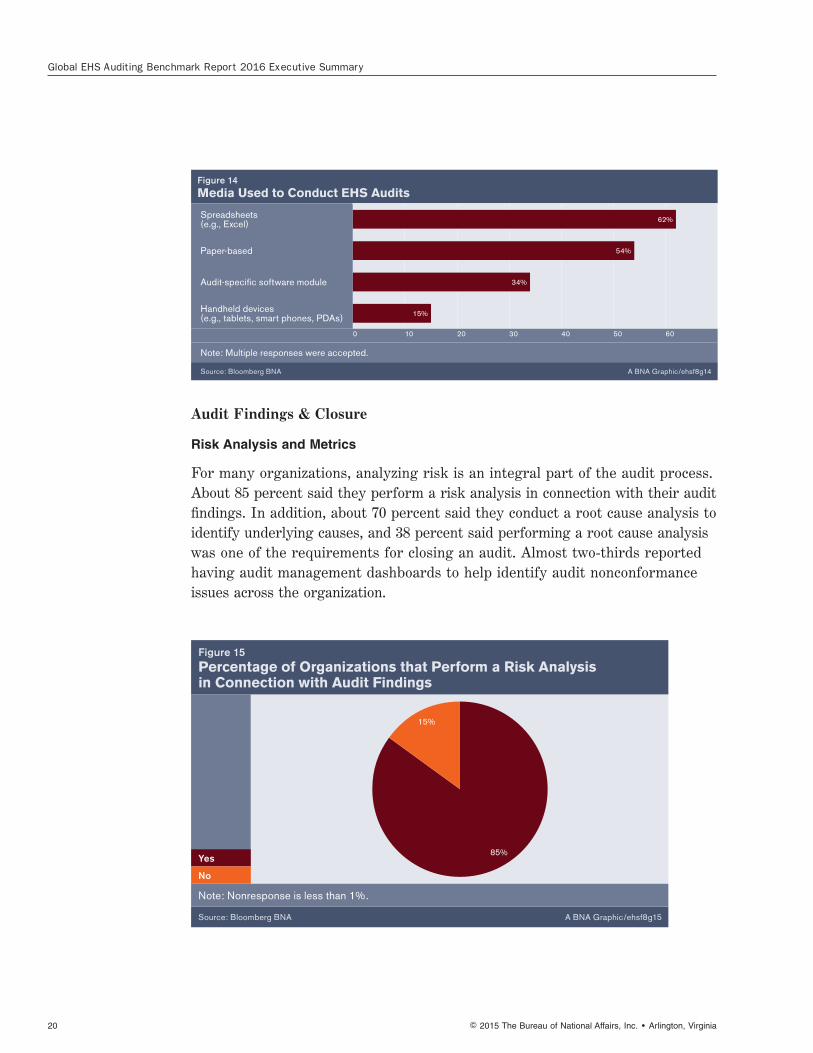
For many organizations, analyzing risk is an integral part of the audit process.About 85 percent said they perform a risk analysis in connection with their auditfindings. In addition, about 70 percent said they conduct a root cause analysis toidentify underlying causes, and 38 percent said performing a root cause analysiswas one of the requirements for closing an audit. Almost two-thirds reportedhaving audit management dashboards to help identify audit nonconformanceissues across the organization.
Figure 14Media Used to Conduct EHS Audits
Spreadsheets (e.g., Excel)
Paper-based
Audit-specific software module
Handheld devices (e.g., tablets, smart phones, PDAs)
0 10 20 30 40 50 60
Note: Multiple responses were accepted.
Source: Bloomberg BNA A BNA Graphic/ehsf8g14
62%
54%
34%
15%
Figure 15Percentage of Organizations that Perform a Risk Analysis in Connection with Audit Findings
85%
15%
Yes
No
Note: Nonresponse is less than 1%.
Source: Bloomberg BNA A BNA Graphic/ehsf8g15
Global EHS Auditing Benchmark Report 2016 Executive Summary
20 � 2015 The Bureau of National Affairs, Inc. • Arlington, Virginia
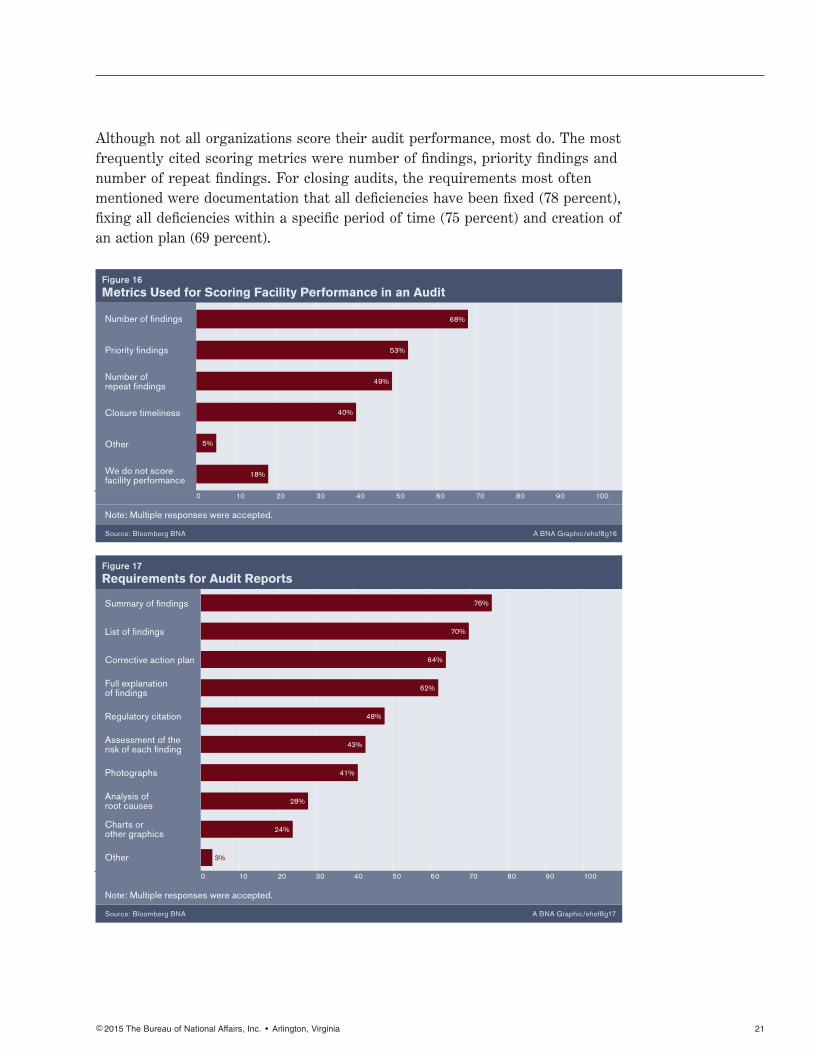
Although not all organizations score their audit performance, most do. The mostfrequently cited scoring metrics were number of findings, priority findings andnumber of repeat findings. For closing audits, the requirements most oftenmentioned were documentation that all deficiencies have been fixed (78 percent),fixing all deficiencies within a specific period of time (75 percent) and creation ofan action plan (69 percent).
Figure 16 Metrics Used for Scoring Facility Performance in an Audit
Number of findings
Priority findings
Number of repeat findings
Closure timeliness
Other
We do not score facility performance
0 10 20 30 40 50 60 70 80 90 100
Note: Multiple responses were accepted.
Source: Bloomberg BNA A BNA Graphic/ehsf8g16
68%
53%
49%
40%
5%
18%
Figure 17Requirements for Audit Reports
Summary of findings
List of findings
Corrective action plan
Full explanation of findings
Regulatory citation
Assessment of the risk of each finding
Photographs
Analysis of root causes
Charts or other graphics
Other
0 10 20 30 40 50 60 70 80 90 100
Note: Multiple responses were accepted.
Source: Bloomberg BNA A BNA Graphic/ehsf8g17
76%
70%
64%
62%
48%
43%
41%
28%
24%
3%
�2015 The Bureau of National Affairs, Inc. • Arlington, Virginia 21
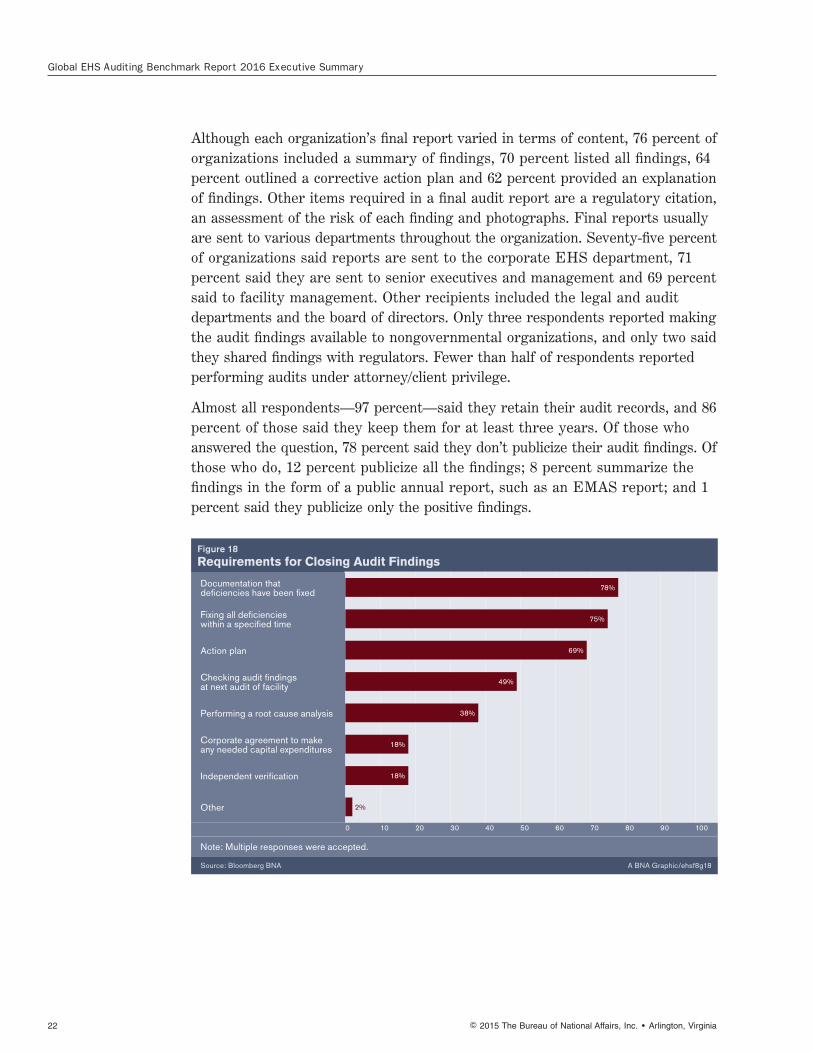
Although each organization’s final report varied in terms of content, 76 percent oforganizations included a summary of findings, 70 percent listed all findings, 64percent outlined a corrective action plan and 62 percent provided an explanationof findings. Other items required in a final audit report are a regulatory citation,an assessment of the risk of each finding and photographs. Final reports usuallyare sent to various departments throughout the organization. Seventy-five percentof organizations said reports are sent to the corporate EHS department, 71percent said they are sent to senior executives and management and 69 percentsaid to facility management. Other recipients included the legal and auditdepartments and the board of directors. Only three respondents reported makingthe audit findings available to nongovernmental organizations, and only two saidthey shared findings with regulators. Fewer than half of respondents reportedperforming audits under attorney/client privilege.
Almost all respondents—97 percent—said they retain their audit records, and 86percent of those said they keep them for at least three years. Of those whoanswered the question, 78 percent said they don’t publicize their audit findings. Ofthose who do, 12 percent publicize all the findings; 8 percent summarize thefindings in the form of a public annual report, such as an EMAS report; and 1percent said they publicize only the positive findings.
Figure 18Requirements for Closing Audit Findings
Documentation that deficiencies have been fixed
Fixing all deficiencies within a specified time
Action plan
Checking audit findings at next audit of facility
Performing a root cause analysis
Corporate agreement to make any needed capital expenditures
Independent verification
Other
0 10 20 30 40 50 60 70 80 90 100
Note: Multiple responses were accepted.
Source: Bloomberg BNA A BNA Graphic/ehsf8g18
78%
75%
69%
49%
38%
18%
18%
2%
Global EHS Auditing Benchmark Report 2016 Executive Summary
22 � 2015 The Bureau of National Affairs, Inc. • Arlington, Virginia
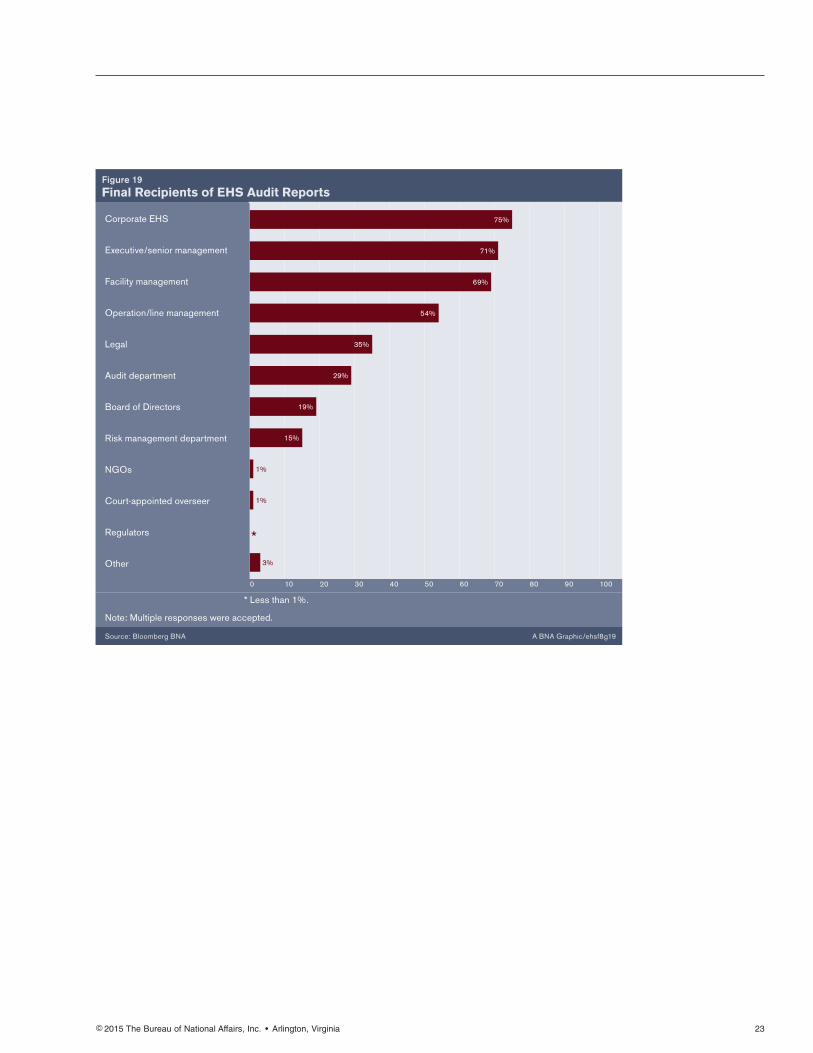
Figure 19Final Recipients of EHS Audit Reports
Corporate EHS
Executive/senior management
Facility management
Operation/line management
Legal
Audit department
Board of Directors
Risk management department
NGOs
Court-appointed overseer
Regulators
Other
0 10 20 30 40 50 60 70 80 90 100
* Less than 1%.
Note: Multiple responses were accepted.
Source: Bloomberg BNA A BNA Graphic/ehsf8g19
75%
71%
69%
54%
35%
29%
19%
15%
1%
1%
3%
*
�2015 The Bureau of National Affairs, Inc. • Arlington, Virginia 23
Conclusion
This second Bloomberg BNA and Enhesa report, Global EHS AuditingBenchmark Report 2016, produced with the help of the Auditing Roundtable,shows the practice of EHS and related auditing continues to evolve, even morethan 40 years since it began in the 1970s. Indeed, jurisdictions around the worldare paying increasing attention to the ecological and human health consequencesof manufacturing, mineral extraction and development and other industrialoperations located within their borders. This is making the job of the EHS auditoreven more challenging. As this report shows, corporate EHS directors andmanagers continue to strive to find new ways to improve and bring success totheir auditing programs.
The full report looks at the results of all of the questions in the survey in greaterdetail and provides additional insights, graphics and analysis of the issuesdiscussed in this Executive Summary. The answers to many of the questions inthe survey differed according to the type of organization, organizational size andlocation of headquarters. These differences are discussed in the full report.
Global EHS Auditing Benchmark Report 2016 Executive Summary
24 � 2015 The Bureau of National Affairs, Inc. • Arlington, Virginia


About Bloomberg BNABloomberg BNA, a wholly-owned subsidiary of Bloomberg L.P., is a leading source of Environment, Health & Safety legal, regulatory, and business information for professionals. Bloomberg BNA’s collection of EHS solutions enable organizations to effectively manage all phases of EHS compliance – from regulatory monitoring and tracking to training, audits, self-assessments, and corrective action. Bloomberg BNA’s services allow users to track environment, health, and safety laws, regulations, policies, court decisions, and trends at the federal, state, and international levels. Our EHS solutions deliver information in a customizable format to meet the unique needs of organizations.
About EnhesaEnhesa is the market leader in global environmental, health, safety, and product compliance assurance providing support to businesses worldwide.
Enhesa is headquartered in Brussels with fully-staffed offices in Washington, DC and Tokyo, and a network of consultants covering all parts of the globe. Enhesa is a team of dynamic, highly trained and experienced, multilingual consultants with in-depth knowledge of regulatory and policy issues and actors at global, regional, national, and local levels. They provide strategic information and guidance on current and emerging laws, regulations, standards, and industry initiatives.
Our projects have addressed current and emerging regulatory obligations in over 200 countries around the globe, including the whole of the European Union and its member states, throughout Central and Eastern Europe, Africa, Asia and the Pacific Basin, and North and South America. Our strength lies in extensive and flexible research and consulting resources around the world. For more information, email [email protected].
About the Auditing RoundtableThe Auditing Roundtable is a professional organization dedicated to the development and professional practice of environmental, health, and safety (EHS) auditing.
The Roundtable represents the voice of the profession with more than 600 members. Its mission is to enhance the practice of EHS auditing by creating a national forum and organization to advance ideas, procedures, and member interaction.
As of January 2016, The Auditing Roundtable will merge with the Institute of Internal Auditors (IIA) to create a dedicated EHS Audit Center, open to the IIA’s 180,000 worldwide members. The IIA will continue to offer Board of Environmental, Health & Safety Auditor Certifications (BEAC), which the Auditing Roundtable and IIA have jointly overseen since 1997, to the EHS auditing community.
1801 S. Bell Street Arlington, VA 22202
800.372.1033
bna.com
0815-JO16147 09-8625 © 2015 The Bureau of National Affairs, Inc.