global forest resources assessment (fra) 2020 hungary - report
TRANSCRIPT

Report
Hungary
Rome, 2020

FRA 2020 report, Hungary
2
FAO has been monitoring the world's forests at 5 to 10 year intervals since 1946. The Global Forest Resources Assessments (FRA) are now produced every five years in an attempt to provide a consistent approach todescribing the world's forests and how they are changing. The FRA is a country-driven process and the assessments are based on reports prepared by officially nominated National Correspondents. If a report is notavailable, the FRA Secretariat prepares a desk study using earlier reports, existing information and/or remote sensing based analysis.
This document was generated automatically using the report made available as a contribution to the FAO Global Forest Resources Assessment 2020, and submitted to FAO as an official government document. Thecontent and the views expressed in this report are the responsibility of the entity submitting the report to FAO. FAO cannot be held responsible for any use made of the information contained in this document.

FRA 2020 report, Hungary
3
TABLE OF CONTENTS
Introduction
1. Forest extent, characteristics and changes
2. Forest growing stock, biomass and carbon
3. Forest designation and management
4. Forest ownership and management rights
5. Forest disturbances
6. Forest policy and legislation
7. Employment, education and NWFP
8. Sustainable Development Goal 15

FRA 2020 report, Hungary
4
IntroductionReport preparation and contact personsThe present report was prepared by the following person(s)
Name Role Email Tables
Introductory textIn the Hungarian statistics on forest area (area under forest management plans) “forest” includes many area actually not covered by stands but closely related to forest management, like roads, clearings, forest glades, nurseries etc. In the nationalstatistics they are categorised to forest areas.
These areas do not have many attributes that international statistical queries require. In MCPFE 2007, seeing its definitions, we used a sophisticated method to proportionately calculate many attributes to the whole forest area, but on the long runit is not practical by consistency reasons.
In the FRA 2010, FRA 2015, as well as in the present submission we followed the traditional FRA methodology and omitted these re-calculations.
András Szepesi National correspondent [email protected] All
Eszter Szabó Collaborator [email protected] All
Judit Szakálas Collaborator [email protected] All
Tamás Tobisch Collaborator [email protected] All

FRA 2020 report, Hungary
5
1 Forest extent, characteristics and changes1a Extent of forest and other wooded landNational data
Data sources
Classifications and definitions
1990
References
Methods used
Additional comments
Other (specify in comments)
Stand inventory
2000
References
Methods used
Additional comments
Other (specify in comments)
Stand inventory
2005
References
Methods used
Additional comments
Other (specify in comments)
Stand inventory
2010
References
Methods used
Additional comments
Other (specify in comments)
Stand inventory
2015
References
Methods used
Additional comments
Other (specify in comments)
Stand inventory
1990
National class Definition
Forest
Other Wooded Land

FRA 2020 report, Hungary
6
Original data and reclassification
2000
National class Definition
Forest
Other Wooded Land
2005
National class Definition
Forest
Other Wooded Land
2010
National class Definition
Forest
Other Wooded Land
2015
National class Definition
Forest
Other Wooded Land
1990
Classifications and definitions FRA classes
Class Area (1000 ha) Forest Other wooded land Other land
Forest
Other Wooded Land
Total
1 813.90 100.00 % 0.00 % 0.00 %
0.00 0.00 % 100.00 % 0.00 %
1 813.90 1 813.90 0.00 0.00
2000
Classifications and definitions FRA classes
Class Area (1000 ha) Forest Other wooded land Other land
Forest
Other Wooded Land
Total
1 921.17 100.00 % 0.00 % 0.00 %
0.00 0.00 % 100.00 % 0.00 %
1 921.17 1 921.17 0.00 0.00
2005 Classifications and definitions FRA classes
Class Area (1000 ha) Forest Other wooded land Other land

FRA 2020 report, Hungary
7
Forest
Other Wooded Land
Total
1 983.90 100.00 % 0.00 % 0.00 %
0.00 0.00 % 100.00 % 0.00 %
1 983.90 1 983.90 0.00 0.00
2010
Classifications and definitions FRA classes
Class Area (1000 ha) Forest Other wooded land Other land
Forest
Other Wooded Land
Total
2 046.39 100.00 % 0.00 % 0.00 %
0.00 0.00 % 100.00 % 0.00 %
2 046.39 2 046.39 0.00 0.00
2015
Classifications and definitions FRA classes
Class Area (1000 ha) Forest Other wooded land Other land
Forest
Other Wooded Land
Total
2 060.82 100.00 % 0.00 % 0.00 %
153.00 0.00 % 100.00 % 0.00 %
2 213.82 2 060.82 153.00 0.00

FRA 2020 report, Hungary
8
Forest Other wooded land1000 ha
0
500
1 000
1 500
2 000
1990 1995 2000 2005 2010 2015 2020

FRA 2020 report, Hungary
9
CommentsForest areas 1990, 2000 and 2005 were corrected (the last one was a forecasted area based on former afforestation rates; however, afforestation activites decreased) in order to harmonize these statistics with those of the Greenhouse GasInventory.
Forest is defined as land spanning more than 0.5 hectares with trees higher than five meters and a canopy cover of more than 30 percent, or trees able to reach these thresholds, in situ. It does not include land that is predominantly underagricultural or urban land use, but in addition to areas covered by trees, it includes roads and other areas that have no tree cover but are under forest management.
Other wooded land comprises land spanning more than 0.5 hectares:
- with trees higher than 5 meters and a canopy cover between 5-10 percent, or trees able to reach these thresholds in situ and
- with the combined canopy cover of trees and shrubs over 10%.
Forest area data come from the National Forest Database. OWL data are taken from the Hungarian National Forest Inventory.
FRA categoriesArea (1000 ha)
1990 2000 2010 2015 2016 2017 2018 2019 2020
Forest (a)
Other wooded land (a)
Other land (c-a-b)
Total land area (c)
The FAOSTAT land area figurefor the year 2015 is used for allreference years
1 813.90 1 921.17 2 046.39 2 060.82 2 058.73 2 057.27 2 055.92 2 054.47 2 053.01
0.00 0.00 0.00 153.00 163.80 173.00 182.10 191.30 200.00
7 239.10 7 131.83 7 006.61 6 839.18 6 830.47 6 822.73 6 814.98 6 807.23 6 799.99
9 053.00 9 053.00 9 053.00 9 053.00 9 053.00 9 053.00 9 053.00 9 053.00 9 053.00
Climatic domain % of forest area 2015 Override value
Boreal
Temperate
Sub-tropical
Tropical
0.00
100.00
0.00
0.00

FRA 2020 report, Hungary
10
1b Forest characteristicsNational data
Data sources
Classifications and definitions
1990
References
Methods used
Additional comments
Other (specify in comments)
Stand inventory
2000
References
Methods used
Additional comments
Other (specify in comments)
Stand inventory
2005
References
Methods used
Additional comments
Other (specify in comments)
Stand inventory
2010
References
Methods used
Additional comments
Other (specify in comments)
Stand inventory
2015
References
Methods used
Additional comments
Other (specify in comments)
Stand inventory
1990
National class Definition
Forest
Other Wooded Land

FRA 2020 report, Hungary
11
Original data and reclassification
2000 National class Definition
Forest
Other Wooded Land
2005
National class Definition
Forest
Other Wooded Land
2010
National class Definition
Forest
Other Wooded Land
2015
National class Definition
Forest
Other Wooded Land
1990
Classifications and definitions FRA classes
Class Area (1000 ha) Naturally regenerating forest Plantation forest Other planted forest
Forest
Total
1 813.90 % % %
1 813.90 − − −
2000
Classifications and definitions FRA classes
Class Area (1000 ha) Naturally regenerating forest Plantation forest Other planted forest
Forest
Total
1 921.17 % % %
1 921.17 − − −
2005
Classifications and definitions FRA classes
Class Area (1000 ha) Naturally regenerating forest Plantation forest Other planted forest
Forest
Total
1 983.90 63.42 % 7.71 % 28.87 %
1 983.90 1 258.19 152.96 572.75
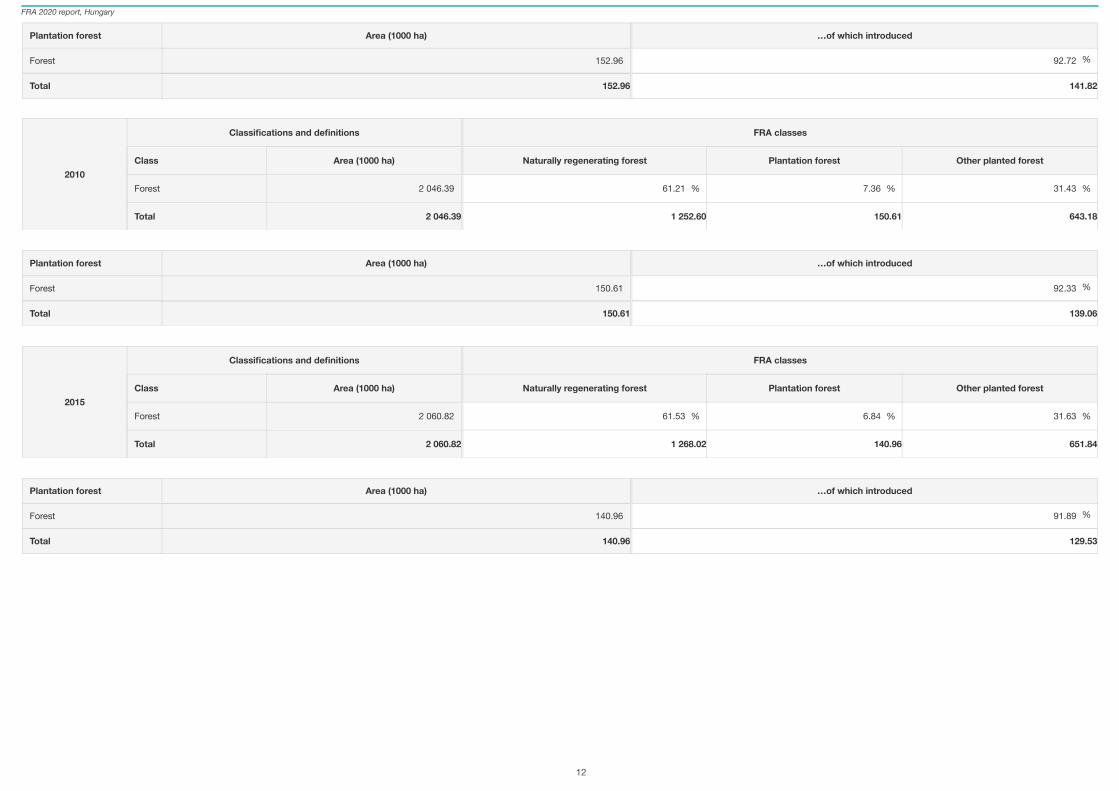
FRA 2020 report, Hungary
12
Plantation forest Area (1000 ha) …of which introduced
Forest
Total
152.96 92.72 %
152.96 141.82
2010
Classifications and definitions FRA classes
Class Area (1000 ha) Naturally regenerating forest Plantation forest Other planted forest
Forest
Total
2 046.39 61.21 % 7.36 % 31.43 %
2 046.39 1 252.60 150.61 643.18
Plantation forest Area (1000 ha) …of which introduced
Forest
Total
150.61 92.33 %
150.61 139.06
2015
Classifications and definitions FRA classes
Class Area (1000 ha) Naturally regenerating forest Plantation forest Other planted forest
Forest
Total
2 060.82 61.53 % 6.84 % 31.63 %
2 060.82 1 268.02 140.96 651.84
Plantation forest Area (1000 ha) …of which introduced
Forest
Total
140.96 91.89 %
140.96 129.53

FRA 2020 report, Hungary
13
Naturally regenerating forest Plantation forest Other planted forest1000 ha
0
200
400
600
800
1 000
1 200
2010 2015 2020

FRA 2020 report, Hungary
14
CommentsNote that it was not possible to type numeric values directly. That is the reason for the small differences if comparing with the corresponding SOEF table (4.2a).
If regeneration type was not known directly, species composition and origin (seed/coppice) were used to distinguish naturally from artifically-regenerated stands. Coppices and all other stands for which artificial regeneration could not be provedwere regarded as natural regeneration. Area of stands with unkown origin decreased from 567 to 455 thousand hectares between 2005 and 2017.
Planted forests comprise the following areas: 1.) area of known afforestations2.) area of known artificial regeneration3.) total area of hybrid poplar and hybrid willow stands4.) total area of regular wide-spacing stands5.) cutting area where regeneration process has not been started6.) area of seed-originated black locust, willow, alder and coniferous stands.
FRA categoriesForest area (1000 ha)
1990 2000 2010 2015 2016 2017 2018 2019 2020
Naturally regenerating forest(a)
Planted forest (b)
Plantation forest
…of which introduced species
Other planted forest
Total (a+b)
Total forest area
1 252.60 1 268.02 1 269.08 1 269.91 1 265.06 1 264.65 1 264.23
− − 793.79 792.80 789.66 787.36 790.86 789.82 788.78
150.61 140.96 137.45 135.35 134.16 132.06 129.97
139.06 129.53 126.79 124.69 122.92 120.87 118.83
643.18 651.84 652.21 652.01 656.70 657.76 658.81
− − 2 046.39 2 060.82 2 058.74 2 057.27 2 055.92 2 054.47 2 053.01
1 813.90 1 921.17 2 046.39 2 060.82 2 058.73 2 057.27 2 055.92 2 054.47 2 053.01

FRA 2020 report, Hungary
15
1c Primary forest and special forest categoriesNational Data
Data sources + type of data source eg NFI, etcNational Forest Database
National classification and definitionsTemporarily unstoced and/or recently regenerated areas comprise those areas where:
1.) final cutting was carried out but the regeneration was not completed; a regeneration process can be regarded as completed if:
species composition is within the limits as requested by the forest management planan even distribution of trees over the entire areahealthy tree individuals overallthe number of trees with main shoots is more than a species-specific minimum value, usually between four and eight thousand trees per hectareno invasive tree species is widespread in the standminimum height of the main species reaches 1 m (for sessile and pubescent oak) or 1.5 m
2.) afforestation was started but not completed; afforestation can be regarded as completed if:
species composition is in accordance with the afforestation planan even distribution of trees over the entire areahealthy tree individuals overallthe number of trees with main shoots reaches that prescribed in the afforesation planminimum height of the main species reaches 1.5 m
Original data-
Analysis and processing of national data
Estimation and forecastingLinear extrapolation was done from data of 2016 and 2017
Reclassification into FRA 2020 categories-

FRA 2020 report, Hungary
16
Comments
FRA categoriesArea (1000 ha)
1990 2000 2010 2015 2020
Primary forest
Temporarily unstocked and/orrecently regenerated
Bamboos
Mangroves
Rubber wood
0.00 0.00 0.00 0.00 0.00
206.08 167.40 186.88 214.60 194.33
0.00 0.00 0.00 0.00 0.00
0.00 0.00 0.00 0.00 0.00
0.00 0.00 0.00 0.00 0.00

FRA 2020 report, Hungary
17
1d Annual forest expansion, deforestation and net changeNational Data
Data sources + type of data source eg NFI, etcNational Forest Database (which is a standwise database storing data obtained by forest planning and inspection)
National classification and definitionsAfforestation areas are areas where afforestation was carried out (started) in the given year.
Natural expansion was recorded during forest planning. Spatial comparisons of forest subcompartment polygons were also applied.
Original data
year total forest afforestation natural expansion deforestation
1990 1813902 6494 6586 613
1991 1825404 6334 6985 1817
1992 1838339 6739 7644 1447
1993 1846338 3045 5283 329
1994 1852141 2713 3308 218
1995 1861421 3946 5692 358
1996 1871746 6240 4701 617
1997 1883569 7854 4492 522
1998 1893962 7745 3050 402
1999 1907512 8219 6778 1447
2000 1921170 9242 5602 1187
2001 1936944 12402 4670 1297
2002 1955180 14001 6091 1856
2003 1967573 11342 2303 1252
2004 1975690 7150 2353 1387
2005 1983896 7228 1836 859
2006 1998887 13206 3112 1327
2007 2019194 17888 3772 1353
2008 2030830 7220 5567 1152
2009 2039347 3518 6489 1490
2010 2046394 6261 3138 2351
2011 2050662 1647 4224 1604
2012 2055632 1164 5520 1713
FRA 2020 report, Hungary
18
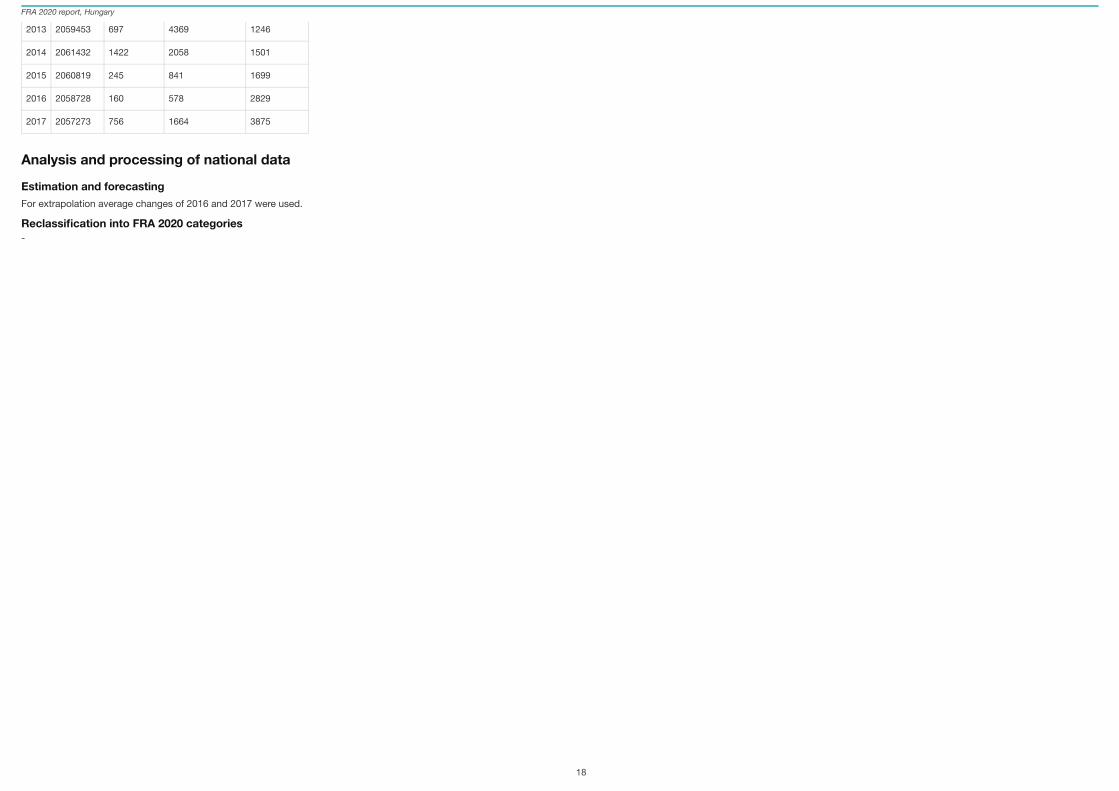
2013 2059453 697 4369 1246
2014 2061432 1422 2058 1501
2015 2060819 245 841 1699
2016 2058728 160 578 2829
2017 2057273 756 1664 3875
Analysis and processing of national data
Estimation and forecastingFor extrapolation average changes of 2016 and 2017 were used.
Reclassification into FRA 2020 categories-

FRA 2020 report, Hungary
19
CommentsIt is important to note that forest area decrease is not a real progress but merely the consequence of changes in the Hungarian forest law.
Due to changes in the Hungarian forest law in 2017 some areas which had been classified formerly as forest can be reclassified and considered as ‘not forest’ (or a special forest category where management is not planned by the state). Forestmanagers should apply for such a change.
FRA categoriesArea (1000 ha/year)
1990-2000 2000-2010 2010-2015 2015-2020
Forest expansion (a)
…of which afforestation
…of which natural expansion
Deforestation (b)
Forest area net change (a-b)
11.56 13.95 4.44 1.58
6.21 10.02 1.03 0.46
5.35 3.93 3.40 1.12
0.83 1.43 1.55 3.14
10.73 12.52 2.89 -1.56

FRA 2020 report, Hungary
20
1e Annual reforestationNational Data
Data sources + type of data source eg NFI, etcNational Forest Database
National classification and definitionsThe statistics reflect the start of the regeneration process. After 2009 area of natural regeneration is underestimated due to changes in the forest law. Before, forest law defined those stand attributes (number of seedlings, species compositon etc.)which were necessary for starting officially the natural regeneration process. Thus, an exact area number could be achieved since forest authority recorded all such areas. After 2009, in case of shelterwood and selective cuttings these areas werenot recorded any more. An approximate estimate was done which based on harvesting areas of shelterwood cutting. However, this method underestimated real areas.Note that coppices cannot be classified accoring to origin: whether it had beenplanted formerly or not.
Original data-
Analysis and processing of national data
Estimation and forecastingAverage reforestation rate of 2016 and 2017 was used for extrapolation
Reclassification into FRA 2020 categories-

FRA 2020 report, Hungary
21
CommentsReforestation areas comprise only to the artificial regeneration following FRA 2020 definition. These areas have been corrected since the last submission (because of typing errors).
FRA categoriesArea (1000 ha/year)
1990-2000 2000-2010 2010-2015 2015-2020
Reforestation 10.55 9.98 8.78 9.06
FRA 2020 report, Hungary
22
1f Other land with tree coverNational Data
Data sources + type of data source eg NFI, etcCentral Statistical Office
National classification and definitionsStatistics reflect area of orchards based on sampling data. Note that formerly orchard areas were estimated from land use statistics and not from estimated areas of orchards themselves which were assessed by sample-based studies. For 2010 nosample-based data are available.
Original data-
Analysis and processing of national data
Estimation and forecasting-
Reclassification into FRA 2020 categories-
FRA 2020 report, Hungary
23
Comments
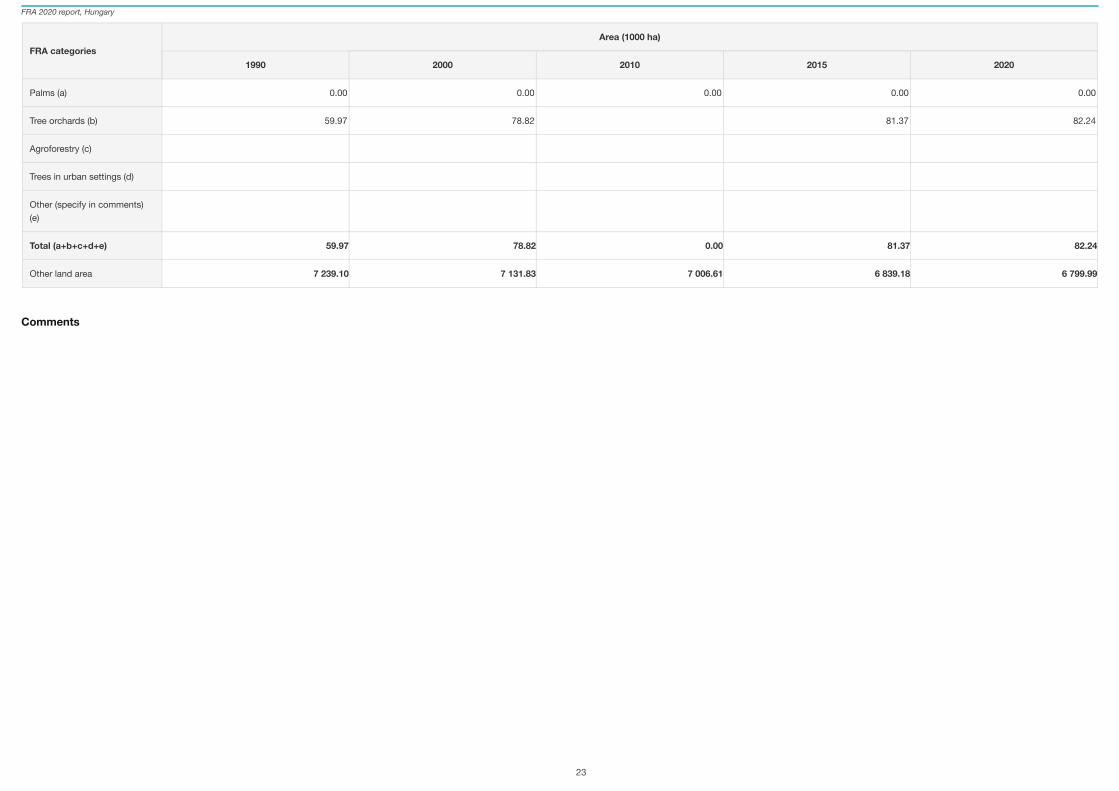
FRA categoriesArea (1000 ha)
1990 2000 2010 2015 2020
Palms (a)
Tree orchards (b)
Agroforestry (c)
Trees in urban settings (d)
Other (specify in comments)(e)
Total (a+b+c+d+e)
Other land area
0.00 0.00 0.00 0.00 0.00
59.97 78.82 81.37 82.24
59.97 78.82 0.00 81.37 82.24
7 239.10 7 131.83 7 006.61 6 839.18 6 799.99

FRA 2020 report, Hungary
24
2 Forest growing stock, biomass and carbon2a Growing stockNational Data
Data sources + type of data source eg NFI, etcNational Forest Database
National classification and definitionsIf regeneration type was not known directly, species composition and origin (seed/coppice) were used to distinguish naturally from artifically-regenerated stands. Coppices and all other stands for which artificial regeneration could not be provedwere regarded as natural regeneration. Growing stock of stands with unknown origin decreased from 134 to 127 million m3 between 2005 and 2017.
Planted forests comprise the following areas: 1.) area of known afforestations2.) area of known artificial regeneration3.) total area of hybrid poplar and hybrid willow stands4.) total area of regular wide-spacing stands5.) cutting area where regeneration process has not been sarted6.) area of seed-originated black locust, willow, alder and coniferous stands
Original data-
Analysis and processing of national data
Estimation and forecastingLinear extrapolation
Reclassification into FRA 2020 categories-

FRA 2020 report, Hungary
25
Comments
FRA categoriesGrowing stock m³/ha (over bark)
1990 2000 2010 2015 2016 2017 2018 2019 2020
Naturally regenerating forest
Planted forest
…of which plantation forest
…of which other planted forest
Forest
Other wooded land
199.51 204.75 205.90 207.73 208.88 210.32 211.83
137.44 149.98 152.72 155.20 158.13 160.95 163.78
114.86 128.41 134.59 138.16 142.89 147.21 151.73
142.73 154.64 156.54 158.74 161.25 163.71 166.16
160.36 169.90 175.44 183.68 185.50 187.63 189.36 191.34 193.39
FRA categoriesTotal growing stock (million m³ over bark)
1990 2000 2010 2015 2016 2017 2018 2019 2020
Naturally regenerating forest
Planted forest
…of which plantation forest
…of which other planted forest
Forest
Other wooded land
249.91 259.63 261.30 263.80 264.24 265.98 267.80
109.10 118.90 120.60 122.20 125.06 127.12 129.19
17.30 18.10 18.50 18.70 19.17 19.44 19.72
91.80 100.80 102.10 103.50 105.89 107.68 109.47
290.88 326.41 359.01 378.53 381.90 386.00 389.30 393.10 397.03

FRA 2020 report, Hungary
26
2b Growing stock compositionNational Data
Data sources + type of data source eg NFI, etcNational Forest Database
National classification and definitions-
Original data-
Analysis and processing of national data
Estimation and forecastingLinear extrapolation
Reclassification into FRA 2020 categories-

FRA 2020 report, Hungary
27
FRA categories Scientific name Common nameGrowing stock in forest (million m³ over bark)
1990 2000 2010 2015 2020
Native tree species
#1 Ranked in terms of volume
#2 Ranked in terms of volume
#3 Ranked in terms of volume
#4 Ranked in terms of volume
#5 Ranked in terms of volume
#6 Ranked in terms of volume
#7 Ranked in terms of volume
#8 Ranked in terms of volume
#9 Ranked in terms of volume
#10 Ranked in terms ofvolume
Remaining native tree species
Total volume of native tree species
Introduced tree species
#1 Ranked in terms of volume
#2 Ranked in terms of volume
#3 Ranked in terms of volume
Quercus cerris
Turkey oak 38.53 42.51 45.21 47.15 48.88
Quercus petraea Sessile oak 45.27 46.33 45.29 45.73 45.67
Fagus sylvatica Beech 36.97 39.11 39.40 40.23 40.51
Pinus sylvestris Scots pine 28.11 32.71 34.69 35.34 35.65
Quercus robur Pedunculate oak 29.96 30.76 32.57 35.08 36.96
Carpinus betulus Hornbeam 17.22 17.79 17.27 17.51 17.69
Populus x canescens Grey poplar 3.37 5.55 8.53 10.90 13.07
Alnus glutinosa Common alder 6.47 8.49 10.30 10.89 11.58
Fraxinus excelsior Common ash 5.46 6.08 6.72 6.83 6.97
Picea abies Norway spruce 4.13 5.09 5.65 5.16 5.04
13.97 20.53 25.83 29.23 32.62
229.46 254.95 271.46 284.05 294.64
Robinia pseudoacacia Black locust 34.53 39.30 48.08 52.29 56.02
Populus x euramericana Hybrid poplar 13.02 12.84 15.83 16.40 18.26
Pinus nigra Black pine 8.61 11.04 11.90 11.91 12.02

FRA 2020 report, Hungary
28
CommentsA species was regarded as introduced if it does not occur naturally within the country borders. Note that formerly - due to the definition of SOEF 2015 - a different definition was applied: natural dispersion of a species was analyzed on a within-country scale.
Growing stock volumes have been slightly modified since the last submission in order to harmonize them with Greenhouse Gas Inventory.
FRA categories Scientific name Common nameGrowing stock in forest (million m³ over bark)
1990 2000 2010 2015 2020
Native tree species
#4 Ranked in terms of volume
#5 Ranked in terms of volume
Remaining introduced tree species
Total volume of introduced tree species
Total growing stock
Quercus rubra Red oak 1.39 2.74 4.21 5.00 5.78
Fraxinus pennsylvanica Green ash 1.07 1.34 1.52 1.71 1.78
2.79 4.20 6.01 7.18 8.36
61.41 71.46 87.55 94.49 102.22
290.87 326.41 359.01 378.54 396.86

FRA 2020 report, Hungary
29
2c Biomass stockNational Data
Data sources + type of data source eg NFI, etcAbove- and below-ground biomasses were calculated from growing stock using methods applied in the Hungarian Greenhouse Gas (GHG) Inventory (NIR) available online at:
https://unfccc.int/process/transparency-and-reporting/reporting-and-review-under-the-convention/greenhouse-gas-inventories-annex-i-parties/national-inventory-submissions-2018
Deadwood data were taken from the Hungarian National Forest Inventory and processed by methods described in the Hungarian NIR.
National classification and definitionsThreshold values for deadwood sampling were:
Minimum height of standing deadwood reported (m): 1.3 m
Minimum diameter of standing deadwood reported (cm): 7
Is volume above ground (AG) or above stump (AS)? AS
Minimum length of lying deadwood reported (m): 1
Minimum diameter of lying deadwood reported (cm): 10
From sampling data deadwood volume was modeled by tree stand type and age as described in the GHG Inventory
Original data-
Analysis and processing of national data
Estimation and forecasting-
Reclassification into FRA 2020 categories-
FRA 2020 report, Hungary
30
Comments
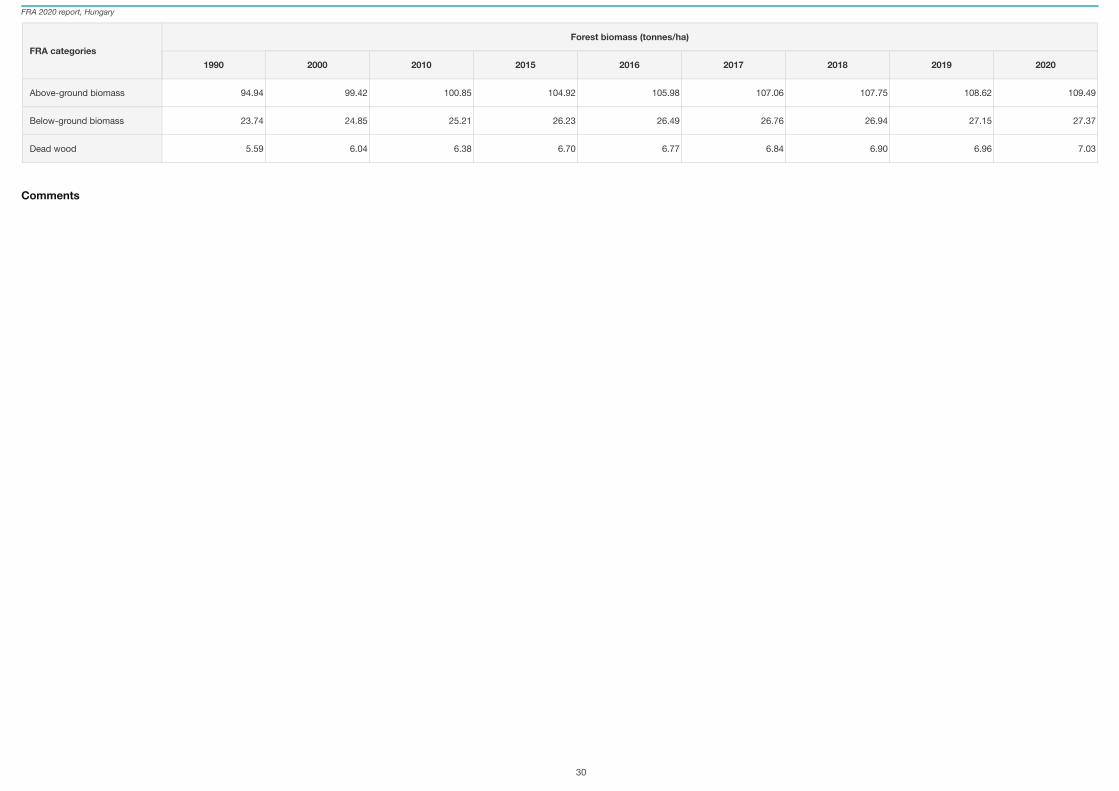
FRA categoriesForest biomass (tonnes/ha)
1990 2000 2010 2015 2016 2017 2018 2019 2020
Above-ground biomass
Below-ground biomass
Dead wood
94.94 99.42 100.85 104.92 105.98 107.06 107.75 108.62 109.49
23.74 24.85 25.21 26.23 26.49 26.76 26.94 27.15 27.37
5.59 6.04 6.38 6.70 6.77 6.84 6.90 6.96 7.03

FRA 2020 report, Hungary
31
2d Carbon stockNational Data
Data sources + type of data source eg NFI, etcFor carbon stock statistics the same applies as for biomass stock statistics while the former were calculated from the latter by methods detailed in the Hungarian NIR.
National classification and definitionsSee at Table 2c
Original data-
Analysis and processing of national data
Estimation and forecasting-
Reclassification into FRA 2020 categories-

FRA 2020 report, Hungary
32
Comments
FRA categoriesForest carbon (tonnes/ha)
1990 2000 2010 2015 2016 2017 2018 2019 2020
Carbon in above-groundbiomass
Carbon in below-groundbiomass
Carbon in dead wood
Carbon in litter
Soil carbon
45.89 48.08 48.77 50.72 51.23 51.75 52.08 52.49 52.91
11.47 12.02 12.19 12.68 12.81 12.94 13.02 13.12 13.23
2.69 2.91 3.08 3.23 3.27 3.30 3.33 3.36 3.39
Soil depth (cm) used for soilcarbon estimates

FRA 2020 report, Hungary
33
3 Forest designation and management3a Designated management objectiveNational Data
Data sources + type of data source eg NFI, etcNational Forest Database
National classification and definitionsManagement objectives are declared in forest management plans:
FRA category Management objective
Production Production of wood, propagation material, fungi; game management, christmas tree plantation
Protection of soil and water Soil, river bank, water quality protection; note that formerly bank protection was not put in this group
Conservation of biodiversity Protected and strictly protected forests, gene reserves, forest reserves, Natura 2000 reserves
Social services Forests nearby sanatoriums; sport, tourism, education, research; forests nearby monuments; wildlife parks, forest parks
Other Forests protecting croplands, settlements, wildlife, landscape continuity and various traffic equipments (roads, railways etc.); military forests, forests along country borders
Contrary to the last submission, forest areas without forest cover (see the introductory text for explanation) were also classified into the given FRA categories:
FRA category Forest areas without forest cover
Production Christmas tree plantations, other tree plantations, seedling gardens, lanes, roads, buildings, railways, mines, areas for nourishing game, areas for storing harvested trees
Protection of soil and water Area of artificial or natural lakes and watercourses
Conservation of biodiversity Area of openings and bushy areas
Social services Research stations, parks, ski pistes
Other Unfertile areas
Original data-
Analysis and processing of national data
Estimation and forecastingLinear extrapolation
Reclassification into FRA 2020 categoriesDesignated management objectives are prescribed in forest management plans. A forest may have a first, a second and a third management objective. In the first table only the first (primary) objectives were taken into account. In the second table,forests were classified according to all objectives.

FRA 2020 report, Hungary
34
Primary designated management objective
Total area with designated management objective
CommentsIn 1990 each forest subcompartment had only one designated management objective. This is the reason for the empty cells in the Total area with designated management objective table.
After the establishment of Natura 2000 network (in 2008) designated management objectives were modified accordingly during the forest planning processes. This means that some forests received Natura 2000 management objective severalyears after 2008 (which each forest is planned every ten years).
FRA 2020 categoriesForest area (1000 ha)
1990 2000 2010 2015 2020
Production (a)
Protection of soil and water (b)
Conservation of biodiversity(c)
Social Services (d)
Multiple use (e)
Other (specify in comments) (f)
None/unknown (g)
Total forest area
1 442.37 1 248.00 1 260.78 1 248.61 1 226.12
170.30 142.63 175.60 183.34 190.51
76.88 388.75 468.59 491.40 506.97
47.58 32.60 21.86 20.76 19.47
0.00
75.93 109.16 119.57 116.70 109.93
0.84 0.03 -0.01 0.01 0.01
1 813.90 1 921.17 2 046.39 2 060.82 2 053.01
FRA 2020 categoriesForest area (1000 ha)
1990 2000 2010 2015 2020
Production
Protection of soil and water
Conservation of biodiversity
Social Services
Other (specify in comments)
1 478.32 1 328.11 1 327.70 1 325.10
209.72 293.58 308.40 325.22
393.25 507.70 680.42 828.35
48.68 47.48 43.39 40.57
0.00

FRA 2020 report, Hungary
35
3b Forest area within protected areas and forest area with long-term management plansNational Data
Data sources + type of data source eg NFI, etcNational Forest Database
National classification and definitionsProtected and stricty protected forests.
Original data-
Analysis and processing of national data
Estimation and forecastingLinear extrapolation
Reclassification into FRA 2020 categories-

FRA 2020 report, Hungary
36
CommentsNote that formerly Natura 2000 forests were classified as protected.
FRA categoriesArea (1000 ha)
1990 2000 2010 2015 2016 2017 2018 2019 2020
Forest area within protectedareas
Forest area with long-termforest management plan
…of which in protected areas
51.20 337.80 451.68 458.41 458.23 458.88 461.70 463.08 464.46
1 813.90 1 921.17 2 046.39 2 060.82 2 058.73 2 057.27 2 055.92 2 054.47 2 053.01
51.20 337.80 451.68 458.41 458.23 458.88 461.70 463.08 464.46

FRA 2020 report, Hungary
37
4 Forest ownership and management rights4a Forest ownershipNational Data
Data sources + type of data source eg NFI, etcNational Forest Database
National classification and definitionsData have been corrected since the last submission. In the Hungarian Forest Database we have only three types of ownership: state, private and communal. The last involves municipal forests and forests of various communities (churches,foundations etc.). Formerly, all communal forests were classified as public forests. For the present submission, we divided communal forests according to forest managers (classification of which is much more sophisticated). Thus, communalforests managed by municipalities were assumed to be owned by a municipality.
Original data-
Analysis and processing of national data
Estimation and forecasting-
Reclassification into FRA 2020 categories-

FRA 2020 report, Hungary
38
Comments
FRA categoriesForest area (1000 ha)
1990 2000 2010 2015
Private ownership (a)
…of which owned byindividuals
…of which owned by privatebusiness entities andinstitutions
…of which owned by local,tribal and indigenouscommunities
Public ownership (b)
Unknown/other (specify incomments) (c)
Total forest area
9.23 461.40 860.79 864.07
1 792.01 1 151.52 1 170.25 1 168.88
12.66 308.25 15.35 27.87
1 813.90 1 921.17 2 046.39 2 060.82

FRA 2020 report, Hungary
39
4b Holder of management rights of public forestsNational Data
Data sources + type of data source eg NFI, etcNational Forest Database
National classification and definitionsSee at Table 4a
Original data-
Analysis and processing of national data
Estimation and forecasting-
Reclassification into FRA 2020 categories-

FRA 2020 report, Hungary
40
Comments
FRA categoriesForest area (1000 ha)
1990 2000 2010 2015
Public Administration (a)
Individuals (b)
Private business entities andinstitutions (c)
Local, tribal and indigenouscommunities (d)
Unknown/other (specify incomments) (e)
Total public ownership
1 139.68 1 153.25 1 148.78
0.39 0.38 0.31
1.26 5.63 4.27
0.00 0.07 0.07
1 792.01 10.19 10.92 15.45
1 792.01 1 151.52 1 170.25 1 168.88

FRA 2020 report, Hungary
41
5 Forest disturbances5a DisturbancesNational Data
Data sources + type of data source eg NFI, etcForest Damage Database for 1990-2011
National Forest Damage Registry after 2011
National classification and definitions
FRA categories Definition
Insects Damages caused by insects
Diseases Damages caused by fungi
Severe weather events Abiotic damages except for fires
Other Damages caused by wildlife and game, parasitic plants, tree decline; damages with unknown origins; human-induced damages
Original data-
Analysis and processing of national data
Estimation and forecasting-
Reclassification into FRA 2020 categoriesThe statistics are calculated as: damaged area multiplied by proportion of damaged trees.

FRA 2020 report, Hungary
42
Comments
FRA categoriesArea (1000 ha)
2000 2001 2002 2003 2004 2005 2006 2007 2008 2009 2010 2011 2012 2013 2014 2015 2016 2017
Insects (a)
Diseases (b)
Severe weather events (c)
Other (specify in comments)(d)
Total (a+b+c+d)
Total forest area
60.32 69.77 74.46 129.72 214.99 283.61 109.52 38.22 53.47 54.20 47.12 45.37 25.34 20.79 12.12 5.45 7.72 6.98
14.61 20.38 21.72 13.69 41.58 41.15 16.09 11.10 15.88 11.77 18.96 9.32 2.83 2.10 4.32 2.58 2.92 1.82
37.07 19.32 16.66 38.99 16.59 23.23 12.09 29.34 14.85 22.25 38.11 45.37 48.09 24.59 40.28 34.81 62.65 56.59
26.06 24.75 26.01 40.51 32.27 35.09 39.91 60.11 37.04 29.80 25.80 24.19 20.25 21.10 17.72 16.99 14.37 18.11
138.06 134.22 138.85 222.91 305.43 383.08 177.61 138.77 121.24 118.02 129.99 124.25 96.51 68.58 74.44 59.83 87.66 83.50
1 921.17 − − − − 1 983.90 − − − − 2 046.39 − − − − 2 060.82 2 058.73 2 057.27

FRA 2020 report, Hungary
43
5b Area affected by fireNational Data
Data sources + type of data source eg NFI, etcBeginning 1999, the Fire Department started to provide data on the number and area of forest wildfires. In 2006, Hungary joined to the European Forest Fire Information System (EFFIS, http://effis.jrc.it or http://www.jrc.cec.eu.int/), and a newdatabase was established in the Twinning Project No. HU 2004/016-689.01.02. Thus, beginning 2007, the Fire Department locates the fires, surveys the affected area, and, subsequently, the Forest Authority identifies the affected forest sub-compartments.
National classification and definitions-
Original data-
Analysis and processing of national data
Estimation and forecasting-
Reclassification into FRA 2020 categories-

FRA 2020 report, Hungary
44
CommentsData have been carefully reviewed since the last submission.
FRA categoriesArea (1000 ha)
2000 2001 2002 2003 2004 2005 2006 2007 2008 2009 2010 2011 2012 2013 2014 2015 2016 2017
Total land area affected by fire
…of which on forest
20.92 12.93 19.99 29.41 27.38 6.06 8.90 19.23 24.62 24.83 6.47 24.67 100.97 8.02 25.18 15.00 3.42 13.76
0.81 0.42 0.38 1.05 0.35 3.53 0.63 2.06 0.40 0.85 0.24 1.19 4.37 0.41 0.76 1.60 0.22 1.24

FRA 2020 report, Hungary
45
5c Degraded forest
CommentsWe regard a forest as degraded if it does not utilize site conditions properly, for example due to species composition. However, we have no data on these forests.
Does your country monitor area of degraded forest
If "yes"
What is the national definitionof "Degraded forest"?
Describe the monitoringprocess and results
No

FRA 2020 report, Hungary
46
6 Forest policy and legislation6a Policies, Legislation and national platform for stakeholder participation in forest policyNational Data
Data sources + type of data source eg NFI, etc-
National classification and definitions-
Original data-
FRA 2020 report, Hungary
47
Comments
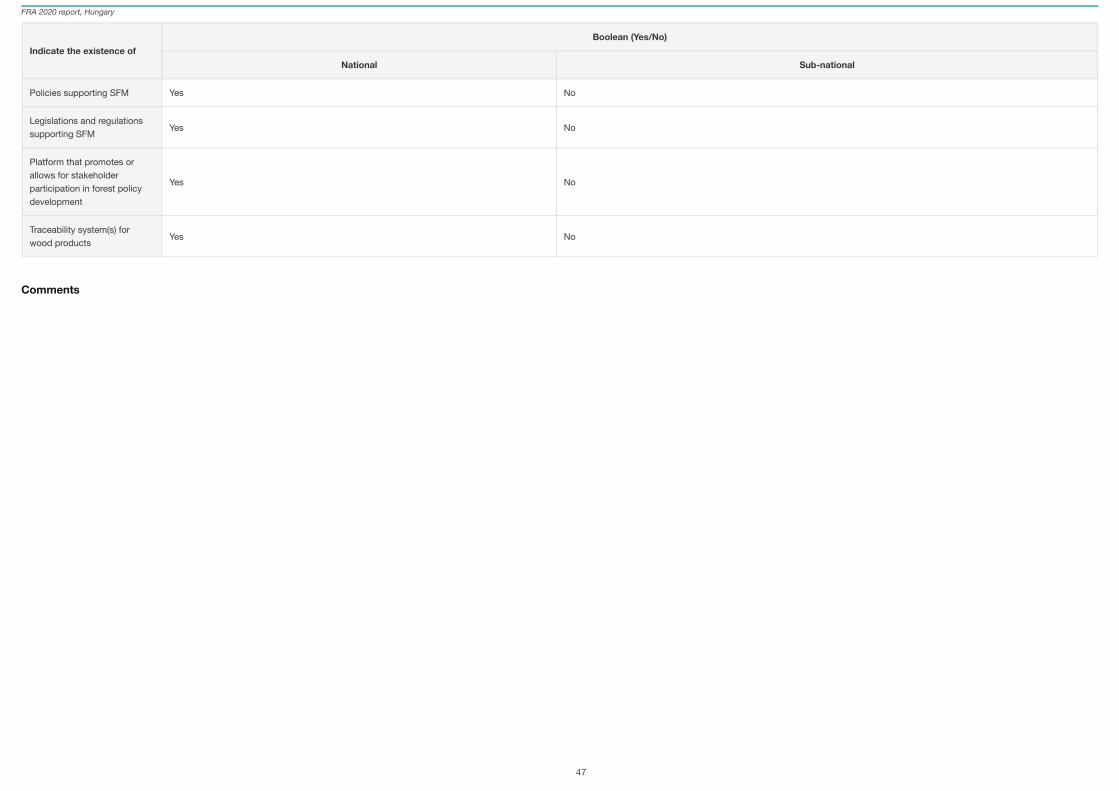
Indicate the existence ofBoolean (Yes/No)
National Sub-national
Policies supporting SFM
Legislations and regulationssupporting SFM
Platform that promotes orallows for stakeholderparticipation in forest policydevelopment
Traceability system(s) forwood products
Yes No
Yes No
Yes No
Yes No

FRA 2020 report, Hungary
48
6b Area of permanent forest estateNational Data
Data sources + type of data source eg NFI, etc-
National classification and definitions-
Original data-

FRA 2020 report, Hungary
49
CommentsArea of permanent forest estate involves all areas where tree stand meets threshold size and crown cover values detailed in the Comments section of Table 1a.
FRA 2020 categoriesForest area (1000 ha)
Applicable? 1990 2000 2010 2015 2020
Area of permanent forestestate Yes 1 813.90 1 921.17 2 046.39 2 060.82 2 053.01

FRA 2020 report, Hungary
50
7 Employment, education and NWFP7a Employment in forestry and loggingNational Data
Data sources + type of data source eg NFI, etc-
National classification and definitions-
Original data-

FRA 2020 report, Hungary
51
Comments
FRA 2020 categories
Full-time equivalents (1000 FTE)
1990 2000 2010 2015
Total Female Male Total Female Male Total Female Male Total Female Male
Employment in forestry andlogging
…of which silviculture andother forestry activities
…of which logging
…of which gathering of nonwood forest products
…of which support services toforestry
24.29 18.33 2.96 15.37 16.04 2.47 13.56 23.13 4.15 18.98
7.73 1.52 6.20 13.31 3.19 10.12
7.44 0.79 6.65 8.34 0.65 7.69
0.78 0.09 0.69 1.42 0.30 1.12

FRA 2020 report, Hungary
52
7b Graduation of students in forest-related educationNational Data
Data sources + type of data source eg NFI, etc-
National classification and definitions-
Original data-

FRA 2020 report, Hungary
53
Comments
FRA 2020 categories
Number of graduated students
1990 2000 2010 2015
Total Female Male Total Female Male Total Female Male Total Female Male
Doctoral degree
Master’s degree
Bachelor’s degree
Technician certificate /diploma
Total
6.00 2.00 4.00 2.00 0.00 1.00
47.00 3.00 44.00 42.00 5.00 37.00 48.00 12.00 36.00 65.00 10.00 54.00
52.00 5.00 46.00 110.00 32.00 78.00 80.00 24.00 56.00
274.00 27.00 247.00 335.00 31.00 304.00
437.00 72.00 365.00 482.00 66.00 416.00
FRA 2020 report, Hungary
54
7c Non wood forest products removals and value 2015National Data
Data sources + type of data source eg NFI, etc-
National classification and definitions-
Original data-

FRA 2020 report, Hungary
55
Comments
Name of NWFP product Key species Quantity Unit Value (1000 local currency) NWFP category
#1
#2
#3
#4
#5
#6
#7
#8
#9
#10
All other plant products
All other animal products
Total −
Name of currency

FRA 2020 report, Hungary
56
8 Sustainable Development Goal 158a Sustainable Development Goal 15SDG Indicator 15.1.1 Forest area as proportion of total land area 2015
SDG Indicator 15.2.1 Progress towards sustainable forest management
IndicatorPercent
2000 2010 2015 2016 2017 2018 2019 2020
Forest area as proportion oftotal land area 2015
21.22 22.60 22.76 22.74 22.72 22.71 22.69 22.68
Name of agency responsible
Sub-Indicator 1Percent
2000-2010 2010-2015 2015-2016 2016-2017 2017-2018 2018-2019 2019-2020
Forest area annual net changerate
0.63 0.14 -0.10 -0.07 -0.07 -0.07 -0.07
Name of agency responsible
Sub-Indicator 2Forest biomass (tonnes/ha)
2000 2010 2015 2016 2017 2018 2019 2020
Above-ground biomass stockin forest
99.42 100.85 104.92 105.98 107.06 107.75 108.62 109.49
Name of agency responsible

FRA 2020 report, Hungary
57
Sub-Indicator 3Percent (2015 forest area baseline)
2000 2010 2015 2016 2017 2018 2019 2020
Proportion of forest arealocated within legallyestablished protected areas
16.39 21.92 22.24 22.24 22.27 22.40 22.47 22.54
Name of agency responsible
Sub-Indicator 4Percent (2015 forest area baseline)
2000 2010 2015 2016 2017 2018 2019 2020
Proportion of forest area underlong-term forest managementplan
93.22 99.30 100.00 99.90 99.83 99.76 99.69 99.62
Name of agency responsible
Sub-Indicator 5Forest area (1000 ha)
2000 2010 2015 2016 2017 2018 2019 2020
Forest area underindependently verified forestmanagement certificationschemes
0.00 251.91 306.59 304.27 304.43 304.12 − −