global genome response of escherichia colio157:h7 …ecite.utas.edu.au/97070/1/king et al...
TRANSCRIPT

Global Genome Response of Escherichia coli O157:H7Sakai during Dynamic Changes in Growth KineticsInduced by an Abrupt Temperature DownshiftThea King1*, Chawalit Kocharunchitt2, Kari Gobius3, John P. Bowman2, Tom Ross2
1 Commonwealth Scientific and Industrial Research Organisation, Animal, Food and Health Sciences, North Ryde, New South Wales, Australia, 2 Food Safety Centre,
Tasmanian Institute of Agriculture, University of Tasmania, Hobart, Tasmania, Australia, 3 Commonwealth Scientific and Industrial Research Organisation, Animal, Food
and Health Sciences, Werribee, Victoria, Australia
Abstract
Escherichia coli O157:H7 is a mesophilic food-borne pathogen. We investigated the growth kinetics of E. coli O157:H7 Sakaiduring an abrupt temperature downshift from 35uC to either 20uC, 17uC, 14uC or 10uC; as well as the molecular mechanismsenabling growth after cold stress upon an abrupt downshift from 35uC to 14uC in an integrated transcriptomic andproteomic analysis. All downshifts caused a lag period of growth before growth resumed at a rate typical of the post-shifttemperature. Lag and generation time increased with the magnitude of the shift or with the final temperature, while relativelag time displayed little variation across the test range. Analysis of time-dependent molecular changes revealed, in keepingwith a decreased growth rate at lower temperature, repression of genes and proteins involved in DNA replication, proteinsynthesis and carbohydrate catabolism. Consistent with cold-induced remodelling of the bacterial cell envelope, alterationsoccurred in the expression of genes and proteins involved in transport and binding. The RpoS regulon exhibited sustainedinduction confirming its importance in adaptation and growth at 14uC. The RpoE regulon was transiently induced,indicating a potential role for this extracytoplasmic stress response system in the early phase of low temperature adaptationduring lag phase. Interestingly, genes previously reported to be amongst the most highly up-regulated under oxidativestress were consistently down-regulated. This comprehensive analysis provides insight into the molecular mechanismsoperating during adaptation of E. coli to growth at low temperature and is relevant to its physiological state during chillingin foods, such as carcasses.
Citation: King T, Kocharunchitt C, Gobius K, Bowman JP, Ross T (2014) Global Genome Response of Escherichia coli O157:H7 Sakai during Dynamic Changes inGrowth Kinetics Induced by an Abrupt Temperature Downshift. PLoS ONE 9(6): e99627. doi:10.1371/journal.pone.0099627
Editor: Dipankar Chatterji, Indian Institute of Science, India
Received October 17, 2013; Accepted May 17, 2014; Published June 13, 2014
Copyright: � 2014 King et al. This is an open-access article distributed under the terms of the Creative Commons Attribution License, which permits unrestricteduse, distribution, and reproduction in any medium, provided the original author and source are credited.
Funding: This study was funded by Meat and Livestock Australia (http://www.mla.com.au), the CSIRO and the Food Safety Centre. The funder Meat and LivestockAustralia had no role in study design, data collection and analysis, decision to publish, or preparation of the manuscript. The funders CSIRO and the Food SafetyCentre were involved in study design, data collection and analysis, decision to publish, and preparation of the manuscript.
Competing Interests: This study was partly funded by Meat and Livestock Australia. There are no patents, products in development or marketed products todeclare. This does not alter the authors’ adherence to all the PLOS ONE policies on sharing data and materials, as detailed online in the guide for authors.
* E-mail: [email protected]
Introduction
The enterohemorrhagic Escherichia coli (EHEC) pathotype is
comprised of a diverse group of Shiga toxin-producing E. coli
(STEC) strains that cause severe disease, including the potentially
fatal haemolytic uremic syndrome (HUS). E. coli O157:H7 is one
of the most important EHEC serotypes in relation to public health,
contributing significantly to human infections and outbreaks. The
major transmission route for O157:H7 is food-borne, with many
different foods and dairy products acting as vectors in outbreaks
and sporadic cases of infection [1]. However, the majority of
reported cases appear to be attributed to the consumption of foods
of bovine origin, with ground beef the most frequently identified
vehicle [1]. Cattle are the primary reservoir of O157:H7 and this
organism can be found in their faeces, rumen, hide, derived
carcasses and meat products [2,3,4]. Persistence of this pathogen
in the agricultural and food processing industry environments
poses potential risks for human health.
Refrigeration is the most common means of preserving food in
developed nations, either alone or in combination with other
methods such as the addition of preservatives [5]. The ability to
survive or grow at low temperature is therefore inherently
important to many food-borne mesophilic bacterial pathogens,
including E. coli. E. coli is able to grow at temperatures as low as
8uC, although the optimum growth temperature is around 37uC[6]. During transition to low temperature, bacteria must overcome
a number of chemico-physical changes, including decreased
membrane fluidity, which reduces nutrient uptake capabilities;
increased superhelical coiling of DNA, which can negatively affect
a bacterium’s ability to replicate or transcribe DNA; stabilization
of the secondary structures of RNA, which affect translation;
reduced enzyme activities; inefficient or slow protein folding; and
reduced ribosome function (for review, see [7]). The response of
exponentially growing bacterial cells to non-lethal cold shock
conditions above the minimal growth temperature has been
divided into three stages; the first stage represents the initial but
transient cold shock response that immediately follows cold
exposure and may last several hours during which a profound
reduction in the growth rate as well as marked reprogramming of
protein synthesis occurs, the second stage involves a restoration of
PLOS ONE | www.plosone.org 1 June 2014 | Volume 9 | Issue 6 | e99627
a balanced exponential growth rate and further modification of
protein synthesis where cells are cold-adapted and, the third stage
is where cells reach stationary phase and gene expression is altered
again [8]. Most molecular studies to date have focused on the
response of bacterial cells to the transient cold shock response
[9,10]. However, a comprehensive understanding of the molecular
response of E. coli during adaptation and growth at low
temperature is vital if we are to design targeted processing and
preservation strategies to effectively control this pathogen.
In a previous study we adopted an integrated transcriptomic
and proteomic approach to determine the physiological response
of E. coli O157:H7 Sakai during exponential phase growth under
steady-state conditions relevant to low temperature and water
activity conditions experienced during meat carcass chilling in cold
air [11]. The findings of that study provide a baseline of knowledge
of the physiology of this pathogen, with the response of E. coli
O157:H7 to steady-state conditions of combined cold and osmotic
stress (14uC aw 0.967 and 14uC aw 0.985), such as occurs during
carcass chilling. Activation of the master stress response regulator
RpoS and the Rcs phosphorelay system involved in the
biosynthesis of the exopolysacharide colanic acid, as well as
down-regulation of genes and proteins involved in chemotaxis and
motility were observed [11]. To provide an insight into the genetic
systems enabling this organism to adapt to growth at low
temperature, we extended the aforementioned study to investigate
the growth kinetics of E. coli O157:H7 Sakai during abrupt
temperature downshift from 35uC to either 20uC, 17uC, 14uC or
10uC and, examined time-dependent global alterations in its
genome expression upon cold shock from 35uC to 14uC. The
genome-wide expression response of E. coli was analysed by both
cDNA microarray (transcriptome response) and 2D-LC/MS/MS
analysis (proteome response). Differences in gene and protein
expression patterns in E. coli before and after cold shock were
analysed through quantitative and comparative analysis of time
series changes in both mRNA and proteins levels.
Materials and Methods
Division of experimental workGrowth rate experiments studying the response of E. coli
O157:H7 to temperature downshift were conducted in the Food
Safety Centre (Hobart, Australia). Parallel transcriptomic and
proteomic studies were conducted in independent laboratories;
transcriptome studies were conducted at CSIRO Animal, Food
and Health Sciences (North Ryde, Australia) and proteome studies
at the Food Safety Centre, University of Tasmania (Hobart,
Australia), respectively. The differences in the protocol followed at
each site pertain to the different methods employed for RNA and
protein extraction and identification, as well as the use of different
equipment for optical density measurements (Transcriptomic:
Pharmacia Biotech Novaspec II spectrophotometer; and Proteo-
mic: Spectronic 20, Bausch and Lomb) and waterbaths for
incubation of cultures (Transcriptomic: Julabo SW23 waterbath
(80 rpm); and Proteomic: Ratek SWB20D shaking waterbath (80
oscillations.min21)).
Bacterial strain and preparation of inoculaTo mimic experiments conducted previously [11], E. coli
O157:H7 strain Sakai [12,13] obtained from Dr. Carlton Gyles
(Guelph, Canada) was used throughout this study and stored at
280uC. A stock culture was cultivated on brain-heart infusion
(BHI) agar at 37uC for 24 h. A well-isolated single colony from a
BHI agar plate was used to inoculate 25 ml of fresh BHI broth,
and incubated at 37uC without shaking for 20 h. This culture was
stored at 4uC and used as a ‘working’ culture within a week.
Growth responses after downshifts in temperatureThe working culture was diluted 1:104 in 25 ml of pre-warmed
(35uC) BHI broth to prepare a ‘primary’ culture. This culture was
incubated at 35uC with agitation (80 oscillations.min21; Ratek
Instruments, Boronia, Australia) and growth was monitored
turbidimetrically at 600 nm with a Spectronic 20 spectrophotom-
eter (Bausch and Lomb, Rochester, USA). After achieving an
OD600 of 0.160.01 (i.e. the exponential phase of growth,
,107 CFU.ml21), the culture was diluted 1:100 in 25 ml of
sterile pre-warmed (35uC) BHI broth to prepare a ‘secondary’
culture. This culture was re-incubated at 35uC with agitation to
the exponential growth phase (OD600 of 0.160.01). At this point
the culture was abruptly shifted to a refrigerated water bath held
either at 20uC, 17uC, 14uC or 10uC. Water baths were maintained
within 60.1uC of the test temperature.
Microbiological analysisGrowth of E. coli was determined by measuring percent
transmittance (%T) at 600 nm. The %T values were converted
to optical density (OD) values. All experiments were conducted at
least twice and the results are reported as the average of the
replicates.
Growth curves were constructed by plotting log10 OD versus
time. Linear regression analysis of the growth curve data was then
used to estimate the generation time (GT) and lag time (LT),
according to methods of Mellefont et al. [14]. Briefly, a straight
line was fitted to those data points that best represent the
exponential phase of growth. To ensure the accuracy of this
estimation, at least four time points over this growth phase were
used and the R2 value for the regression lines was $0.95. The GT
was then calculated by dividing 0.301 (equivalent to log10 2) by the
slope of the line. The LT was estimated from the time at which the
regression line through the exponential part of the growth curve
first exceeded the initial log10 OD after applying the temperature
downshift (i.e. the time taken to increase above starting numbers).
To assess the amount of ‘‘work’’ required by E. coli to adjust to a
new temperature, relative lag time (RLT) was calculated by
dividing LT by GT [15,16].
Preparation of samples for transcriptomic and proteomicanalysis
In separate cold shock experiments, cultures were subjected to a
rapid temperature downshift from 35uC to 14uC as described
above to prepare samples for cDNA microarray and 2D-LC/MS/
MS analysis. An appropriate volume of each of the cell cultures
was harvested before cold shock (i.e. the reference culture), and at
30, 90, 160, and 330 min post-temperature downshift. Indepen-
dent samples were then subjected to extraction of RNA, and both
soluble and membrane proteins, according to the methods of
Kocharunchitt et al. [11]. The number of biological replicates
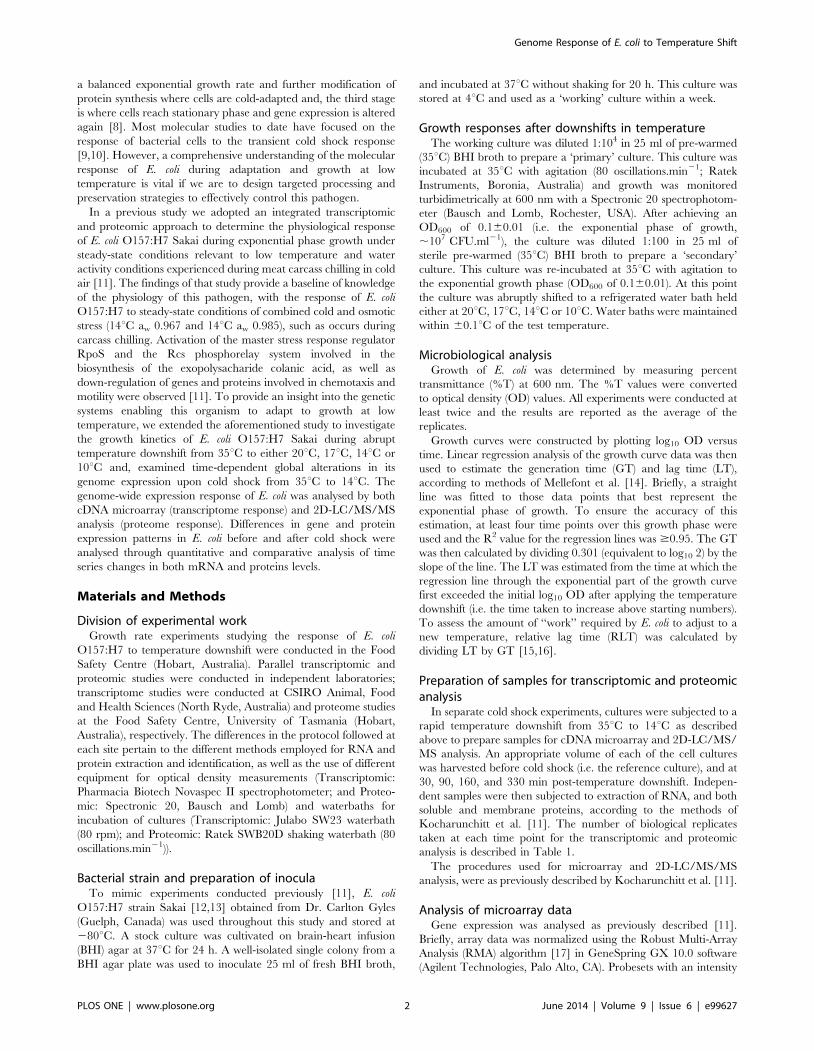
taken at each time point for the transcriptomic and proteomic
analysis is described in Table 1.
The procedures used for microarray and 2D-LC/MS/MS
analysis, were as previously described by Kocharunchitt et al. [11].
Analysis of microarray dataGene expression was analysed as previously described [11].
Briefly, array data was normalized using the Robust Multi-Array
Analysis (RMA) algorithm [17] in GeneSpring GX 10.0 software
(Agilent Technologies, Palo Alto, CA). Probesets with an intensity
Genome Response of E. coli to Temperature Shift
PLOS ONE | www.plosone.org 2 June 2014 | Volume 9 | Issue 6 | e99627
value in the lowest 20th percentile among all the intensity values
were excluded and the remaining probesets were used for
downstream statistical analysis. Significance was analysed using
one way analysis of variance (ANOVA) using the multiple
correction testing method of Benjamini and Hochberg [18] with
a P-value cut-off of #0.01. Genes and proteins were considered to
be differentially expressed only if the fold change was $2.
However, it should be noted that 2-fold changes can also be
biologically significant [19,20].
Analysis of MS/MS dataMS/MS spectra obtained from each protein sample of
membrane and soluble fractions were managed by the Compu-
tational Proteomics Analysis System (CPAS), a web-based system
built on the LabKey Server (v9.1, released 02.04.2009) [21]. The
mass spectra produced were subjected to a semi-tryptic search
against the combined databases of E. coli O157:H7 Sakai (5,318
entries in total) downloaded from the National Center for
Biotechnology Information (NCBI, https://www.ncbi.nlm.nih.
gov/, downloaded 25.11.2008) using X!Tandem v2007.07.01
[22]. These databases included the E. coli O157:H7 Sakai database
(5230 entries, NC_002695.fasta) and two E. coli O157:H7 Sakai
plasmid databases, plasmid pO157 (85 entries, NC_002128.fasta)
and plasmid pOSAK1 (three entries, NC_002127.fasta). The
search parameters used were as follows: mass tolerance for
precursor and fragment ions: 10 ppm and 0.5 Da, respectively;
fixed modification: cysteine carbamidomethylation (+57 Da); and
no variable modifications. The search results were then analyzed
using the PeptideProphet and ProteinProphet algorithms from the
Trans Proteomic Pipeline v3.4.2 [23,24]. All peptide and protein
identifications were accepted at PeptideProphet and ProteinPro-
phet of $0.9, corresponding to a theoretical error rate of #2%
[23,25]. In addition, the false-positive discovery rate for each
dataset was further assessed by searching the MS/MS spectra
against the target-reversed (decoy) database with the same search
criteria as described above. The peptide false-positive discovery
rate for each proteomic dataset was less than 5% for all MudPIT
runs.
All protein identifications that met the above criteria were
further assessed based on the confidence level of protein
identifications across biological replicates of each fraction of E.
coli at each time point. The confidence level was based on the
number of unique peptides identified from one sample and the
number of replicates in which the protein was detected.
Specifically, proteins identified by more than one unique peptide
in at least one of the replicates were considered to have a ‘high’
confidence score. The ‘intermediate’ confidence level was assigned
to proteins with a single peptide hit that was detected in more than
one replicate. ‘Low-confidence’ proteins were considered to be
those identified by a single unique peptide and found in only one
replicate. Only protein identifications with a ‘high’ and ‘interme-
diate’ confidence level (referred to as having a ‘high confidence
score’) were accepted for further analysis.
Following data filtering, all protein identifications with ‘high’
confidence from membrane and soluble fractions of the same
sample were combined to represent a ‘total’ fraction of the
corresponding sample. This combined approach was employed on
the basis that the observed R2 values, as determined by linear
regression analysis, indicated a relatively stronger linear correla-
tion between spectral counts (SpCs, the number of MS/MS
spectra) for all possible pair-wise comparisons of replicates of
pooled fractions (average R2 = 0.8960.05) when compared to that
of replicates of each fraction (average R2 = 0.6460.19, and
0.8560.05 for membrane and soluble fractions, respectively).
Ta
ble
1.
Th
en
um
be
ro
fva
lidp
rote
inid
en
tifi
cati
on
san
dsi
gn
ific
antl
yd
iffe
ren
tial
lye
xpre
sse
dg
en
es
and
pro
tein
saf
ter
tem
pe
ratu
red
ow
nsh
ift
of
E.co
liO
15
7:H
7Sa
kaif
rom
35uC
to1
4uC
.
Tim
ep
oin
ts(m
in)
Nu
mb
er
of
bio
log
ica
lre
pli
cate
sN
um
be
ro
fp
rote
insb
Nu
mb
er
of
dif
fere
nti
all
ye
xp
ress
ed
ge
ne
sa
nd
pro
tein
sd
Tra
nsc
rip
tom
eP
rote
om
ea
Me
mb
ran
efr
act
ion
So
lub
lefr
act
ion
To
tal
fra
ctio
nT
ran
crip
tom
e(t
ota
l)c
Pro
teo
me
(to
tal)
Tra
nsc
rip
tom
evs
.P
rote
om
ee
Be
fore
do
wn
shif
t3
6(6
)3
43
1,3
20
1,3
70
NA
eN
AN
A
30
min
aft
er
the
shif
t3
2(2
)7
04
82
41
,07
45
03
(29
2)
13
7(2
0)
13
(3)
90
min
aft
er
the
shif
t3
2(2
)7
17
86
41
,10
76
37
(46
6)
15
5(2
6)
26
(2)
16
0m
ina
fte
rth
esh
ift
32
(2)
70
28
90
1,1
15
59
4(3
78
)1
18
(25
)2
2(6
)
33
0m
ina
fte
rth
esh
ift
32
(2)
85
88
64
1,1
85
49
6(3
01
)2
01
(63
)3
0(7
)
aN
um
be
ro
fp
rote
ins
ide
nti
fie
din
solu
ble
(ou
tsid
eb
rack
ets
)an
dm
em
bra
ne
(wit
hin
bra
cke
ts)
frac
tio
ns
of
the
pro
teo
me
that
hav
ep
asse
dth
efi
lte
rin
gcr
ite
ria.
bN
um
be
ro
fp
rote
inid
en
tifi
cati
on
sw
ith
hig
hco
nfi
de
nce
inm
em
bra
ne
,so
lub
lean
dto
tal
frac
tio
ns
of
the
pro
teo
me
.cA
nal
ysis
do
es
no
tin
clu
de
the
nu
mb
er
of
dif
fere
nti
ally
exp
ress
ed
un
de
fin
ed
inte
rge
nic
reg
ion
sin
the
tran
scri
pto
me
.d
Nu
mb
er
of
up
-re
gu
late
d(o
uts
ide
bra
cke
ts)
and
do
wn
-re
gu
late
d(w
ith
inb
rack
ets
)g
en
es
and
pro
tein
s.eN
um
be
ro
fg
en
es
and
pro
tein
ssi
gn
ific
antl
yu
p-
or
do
wn
-re
gu
late
din
bo
thth
etr
ansc
rip
tom
ican
dp
rote
om
ican
alys
is.
eN
A;
no
tap
plic
able
.d
oi:1
0.1
37
1/j
ou
rnal
.po
ne
.00
99
62
7.t
00
1
Genome Response of E. coli to Temperature Shift
PLOS ONE | www.plosone.org 3 June 2014 | Volume 9 | Issue 6 | e99627

Each of the total fractions across the biological replicates was then
used to generate the final list of proteins for each time point of
sampling.
Protein expression ratio and its significanceSpectral counts generated by 2D-LC/MS/MS analysis were
used as a semi-quantitative measure of protein abundance [23,26].
The total abundance of each protein in a sample was obtained by
pooling spectral counts detected for a given protein from
membrane and soluble fractions of the same sample (i.e. the same
biological replicate). Each pooled spectral count was then
normalized to obtain the normalized spectral abundance factor
(NSAF) according to Zybailov et al. [27]. Briefly, the NSAF for a
given protein is the pooled spectral count of the protein divided by
its amino acid length (L), and normalized against the average
SpC/L across all proteins in the corresponding dataset. The NSAF
values were then averaged across all biological replicates at each
time point of sampling to obtain representative values of NSAF.
Fold changes in protein abundance due to cold shock were
calculated as the log2 ratio of the average NSAF value in the cold-
treated sample over the average NSAF value of the control.
Control samples (35uC) were pooled from the current and
companion study [28]. To avoid errors during fold change
calculation in cases where a zero value was obtained, a correction
factor of 0.01 was added to each of the average NSAF values.
Furthermore, statistical analysis of differences in protein abun-
dance was carried out using the beta-binomial test implemented in
R [29]. All proteins with a P-value #0.01 and at least a 2-fold
change were considered to be differentially abundant.
Transcriptomic and proteomic data miningInformation on identified genes and proteins such as protein
and gene names, EC numbers (locus tag), GI numbers, NCBI
Reference Sequence (RefSeq), protein sizes and molecular masses
were obtained from the UniProt knowledgebase (http://www.
uniprot.org/) and the NCBI database (accessed on 5.12.2010).
Preliminary functions and properties of the genes and proteins
were based on the EcoCyc database (http://www.ecocyc.org/,
accessed on 13.12.2010), and the Kyoto Encyclopedia of Genes
and Genomes (KEGG) database (http://www.genome.jp/kegg/,
accessed on 4.12.2010). In the present study, protein or gene
names in conjunction with EC numbers were used as a unique
identifier for genes and/or proteins.
Predefined group enrichment analysisTo identify changes in the overall expression of a predefined set
of genes or proteins due to temperature downshift, the t-test based
method of Boorsma et al. [30], known as T-profiler, was
performed on the normalized log2 expression ratios. The
predefined sets of genes and proteins used in the T-profiler
analysis were based on the selected functional role categories and/
or metabolic pathways of the following databases: the JCVI
Comprehensive Microbial Resource (JCVI CMR) database
(http://cmr.jcvi.org/cgi-bin/CMR/CmrHomePage.cgi, accessed
on 5.12.2010), the EcoCyc database collection (http://www.
ecocyc.org/, accessed on 13.12.2010), and the KEGG database
(http://www.genome.jp/kegg/, accessed on 4.12.2010), as well as
based on the lists of genes or proteins previously known to be
positively controlled by major regulons, including CpxRA [31],
RpoE [32], RpoH [33], RpoS [34,35,36], and the Rcs phosphor-
elay system [37]. A complete list of genes and proteins with their
comprehensive annotations are given in Table S1 in File S1. The
T-values obtained from the analysis were determined only for sets
that contained at least five members, and their significance was
established by using the associated two-tailed P-value. All
predefined sets with a P-value less than 0.1 were considered to
be statistically significant.
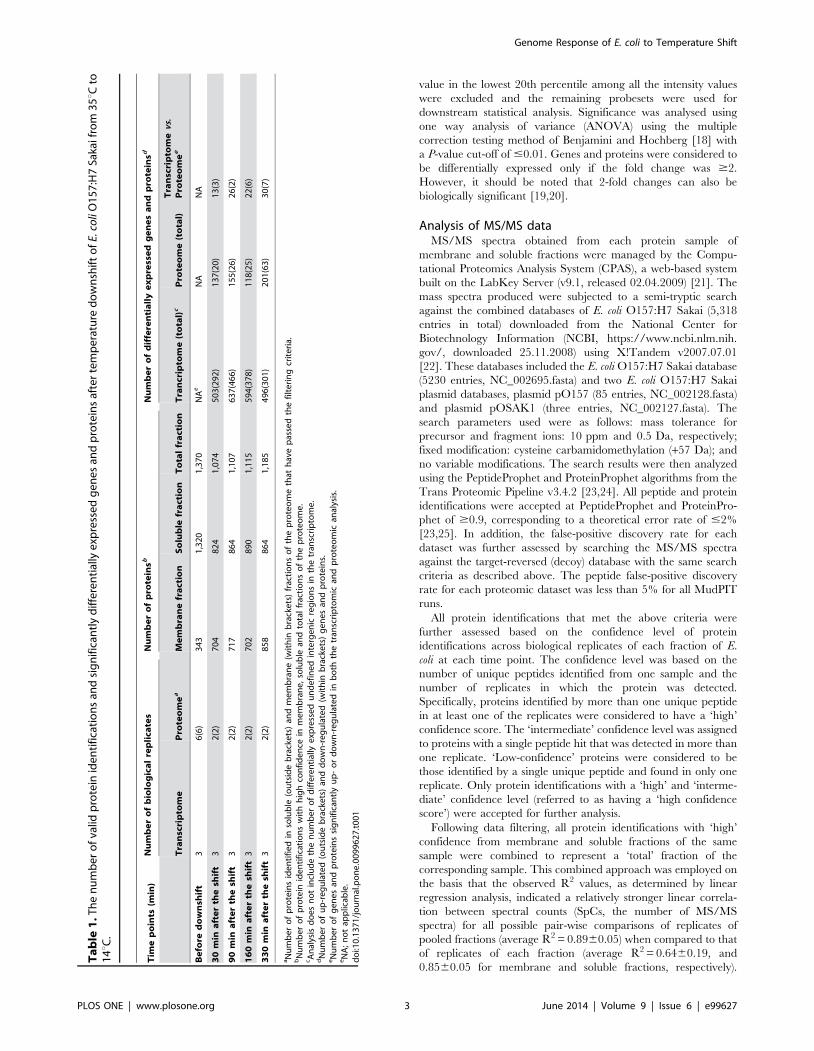
Clustering analysis of the transcriptomic and proteomicdata
Hierarchical clustering analysis (HCA) was performed on the T-
values calculated for JCVI CMR functional categories within each
transcriptomic and proteomic profile. The degree of similarity of
the transcriptomic and proteomic profiles of E. coli during
exposure to a sudden downshift in temperature to 14uC were
also compared to the T-profiler results for the transcriptome and
proteome of E. coli during steady-state growth at 14uC aw 0.985
[11]. The degree of similarity was calculated with the Euclidean
distance metric and complete linkage as a clustering method, using
Cluster 3.0 software [38]. The clustering result was then visualized
in TreeView version 1.1.3 [39].
Validation of microarray data by qRT-PCRThree genes that showed significant (P value #0.01) up-
regulation or down-regulation in the microarray experiments were
selected for analysis by quantitative real-time reverse transcription-
PCR (qRT-PCR). Forward and reverse PCR primers for nuoC, fiu
and spy were designed using Primer3 software [40]. As previously
described, the 16S rRNA gene (rrsA) was also included for
normalization within samples [41,42]. The primer pairs were as
follows. For rrsA: forward (F), 59-AGGCCTTCGGGTTG-
TAAAGT-39; reverse (R), 59-GTTAGCCGGTGCTTCTT-
CTG-39. For nuoC: forward (F), 59-TTGACTTACACGGCATG-
GAC-39; reverse (R), 59-TACGTGCAGGTCGTTTTCTG-39.
For fiu: forward (F), 59- AGTCTGGCAGCGGTAACAGT-39;
reverse (R), 59-GGTGAGCAACAGGCGTTTAT-39. For spy:
forward (F), 59-TGCCTCTACCCTGGCTCTT-39; reverse (R),
59-TCGGTCAGGTTCAGGTCTTT-39. One microgram of
purified total RNA from each of the three biological replicates
used for microarray analysis was reverse transcribed using the
iScript cDNA synthesis kit (Bio-Rad, Hercules, CA). Real-time
PCR was performed on tenfold dilutions (from 1022 to 1024) of
the template cDNA. qRT-PCR mixes contained a total volume of
20 ml consisting of 10 ml IQ SYBR green supermix (Bio-Rad),
1.6 ml diluted cDNA, 0.4 ml each forward and reverse primer
(25 mM stock), and 7.6 ml nuclease-free water (Ambion, Austin,
TX). All Real-time PCR reactions were performed on the
LightCycler 480 (Roche) under the following conditions: 95uCfor 3 min, 45 consecutive cycles consisting of 95uC for 10 s and
60uC for 30 s, and 72uC for 30 s. Melting curve analysis (55 to
95uC, increment of 0.11uC/sec) was performed to ensure PCR
specificity. The method described by Pfaffl (66) was employed to
determine the expression fold changes of the target gene in
cultures at each time point post-temperature downshift, compared
to before cold shock (i.e. the reference culture).
Transcriptomic and proteomic data Accession NumbersThe transcriptomic data are available in the ArrayExpress
database (www.ebi.ac.uk/arrayexpress) [43] under accession
number E-MTAB-2010. The mass spectrometry proteomic data
are deposited to the ProteomeXchange Consortium (http://
proteomecentral.proteomexchange.org) via the PRIDE partner
repository [44] with the dataset identifiers PXD000583 and
PXD000573.
Genome Response of E. coli to Temperature Shift
PLOS ONE | www.plosone.org 4 June 2014 | Volume 9 | Issue 6 | e99627

Results and Discussion
Growth of E. coli O157:H7 Sakai upon temperaturedownshift
The growth response of E. coli upon temperature downshift of
exponential phase cultures in a nutrient rich medium was
examined. Specifically, cultures were exposed to a sudden
downshift in temperature from 35uC to either 20uC, 17uC, 14uCor 10uC. It was found that all shifts induced a lag period before
growth resumed at a slower rate than that before the treatment
(Figure 1 and Table 2). The generation times observed at the post-
downshift temperature were consistent with the predictive model
of Ross et al. [45] and the lag time increased with the magnitude of
the shift. However, the RLT response for E. coli showed no
systematic variation across the temperature range tested, indicat-
ing that the amount of ‘‘work’’ the population had to perform to
adjust to each temperature was similar (Table 2). This agrees well
with Mellefont and Ross [15], who demonstrated that shifting
Klebsiella oxytoca cells from a temperature within the normal
physiological range to temperatures outside this range did not
appear to have an effect on RLT. The normal physiological
temperature range of E. coli is estimated to be from approximately
20uC to 38uC [15,46,47].
Molecular response of E. coli O157:H7 Sakai totemperature downshift
To reveal the entire genetic system that operates during the
response of E. coli to an abrupt shift to chill temperature, we
analysed the transcriptional and proteomic response of E. coli
O157:H7 Sakai during exponential growth at 35uC upon a shift to
14uC. Samples were taken for transcriptomic and proteomic
analysis to determine temporal gene and protein expression
profiles of cultures during cold adaptation (30 and 90 min after a
temperature downshift) and in cold-adapted cells which had
resumed exponential growth (160 and 330 min post-temperature
downshift) (Figure 2). Independent samples were then processed
for mRNA, and membrane and soluble proteins as appropriate for
analysis by cDNA microarray and 2D-LC-MS/MS, respectively.
Through multidimensional LC-MS/MS analysis together with
data filtering, a number of protein identifications with high
confidence were detected in total fractions of E. coli at each time
point.
Gene and protein expression profiles at each of these time points
were compared with those of a control culture at 35uC (i.e.
reference sample). The number of differentially expressed genes
and proteins at each time point are shown in Table 1. In the
transcriptomic and proteomic analysis up-regulation was predom-
inant over down-regulation at all time points, consistent with a
previous time course study examining the genome-wide transcrip-
tional alterations in Vibrio parahaemolyticus upon sudden tempera-
ture downshift [48]. A comprehensive list of the differentially
expressed genes and proteins, as well as their log2expression ratio
and a comparison to previously published data is given in Table S1
in File S1. A low level of correlation was observed between the
transcriptomic and proteomic profiles generated at each time
point, with between 0.4 and 6.1% of those genes significantly
differentially expressed at each time point also significantly
differentially expressed as proteins (Figure S1 in File S1). Indeed,
clustering analysis of the T-profiler analysis of the transcriptomic
and proteomic data revealed that the two datasets formed two
discrete clusters (Figure 3). Within each dataset expression profiles
clustered with time, clearly displaying a difference in the
expression response during cold adaptation in lag phase (30 and
90 min) and the exponential phase of growth (160 and 330 min).
The discordant alignment of transcript and protein levels is in
keeping with findings from our previous study investigating the
integrated transcriptomic and proteomic physiological response of
E. coli Sakai to steady-state conditions relevant to low temperature
and water activity conditions experienced during carcass chilling
in Australia [11], as well as several other published reports
[49,50,51,52]. In light of the low level of correlation between the
transcriptomic and proteomic datasets, qRT-PCR was employed
to validate the microarray results of representative genes showing
significant (P value #0.01) up-regulation or down-regulation. The
results of the qRT-PCR experiments confirmed the microarray
results (Table 3). Several possible explanations have been proposed
Figure 1. Growth response of exponential phase E. coli O157:H7 Sakai to a rapid downshift in temperature. The growth response wasmonitored by measuring the optical density of cultures shifted from 35uC (D) to 20uC (&), 17uC (%), 14uC (N) and 10uC (#). The time at which coldshock was applied is indicated by a dotted line. Data points represent means 6 standard deviations of at least two independent replicates.doi:10.1371/journal.pone.0099627.g001
Genome Response of E. coli to Temperature Shift
PLOS ONE | www.plosone.org 5 June 2014 | Volume 9 | Issue 6 | e99627

for the low level of correlation between transcript and protein
levels, including posttranslational regulation and differences in the
turnover rate of mRNA versus the half-lives of encoded proteins.
However, while there was not a high level of concordance in the
genes and proteins differentially expressed (Table 1), a number of
trends were observed in the expression patterns of predefined
functional categories of genes/proteins and metabolic pathways
(Figure 3). Thus while the transcriptomic and proteomic data give
a broad and consistent view of the changes occurring, discrepan-
cies exist at the micro level and the reasons for this remain to be
determined.
We observed the universal up-regulation of five genes and
proteins at every time point. Within the CspA family (from CspA-
CspI); CspA, CspB, and CspG are termed the major cold shock
proteins in E. coli on the basis of their levels of induction [53]. In
our study cspG and CspG were universally up-regulated at every
time point by an average of 5.09- and 6.62-log2 fold, respectively.
Increased production of CspG has been reported to be essential for
bacterial cells to resume growth at low temperature [54,55].
However, our findings are inconsistent with a previous report that
CspG is up-regulated during the acclimation phase upon cold
shock and subsequently down-regulated when cells have become
cold-adapted [56]. This discrepancy may be due to strain variation
in the response of the O157:H7 strain used in this study and the
K-12 strain in the previously published report [56]. Of the
remaining cold shock proteins we observed up-regulation of cspA
(30, 90, 330 min) and CspA (90 mins onwards), cspC (330 min)
and cspH (30, 90, 160, 330 min). While CspG may have
overlapping functions with CspA, it is speculated that CspG may
have specific function(s), as it is induced within a narrower low
temperature range compared to CspA [57]. It is thought [57] that
CspG may be required for transcription and/or DNA replication
as a DNA chaperone. In our study, from the level of induction of
CspG, it appears that this protein fulfils a unique role in enabling
adaptation and growth of E. coli at 14uC. Amongst the other genes
and proteins universally up-regulated are those previously
reported to be cold-induced including an ATP-dependent helicase
(csdA/CsdA) [58] and exoribonuclease R (rnr/Rnr) [59]. Phos-
phoethanolamine transferase (eptB/EptB) was also universally up-
regulated and may have role(s) in envelope stress, as its expression
is activated by RpoE [32,60,61]. The continuous up-regulation of
these transcripts and proteins across the entire time-course
indicates their importance beyond the initial phase of the
acclimation period. Surprisingly, we also observed the persistent
up-regulation of the universal stress protein (uspE/UspE). While
cold shock has previously been shown to repress UspACDE
expression [62], in this study UspE is suggested to have an
important role during growth at low temperature. In the current
study UspA (30, 90, 160, 330 min) and uspC (30, 90, 330 min)
were also up-regulated (Table S1 in File S1). Strain variation
between the K-12 MC4100 strain used in the previous study [62]
and the O157:H7 strain used in the current study, may account for
this difference in response.
The cluster analysis (Figure 3) did not reveal a close similarity
between the expression response profiles elicited by E. coli during
exponential phase growth (160 and 330 min) and the expression
Table 2. The growth response of exponential phase E. coli O157:H7 Sakai upon an abrupt temperature downshift from 35uC toeither 20uC, 17uC, 14uC or 10uC; as determined by optical density.
Temperature downshift Generation time (h) Lag time (h) Relative lag time (RLT)
206C 1.29 0.30 0.23
176C 1.93 0.84 0.44
146C 3.28 1.95 0.59
106C 9.01 3.81 0.42
doi:10.1371/journal.pone.0099627.t002
Figure 2. Time series of E. coli O157:H7 Sakai during a temperature downshift from 356C to 146C. Solid arrows indicate the times atwhich samples were harvested for cDNA microarray and 2D-LC-MS/MS analyses. The time at which temperature downshift was applied is indicatedby a dotted line. Data points represent means 6 standard deviations of at least two independent replicates.doi:10.1371/journal.pone.0099627.g002
Genome Response of E. coli to Temperature Shift
PLOS ONE | www.plosone.org 6 June 2014 | Volume 9 | Issue 6 | e99627
response observed in our previous study monitoring the growth of
E. coli during exponential growth at the same temperature (14uCaw 0.985) [11]. This may be accounted for, in part, by the
difference in water activity in the current study (aw 0.993) and the
previous study (aw 0.985) [11]. However, broad similarities were
revealed with all proteomic expression profiles across all time
points clustering (Figure 3) with the proteomic response of E. coli
during exponential growth at 14uC aw 0.985 [11].
Figure 3. Hierarchical clustering analysis of the transcriptomic and proteomic data. The heat map represents the T-values calculated forthe transcriptomic (T) and proteomic (P) profiles based on JCVI CMR functional categories. Within the dendrogram transcriptomic and proteomicprofiles are clustered along with transcriptomic and proteomic profiles of exponentially growing cultures at 14uC aw 0.985 [11]. Positive T-values arerepresented in red, negative T-values are represented in green and, grey indicates that the T-value has not been determined.doi:10.1371/journal.pone.0099627.g003
Genome Response of E. coli to Temperature Shift
PLOS ONE | www.plosone.org 7 June 2014 | Volume 9 | Issue 6 | e99627

DNA metabolismThe requirement to conserve energy is an important feature of
all stress responses [36,63,64]. The implementation of the RpoS-
dependent general stress response has previously been shown to
reduce energy expenditure through the repression of genes
involved in growth, cell division, and protein synthesis [36]. The
T-profiler analysis revealed significant down-regulation of proteins
involved in DNA replication, recombination, and repair at all time
points, except at 90 min after imposition of the cold stress (Table
S2 in File S1). In keeping with previous studies we also observed a
greater than 1-log2 fold down-regulation in the expression of a
number of proteins involved in these functions after 30 (TopA,
MutS), 90 (MutS), 160 (TopA, StpA, MutS) and 330 (MutS) min of
the imposition of cold stress [10,65,66]. Interestingly, the DNA
mismatch repair gene/protein mutS/MutS was down-regulated at
every time point and was amongst the 20 most highly down-
regulated proteins at 30 and 160 min. MutS expression decreases
in stationary phase and this pattern of regulation has been
proposed to reflect a mechanism in which cells coordinate the
amount of MutS with decreases in the level of DNA replication
[67]. The reduction in MutS expression reflects the changes in the
expression of genes and proteins involved in transcription and
translation. Interestingly, it has previously been suggested [68] that
down-regulation of MutS may contribute significantly to increased
mutation or homologous recombination within populations in
stressed environments. We did not, however, observe increased
expression of other genes and proteins of the very short patch
(VSR) mismatch repair system, to compensate for down-regulation
of MutS (Table S1 in File S1). Likewise, increased expression of
mug/Mug and mutY/MutY was not observed (Table S1 in File S1).
Transcription and translationAs the incubation temperature after temperature shift de-
creased, the corresponding growth rate decreased, and so should
the rate of protein synthesis, DNA replication and the need for
nucleotides. In addition, one of the major physiological effects of
cold temperature is the stabilization of secondary structures of
RNA and DNA, which may affect the efficiencies of translation,
transcription, and replication [69]. In keeping with this, we
observed negative T-values for genes involved in tRNA aminoa-
cylation at every time point, genes (90 and 160 min) and proteins
(90, 160 and 330 min) involved in tRNA and rRNA base
modification, genes involved in the synthesis and modification of
ribosomal proteins (30 and 330 min), genes involved in 2’
deoxyribonucleotide metabolism (30, 90, 160 and 330 min), genes
involved in the salvage of nucleosides and nucleotides (30, 90, 160
and 330 min) and, genes (30, 90 and 160 min) and proteins
(90 min) involved in purine ribonucleotide biosynthesis (Table S2
in File S1). In keeping with the down-regulation of genes and
proteins involved in purine ribonucleotide biosynthesis, we also
observed down-regulation of genes (30, 90, 160 min) and proteins
(30, 160 and 330 min) involved in folic acid biosynthesis (Table S2
in File S1). Folates are essential cofactors that facilitate the transfer
of one-carbon units from donor molecules into important
biosynthetic pathways leading to methionine, purine, and pyrim-
idine biosynthesis.
Carbohydrate catabolism and energy generationGenes involved in glycolysis (30 and 90 min), gluconeogenesis
(30 min), the pentose phosphate pathway (30 min), mixed acid
fermentation (30 min), and oxidative phosphorylation (30, 90 and
160 min) were down-regulated (Table S3 in File S1). In contrast to
the transcriptomic results, the proteomic data revealed significant
increased abundance of proteins involved in oxidative phosphor-
ylation at every time point, indicating a perturbation in respiratory
balance (Table S3 in File S1). Indeed a previous report on the
transcriptomic and proteomic response of Bacillus subtilis to growth
at low temperature, reports a reduction in oxidative phosphory-
lation in line with a reduced energy demand during slow growth at
low temperature [70].
An initial general reduction in the expression of genes involved
in carbohydrate catabolism also parallels the down-regulation of
sugar transporters (see below).
TCA cycle and glyoxylate bypass genes were up-regulated at
every time point and this was mirrored in the proteomic data at
160 and 330 min (Table S3 in File S1). This corresponds with
previous findings, in which temperature downshift resulted in
increased expression levels of genes encoding enzymes in the TCA
cycle to compensate for the reduction in activity of TCA cycle
enzymes at lower temperatures [71]. However, oxygen consump-
tion rates have also been shown to be lower at lower temperatures
Table 3. Gene expression fold changes resulting from microarray analysis and qRT-PCR for three selected genes.
Time (min after the shift) Gene Microarray fold changea qRT-PCR fold change
30 nuoC 22.29 21.5560.17
fiu NDEb 1.0060.20
spy 2.05 2.2060.15
90 nuoC 23.20 23.3360.09
fiu 26.75 23.5060.14
spy 4.12 4.4560.31
160 nuoC NDE 1.3160.28
fiu 29.84 23.3060.05
spy 4.00 4.6060.32
330 nuoC NDE 1.0460.12
fiu 22.60 22.6160.67
spy 4.52 2.6260.49
aMicroarray results are expressed in fold change for ease of comparison.bNDE, not differentially expressed.doi:10.1371/journal.pone.0099627.t003
Genome Response of E. coli to Temperature Shift
PLOS ONE | www.plosone.org 8 June 2014 | Volume 9 | Issue 6 | e99627

and it has been suggested that this points towards a reduced
carbon flux through the TCA cycle and a reduced electron flux
through the electron transport pathway [71]. In the current study,
the T-profiler analysis of the transcriptomic study also revealed
down-regulation of electron transport-associated genes at 30 mins
(ykgC, yddW, dusC, ccmE, nuoBCF, hmp, uxuB), 90 mins (kefF, ykgC,
cydAB, trxB, yddW, sufBD, yedF, yeeD, dusC, ccmCEFH, napGB, yfaE,
nuoABCEFHIJKLM, hmp) and 160 mins (cydAB, cydC, nuo-
HIJKLMN, ccmCEFH, trxB, ndh, yddW, yeeD, dusC, napC, yfaE,
hmp, yigI, ycaO). Real-time PCR was used to validate these results
and down-regulation of nuoC was also observed at 30 and 90 mins
(Table 3).
Amino acid biosynthesisThe aspartate and pyruvate biosynthetic pathways were
negatively regulated after a shift to 14uC (Table S2 in File S1),
correlating with a previous report on the transcriptional response
of E. coli to temperature downshift [71]. In addition, genes
encoding tRNA synthetases were down-regulated at 30 mins (aspS,
argS, gltX, lysS, glyS), 90 mins (tyrS, pheS, aspS, argS, gltX, alaS, lysS,
trpS, yadB), 160 mins (pheST, argS, gltX, lysS, lysU, yadB) and
330 mins (lysU, yadB). Analysis of the proteome only revealed
significant down-regulation of prolyl-tRNA synthetase (ProS) at
330 min. As has previously been suggested in a transcriptional
analysis of the cold shock response of B. subtilis [65], in the current
study the slower growth rate induced after a shift to 14uC resulted
in a general reduction in protein synthesis which may lead to an
oversupply of amino acids and feedback inhibition of genes
associated with amino acid biosynthesis (Table S2 in File S1).
Activation of specific amino acid biosynthesis pathways or
amino acid supplementation can lead to tolerance to certain
environmental stresses [72]. In a report examining the thermal
adaptation of Exiguobacterium sibiricum, a psychrotrophic bacterium
isolated from 3 million year old Siberian permafrost that grows
from 25uC to 39uC, it was demonstrated that cold stress leads to
flux and pool size redistribution throughout the entire network of
amino acid metabolism [73]. Rodrigues et al. [73] suggested that
the reason for a change in cell metabolism may be to synthesize
more ‘flexible’ proteins that can function at lower temperatures. In
the current study, the positive regulation of specific amino acid
biosynthesis pathways was in keeping with previous reports of the
response of E. coli to chill temperature with positive T-values for
the histidine family (90 and 330 min) [11,63] and positive T-values
for amino acid biosynthesis in the aromatic amino acid family at
90 min with the significant up-regulation of genes involved in the
biosynthesis of phenylalanine (pheA, aroG), tyrosine (pheA), trypto-
phan (trpEDCBA) and chorismate (aroL, aroE) [11]. Deciphering the
role histidine and aromatic amino acids play under these
conditions would provide insight into whether the synthesis of
these amino acids is vital for adaptation and growth at chill
temperature.
Central intermediary metabolismWe observed negative T-values and greater than a 1-log2 fold
down-regulation of genes involved in sulfur metabolism at 30 mins
(sseA, cysI, cysDN), 90 mins and 160 mins (cysDNC, cysI) (Table S2
in File S1). This appears related to reduction in the synthesis of the
sulfur containing amino acids; such as cysteine, as we also noted
down-regulation of cysK (30 and 90 min) encoding the cysteine
synthase A which carries out the second step in the pathway of
cysteine biosynthesis. However, this contradicts previous findings
of cold shock induction of cysK in E. coli at 15uC [10]. Strain
variation between the K-12 JM83 strain used in the previous study
[10] and the O157:H7 strain used in the current study, may
account for this difference in response.
Transport and binding proteinsCold-induced remodelling of the bacterial cell envelope can
affect the transport/binding functions that are essential for the
accumulation of nutrients against a concentration gradient, as well
as for the excretion of various end products of metabolism [48].
Cold shock has been shown to result in extensive alterations of the
cell envelope structure and transmembrane transporting functions
[48]. In keeping with this, we observed numerous changes in
expression patterns of genes and proteins involved in transport and
binding (Table S2 in File S1). Of interest was an increase in the
expression pattern at all time points of proteins involved in the
transport of amino acids, peptides and amines (Table S2 in File
S1). We also observed greater than a 2-log2 fold induction of
proteins involved in the transport of iron, the osmoprotectants
proline and glycine betaine, and uncharacterised substrates at
30 mins (FhuC, YojI), 90 mins (FhuC, YojI, YadG, ProV),
160 mins (FhuC, YojI, ProVW) and 330 mins (FhuC, YojI,
ProVW, YadG, ProP, YehZ). The chill stress response in bacteria
includes the uptake and synthesis of compatible solutes [74,75,76]
and proline transporters have previously been shown to be up-
regulated upon exposure of E. coli to reduced temperature [71].
A contrasting expression pattern was observed for genes and
proteins involved in the transport of cations and iron-carrying
compounds, with the down-regulation of genes (90, 160 and
330 min) and up-regulation of proteins (30, 90, 160 and 330 min)
(Table S2 in File S1). The proteomic data revealed greater than a
2-log2 fold increase in expression of a putative outer membrane
receptor for iron transport (Fiu) and a magnesium ion transporter
(CorA) at every time point, while the transcriptomic data displayed
greater than a 1-log2 fold down-regulation of fiu (90, 160 and
330 min) and corA (90 min). Real-time PCR was employed to
validate these results and down-regulation of fiu was also observed
at 90, 160 and 330 min (Table 3). The reason for the significant
difference in the expression pattern of these elements in the
transciptome and proteome remains to be determined.
The transcriptomic data also revealed decreased expression of
genes involved in anion transport at 30, 90 and 160 min (Table S2
in File S1). Genes involved in the transport of sulfate, gluconate,
inorganic phosphate and arsenite were down-regulated by greater
than 1-log2 fold at 30 mins (pstSCA, cysPUWA, cysZ, gntU), 90 mins
(arsB, pstSCAB, cysPUWA, cysZ, gntU), 160 mins (arsB, pstSCAB,
cysPUWA, gntU) and 330 mins (arsB, pstSCA).
Negative regulation was observed in the T-profiler analysis for
genes involved in the transport of carbohydrates, organic alcohols
and acids at 30, 90 and 330 min (Table S2 in File S1). The
majority of those genes with greater than a 1-log2 fold reduction in
expression at 30 mins (manXYZ, malE, treB, uhpA, ptsG, ptsHI, gntU,
yhjX, mtlA, mglA), 90 mins (manXYZ, malE, treB, uhpABC, ptsG, ptsHI,
gntU, yhjX, mtlA, focA, etk, fadL, rbsA), 160 mins (manXYZ, treB,
uhpABC, ptsG, ptsHI, gntU, mtlA, dcuA, fadL, rbsA) and 330 mins
(manX, malE, treB, uhpABC, uhpT, malF, dcuA) were involved in the
transport of sugar (i.e. mannose, maltose, trehalose, glucose,
galactose, ribose). The down-regulation of these sugar transport
genes coincides with the general down-regulation of genes
involved in carbohydrate catabolism (Table S2 in File S1).
Genes involved in the transport of nucleosides, purines and
pyrimidines were down-regulated at 30 and 90 min (Table S2 in
File S1). However Tsx, which is involved in the high affinity
uptake of ribo- and deoxy-nucleosides across the outer membrane,
was amongst the 20 most highly up-regulated proteins at every
time point.
Genome Response of E. coli to Temperature Shift
PLOS ONE | www.plosone.org 9 June 2014 | Volume 9 | Issue 6 | e99627

Phospholipid and fatty acid metabolismExposure to cold shock or growth at low temperature has effects
on the outer membrane lipid composition that are beneficial to the
cell [5]. Palmitoleate is not present in lipid A isolated from E. coli
cells grown above 30uC, but has been shown to comprise ,11% of
the fatty acid acyl chains of lipid A in cells grown at 12uC [77].
While not observed in the proteomic analysis, in the current study
the palmitoleoyl transferase encoding gene lpxP displayed an
average increase in expression of 3.60-log2 fold across all time
points.
A decrease in growth temperature leads to an increased
proportion of unsaturated fatty-acid residues in microbial lipids,
which results in a lowering of the melting point of the lipids and
preserves membrane fluidity that is necessary for survival and
growth [5]. However, in the current study the pattern of
expression of genes and proteins involved in fatty acid metabolism
was not significantly affected upon temperature shift (Table S2 and
S3 in File S1). The ratio of saturated to unsaturated fatty acids is
controlled by the relative levels of FabA and FabB, with
overproduction of FabA leading to an increase in synthesis of
saturated fatty acids [78]. In keeping with a previous report [71],
the expression level of fabA/FabA remained unchanged after
temperature shift for the entire time course. Contrasting with that
report [71] we did not observe a significant increase in expression
of fabB/FabB. However, sfa displayed an average increase in
expression of 3.22-log2 fold across every time point. While not
observed in our proteomic data, expression of Sfa results in
increased biosynthesis of unsaturated fatty acids, presumably by
increasing the activity of FabB [79].
Diffusion rates are reduced at low temperature and the outer
membrane diffusion pore protein, OmpF, is expressed at an
elevated level in the cold compared to optimal growth temperature
[8]. At the same time the amount of OmpC is reduced [8]. In our
study ompF/OmpF was up-regulated at 330 min (Table S1 in File
S1). However, we also observed up-regulation of OmpC at 90 and
330 min (Table S1 in File S1).
Bacterial chemotaxis and motilityGenes involved in chemotaxis and motility were significantly
down-regulated, as revealed by significant negative T-values at 90,
160 and 330 min (Table S2 and S3 in File S1). This coincides with
our previous findings, that chemotaxis and motility genes and
proteins are down-regulated during balanced growth at 14uC [11].
The down-regulation of flagellar genes has also been reported in E.
coli during shift to incubation temperatures of 15uC [80] and 16uC[63], as well as in B. subtilis during growth at low temperature [70].
Expression of genes encoding flagella is negatively controlled by
the master regulator RpoS [35] and we also observed an average
1.33-log2 fold increase in expression of rpoS from 90 min onwards.
However, these findings are at odds with the general increase in
expression of uspE/UspE and its essential role in motility [81] and
may suggest another physiological role for UspE during adaptation
and growth at 14uC. Indeed, UspE has previously been suggested
to play a crucial role in oxidative stress resistance [81].
The down-regulation of chemotaxis and motility genes in the
current study may be due to energy deficiency, consistent with a
previous study [63] proposing that decreased cell motion could
indicate energy deficiency as flagella motility requires a steep
proton gradient between the periplasmic space and the cytoplasm.
This is inconsistent with the observation of significant up-
regulation of several methyl-accepting chemotaxis proteins
(MCPs); which are involved in sensing chemical attractants that
are sources of carbon and energy. E. coli possesses four MCPs and
we observed significant up-regulation of Tar (30 min), Tsr (30, 90
and 160 min) and Tap (90, 160 and 330 min) (Table S1 in File
S1). Tar mediates taxis toward aspartate and maltose, while the
primary attractant detected by Tsr is serine and Tap is required
for taxis toward dipeptides and pyrimidines [82]. The up-
regulation of Tar, Tsr and Tap contradicts previous reports that
their genes are negatively regulated by RpoS [83]. This finding
suggests other regulatory factors may override the control of RpoS
over Tar, Tsr and Tap.
Major regulons and stress responsesThe transcriptomic data revealed an initial increase in the
expression of transcription factors at 30 min (Table S2 in File S1),
with eight genes encoding transcription factors showing greater
than a 1-log2 fold increase in expression. These included a number
of major stress response sigma factors (rpoE, rpoN, rpoH).
Genes and proteins of the RpoS regulon [34,35,36] were up-
regulated from 90 min onwards (Table S4 in File S1). This is
consistent with low temperature induction of RpoS under steady
state conditions previously reported [11,84]. Nineteen genes
exhibited greater than a 1-log2 fold increase in expression from
90 min onwards and included genes involved in the osmotic stress
response (osmY), acid response (gadX), biofilm formation (bolA), cell
wall biogenesis (erfK), encoding an inner membrane protein (yqjE),
predicted outer membrane protein (ybaY), hypothetical proteins
(yahO, yaiA, yccJ, ydiZ, yodC, yqjCD, yhhA, ytfK, ygaM) and putative
and predicted transcriptional regulators (yiaG, yjbJ, nsrR). In
contrast, only two proteins of the RpoS regulon displayed greater
than a 1-log2 fold increase in expression from 90 min onwards
including an osmotic stress response protein (OsmY) and a
putative outer membrane protein (YeaY).
The RpoE extracytoplasmic stress response regulon was initially
up-regulated, as revealed by a positive T-value in the transcrip-
tomic data at 30 min (Table S4 in File S1). The rpoE gene
encoding the RpoE sigma factor displayed an average increase in
expression of 1.97-log2 fold across the 30 and 90 min time points.
Of those genes of the RpoE regulon [32] 16 were up-regulated at
30 min including rpoE and its regulators (rseABC); the nitrogen-
related (rpoN) and heat shock (rpoH) sigma factors; genes associated
with lipid A biosynthesis (ddg), zinc export (zntR), asparagine
metabolism (ansB) and phosphopantetheinyl transfer (yieE); a stress-
inducible periplasmic protease (degP); a helicase (lhr); regulators
involved with pyrimidine metabolism, purine degradation and pH
homeostasis (rutR); fatty acid biosynthesis (fabR), and a gene
encoding an outer membrane protein (yidQ). We also noted that
amongst the 20 most highly up-regulated proteins at all time points
was a putative outer membrane lipoprotein of the RpoE regulon
(YeaY). In keeping with this, Polissi et al. [69] reported that rpoE
exhibited an early transient increase in mRNA abundance 1 h
after cold shock at 16uC. RpoE is believed to be activated by, and
to respond to, misfolded proteins in either the periplasm or outer
membrane [85]. However, it remains to be determined how the
RpoE regulatory pathway is involved in low temperature
adaptation in response to cold induced extracytoplasmic stress
[69].
The rpoH gene was up-regulated across all time points by an
average of 1.68-log2 fold. However, genes (30 and 90 min) and
proteins (30 min) of the RpoH regulon [33] were down-regulated
(Table S4 in File S1). At 30 and 90 min, seven genes encoding
heat shock chaperones (dnaKJ, htpG, ppiB, grpE, groEL) were down-
regulated by over 1-log2 fold. Genes and proteins of the RpoH
regulon which were commonly down-regulated included htpG (30,
90 and 330 min) and HtpG (330 min), and prlC (90 min) and PrlC
(330 min). This is not surprising in light of the role of HtpG as a
heat shock chaperone and the fact that PrlC is believed to be
Genome Response of E. coli to Temperature Shift
PLOS ONE | www.plosone.org 10 June 2014 | Volume 9 | Issue 6 | e99627
involved in the onset of DNA replication [86]; for which we see a
general down-regulation in the proteomic data (30, 160 and
330 min; Table S2 in File S1). While it has previously been
observed that genes encoding heat shock-inducible proteins and
molecular chaperones (htpG, groEL, groES, ppiA) were up-regulated
following cold shock, this induction was transient [10]. Interest-
ingly, it has previously been shown that the growth arrest of E. coli
upon cold shock appeared to be associated with inactivation of the
GroELS chaperone system [87].
Genes of the CpxRA regulon, which are involved in the
envelope stress response and in the control of the biogenesis of
adhesive structures such as pili [31], were up-regulated at every
time point (Table S4 in File S1). However, this was not mirrored in
the proteomic data. We observed the up-regulation of three genes
by over 1-log2 fold at every time point, including genes involved in
spheroblast formation (spy), regulation of the extracytoplasmic
stress response (yihE; [88]) and peptidoglyan biosynthesis (ycfS).
Real-time PCR was used to validate these results and up-
regulation of spy was also observed at every time point (Table 3).
The Cpx system also displayed greater than a 1-log2 fold increase
in expression (cpxR; 90, 160 min, cpxA/CpxA; 90, 160, 330 min).
Other signs of envelope stress were indicated by the greater than
1-log2 fold induction of degP, encoding a stress-inducible periplas-
mic protease (30, 90, 160 min). In line with the general down-
regulation of chemotaxis and motility genes (Table S2 and S3 in
File S1), ydeH was up-regulated an average of 1.94-log2 fold from
90 min onwards. The ydeH gene encodes a diguanylate cyclase
that regulates motility and biofilm formation and represses
swimming behaviour, reduces the abundance of flagella and
abolishes the appearance of pili-like structures [89].
The T-profiler analysis revealed a significant positive T-value
for the Rcs regulon [37], which controls the biosynthesis of
extracellular polysaccharide capsule or colanic acid, in the
transcriptomic study at 160 and 330 min (Table S4 in File S1).
A number of genes and proteins involved in colanic acid
biosynthesis had at least a 1-log2 fold increase in expression at
30 (ugd) and 330 (ugd, cpsB, gmd, wcaG, GalK) min. Genes and
proteins known to be induced by the Rcs regulon were amongst
the most highly up-regulated under all steady-state conditions in
our previous study [11]. The present findings are also consistent
with the report of Hagiwara et al. [37] concerning induction at low
temperatures.
The RpoS-dependent otsA/B genes were also up-regulated on
average by 1.99-log2 fold in the transcriptomic study at 160 and
330 min (Table S1 in File S1). This is in keeping with the
induction of otsA/otsB and activation of trehalose synthesis during
cold shock reported by Kandror et al. [90] and Moen et al. (49).
Results from our steady state study [11] also revealed an up-
regulation in the expression of trehalose biosynthetic enzymes
(otsAB/OtsAB) under all conditions at 14uC. As a compatible
solute, trehalose is thought to enhance cell viability when the
temperature is reduced to near freezing [7,90].
We observed a number of genes within the Acid Fitness Island
(AFI) up-regulated by greater than l-log2 fold at 30 mins (hdeD,
gadE, gadX), 90 mins (hdeD, gadE, gadX), 160 mins (hdeD, gadE, gadX,
dctR, yhiD, hdeB) and 330 mins (dctR, hdeB, gadE, gadX). While we
did not see enhanced representation of AFI proteins expressed
across each of the time points, the ‘‘starvation lipoprotein’’ Slp was
up-regulated by 3.46- and 5.05-log2 fold at 90 and 330 min,
respectively. This suggests, as discussed earlier, that growth at
14uC may result in energy deficiency. We previously observed
significant up-regulation of glutamate decarboxylase genes during
exposure to cold stress under steady state conditions [11], as have
others [9,80]. In addition, genes of the glutamate-dependent gad
system were up-regulated by greater than 1-log2 fold under all
steady state conditions at 14uC in our previous study [11].
Polyamines (e.g., putrescine and spermidine) are known to play an
important role during acid stress [91], and in the present study the
transcriptomic data revealed up-regulation of genes of the opp
operon (oppABCDF) that encodes a polyamine-induced oligopep-
tide ABC transport system at 90 min (oppACDF) and 160 min
(oppAC). While the proteomic study revealed up-regulation at
90 min (OppB) and 330 min (OppBD).
Interestingly, amongst the 20 most highly down-regulated
proteins was hydroperoxidase I (KatG) at 90, 160 and 330 min.
A number of genes previously reported to be amongst the most
highly up-regulated in response to exposure to oxidative stress
were also amongst those down-regulated at 30 mins (dps, grxA,
cysK, ibpA, katG), 90 mins (yaaA, ahpF, dps, grxA, sufABC, yeeD, cysK,
ibpA, katG), 160 mins (ahpF, grxA, sufC, yeeD, ibpA, katG) and
330 mins (grxA, sufC, ibpA, katG) [92]. Indeed, in other studies cold-
shocked E. coli and Salmonella typhimurium were reported to be
sensitised to oxidative stress [93].
While we did not see significant up-regulation of relA/RelA or
spoT/SpoT across the time course, the transcriptomic data
displayed some of the hallmarks of a response mediated by
ppGpp. In keeping with the stringent response elicited by E. coli in
the transcriptomic study by Durfee et al. [64], we observed up-
regulation of the RpoS, RpoE and RpoH regulons and the
histidine biosynthesis pathway, and the down-regulation of such
functions as protein synthesis, glycolysis, gluconeogenesis, respira-
tion, motility and chemotaxis. This is not surprising, given that a
reduced growth rate is a consequence of the imposed stresses.
Conclusions
This study offers an empirical understanding of the growth
kinetics and molecular response of exponential phase E. coli
O157:H7 Sakai to an abrupt temperature downshift. Shifting cells
from 35uC to a lower temperature (i.e. 20uC, 17uC, 14uC or 10uC)
resulted in a lag before growth resumed at a rate typical of the new
temperature. Lag times appeared to increase with respect to the
magnitude of the shift, while generation time responded to the
post-shift in temperature as expected. Of particular interest, the
RLT response of E. coli to cold shock displayed little variation
across the tested temperature range (10uC: 0.42, 14uC: 0.59, 17uC:
0.44, 20uC: 0.23), indicating that E. coli undertakes a similar
amount of ‘‘work’’ to adapt to each of these temperatures.
Assessment of the global transcriptomic and proteomic response of
E. coli O157:H7 Sakai to an abrupt temperature downshift from
35uC to 14uC revealed a general decrease in the global expression
of genes and proteins involved in DNA replication, transcription,
translation and protein synthesis. This response parallels the
observed decrease in growth rate of E. coli upon temperature
downshift, and presumably also the necessity for saving and
reallocating energy for repairing damage to the cell. Numerous
changes occurred in the expression pattern of genes and proteins
involved in transport and binding functions to contend with the
effects of cold temperature on the bacterial cell envelope. The
selective induction of specific amino acid biosynthetic pathways
involved in histidine and the aromatic amino acid biosynthetic
families also suggests a role for these amino acids in adaptation to;
and growth under, chill temperature.
The expression pattern of the global stress response regulons
provided insight into their roles, with sustained expression of the
RpoS-dependent general stress response pathway and an initial
transient induction in the RpoE-dependent extracytoplasmic stress
response pathway at 30 min, when cultures were in the lag phase,
Genome Response of E. coli to Temperature Shift
PLOS ONE | www.plosone.org 11 June 2014 | Volume 9 | Issue 6 | e99627

and adapting to the conditions of growth. The results of this study
highlight those global alterations in genome expression that may
enable adaptation to, and growth under, conditions of chill
temperature stress and will inform the development of more
targeted approaches for the food industry to combat this pathogen.
Supporting Information
File S1 Table S1, Comparison of differentially ex-pressed genes and proteins in Escherichia coliO157:H7 Sakai during exposure to temperature shift.Table S2, T-profiler analysis of transcriptomic and proteomic data
based on JCVI CMR functional categories. Table S3, T-profiler
analysis of transcriptomic and proteomic data based on Ecocyc
and KEGG functional categories. Table S4, T-profiler analysis of
transcriptomic and proteomic data based on major regulons.
Figure S1, Venn diagram displaying a comparison of differentially
expressed genes and proteins in Escherichia coli O157:H7 Sakai
during exposure to temperature shift.
(XLSX)
Acknowledgments
We would like to thank Ian Jenson, Manager of the Food Safety and
Strategic Science program, from Meat and Livestock Australia for his
support and guidance on the project. We also thank Edwin Lowe from
Central Science Laboratory (University of Tasmania, Hobart, Australia)
for expert technical support in 2D-LC/MS/MS analysis.
Author Contributions
Conceived and designed the experiments: TR CK TK. Performed the
experiments: CK TK. Analyzed the data: TK CK. Contributed reagents/
materials/analysis tools: TK. Wrote the paper: TK CK KG JPB TR.
References
1. Rangel JM, Sparling PH, Crowe C, Griffin P, Swerdlow DL (2005)
Epidemiology of Escherichia coli O157:H7 outbreaks, United States, 1982–
2002. Emerg Infect Dis 11: 603–609.
2. Cagney C, Crowley H, Duffy G, Sheridan JJ, Brien SO, et al. (2004) Prevalence
and numbers of Escherichia coli O157:H7 in minced beef and beef burgers from
butcher shops and supermarkets in the Republic of Ireland. Food Microbiol 21:
203–212.
3. Elder RO, Keen JE, Siragusa GR, Barkocy-Gallagher GA, Koohmaraie M,
et al. (2000) Correlation of enterohemorrhagic Escherichia coli O157 prevalence in
feces, hides, and carcasses of beef cattle during processing. Proc Natl Acad Sci
USA 97: 2999–3003.
4. McClure P (2000) The impact of E. coli O157 on the food industry.
World J Microbiol Biotechnol 16: 749–755.
5. Russell NJ (2002) Bacterial membranes: the effects of chill storage and food
processing. An overview. Int J Food Microbiol 79: 27–34.
6. Ingraham JL, Marr AG (1996) Effect of temperature, pressure, pH, and osmotic
stress on growth. In: Neidhardt FC, Curtiss III R, Ingraham JL, Lin ECC, Low
KB, et al., editors. Escherichia coli and Salmonella: cellular and molecular biology.
2nd ed. Washington, D.C.: American Society for Microbiology. pp. 1570–1577.
7. Phadtare S (2004) Recent Developments in Bacterial Cold-Shock Response.
Curr Issues Mol Biol 6: 125–136.
8. Weber MHW, Marahiel MA (2003) Bacterial cold shock responses. Sci Prog 86:
9–75.
9. Allen KJ, Lepp D, McKellar RC, Griffiths MW (2008) Examination of Stress
and Virulence Gene Expression in Escherichia coli O157:H7 Using Targeted
Microarray Analysis. Foodborne Pathog Dis 5: 437–447.
10. Phadtare S, Inouye M (2004) Genome-Wide Transcriptional Analysis of the
Cold Shock Response in Wild-Type and Cold-Sensitive, Quadruple-csp-Deletion
Strains of Escherichia coli. J Bacteriol 186: 7007–7014.
11. Kocharunchitt C, King T, Gobius K, Bowman JP, Ross T (2012) Integrated
Transcriptomic and Proteomic Analysis of the Physiological Response of
Escherichia coli O157:H7 Sakai to Steady-state Conditions of Cold and Water
Activity Stress. Mol Cell Proteomics 11: 1–16.
12. Watanabe H, Wada A, Inagaki Y, Itoh K, Tamura K (1996) Outbreaks of
enterohaemorrhagic Escherichia coli O157:H7 infection by two different genotype
strains in Japan, 1996. Lancet 348: 831–832.
13. Hayashi T, Makino K, Ohnishi M, Kurokawa K, Ishii K, et al. (2001) Complete
Genome Sequence of Enterohemorrhagic Escherichia coli O157:H7 and Genomic
Comparison with a Laboratory Strain K-12. DNA Res 8: 11–22.
14. Mellefont LA, McMeekin TA, Ross T (2003) The effect of abrupt osmotic shifts
on the lag phase duration of foodborne bacteria. Int J Food Microbiol 83: 281–
293.
15. Mellefont LA, Ross T (2003) The effect of abrupt shifts in temperature on the lag
phase duration of Escherichia coli and Klebsiella oxytoca. Int J Food Microbiol 83:
295–305.
16. Robinson TP, Ocio MJ, Kaloti A, Mackey BM (1998) The effect of growth
environment on the lag phase of Listeria monocytogenes. Int J Food Microbiol 44:
83–92.
17. Irizarry RA, Hobbs B, Collin F, Beazer-Barclay YD, Antonellis KJ, et al. (2003)
Exploration, normalization, and summaries of high density oligonucleotide array
probe level data. Biostatistics 4: 249–264.
18. Benjamini Y, Hochberg Y (1995) Controlling the false discovery rate: A practical
and powerful approach to multiple testing. J R Stat Soc Ser B 57: 289–300.
19. Hughes TR, Roberts CJ, Dai H, Jones AR, Meyer MR, et al. (2000) Widespread
aneuploidy revealed by DNA microarray expression profiling. Nat Genet 25:
333–337.
20. Ichikawa JK, Norris A, Bangera MG, Geiss GK, van ’t Wout AB, et al. (2000)
Interaction of Pseudomonas aeruginosa with epithelial cells: identification of
differentially regulated genes by expression microarray analysis of human
cDNAs. Proc Natl Acad Sci U S A 97: 9659–9664.
21. Rauch A, Bellew M, Eng J, Fitzgibbon M, Holzman T, et al. (2006)Computational proteomics analysis system (CPAS): an extensible, open-source
analytic system for evaluating and publishing proteomic data and highthroughput biological experiments. J Proteome Res 5: 112–121.
22. Craig R, Beavis RC (2004) TANDEM: matching proteins with tandem mass
spectra. Bioinformatics 20: 1466–1467.
23. Nesvizhskii AI, Keller A, Kolker E, Aebersold R (2003) A statistical model for
identifying proteins by tandem mass spectrometry. Anal Chem 75: 4646–4658.
24. Keller A, Nesvizhskii AI, Kolker E, Aebersold R (2002) Empirical statistical
model to estimate the accuracy of peptide identifications made by MS/MS and
database search. Anal Chem 74: 5383–5392.
25. Choi H, Nesvizhskii AI (2008) False discovery rates and related statistical
concepts in mass spectrometry-based proteomics. J Proteome Res 7: 47–50.
26. Liu H, Sadygov RG, YatesIII JR (2004) A model for random sampling andestimation of relative protein abundance in shotgun proteomics. Anal Chem 76:
4193–4201.
27. Zybailov BL, Mosley AL, Sardiu ME, Coleman MK, Florens L, et al. (2006)
Statistical analysis of membrane proteome expression changes in Saccharomyces
cerevisiae. J Proteome Res 5: 2339–2347.
28. Kocharunchitt C, King T, Gobius K, Bowman JP, Ross T (2014) Global
Genome Response of Escherichia coli O157:H7 Sakai during Dynamic Changes inGrowth Kinetics Induced by an Abrupt Downshift in Water activity.
29. Pham TV, Piersma SR, Warmoes M, Jimenez CR (2010) On the beta-binomial
model for analysis of spectral count data in label-free tandem mass spectrometry-based proteomics. Bioinformatics 26: 363–369.
30. Boorsma A, Foat BC, Vis D, Klis F, Bussemaker HJ (2005) T-profiler: scoringthe activity of predefined groups of genes using gene expression data. Nucleic
Acids Res 33: w592–w595.
31. Price NL, Raivio TL (2009) Characterization of the Cpx regulon in Escherichia
coli strain MC4100. J Bacteriol 191: 1798–1815.
32. Rhodius VA, Suh WC, Nonaka G, West J, Gross CA (2006) Conserved andVariable Functions of the sE Stress Response in Related Genomes. PLoS Biol 4:
43–59.
33. Nonaka G, Blankschien M, Herman C, Gross CA, Rhodius VA (2006) Regulonand promoter analysis of the E. coli heat-shock factor, s32, reveals a multifaceted
cellular response to heat stress. Genes Dev 20: 1776–1789.
34. Lacour S, Landini P (2004) sS-dependent gene expression at the onset of
stationary phase in Escherichia coli: function of sS-dependent genes and
identification of their promoter sequences. J Bacteriol 186: 7186–7195.
35. Patten CL, Kirchhof MG, Schertzberg MR, Morton RA, Schellhorn HE (2004)
Microarray analysis of RpoS-mediated gene expression in Escherichia coli K-12.Mol Genet Genomics 272: 580–591.
36. Weber H, Polen T, Heuveling J, Wendisch VF, Hengge R (2005) Genome-wide
analysis of the general stress response network in Escherichia coli: sigma S-dependent genes, promoters, and sigma factor selectivity. J Bacteriol 187: 1591–
1603.
37. Hagiwara D, Sugiura M, Oshima T, Mori H, Aiba H, et al. (2003) Genome-
Wide Analyses Revealing a Signaling Network of the RcsC-YojN-RcsB
Phosphorelay System in Escherichia coli. J Bacteriol 185: 5735–5746.
38. de Hoon M, Imoto S, Nolan J, Miyano S (2004) Open source clustering
software. Bioinformatics 20: 1453–1454.
39. Saldanha A (2004) Java Treeview–extensible visualization of microarray data.Bioinformatics 20: 3246–3248.
40. Rozen S, Skaletsky H (2000) Primer3 on the WWW for general users and forbiologist programmers. Methods in Molecular Biology 132: 365–386.
41. King T, Lucchini S, Hinton JCD, Gobius K (2010) Transcriptomic Analysis of
Escherichia coli O157:H7 and K-12 Cultures Exposed to Inorganic and Organic
Genome Response of E. coli to Temperature Shift
PLOS ONE | www.plosone.org 12 June 2014 | Volume 9 | Issue 6 | e99627

Acids in Stationary Phase Reveals Acidulant- and Strain-Specific Acid
Tolerance Responses. Applied and Environmental Microbiology 76: 6514–6528.42. Kobayashi A, Hirakawa H, Hirata T, Nishino K, Yamaguchi A (2006) Growth
Phase-Dependent Expression of Drug Exporters in Escherichia coli and Its
Contribution to Drug Tolerance. Journal of Bacteriology 188: 5693–5703.43. Rustici G, Kolesnikov N, Brandizi M, Burdett T, Dylag M, et al. (2013)
ArrayExpress update—trends in database growth and links to data analysis tools.Nucleic Acids Research 41: D987–990.
44. Vizcaıno JA, Cote RG, Csordas A, Dianes JA, Fabregat A, et al. (2013) The
Proteomics Identifications (PRIDE) database and associated tools: status in 2013.Nucleic Acids Research 41: D1063–D1069.
45. Ross T, Ratkowsky DA, Mellefont LA, McMeekin TA (2003) Modelling theeffects of temperature, water activity, pH and lactic acid concentration on the
growth rate of Escherichia coli. Int J Food Microbiol 82: 33–43.46. Golovlev EL (2003) Bacterial cold shock response at the level of DNA
transcription, translation, and chromosome dynamics. Microbiology 72: 5–13.
47. Giuliodori AM, Gualerzi CO, Soto S, Vila J, Tavio M (2007) Review onbacterial stress topics. Ann N Y Acad Sci 1113: 95–104.
48. Yang L, Zhou D, Liu X, Han H, Zhan L, et al. (2009) Cold-induced geneexpression profiles of Vibrio parahaemolyticus: a time-course analysis. FEMS
Microbiol Lett 291: 50–58.
49. Chen G, Gharib TG, Huang CC, Taylor JM, Misek DE, et al. (2002)Discordant protein and mRNA expression in lung adenocarcinomas. Mol Cell
Proteomics 1: 304–313.50. Griffin TJ, Gygi SP, Ideker T, Rist B, Eng J, et al. (2002) Complementary
Profiling of Gene Expression at the Transcriptome and Proteome Levels inSaccharomyces cerevisiae. Mol Cell Proteomics 1: 323–333.
51. Ideker T, Thorsson V, Ranish JA, Christmas R, Buhler J, et al. (2001) Integrated
Genomic and Proteomic Analyses of a Systematically Perturbed MetabolicNetwork. Science 292: 929–934.
52. Tian Q, Stepaniants SB, Mao M, Weng L, Feetham MC, et al. (2004) IntegratedGenomic and Proteomic Analyses of Gene Expression in Mammalian Cells. Mol
Cell Proteomics 3: 960–969.
53. Yamanaka K, Fang L, Inouye M (1998) The CspA family in Escherichia coli:multiple gene duplication for stress adaptation. Mol Microbiol 27: 247–255.
54. Yamanaka K (1999) Cold shock response in Escherichia coli. J Mol MicrobiolBiotechnol 1: 193–202.
55. Thieringer HA, Jones PG, Inouye M (1998) Cold shock and adaptation.Bioessays 20: 49–57.
56. Nakashima K, Kanamaru K, Mizuno T, Horikoshi K (1996) A novel member of
the cspA family of genes that is induced by cold shock in Escherichia coli. Journal ofBacteriology 178: 2994–2997.
57. Etchegaray JP, Jones PG, Inouye M (1996) Differential thermoregulation of twohighly homologous coldshock genes, cspA and cspB, of Escherichia coli. Genes Cells
1: 171–178.
58. Jones PG, Mitta M, Kim Y, Jiang W, Inouye M (1996) Cold shock induces amajor ribosomal-associated protein that unwinds double-stranded RNA in
Escherichia coli. Proc Natl Acad Sci USA 93: 76–80.59. Cairrao F, Cruz A, Mori H, Arraiano CM (2003) Cold shock induction of
RNase R and its role in the maturation of the quality control mediator SsrA/tmRNA. Mol Microbiol 50: 1349–1360.
60. Overgaard M, Kallipolitis B, Valentin-Hansen P (2009) Modulating the bacterial
surface with small RNAs: a new twist on PhoP/Q-mediated lipopolysaccharidemodification. Mol Microbiol 74: 1289–1294.
61. Figueroa-Bossi N, Lemire S, Maloriol D, Balbontın R, Casadesus J, et al. (2006)Loss of Hfq activates the sE-dependent envelope stress response in Salmonella
enterica. Mol Microbiol 62: 838–852.
62. Gustavsson N, Diez A, Nystrom T (2002) The universal stress protein paraloguesof Escherichia coli are co-ordinately regulated and co-operate in the defence
against DNA damage. Molecular Microbiology 43: 107–117.63. Jozefczuk S, Klie S, Catchpole G, Szymanski J, Cuadros-Inostroza A, et al.
(2010) Metabolomic and transcriptomic stress response of Escherichia coli. Mol
Syst Biol 6: 364.64. Durfee T, Hansen A-M, Zhi H, Blattner FR, Jin DJ (2008) Transcription
Profiling of the Stringent Response in Escherichia coli. J Bacteriol 190: 1084–1096.65. Beckering CL, Steil L, Weber MHW, Volker U, Marahiel MA (2002)
Genomewide Transcriptional Analysis of the Cold Shock Response in Bacillussubtilis. J Bacteriol 184: 6395–6402.
66. Free A, Dorman CJ (1997) The Escherichia coli stpA gene is transiently expressed
during growth in rich medium and is induced in minimal medium and by stressconditions. J Bacteriol 179: 909–918.
67. Tsui H-CT, Feng G, Winkler ME (1997) Negative Regulation of mutS and mutH
Repair Gene Expression by the Hfq and RpoS Global Regulators of Escherichia
coli K-12. J Bacteriol 179: 7476–7487.
68. Li B, Tsui H-CT, LeClerc JE, Dey M, Winkler ME, et al. (2003) Molecular
analysis of mutS expression and mutation in natural isolates of pathogenicEscherichia coli. Microbiology 149: 1323–1331.
69. Polissi A, De Laurentis W, Zangrossi S, Briani F, Longhi V, et al. (2003)
Changes in Escherichia coli transcriptome during acclimatization at lowtemperature. Res Microbiol 154: 573–580.
70. Budde I, Steil L, Scharf C, Volker U, Bremer E (2006) Adaptation of Bacillus
subtilis to growth at low temperature: a combined transcriptomic and proteomic
appraisal. Microbiology 152: 831–853.
71. Gadgil M, Kapur V, Hu W-S (2005) Transcriptional Response of Escherichia coli
to Temperature Shift. Biotechnol Prog 21: 689–699.
72. Horinouchi T, Tamaoka K, Furusawa C, Ono N, Suzuki S, et al. (2010)Transcriptome analysis of parallel-evolved Escherichia coli strains under ethanol
stress. BMC Genomics 11: 579.73. Rodrigues D, Ivanova N, He Z, Huebner M, Zhou J, et al. (2008) Architecture
of thermal adaptation in an Exiguobacterium sibiricum strain isolated from 3 million
year old permafrost: A genome and transcriptome approach. BMC Genomics 9:547.
74. Ozcan N, Kramer R, Morbach S (2005) Chill Activation of Compatible SoluteTransporters in Corynebacterium glutamicum at the Level of Transport Activity.
J Bacteriol 187: 4752–4759.
75. Angelidis AS, Smith GM (2003) Role of the Glycine Betaine and CarnitineTransporters in Adaptation of Listeria monocytogenes to Chill Stress in Defined
Medium. Appl Environ Microbiol 69: 7492–7498.76. Ko R, Smith LT (1999) Identification of an ATP-Driven, Osmoregulated
Glycine Betaine Transport System in Listeria monocytogenes. Appl EnvironMicrobiol 65: 4040–4048.
77. Carty SM, Sreekumar KR, Raetz CRH (1999) Effect of Cold Shock on Lipid A
Biosynthesis in Escherichia coli. J Biol Chem 274: 9677–9685.78. Clark DP, de Mendoza D, Polacco ML, Cronan Jr JE (1983) b-Hydroxyde-
canoyl thioester dehydrase does not catalyze a rate-limiting step in Escherichia coli
unsaturated fatty acid synthesis. Biochemistry 22: 5897–5902.
79. Rock CO, Tsay JT, Heath R, Jackowski S (1996) Increased unsaturated fatty
acid production associated with a suppressor of the fabA6(Ts) mutation inEscherichia coli. J Bacteriol 178: 5382–5387.
80. Moen B, Oust Janbu A, Langsrud S, Langsrud Ø, Hobman JL, et al. (2009)Global responses of Escherichia coli to adverse conditions determined by
microarrays and FT-IR spectroscopy. Can J Microbiol 55: 714–728.81. Nachin L, Nannmark U, Nystrom T (2005) Differential Roles of the Universal
Stress Proteins of Escherichia coli in Oxidative Stress Resistance, Adhesion, and
Motility. J Bacteriol 187: 6265–6272.82. Liu X, Parales RE (2008) Chemotaxis of Escherichia coli to Pyrimidines: a New
Role for the Signal Transducer Tap. J Bacteriol 190: 972–979.83. Dong T, Schellhorn HE (2009) Control of RpoS in global gene expression of
Escherichia coli in minimal media. Mol Genet Genomics 281: 19–33.
84. White-Ziegler CA, Um S, Perez NM, Berns AL, Malhowski AJ, et al. (2008) Lowtemperature (23uC) increases expression of biofilm-, cold-shock- and RpoS-
dependent genes in Escherichia coli K-12. Microbiology 154: 148–166.85. Raivio TL, Silhavy TJ (1999) The sE and Cpx regulatory pathways:
Overlapping but distinct envelope stress responses. Curr Opin Microbiol 2:159–165.
86. Kato M, Irisawa T, Ohtani M, Muramatu M (1992) Purification and
characterization of proteinase In, a trypsin-like proteinase, in Escherichia coli.Eur J Biochem 210: 1007–1014.
87. Strocchi M, Ferrer M, Timmis KN, Golyshin PN (2006) Low temperature-induced systems failure in Escherichia coli: insights from rescue by cold-adapted
chaperones. Proteomics 6: 193–206.
88. Zheng J, He C, Singh VK, Martin NL, Jia Z (2007) Crystal structure of a novelprokaryotic Ser/Thr kinase and its implication in the Cpx stress response
pathway. Mol Microbiol 63: 1360–1371.89. Jonas K, Edwards AN, Simm R, Romeo T, Romling U, et al. (2008) The RNA
binding protein CsrA controls cyclic di-GMP metabolism by directly regulating
the expression of GGDEF proteins. Mol Microbiol 70: 236–257.90. Kandror O, DeLeon A, Goldberg AL (2002) Trehalose synthesis is induced
upon exposure of Escherichia coli to cold and is essential for viability at lowtemperatures. Proc Natl Acad Sci USA 99: 9727–9732.
91. Yohannes E, Thurber A, Wilks J, Tate D, Slonczewski J (2005) Polyamine stressat high pH in Escherichia coli K-12. BMC Microbiol 5: 59.
92. Zheng M, Wang X, Templeton LJ, Smulski DR, LaRossa RA, et al. (2001) DNA
Microarray-Mediated Transcriptional Profiling of the Escherichia coli Response toHydrogen Peroxide. J Bacteriol 183: 4562–4570.
93. Mackey BM, Derrick CM (1986) Peroxide sensitivity of cold-shocked Salmonella
typhimurium and Escherichia coli and its relationship to minimal medium recovery.
J Appl Bacteriol 60: 501–511.
Genome Response of E. coli to Temperature Shift
PLOS ONE | www.plosone.org 13 June 2014 | Volume 9 | Issue 6 | e99627