global industrial automation industry primer…¨球工业... · 2019-06-03 · iiot platform:...
TRANSCRIPT

Global Industrial Automation Industry Primer 21 May 2019
EQUITY RESEARCH
DISCLOSURE APPENDIX AT THE BACK OF THIS REPORT CONTAINS IMPORTANT DISCLOSURES, ANALYST CERTIFICATIONS, LEGAL ENTITY DISCLOSURE AND THE STATUS OF NON-US ANALYSTS. US Disclosure: Credit Suisse does and seeks to do business with companies covered in its research reports. As a result,
investors should be aware that the Firm may have a conflict of interest that could affect the objectivity of this report. Investors should consider this report as only a single
factor in making their investment decision
European Capital Goods Team
Andre Kukhnin, CFA
+44 20 7888 0350
Max Yates
+44 20 7883 8501
Leo Carrington, ACA
+44 20 7883 4532
Iris Zheng, CFA
+44 20 7883 5298
Artem Tokarenko
+44 20 7888 2676
Specialist Sales: Andrew Bell
+44 20 7888 0459
US Electricals & Multi-Industry Team
John Walsh
+1 212 538 1664
Caroline Murphy
+1 212 325 4096
Corey Shubiak
+1 212 325 5068

每日免费获取报告1、每日微信群内分享7+最新重磅报告;
2、每日分享当日华尔街日报、金融时报;
3、每周分享经济学人
4、行研报告均为公开版,权利归原作者所有,起点财经仅分发做内部学习。
扫一扫二维码关注公号回复:研究报告加入“起点财经”微信群。。

Links to key research on Industrial Automation
Slide 2
Recent Publications
EV vs ICE debate – we asked experts 1 March 2019
Industrial IoT Platforms Teach-In & Market growth assessment 5 December 2018
Read across from Hexagon analyst meeting 22 November 2018
Rockwell Automation Fair takeaways 16 November 2018
GE and Microsoft IIoT partnership 17 July 2018
Rockwell Automation making $1bn equity investment in PTC continuing the IT-OT convergence 11 June 2018
Schneider-AVEVA deal: A further solid step in digital and capital allocation strategy 5 Sept 2017
ABB Acquires B&R: Implications for global automation players / ROK 04 April 2017
Key research on Industrial Automation
Power & Automation 07 September 2015
China Industrial Automation Sector - Be Selective amid a 'world factory' upgrade 17 Aug 2015
Industry software deep-dive – US IA Vendors in danger of being left behind 15 July 2013
Global Industrial Automation – The next growth phase 14 August 2012
Global Capital Goods Field Trip Notes
Hannover Automation Fair: 2019 feedbacks 5 April 2019; 2017 feedbacks 15 May 2017; 2016 feedbacks 29 Apr 2016
IIoT Webinar 5 Dec 2018; SPS IPC Drives 30 Nov 2018; Automatica 21 June 2018;
IMTS Show-Automation 14 September 2016; Automatica Fair 27 June 2016; Automation Fair 1 December 2015
Source: Credit Suisse research, Company data

What’s inside
Slide 3
The primer contains the following:
• Global Industrial Automation – Market Forecast – slide 5
• Global Industrial Automation – Market Overview – slides 6-8
• Discrete vs. Process Automation Markets – slides 9-10
• Industrial Automation – A structural Growth Story ?– slides 11-12
• Peers: Competitive landscape and Financial benchmarking – slides 13-14
• Control Systems: Enterprise-level Controls & Plant-level Controls – slides 15-20
• Industrial 4.0: Internet of Things (IIoT) – slides 21-29
• Industrial Automation Software – slides 30-31
• Automation Instrumentation – slides 32
• Robotics – slides 33-37
• China Competition Analysis – slides 38
• Key Industrial Automation players: Offerings Overview – slides 39-44
• Credit Suisse HOLT® Analysis – slides 45-53
• Industrial Automation Comp Sheet – slides 54-55
• Company one-pagers – slides 56-62
Source: Credit Suisse research, Company data

Global Effort
Slide 4
Source: Credit Suisse research, Company data
In the analysis of the key end markets and production of this report, we collaborated extensively with our colleagues in the CS Global Equity Research department. In particular:
• Japan Industrials team:
• Shinji Kuroda, [email protected], +81 3 4550 9994
• Midori Kato, [email protected], +81 3 4550 9968
• China Industrials team:
• Edmond Huang, [email protected], +852 2101 6701
• Zhao Zhang, [email protected], +852 2101 6915
• Michael Wang, [email protected], +852 2101 7763
• Credit Suisse HOLT team:
• Conchita Gonzalez de Castejon, [email protected], +1 212 325 2547
• Brendan Munson, [email protected], +1 212 325 2784

Global Industrial Automation market forecast
Slide 5
EBIT margin by automation application
Indexed growth by automation application
Market outlook
• Industrial Software – rising adoption and increasing product complexity (all the way to mass-customisation) supports high single-digit growth outlook and we agree with Siemens’ 7% CAGR estimate. Software crosspollination of hardware is also becoming increasingly transparent.
• Industrial IoT Platforms – the arms race continues with now >500 offerings by traditional automation, software and tech players, but also evidence of consolidation (GE Predix, Rockwell FactoryTalk) and leadership emerging (AWS, Microsoft, Siemens MindSphere); closing the machine-to-machine loop is the ultimate goal.
• Discrete Automation – cycle debate aside, we see re-shoring and generally rising adoption as positives but have concerns over 1) automotive shift to EVs where drivetrain BOM is ¼ of ICE’s and 2) increasing efforts in PLC virtualisation (unlikely for auto, in our view, but possible for new applications).
• Process Automation – as most mature segment, we expect growth closer to General IP (c3-4% pa).
• Robotics – auto capex cycle headwind near term but overall rising adoption remains a structural driver; market shift towards cobots to watch.
Potential strategic moves
• 1) acquisitions of independent industrial software players;
• 2) acquisitions of system integrators by lateral entrants to gain customer proximity;
• 3) IIoT platforms consolidation;
• 4) cloud and analytics vendors to compete with IIoT platforms;
• 5) traditional robot makers acquiring into cobots.
Source: Company data, Credit Suisse research
50
100
150
200
250
300
2004
2005
2006
2007
2008
2009
2010
2011
2012
2013
2014
2015
2016
2017
2018
Global IP Index Process AutomationDiscrete Automation Industrial Automation SoftwareRobotics
-15%
-10%
-5%
0%
5%
10%
15%
20%
25%
30%
35%
2005
2006
2007
2008
2009
2010
2011
2012
2013
2014
2015
2016
2017
2018
Average Software EBIT margin Average PA EBIT margin
Average DA EBIT margin Average Robotics EBIT margin

Cloud (AWS, Azure, Watson, etc.)
Enterprise Level Systems
Plant Level Controls
Plant Instrumentation
Industrial Automation – “Hardware x Software” Crossover
Slide 6
Source: Credit Suisse research
Discrete Hybrid Process
AB
B: A
bility
GE
: Pre
dix
Ro
ckw
ell A
uto
matio
n: P
TC
partn
ersh
ip (T
hin
gW
orx)
Sie
men
s: M
indS
phere
S
ch
ne
ider: E
costru
xure
Ind
ustria
l IoT p
latfo
rms
Connectivity

Industrial Automation Architecture
Slide 7
Source: Credit Suisse research
Major Players
ERP: SAP, Oracle, Microsoft, Sage, Intuit, CDC Software Plant
Design and Simulation: Aveva, Aspen, HON, Schneider
CAD
(Computer
Aided Design)
PLM: Siemens, Dassault, PTC, SAP, Oracle, Autodesk
CAD: Siemens, Dassault, PTC, Autodesk, Bentley
vMES: Schneider, CDC Software, Aspen, Rockwell, HON,
Dassault
v
v SCADA: Siemens, Schneider, ABB
v ^
v ^
v
v
Computerized
Numerical Control
(CNC)
3D Printing
Software
CNC: Fanuc, Siemens, Mitsubishi
3D Printing Software: MTLS
v v
Human Machine
Interface (HMI)v
v v
Drives Sensors
Robots Machine Vision
Motors
Relays and
switches
Metrology: Hexagon, Faro, Renishaw, Zeiss
Enterprise Resource Planning (ERP)
3D Printer: XONE, SSYS, DDD
Motors: ABB, EMR, RBC, Siemens, WEG, Mitsubishi, Teco
Robots: ABB, Fanuc, KUKA, Yaskawa, KHI
Drives: ABB, FTV, ETN, Mitsubishi, EMR, Siemens, ROK
Machine Vision: Cognex, Keyence
Machine Tools: DMG Mori, Amada, Okuma
Plant Level
Controls
Process Discrete
DCS: ABB, HON, yokogawa, EMR, Schneider
PLC: ETN, ROK, Siemens, Omron, Mitsubishi, Schneider
Distributed Control
System (DCS)
Programmable Logic Controller
(PLC)
Supervisory Control and Data AnalysisSCADA - HMI
MES/ CPM/ MOM
Ind
us
tria
l Io
T p
latf
orm
IIoT platform: Microsoft Azure, IBM Waston, Google, Amazon,
PTC ThingWrox, Intel, GE Predix, SAP, Siemens MindSphere,
Schneider EcoStruxure, ABB Ability
Metrology (3D Inspection & Scanning)
Enterprise Level
Controls
IIoT data acquisition devices
Plant
InstrumentationValves Sensors Machine Tools 3D Printer
Enterprise Resource Planning (ERP)
Product Lifecycle Management (PLM)
Plant Design and Simulation

Global Industrial Automation Market
Source: Credit Suisse research, Company data, Credit Suisse estimates
Slide 8
Global Automation Market by Region 2018* Global Automation Market by End Markets 2018*
Automation Product Mapping Global Automation Market By Product 2018*
Drives Sensors
Robots Machine Vision
Motors Relays and switches
Process Discrete
Distributed Control System
(DCS)
Programmable Logic Controller
(PLC)
Plant Instrumentation Valves Sensors
Product Lifecycle Management (PLM)
Enterprise Resource Planning (ERP)
MES/ CPM/ MOM
HMI/ SCADA
Enterprise Level
Controls
Plant Level Controls
We estimate the market size of the
global industrial automation industry
to be slightly over €200bn in 2018,
with around €100bn in both discrete
and process industries.
EMEA and APAC are the largest
markets for automation at both at
36%-37% of the global market
share, followed by the Americas at
27%.
By end market, Automotive, General
Industrials, Consumer Goods,
Chemicals & Mining and
Oil & Gas are the most important
industries for automation demand.
We break down the automation
market by three layers: Enterprise
Level Controls, Plant Level
Controls and Plant
Instrumentation. Control level
products account for the bulk of
the market at around 2/3 of the
value, and instrumentation
accounts for the rest 1/3.
Note: Orange = Enterprise Level Controls; Green = Plant Level Controls; Blue = Instrumentation * Indicative splits from CS estimates
* Indicative splits from CS estimates * Indicative splits from CS estimates
Automotive15%
General Industrials
15%
Consumer goods11%
Chemicals & Minig10%
Oil & Gas10%
Power9%
Technology hardware
8%
Pharma & Biotech
6%
Water1%
Other15%
APAC36%
EMEA37%
Americas27%
PLM19%
ERP Software
18%
MES4%
SCADA13%
PLC4%
DCS7%
Other software
2%
Robotics8%
Machine Vision
4%
Sensors7%
Relays & Switches
3%
Motors & Drives10%
Other1%

Process Automation End Market Split 2018*
Source: Company data, ABB, Credit Suisse estimates
Discrete Automation End Market Split 2018*
The Industrial Automation market is
commonly split between discrete and
process automation, while some
industries have requirements for both, and
a hybrid solution may be adopted.
The largest end markets for discrete
automation are Automotive and General
Industrial, followed by Technology
Hardware and Consumer Goods (such as
Food & Bev).
For process automation, resource
industries are far more important,
accounting for close to half of the overall
demand, with the largest part coming from
the O&G industry.
Slide 9
Discrete Automation Process Automation
Description Manufacture & assemble parts, components to
finished product
Continued process converting raw materials to
finished products
Typical industries Automotive, general manufacturing, consumer
electronics
Oil & gas, chemicals, pulp & paper, mining, metals
Supplier
offering
Programmable logic controllers (PLC), drives,
robots, motors, sensors, HMI, software
/engineering
Process controllers (DCS), measurement, actuators
(e.g., motors, drives, valves), sensors, electrification,
software/engineering
Industry
penetration
Low-to-moderate: More diverse markets &
applications, customers with less expertise and
investment capacity
High: Long history, maximize
return on large capex
Channels A mix of direct, distributors,
OEMs and system integrators
Mainly direct sales or through
EPCs and system integrators
Hybrid Automation
Description A combination of both Discrete and Process Automation
Typical industries Food & Beverage, Water, Pharmaceutical
Comparison of Discrete, Process and Hybrid Automation Market
Discrete vs. Process Automation Markets (i)
* Indicative splits from CS estimates * Indicative splits from CS estimates
Automotive28%
General Industrial
24%
Technology hardware
20%
Consumer goods14%
Oil & Gas1%
Other13% Oil & Gas
18%
Power17%
Pharma & Biotech
12%Mining11%Chemicals
7%
Consumer goods
7%
Marine6%
Pulp & Paper6%
General Industrial
4%
Water1% Other
11%

Typical Hybrid/Batch industries include Food & Beverages, Water, Pharmaceutical and Cement industries.
Discrete vs. Process Automation Markets (ii) Mapping of Discrete (green) vs Process (red) Automation Segments
Source: Credit Suisse research, Company data, ABB, Schneider Electric
The global industrial automation market looks somewhat disaggregated at first glance, as the largest players have only about 10-15% market share within the process and discrete automation markets, respectively. However, the market in reality comprises a myriad of sub-segments of controls and instruments, most of which are complementary, but not overlapping.
Therefore, market share within each product category is much more consolidated, which should be supportive of price discipline. CR8 (concentration ratio) for both process and discrete automation market is about 60%.
Slide 10
2018 revenue (US$ bn) of top players in Industrial Automation
(Products, Software, Solutions, Services)
23.8
16.5
11.4
6.9 6.8 6.7 5.9 5.0 4.4 3.6 3.3
Sie
me
ns
AB
B
Em
ers
on
Schn
eid
er
GE
Ro
ckw
ell
Fa
nu
c
Ho
neyw
ell
Ya
skaw
a
Ku
ka
Yo
ko
gaw
a

Industrial Automation – a Structural Growth Story? (i)
Source: Company data, Credit Suisse estimates
Slide 11
Process & Discrete Automation Companies Average Growth Index vs. Global IP 2004=100
2004-2018 CAGR of Process, Discrete Automation Market and Global IP, 2004-2017 CAGR of Global PA/DA Capex
• We compare the growth rates of PA and DA companies with global IP growth over 2004-2018 and find that both the PA and DA markets have clearly outgrown global IP. Over the last 14 years, global IP has grown at a CAGR of 3.1% while PA players have grown at 5.2% and DA at 6.4%.
• During 2013-2017, the outperformance of DA over PA was fundamentally driven by the higher CapEx growth in the discrete industries. The process industries were dragged by the pressure, especially in the Oil & Gas sector. However, the Process industry recovered in 2018 and outgrew Discrete as the downturn in semiconductors weighed in H2 2018.
• Global PA Capex grew by a CAGR of around 7% between 2004 and 2017 (capex data not yet available for 2018). O&G Capex outgrew PA Capex in 2006-2007 and 2012-2013 when oil prices were high, until a significant depression in O&G Capex since 2015. PA players' sales showed less volatility compared with CapEx, which can be more driven by increasing spending on EPC projects. Moreover, we believe part of the spending on process automation instruments are also driven by OpEx decisions rather than CapEx, which has likely shown less growth over the past 10 years.
• On the other hand, we found that the DA players have slightly outgrown Global Discrete Automation Capex. DA players’ growth led Capex spend by about a year historically but the relationship appears to have reversed in recent years, potentially suggesting more Capex-driven DA investments (for more detail see the charts on next slide).
n/a n/a n/a
-8%
-6%
-4%
-2%
0%
2%
4%
6%
8%
10%
Global IP PA DA Software PACapex
PACapex
(ex-O&G)
DACapex
04/18 CAGR 15/17 CAGR 2018 growth
100
150
200
250
300
350
2004
2005
2006
2007
2008
2009
2010
2011
2012
2013
2014
2015
2016
2017
2018
Global IP IndexPA market growth IndexDA market growth IndexGlobal PA Capex growth indexGlobal DA Capex growth index
*Note: Capex data not yet available for 2018

Source: Company data, Credit Suisse estimates
Slide 12
PA Sales Growth vs. Market CapEx Growth
Average Process vs. Discrete EBIT Margin Indexed Process vs. Discrete vs General Industrials vs SKF Revenue Growth
Industrial Automation – a Structural Growth Story? (ii) DA Sales Growth vs. Market CapEx Growth
*Note: Capex data not yet available for 2018
-20%
-10%
0%
10%
20%
30%
2005
2006
2007
2008
2009
2010
2011
2012
2013
2014
2015
2016
2017
2018
Average PA sales growth
Global PA Capex growth
Global PA Capex growth (ex-O&G)
-30%
-20%
-10%
0%
10%
20%
30%
40%
2005
2006
2007
2008
2009
2010
2011
2012
2013
2014
2015
2016
2017
2018
Average DA sales growth Global DA Capex growth
5%
10%
15%
20%
25%
2005
2006
2007
2008
2009
2010
2011
2012
2013
2014
2015
2016
2017
2018
Average PA EBIT margin Average DA EBIT margin
100
120
140
160
180
200
220
240
260
2004
2005
2006
2007
2008
2009
2010
2011
2012
2013
2014
2015
2016
2017
2018
PA market growth Index
DA market growth Index
GI organic sales growth index
SKF organic sales growth index

In terms of profitability, we have not found pockets of significant over- or under-earning in Automation and therefore (combined with a reasonable growth outlook), we see profitability across segments as rather stable. Mix effect from higher growth in software may provide a small tailwind.
In terms of competitive threat, we see the Automation end-market as moderate with a higher risk in Process vs Discrete near-term. We see Industrial Software as most protected, driven by installed base and the long-term nature of purchasing agreements. We see lower risk in PLC vs DCS. In Robots, we see a near-term risk given fast market growth but increasingly capable Chinese competition, forcing existing players to move into the Cobots space which is beginning to look crowded. Yaskawa plans to sell machine controllers and servomotors in packages to several leading robot manufacturers in China in a similar move to ABB, which suggests that competition is intensifying.
We expect the ongoing convergence trend between discrete and process players to continue, and some convergence towards Industrial Software, upwards from controls and instrumentation players and down from ERP suppliers.
Key Players: Competitive Environment
Relative Areas of Strength of the key Global Automation Players
Source: Credit Suisse research, Company data
Slide 13
Indicates Industry Leaders
Indicates a meaningful position (domestic top 5 for Chinese companies) Note: We have excluded Chinese robotics players because they are outside of the domestic Top 5. Key players include Effort, GSK, Estun, Siasun and STEP.
PLM MES HMI/ SCADA PLC DCS CNC Discrete Process Robotics
ABB
Schneider
Siemens
Rotork
IMI
Spectris
Kuka
Emerson
Rockwell
Eaton
Honeywell
GE
Pentair
Flowserve
Fanuc
Mitsubishi Electric
Yaskawa
Yokogawa
Omron
Supcon
Hollysys
Weinview
Baosight
Japan
China
Control systems (software& hardware) HardwareSoftware
Europe
US
PLM MES HMI/ SCADA PLC DCS CNC Discrete Process Robotics
ABB
Schneider
Siemens
Rotork
IMI
Spectris
Kuka
Emerson
Rockwell
Eaton
Honeywell
GE
Pentair (sold to EMR)
Flowserve
Fanuc
Mitsubishi Electric
Yaskawa
Yokogawa
Omron
Supcon
Hollysys
Weinview
Baosight
Hardware
Europe
US
Japan
China
Software Control systems (software& hardware)

Key Players: Margin Comparison
Source: Credit Suisse research, Company data
Slide 14
Process Automation 2018 Margin Comparison (Orange indicates instrumentation players)
Discrete Automation 2018 Margin Comparison (Green indicates Robot Players)
• Within the process automation industry, key players show margins ranging from c6% to c21%, with an average margin of c14%. The specialized instrumentation players (IMI, Emerson, Flowserve and Rotork) earned an average operating margin of c17% in 2018.
• Among the larger players (Siemens, Emerson, ABB), Emerson, which also has a strong instrumentation offering (75% of sales), has the highest margin at 16.5%, while the rest have a much lower average margin of c10%. We believe this illustrates the attractiveness of the PA instrumentation market.
• On the other hand, major discrete automation players have shown a larger dispersion in margins ranging from 4% to c55%, with an average of c20%. The is mainly driven by the dispersion of robot players and the high margin of Keyence. Most of the DA players have margins between 10% and 20%.
• The specialized robotics makers (Kuka, Yaskawa, Fanuc) show a large difference in margins. We think this is because Fanuc has 35% exposure to the CNC system market, which is much more profitable. According to our Japan Industrial analyst, Shinji Kuroda, Fanuc also has a higher margin in robot than Yaskawa at around 15-20%, the main underlying reasons being a higher degree of product standardisation and higher production automation.
• Keyence is the most profitable sensor maker globally and its >50% margin is a result of its capex-light model as manufactures all its products through OEMs.
0% 5% 10% 15% 20% 25%
Rotork
Honeywell Process Solutions
Flowserve Flow Control
Emerson AS (PM until 2016)
Schneider PA
Metso Flow Control
ABB IA (PA before 2016)
IMI Critical Engineering
Flowserve Group
Yokogawa IA and Control
Siemens PI&D
0% 10% 20% 30% 40% 50% 60%
Keyence
Fanuc Group
Emerson IA until 2016
Rockwell Automation Group
Siemens DF
Schneider DA (2015)
Mitsubishi Electric
ABB RM (DA&M before 2016)
B&R (2016)
Yaskawa Group
Kuka Group

Control Systems
Source: Company data, Credit Suisse estimates, GE Automation, http://www.geautomation.com/products/connected-manufacturing, Dennis Brandl & Peter Owen, University of Cambridge
Slide 15
Control Systems Product Overview
• Control systems comprise a mix of computers and software that coordinate, monitor, and operate the mechanical and power products involved in
industrial automation. We estimate the total value of the automation control systems market to be ~€140bn in 2018, split between Enterprise-level
Controls and Plant-level Controls.
Enterprise
Level Controls
Plant Level
Controls
Product Lifecycle Management (PLM)
Enterprise Resource Planning (ERP)
MES/ CPM/ MOM
HMI/ SCADA
Process Discrete
Distributed Control System
(DCS)
Programmable Logic Controller
(PLC)
Control Systems Market Split by Product 2018*
* Indicative splits from CS estimates
Integration of PLM, MES and ERP
Level 4
Level 1
Level 2
Level 3
I/O, Devices,
Sensors
ERP, APO,
Logistics Systems
MES, LIMS, WMS,
CMM Systems
PLC, DCS,
Packaged Systems
Business Process Information Network
Operations Information Network
Automation Network
Discrete & Process Device Communication Networks
HMI, SCADA,
Batch Systems
Enterprise Architecture levels
Note: eBOM – Engineering Bill of Materials, mBom – Manufacturing Bill of Materials, GE Automation
PLM27%
ERP Software
27%
MES7%
SCADA20%
PLC6%
DCS10%
Other software
3%

Enterprise-Level Controls (i)
Source: Credit Suisse research, Company data, Credit Suisse estimates
Slide 16
Overview of Enterprise-Level Control Software
Enterprise Level Software – Market Size in 2018 PLM Market Split 2018*
Description Major vendors
ERP (Enterprise
resource planning)
A software system that integrates internal and
external management information across an
organization, incorporating finance,
manufacturing, sales and service, and customer
relationship management data.
• SAP
• Oracle
• Sage
• Infor
• Microsoft
PLM (Product
lifecycle
management)
A software system that consolidates production
information and facilitates the design,
manufacture, service and disposal of resources
involved in the production process.
• Dassault Systems
• Siemens
• PTC
• Autodesk
Enterprise-level systems are the planning and
information -haring technologies that allow a
company to ensure its business objectives
govern the operation of its plant-level control
systems. The main software suites are ERP and
PLM.
ERP solutions, which grew out of accounting
software products, are primarily focused on
physical assets and the flow of materials.
It is dominated by software giants such as SAP
and Oracle, which together account for over
60% of the global market.
Some automation OEMs will offer / integrate
SAP and ORACLE Cummins systems as part of
a total solution.
PLM by component can be divided into Software
and Services.
Cloud-based PLM helps integrate information for
the development of a product and enhance the
communication between manufacturers and
suppliers. The cloud-based PLM is forecast to
reach $50bn in 2023 at a growth CAGR of 15%
between 2017-2023 (Market Research Future).
PLM
Software40%PLM
Services60%
* Indicative splits from CS estimates
0
10
20
30
40
50
PLM ERP Software MES
Estimated market size 2018, €'bn

Source: Credit Suisse research, Company data, Credit Suisse estimates, plmtechnologuide.com, CIMdata
Slide 17
Integration and Convergence of Systems Use of Software in the Product Lifecycle
PLM Software Market Share 2018*
Enterprise-Level Controls (ii)
Industrial Software Revenue for 2018 (€’m)
PLM software was designed in response to the growing needs of product design organizations, as they struggled to manage and synchronize increasingly complex CAD files among global design teams. The design data management function is today incorporated in Product Data Management (PDM) within a PLM system. The highly industry-specific nature of PLM applications leads us to believe engineering knowledge and experience in vertical industries will be highly valued and thus presents a high degree of customer stickiness in the industry. For example, Autodesk is known for its architecture applications, while Siemens and Dassault are more often cited for their automotive applications. Similar to ERP, for other automation OEMs that do not have an independent PLM offering, they often offer it as a part of a total solution package. Historically, there has been little overlap between the ERP system and PLM system within the same organization, but we see increasing integration across platforms as ERP systems today consistently rely on product information supplied by PLM.
* Indicative splits from CS estimates
*Note: SCM = Supply Chain Management
Siemens with MG
18%
Dassault Systems
16%
Synopsys14%Autodesk
12%Cadence
5%
PTC4%
SAP5%
Others26%
0
500
1,000
1,500
2,000
2,500
3,000
3,500
4,000
Siemenswith MG
DassaultSystems
Synopsys Autodesk Cadence PTC SAP

Plant Level Controls (i)
Source: Credit Suisse research, Company data, Credit Suisse estimates
Slide 18
Overview of Plant-Level Control Systems
MES was developed much later as
compared to ERP and PLM, and only
first reached maturity in the 90s.
The MES receives product definitions,
electronic work instructions, and
equipment settings from the PLM and
production planning / order
requirements from the ERP.
The MES then reports production
performance results, produced, and
consumed materials to the ERP.
As MES is usually highly specific to a
particular industry, it is generally
difficult to give an estimate of overall
market share.
Each player has its niche end-market
with a high level of engineering
speciality, and market share can be as
high as 50-70% for the leading players
in their core end-markets.
Description Major vendors
MES (Manufacturing
execution system)
A software system that manages manufacturing operations
within a factory.
Schneider (Invensys), ABB, Siemens,
Rockwell, Honeywell, Dassault, SAP,
Yokogawa, GE Aspen Technology
SCADA (Supervisory
control and data
acquisition)
An industrial control software that monitors and controls
industrial (manufacturing and flow - process or factory), and
facility-based (HVAC control, access, and energy
consumption) processes.
Yokogawa, GE, ABB, Siemens,
Schneider/ Invensys
Optimization
Software
A production process analysis program that utilizes
algorithms in order to provide the user with efficiency and
cost reduction solutions. The software provides a bridge for
the gap between ERP and DCS systems.
AspenTech, ABB, Honeywell, Invensys,
KBC Advanced Technology Plc., OSIsoft,
Inc., Rockwell, Siemens, Yokogawa
Electric, JDA Software Group, Inc.,
Oracle, SAP.
DCS (Distributed
control system)
A control system, typically applied in process applications, in
which the controller elements are not in a central location
but are distributed throughout the system with each
component sub-system controlled by one or more
controllers.
ABB, Siemens, Emerson, and Invensys
PLC (Programmable
logic controller)
A digital computer used to direct automation processes,
including the control of machinery, robots, and factory
assembly lines.
Siemens, Rockwell Automation,
Mitsubishi, Omron, and Schneider.
CNC (Computer
Numerical Control)
A computer that converts the design produced by Computer
Aided Design (CAD) software into numbers. The numbers
can be considered to be the coordinates of a graph and they
control the movement of the cutter. In this way the computer
controls the cutting and shaping of the material.
Siemens, Mitsubishi Electric, FANUC,
Huanzhong CNC

Source: Credit Suisse research, Company data, Credit Suisse estimates
Slide 19
At the top of the plant control system is the SCADA system which sits above a grouping of PLCs, CNCs and/or DCSs. The SCADA monitors the entire system and can send instructions to individual PLCs/DCSs within the system. It is also the application through which you connect the Human Machine Interface (HMI). A SCADA system coordinates (but does not control) real-time processes. It will never directly instruct a motor or drive to perform a specific task, for example. The SCADA will communicate with the PLC (a computerized control system), which in turn governs the motors, drives, belts, and other manufacturing mechanisms directly in a factory environment (discrete). In process automation, the SCADA will often control a system of DCSs which are used for continuous flow processes. The DCS is connected to a series of sensors and actuators that provide feedback to the system. The DCS then processes this feedback and adjusts the valves and actuators so as to control the material flow through the system. The CNC is the lowest level of operating system and is typically located at the machine it directly controls.
Plant Level Controls (ii)
Electronics 2%
Building automation
2%
Semicon/ Solar3%Automotive
4%
Machine builder
7%
Food & Bev7% Waste &
Water6%
Cement & Glass2%Pharma &
Biotech5%Mining &
Metal5%
Chemical bulk9%
Pulp & Paper5%
O&G up/mid stream18%
Oil refinery9%
Chemical petro9%
Power Gen9%
Plant-Level Controls Market Size 2018 (€bn) Plant-Level Controls End Market Exposure *
* Indicative splits from CS estimates
PLC Market Share*
Siemens, 31%
Rockwell Automation,
22%
Mitsubishi, 14%
Schneider, 9%
Omron, 7%
Moeller, 2%
Other, 10% ABB20%
Emerson17%
Yokogawa8%Invensys
4%Honeywell
7%
Rockwell Automation
2%
Other42%
DCS Market Share*
* Indicative splits from CS estimates * Indicative splits from CS estimates
0 2 4 6 8 10 12
Discrete (PLC)
Hybrid (DCS/PLC)
Process (DCS)

Source: Credit Suisse research, Company data, ABB, Siemens
Slide 20
Convergence among automation players – building a complete portfolio across the automation space
Integration of PLC and DCS Systems
Plant Level Controls – Convergence (iii)
In recent years, we have seen a horizontal
expansion of the PLC and DCS players
given increasingly complex manufacturing
design and higher processing capability
which blurred the boundaries between
PLC and DCS applications.
Hybrid applications are gaining popularity,
and more traditional PLC players have
started offering DCS solutions and vice
versa. However, we note that there is still
no player that is strong in both the PLC
and DCS markets.
As most of the PLC/ DCS brands are part
of large companies, acquired growth into
the adjacent market could be challenging,
and most of the effort of expansion has
been on organic growth.
Siemens has made progress, claiming to
have a #5 position in DCS while
maintaining strength in PLC.
In a market where demand for hybrid
applications continues to increase, we
believe this will put the company in a
strong position to continue gaining market
share.
B&R
ABB
ABB + B&R
Siemens
Emerson
GE
Schneider
Fanuc
Honeywell
Rockwell
Yaskawa
Yokogawa
KUKA
* Motors, Drivers; **LV, MV and Power Quality
Digital Platform Electrification**Sensing &
AnalyticsDCS
PLC/IPC servo
motion
Industrial
Motion*Robotics

Industry 4.0 – Industrial Internet of Things (i)
Slide 21
• In Industry 4.0, interactions between the cyber- and physical systems are allowed by connected devices and internet-based information networks. • Information flow is no longer one-dimensional but also includes bottom-up feedback from devices and communication between upstream and downstream
workflow. • It creates an integrated system from product design to production and warehouse solutions which is self-adapting to the changing demand environment.
• Siemens described the following characteristics in their vision for Industry 4.0:
• The final product contains all necessary information on its production requirements; • Self-organization of integrated production lines considering the entire value chain; • Flexible decisions on production process on the basis of the current situation.
• We believe the key benefit of such a system is increased flexibility and efficiency of the production process:
• It allows significantly shorter time-to-market for new products given the integrated design and production system (as much as 50% time saving).
• It creates significant savings of energy and production resources due to better planning and organization. • It allows for individualised mass production with the help of additive manufacturing technology (3D printing) which caters for diversified
individual demand.
Source: Credit Suisse research, Company data, Siemens
0%
5%
10%
15%
20%
25%
30%
35%
0
10
20
30
40
50
60
201
2
201
3
201
4
201
5
2016
201
7
201
8E
201
9E
202
0E
Number of IoT devices conntected yoy growth - RHS
Siemens estimates 50bn IoT devices to be connected by 2020

Industry 4.0 – Industrial Internet of Things (ii)
Slide 22
Source: IoT Analytics
5 types of Industrial IoT platforms Five types of IIoT platforms are (from bottom to the top):
• Connectivity platforms are a form of Platform-as-a-Service that offer coverage capabilities and solutions for connecting the IoT devices, managing and orchestrating connectivity, and provisioning communication services for connected IoT devices.
• Device management platforms are a form of Platform-as-a-Service (or device cloud) that handle provisioning tasks to ensure connected devices are deployed, configured, and kept up-to-date with regular firmware/software updates.
• Cloud platforms (IaaS backends) are a form of Infrastructure-as-a-Service that offer a scalable enterprise-grade backend for data management of IoT applications and services.
• Application Enablement Platforms (AEPs) are a form of Platform-as-a-Service that also offer Software-as-a-Service solutions enabling developers to rapidly create, test, and deploy an IoT application or service.
• Advanced analytics platforms are a form of Platform-as-a-Service that also offer Software-as-a-Service solutions for sophisticated analytics tools including machine-learning techniques and streaming analytics capabilities to extract actionable insights from IoT data.
IIoT platforms deployment by customer type:
• Large factories: often already have connectivity deployed
• Small/Medium factories: often look for end-to-end solutions

Industry 4.0 – Industrial Internet of Things (iii)
Slide 23
Source: IoT Analytics
Large factories: IIoT platform scope
Different-sized factories have different needs:
• Large factories often already have connectivity and plant network deployed, and manufacturers derive value by integrating and analysing existing data sources.
• Small/Medium factories: OEMs need end-to-end solutions in order to create connected products and services. SEMs can leverage cloud-based solutions to realise IIoT use cases without investing in IT infrastructure.
Plant networks already existed
Small/Medium factories: IIoT platform scope
En
d-to
-en
d s
olu
tion

Industry 4.0 – Industrial Internet of Things (iv)
Slide 24
Source: IoT Analytics
Industrial 4.0 use case size (12 key use cases) and growth rates
Industrial IoT platforms play a key role in realising many of the I4.0 use cases:
• Advanced Digital Product engineering – the biggest I4.0 use case: refers to the use of I4.0 technologies to reduce the time and cost required to bring new products to market.
• Data-driven Asset/Plant Performance Optimization: refers to use cases implementing I4.0 technologies to increase asset utilization.
• Predictive Maintenance: seeks to prevent the estimated $657bn in downtime losses that occur each year, and is regarded as one of the most important use cases of I4.0 technology.
• Data-driven quality control: refers to the use of I4.0 technologies to produce a greater number of higher-quality products.
• Remote service: refers to the use of I4.0 technologies to provide remote troubleshooting and optimization services to customers and maintenance personnel.
• Everything-as-a-service: refers to selling products as services instead of or in combination with physical products.
45%40% 50%0
20%15% 25% 35%30%
2023 Market Size ($B)
CAGR (2018-2023)
Data-driven Inventory Optimization
Advanced Digital Product Engineering
Remote Asset Testing/Inspection/Certification
Additive Production
Human Robot Collaboration
Predictive Maintenance
Remote Service
Everything-as-a-Service Business Models
Data-driven Quality Control
Virtual Training
Data-driven Asset/PlantPerformance Optimization
Augmented Operations
$1-5B
$25-50B
$5-10B
$10-25B

Industry 4.0 – Industrial Internet of Things (v)
Slide 25
Source: IoT Analytics
Global IoT Platforms market size
• Manufacturing is the largest market segment for IoT platforms (37% of overall in 2018).
• The manufacturing segment is growing at 42% p.a. faster than overall market growth of 37%.
• The total global IoT platforms market is forecast to reach $22bn in 2023, close to 5x the size in 2018 of $4.5bn.
0
20,000
25,000
15,000
5,000
10,000
Year
Global IoT Platforms Market Size in $B
20212020 202320222017 2018 2019
13,036
2,4241,6701,146
3,905
2,8191,993
9,912
7,386
5,4324,489
16,630
22,284
6,329
8,861
12,228
6,7184,842
3,429
3,139
39%
9,248
Manufacturing
Non-Manufacturing
CAGR 17-23
37%
42%

Industry 4.0 – Industrial Internet of Things (vi)
Slide 26
Source: Credit Suisse research, Company data
User cases of Industrial IoT platforms
Industrial IoT platform vendors
• IIoT platform vendors: GE, Siemens and Schneider appear more advanced in IIoT than ABB. Siemens’ MindSphere runs an open architecture and does not
need to be tied to just Siemens physical devices. However, customers are encouraged to use Siemens’ connected devices to better fit into the ecosystem.
• Connected IIoT devices: We find elevator OEMs are the front-runners in deploying connecting elevators and IIoT platforms. The global top 4 elevator OEMs
have all launched their IIoT platform offerings based on IaaS vendors and are pushing for incremental income from IIoT and improved operational efficiency. Other
industrial players such as Legrand, Atlas and Wartsila have also developed IIoT offerings, but they lag that of elevator OEMs, in our view.
Tech partner
KONE 24/7 Connected Services 2017 150,000 elevators and escalators IBM Watson
Schindler Schindler Ahead 2016 n/a GE Predix, Huawei
Otis Otis One 2018 >300,000 elevators and escalators AT&T, Microsoft
Thyssen MAX 2014 100,000 elevators and escalators Microsoft , CGI
Legrand Eliot 2015 n/a Nest, Samsung, La Poste
Atlas Smartlink 2015 85,000 compressors n/a
Wartsila Wärtsilä Genius 2015 Small number n/a
# of connected devicesCompany IoT platform Launch date
Industries Staff Countries
ABB Ability March 2017 Service and software revenue $6bn 20+ n/a n/a IBM Watson,
Microsoft Azure
GE Predix 2013; August 2015
(launched cloud
service)
$1bn+ Predix-powered revenue in 2017;
$12bn digital revenue by 2020
n/a 35,000+ developers n/a Apple, IBM Watson,
Microsoft Azure
Honeywell Sentience 12/16; Honeywell
Forge expected
Q219
$2.6B of Software Revenue (embedded
and standalone)
HON-specific 2,000+ internal developers n/a
Rockwell FactoryTalk
InnovationSuite
2016 Connected
Enterprise
$300mn in 2018 in Information Solutions
and Connected Services
n/a n/a PTC, Microsoft,
Cisco
Schneider EcoStruxure 2008;
November 2016
(launched
enhanced version)
Software revenue £650m in 2017
(£450m before AVEVA acquistition)
10+ 9,000 system integrators 58 Microsoft Azure, Intel
Siem ens MindSphere Before 2011
(originated from
Digital Factory);
March 2016
(launched open
Small relative to other digital revenues
(Digital revenues €5.2bn, of which €4bn
software and €1.2bn digital services)
20+ 900 software developers 17 IBM Watson, Atos,
Microsoft Azure,
SAP, Accenture
Tech partners# of …
Com pany Applications Launch date Revenue
IoT
pla
tfo
rms

Industry 4.0 – Industrial Internet of Things (vii)
Source: IoT Analytics
Slide 27
Components Microsoft IBM Google Amazon ptc Intel GE SAP
Visualization
Business System Integration
Development Environment
Storage/Database
Device Management
Event Processing & Basic
Analytics
Advanced Analytics
Connectivity Network/Modules
Edge Analytics
Edge Gateway (hardware based)
Operating System
Modules and Drivers
MPU/MCU
Specific Proprietary Enterprise
Applications
●ERP
●CRM●BPM
●CAD, PLM
●ALM, SLM●MES
●ERP
●CRM
●EAM
Augmented/Virtual Reality
Ready-to-go Solutions (i.e.,
preconfigured templates)
Dedicated IoT Implementation
Teams
Oth
erA
pp
lica
tio
nC
lou
d S
ervi
ces
En
d-2
-en
d s
tack
Co
mm
un
icat
ion
Dev
ice
Comparing key IoT Solution vendors

Industry 4.0 – Industrial Internet of Things (viii)
Source: GE Digital Industrial Evolution Index, Credit Suisse research
Slide 28
• Digital Will Become Required Core Industrial Competency
• Cohesive internal and external strategy
• Internal: Focus on product development, manufacturing efficiency gains, lower working capital, employee safety
• External: Customer, embedded and application software, domain expertise, and service
Disconnect between benefits and preparedness Digital Accelerators
Proliferation of smart communication devices
Declining sensor cost
5G deployment
Maturation of earlier pilots
Need for productivity
Safety
Aging workforce/ skill loss
Source: GE Digital Industrial Evolution Index
Note: Scale 0-100, these scores demonstrate progress towards achieving
the Digital Industrial Transformation overall and across industries.
78
55
Outlook Company Readiness
Manu............... 81.3
Aerospace........ 76.9Power/ energy.. 80.1
Transport.......... 78.9Utilities............. 74.5
Manu............... 57.0
Aerospace........ 57.2Power/ energy.. 53.2
Transport.......... 54.3Utilities............. 54.1
For more information, refer to Credit Suisse’s initiation on the US Electrical Equipment and Multi-Industry sector, dated 11 October 2018

Industry 4.0 – Industrial Internet of Things (ix)
Source: GE Digital Industrial Evolution Index, Credit Suisse research
Slide 29
• Gating Factors
For more information refer to Credit Suisse’s initiation on the US Electrical Equipment and Multi-Industry sector, dated 11 October 2018
• Right-to-repair: In the US, 20 states are currently considering a version of “Fair Repair” legislation, with Minnesota likely the first to debate legislation. Right-to-repair is also being covered on the US 2020 Presidential trail, so we do not think it is going away. One specific application is tractor repair, with the WSJ and Bloomberg publishing articles about farmers’ displeasure with having to use authorized service networks versus independent providers or self-repair for broken-down tractors in the field. In 2012, Massachusetts approved a motor vehicle right to repair law which became the blueprint for a national agreement between OEMs and independent auto repair businesses.
• Intelligent analysis: Collecting and mining data is not difficult, per se. The value add of an IoT solution is in contextualizing the data, delivering it in a digestible format, and driving positive outcomes. This is why domain expertise is critical and a differentiator between solutions. For example, we do not expect to see new entrants gain a foothold in refinery applications without decades of operational experience, regardless of software expertise. Inaccurate or flawed models are a significant risk (e.g., false positives of false negatives).
Potential Digital Industrial Gating Factors to Watch
Data ownership Employee skills
Maturation of open standards Cost/ allocation of cost
Privacy rights (e.g. GDPR) Intelligent analysis
Right-to-repair Regulatory standards
Connectivity Unrealistic expectations

0% 10% 20% 30% 40% 50%
Keyence
Oracle Group
Dassault Systems
Cadence
SAP Group
Sage Group
Hexagon IES
Fanuc Group
Aveva
Synopsys
Emerson IA until 2016
Rockwell Automation Group
Siemens DF
PTC
Schneider DA (2015)
ABB RM (DA&M before 2016)
Mitsubishi Electric
B&R (2016)
Yaskawa Group
Kuka Group
Industrial Automation Software in Focus (i)
Slide 30
Source: Credit Suisse research, Company data, Credit Suisse estimates
The software companies on average had an organic growth rate of 7.7% since 2005 as compared to 5.2% for the PA and 6.4% for the DA market, respectively.
Increasing penetration of industrial software will continue to drive above-average growth of the software business relative to the general automation market, in our view.
Going forward, Siemens expects its software business in Digital Factory to grow at a 2018-20 CAGR of 10-15% laid out in the Vision 2020.
• Competitive Landscape in IA Software:
• Enterprise Control Level: ERP dominated by large software IT companies. In PLM, Siemens is the only industrial automation player in the space, competing with specialists Dassault, Synopsys, Autodesk and PTC. PDM (Product Data management), part of an integrated PLM offering, is dominated by AVEVA.
• Plant Control Level: A fragmented IA software market by end-market and application. The MES / CPM market is dominated by regional, niche players specialised in one industry or application.
• MES – a relatively slow-moving industry: Highly bespoke and people-heavy industry with a high degree of customer stickiness, but little pricing power. Implementing newer, more advanced systems can be challenging due to ageing hardware, and decision makers are reluctant to take the business risk of migrating to newer systems.
• PLM – better growth prospects driven by greater penetration: Traditionally, PLM is seen as a very sophisticated system, due to the all-encompassing nature of product management, with a tedious implementation process similar to ERP systems. We believe the rise of IIoT and need for greater integration during the product lifecycle combined with easier adoption processes will drive increased penetration.
• Software pricing model: The industry is moving away from perpetual license fees with annual maintenance charges to a SaaS subscription model.
• Company strategy: We believe hardware-agnostic software products with independent strategies are key to succeed in today’s industry.
Software vs. DA average growth Index Software vs. DA Operating Margin 2018
100
120
140
160
180
200
220
240
260
280
300
2004
2005
2006
2007
2008
2009
2010
2011
2012
2013
2014
2015
2016
2017
2018
Software growth index PA market growth Index
DA market growth Index

Software Acquisition – Strategic Shift Towards Software
Source: Credit Suisse research, Company data
Slide 31
Year Acquirer Target Target industry / business
2019 ABB Dassault (partnership) To combine ABB's Ability digital solutions w ith Dassault's 3DEXPERIENCE platform
2019 Emerson GE Intelligence Platform (PLC) GE's Intelligent Platforms generated US$210m sales in 2017 w ith c650 employees. 78% of its sales are for machine control applications (PLCs etc.)
2018 Siemens Mendix Low -code platform
2018 Siemens Bentley (Partnership) Joint investment initiative started in 2016 and extended to €100m from €50m. Siemens holds >9% of Bentley's secondary shares
2018 Rockw ell PTC (equity + Partnership) Rockw ell invested US$1bn in PTC and launched partnership betw een its industrial automation platforms (FactoryTalk) w ith PTC's softw are
2018 Schneider AVEVA Schneider combined its softw are business w ith AVEVA; AVEVA provides engineering, design and information management softw are
2018 Siemens Aimsun Simulates future traff ic f low s in the planning phase of construction projects
2017 Schneider IGE-XAO Electrical CAD and PLM softw are
2017 Siemens TASS Simulation softw are and engineering services at autonomous driving, integrated safety, advanced driver assistance systems, and tyre modeling
2016 Siemens Mentor Graphics Technology leader in electronic design automation (EDA), provbiding softw are and hardw are solutions for electronics industry
2016 Siemens CD-Adapco Authoring and distribution of applications for CAE and CFD solutions w ithin f luid f low , heat transfer and stress
2015 Schneider LimeWare Monitoring softw are for process companies
2015 AVEVA Schneider (attempted) A reverse takeover; engineering design and information management softw are solutions (Attempted twice)
2014 ABB Spirit IT Liquid f low management softw are
2014 Schneider InStep Softw are Data analysis and monitoring
2013 Siemens Preactor Group Manufacturing operations management softw are
2013 Siemens LMS Product life-cycle management softw are
2013 Schneider Invensys Process control and softw are
2012 Schneider SolveIT Supply chain softw are
2012 Siemens Kineo CAM Computer-aided design softw are
2011 Honeyw ell Matrikon Mining system integration
2011 Rockw ell Hiprom Plant integration softw are
2011 Siemens Active Manufacturing execution system softw are
2011 Mitsubishi ICONICS SCADA softw are
2011 Siemens Vistagy Computer-aided design softw are
2010 Invensys Skelta Business process management softw are in f inancial services, healthcare, life sciences, energy, manufacturing, infrastructure
2010 ABB Ventyx Softw are solutions w ithin asset-, risk- and mobile w orkforce management, and energy ops for utility, communications and energy
2008 SAP Visiprise Auto and electronics
2007 Siemens UGS Product life-cycle management softw are in auto, aerospace and defence, consumer goods, high-tech electronics, machinery
2007 Invensys Cimnet Airline
2006 Schneider Citect Industrial, infrastructure
2006 Siemens Berw anger Oil/gas, petrochemical
2006 Rockw ell GEPA & Interw ave Chemical, auto, food/beverage, infrastructure, general industrials
2006 Applied Materials Brooks Semiconductor and f lat panel display
2005 SAP Lighthammer n.a.
2005 Rockw ell Datasw eep Pharmaceutical
2005 PTC Polyplan Aerospace, auto, transportation equipment, industrial equipment, heavy machinery
2003 Siemens Compex Food
2003 GE Mountain Systems Consumer packaged goods, food/beverage, life science, pulp/paper
2002 Rockw ell ProPack Data Pharmaceutical

Automation Instrumentation
Slide 32
Source: Credit Suisse research, Company data, Credit Suisse estimates
Controls and Instruments common within factory and process automation
Automation Instrumentation Market split by Revenue *
Overview of Automation Instrumentation Market
Description Major vendors
Robots Robots are computer-controlled machines with the ability to
perform actions pre-set by the user, most commonly in the
factory assembly of finished goods.
Yaskawa, Fanuc, ABB, Kuka
Machine vision Machine vision is the optic capacity of machines and is
applied to industrial production. It is commonly used in
factory applications to test for quality assurance, sorting,
material handling, robot guidance, calibration, detecting
defects, and identifying parts.
Teledyne, Dalsa Corporation, Freescale
Semiconductor, Siemens, Cognex,
Industrial Vision Systems, Microscan.
Sensor Sensor is a device that converts a quantitative physical
property, such as temperature, into data that can be
processed and analyzed.
Atmel, Bosch, Dalsa, Denso, Eaton,
Honeywell, Omron, Siemens, Sensata
Relays and switches Relays and switches are used to control circuits. Common
electric relays are electromagnetic devices that respond to
an electric current and trigger a switch to either open or
close a circuit.
Danaher, Siemens, Tyco, Fujitsu, CIT,
and Omron
Motors and Drives Drives are devices used to generate mechanical motion;
with variable speed, allowing the drive to control the rate
and degree of movement.
ABB, Danaher, Eaton, Mitsubishi,
Rockwell Automation, Sauer-Danfoss,
Schneider, Siemens, Yaskawa.
We estimate the total value of
the automation
instrumentation market was
~€60bn in 2017.
* Indicative splits from CS estimates
Robotics22%
Machine Vision11%
Sensors13%
Relays & Switches
9%
Motors & Drives42%
Other3%

Robotics (i)
Slide 33
Source: Credit Suisse research, Company data, IFR, Credit Suisse estimates, US Department of Labor
Price of robots (indicative) vs labour costs Shipment of industrial Robots by End Market 2017
Industrial Robot Market Share as % of Installed Base, 2016 Robots Shipment by Region 2017
The global robotics market is dominated by ABB, Yaskawa and Fanuc, which together account for almost 60% of the global market share. We have seen a recent flush of robotics investment in China, but most of the domestic players remain small on a global scale. By region, Asia remains the largest market, accounting for 69% of global shipments in 2017, driven by the share gains of China from 30% in 2016 to 36% in 2017. The rest is split between Europe and the Americas. China, South Korea, Japan, the US and Germany are the largest five countries and they together accounted for 73% of global shipments in 2017. By installed base, China has the largest number of industrial robots in operations, accounting for 23% of global robots in operation. Automotive and Electronics are by far the largest end-markets for industrial robots, accounting for 33% and 32% of the total demand, respectively. Robot price has been plummeting, driven by the growth in robot investment. Robot performance, measured for mechanical and electronic characteristics, has continuously improved.
Fanuc, 22%
Yaskawa, 20%
ABB, 16%Kawasaki, 6%
Nachi, 5%
Denso, 5%
Kuka, 4%
Mitsubishi, 4%
Epson, 3%
Staubli, 2%
Foxconn, 2%Comau, 2%
Omron / Adept, 1%
Universal, 1% Others, 5%
China 36%
South Korea 10%
Japan 12%
Other Asia 10%
USA9%
Other Americas
3%
Germany 6%
Other Europe
12%
RoW2%
Automotive33%
Electronics32%
Plastic and chemical
5%
Metal12%
Food & Bev3%
Other15%
0
50
100
150
200
250
300
350
4001990
1991
1992
1993
1994
1995
1996
1997
1998
1999
2000
2001
2002
2003
2004
2005
2006
2007
2008
2009
2010
2011
2012
2013
2014
2015
2016
2017
2018
Price index - CSeUnit labour cost index (US machfacturing)Unit labour cost index (US total)Unit labour cost index (China total)
* Note: Robotics data for 2018 not yet available *

Robotics (ii)
Slide 34
Revenue from the Robotics segment for the largest four players on average has grown by c7% since 2004, slightly outperforming the discrete automation market, which grew c6%. On a CAGR basis post the 2008 downturn, robotics revenue has grown on average by 13% per year vs 10% on average for discrete automation. The robotic OEMs have an operating margin between 9.5% and ~15%.
Source: Credit Suisse research, Company data, Credit Suisse estimates
Robotic OEM Operating Profit Margin Robotic OEM Growth index (2004=100)
Robotics Growth Vs. Discrete Automation Robotics vs. Discrete Automation Sales Index
-60%
-40%
-20%
0%
20%
40%
60%
80%
100%
120%
2005
2006
2007
2008
2009
2010
2011
2012
2013
2014
2015
2016
2017
2018
Average Robotics sales growth
IFR Industrial robots supply (units) growth
Average DA sales growth
0
50
100
150
200
250
300
350
400
450
500
2004
2005
2006
2007
2008
2009
2010
2011
2012
2013
2014
2015
2016
2017
2018
Robotics sales growth index
IFR Industrial robots supply (units) growth index
DA market growth Index
*Note: IFR’s estimates of robots supply for 2018E
0
50
100
150
200
250
300
350
400
2004
2005
2006
2007
2008
2009
2010
2011
2012
2013
2014
2015
2016
2017
2018
Yaskawa (Robots) Fanuc (Robots)
Kuka (Robotics until 2017) ABB RM (DA&M before 2016) 0% 5% 10% 15% 20%
Fanuc Group
Kuka (Robotics until 2017)
Yaskawa (Robots)
ABB (Discrete Automation)2016

Slide 35
Source: Credit Suisse research, Company data, IFR
Robot Density by Country 2017 (# of robots per 10,000 employees)
Robotics (iii) - Growth Potential
Robot Density Change in Automotive
• Limited growth potential in US/Germany/Japan Automotive Robots; Room for emerging markets to grow • South Korea has the highest robot density for the Automotive industry at 2,435 per 10,000 employees in 2017. The US, Germany and Japan are
at similar levels at close to 1,200 units, with the US surpassing Japan in 2017. • Looking at the growth path of automotive robot densities, the US, Japan and Germany seem to have reached a steady state with limited growth in
the past few years (or even a decline in the case of Japan). From having had a structurally higher automotive robots penetration level, the last three years have seen Japan converging towards countries like Germany and the US despite a CAGR in overall robots shipped of 18% from 2010-2017.
• Korea is one of the fastest-growing countries in terms of robot densities in the past five years. South Korea used to be in 2nd place, but the Ministry of Employment and Industry updated the employee data in 2016 and this boosted the density for the automotive segment.
• The lower Automotive robot density in emerging markets such as China (539 in 2017) and India (85) suggests continued room for growth.
• Penetration in other Industries should continue to go up, driven by electronics • Interestingly, South Korea and Taiwan (two relatively late adopters of robots in comparison with Japan, Germany and the US) have seen one of
the best robot penetrations of ‘all manufacturing industries' relative to automotive. We believe this is driven by a higher share of the electronics industry in these two regions, which has seen a substantial increase in demand in the past few years.
0
500
1,000
1,500
2,000
2,500
3,000
Rep. ofKorea
USA Japan Germany Taiwan China
Automotive All other industries All manufacturing industries
0
500
1,000
1,500
2,000
2,500
3,000
2006 2007 2008 2009 2010 2011 2012 2013 2014 2015 2016 2017
USA China Japan
Rep. of Korea Taiwan Germany
India

Slide 36
Source: Credit Suisse research, Company data, IFR, Credit Suisse estimates
World robots supply is forecast to grow 13% CAGR between 2018E-2021E
Robot Shipments in Electronics Industry has outgrown the overall market since 2008, while automotive is more in line with the overall market
Robot Density in All Other Industries as % of Automotive Density 2017
Robotics (iv) - Growth Potential
Robot Density change in other industries The Electronics industry
has been catching up since
2015, pushed by the
increasing automation in
the production of electronic
devices such as batteries,
chips and displays,
particularly in Asian
countries (China, Japan
and South Korea).
We see that the robotics
companies have also
increased their focus on
the electronics industry.
For instance, ABB
introduced its first
collaborative 'YuMi' robots
at Hannover Messe in
2015 which are also
specifically targeted at the
3C (Computing,
Communication &
Consumer Electronics)
industry.
0
100
200
300
400
500
600
700
800
2008
2009
2010
2011
2012
2013
2014
2015
2016
2017
2018E
2019E
2020E
Automotive Electronics Total robot shipment
0
100
200
300
400
500
600
2006 2007 2008 2009 2010 2011 2012 2013 2014 2015 2016 2017
USA China Japan
Rep. of Korea Taiwan Germany
0%
5%
10%
15%
20%
25%
Rep. ofKorea
Japan Taiwan Germany USA China
Robot density in All Other Industries as % of Automotive density
-60%
-40%
-20%
0%
20%
40%
60%
80%
100%
120%
0
100,000
200,000
300,000
400,000
500,000
600,000
700,000
2008
2009
2010
2011
2012
2013
2014
2015
2016
2017
2018E
2019E
2020E
2021E
Global robots supply ('000 units) yoy growth - RHS

Slide 37
Source: Credit Suisse research, Industry experts
Number of robots and employees used for ICE (Internal Combustion Engine) and EV (Electric Vehicle) manufacturing
Robotics (v) – EV vs ICE debate
ICE - Mature OEM assembly plant
ICE - BMW 3-series
ICE - Body in white
ICE - Final assembly
ICE - 10,000 engine plant
EV - Battery Pack
EV - Battery (US)
ICE - Major components ICE - Fuel tanks
Paint - US example
Paint - US example 2
Large electronics maker, 1m sq ft0
500
1,000
1,500
2,000
2,500
3,000
3,500
0 500 1,000 1,500 2,000 2,500
# o
f E
mp
loye
es
# of Robots
2,000
200
150
75
Body
Power train
Tier 1 suppliers
Other
Bottom line: We see switching to EVs as a neutral to potentially small positive for Robotics, but for broader industrial automation equipment (motors, drives, PLCs, machine tools), this is a clear negative, primarily because of simplification of the drivetrain. Assembly / body in white: This is the largest area of robotics deployment in the supply chain. The strong consensus is that the potential impact from shift to EVs is neutral to a small positive for Robotics (heavier battery pack, easier engine installation) and neutral for Industrial Automation. Drivetrain: We compared ‘Electric Motor + Gearbox + Battery Pack’ and ‘Combustion Engine + Gearbox + Fuel Tank & Exhaust’ drivetrain sets: • 1) Engine is substantially less complex for EV
as its bill of materials is c10-25% of an ICE; • 2) Gearboxes are substantially less complex for
EVs with c1/3 of gears with direct implications for automation content;
• 3) Battery packs manufacturing (cells making as well as packing) lends itself very well to automation but, within that, to Robotics rather than general automation and is therefore unlikely to offset the ‘gap’ from motors;
• 4) Painting and wheel manufacturing are also highly automated and are not affected.
Link to our Global Industrial Automation note published on 1 March 2019

China – Competition Analysis
Slide 38
We think global brands are still the
key beneficiaries of market growth
because (1) many end-users are still
prone to buy global brands rather than
Chinese products, and (2) weaker
macroeconomic conditions will likely
postpone CapEx for automation
upgrades.
MNCs are the dominant automation
players in China, especially in the
high-end markets. MNCs' cumulative
market share in robots gradually
declined from 75% in 2009 to 67% in
2016, according to Qianzhan.
However, domestic robot
manufacturers operate primarily in the
mid- to lower-end markets with a
market share of <5% in the high-end
market. It is interesting that up until
2017, local robotics OEMs outgrew
international players in China,
whereas in 2017, Internationals
outperformed locals (source: IFR).
We expect Chinese companies to
take more market share in about
three to four years from now, as
(1) the benefit of the first batch of
automation upgrades becomes visible,
(2) automation solutions turn more
affordable for mass adoption, and
(3) government policies start to be
effective.
Source: Credit Suisse research, Company data, Credit Suisse estimates
Estimated capacity expansion and new R&D centre construction timelines of major automation players Projects 2014 2015 2016 2017 2018 2019 2020 2021 2022
Siasun: industrial robot, 3D printer, numerical factory
Han's Laser: High-power semiconductor components, and fiber laser
Han's Laser: cutting and welding system; robot automation; fragile material processing
Megmeet: Zhuzhou manufactory 2nd stage
Siasun: high-end equipment and laser
Oriental Material Handing: industrial automatic smart logistics equipment
Great Star: intelligent robot smart cloud service platform
Top Star: robot and industrial automation manufactory
Sciyon: equipment automation production line
Huazhong Numerical: AC servo production line
Cheiftain: Medical and bio-engineering automation control system
Greatoo: industrial robot and intelligent production line
Inovance: mass transmission inverter,renewable automobile drive control
Estun: a new robot manufacturing workshop with an annual capacity of 2000 sets
Brilliant: intelligent grinding robot
R&D center 2014 2015 2016 2017 2018 2019 2020 2021 2022
Han's Laser
Top Star
Innovance
Estun
Cheiftain
Oriental Material Handing
Construction Initial stage
Full Capacity In use
New capacity and
R&D centres come
out

PLM Software
26%
Factory Automation
30%
Control products
18%
Motion Control
25%
eCar Powertrain Systems
1%
Key European Players (i) – Siemens
Slide 39
Source: Credit Suisse research, Company data, Siemens
Siemens digital platform offerings Siemens digital Factory Employee Split*
* Indicative splits from CS estimates
Siemens’ acquisition in the automation space (as of September 2017)
Siemens subsequently acquired
mendix (low-code application
development) for €0.6bn in 2018.
In 2018, Siemens also extended its
joint investment initiative with
Bentley Systems.

Key European Players (ii) – ABB
Slide 40
Source: Credit Suisse research, Company data, ABB
ABB’s Market Positioning by Product
ABB Industrial Automation portfolio
Product offering of B&R (acquired by ABB)
ABB announced in early
2019 the partnership with
Dassault Systèmes that
ABB Ability digital solutions
will be combined with
Dassault’s 3DEXPERIENCE
platform, to provide
customers with advanced
digital twins with improved
overall efficiency, flexibility
and sustainability.

Key European Players (iii) – Schneider
Slide 41
Source: Credit Suisse research, Company data, Schneider
Schneider’s Product Portfolio
Overview of Schneider’s Automation Business Schneider’s Presence in the Industrial Automation Market
Instrumentation
Controls
Software
ProcessDiscrete
Industrial software – Invensys/ (AVEVA)
Instrumentation -
Schneider
PLC – Schneider DCS – Invensys
Robot – not present
HMI/ SCADA – Schneider/ Invensys

Key US Players (i) – EMR
Slide 42
Source: Credit Suisse research, Company data, Emerson
EMR’s Automation Product Portfolio
EMR Automation Solutions Sales Mix
EMR’s Areas of Focus within Automation Solutions

Key US Players (ii) – HON
Slide 43
Source: Credit Suisse research, Company data, Honeywell
HON’s Process Solutions End Market Mix Focus on Oil & Gas and Petrochem
Upstream MidstreamDownstream &
Petrochem
- Productivity and safety
- Automation control
systems
- Storage & pipeline
SCADA solutions
- Fiscal metering
- Marine and terminal
storage, metering and info
systems
- Leading automation and
safety solutions
- Fire and gas solutions
- Infinite logevity/ migrations
services
Connected Plant Sales: HON estimates 15%+ CAGR from 2018-23
Offerings include: process optimization, lifecycle planning, asset performance
monitoring, and mobile tools & services
Honeywell Process Solutions
Sister company UOP provides early look into projects
HPS has been building out field device portfolio
Honeywell Connected Plant differentiated (Sentience IoT)

Key US Players (iii) – ROK
Slide 44
Source: Credit Suisse research, Company data, Rockwell
ROK’s End Market Mix
Sensia JV with Schlumberger
PTC Partnership
ROK and PTC formed a strategic alliance to sell IoT
software under a common brand (FactoryTalk).
Exclusive relationship
Analytics and manufacturing operations
management with augmented reality
ROK invested $1B, and ROK’s CEO joined PTC's
Board of Directors
Announced in June 2018
53% ROK / 47% SLB (Rockwell will pay $250mn at
closing
JV focused on upstream and midstream O&G
markets (wellhead to terminal)
Integrates process control, safety, and information
solutions
Goal to help reduce unplanned downtime, increase
pump availability, and increase service reliability
Announced in Feb 2019
Measurement Artificial Lift
Process
Automation
Data
Management Applications
ROK
SLB
Sensia
Maturity Key: High Medium Low
General
Industrial,
42%
Automotive
OE, 10%
Medical/
Healthcare,
10%
Oil & Gas, 8%
Power
Generation,
5%
Chemical, 5%
Mining AM,
5%
Water &
Wastewater,
5%
Tire, 5%
Other, 5%

45
Industrial Automation – HOLT® Analysis
HOLT analysts
Conchita Gonzalez de Castejon
+1 212 325 2547
Brendan Munson
+1 212 325 2784
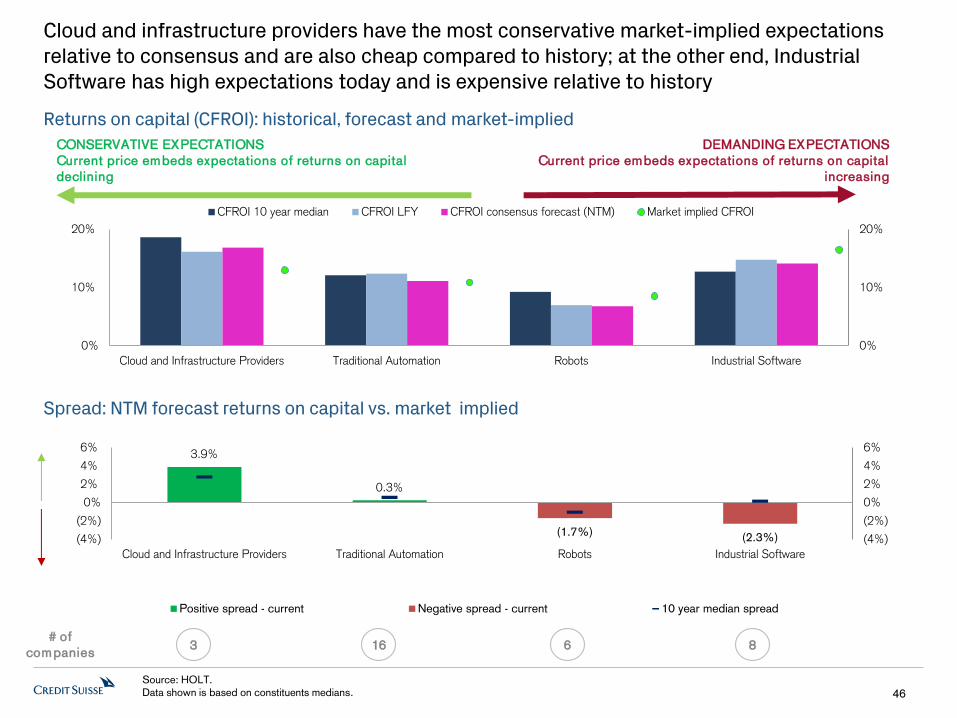
46
Source: HOLT.
Data shown is based on constituents medians.
Cloud and infrastructure providers have the most conservative market-implied expectations relative to consensus and are also cheap compared to history; at the other end, Industrial Software has high expectations today and is expensive relative to history
# of
companies 3 16 6 8
CONSERVATIVE EXPECTATIONS
Current price embeds expectations of returns on capital
declining
DEMANDING EXPECTATIONS
Current price embeds expectations of returns on capital
increasing
Spread: NTM forecast returns on capital vs. market implied
Returns on capital (CFROI): historical, forecast and market-implied
0%
10%
20%
0%
10%
20%
Cloud and Infrastructure Providers Traditional Automation Robots Industrial Software
CFROI 10 year median CFROI LFY CFROI consensus forecast (NTM) Market implied CFROI
3.9%
0.3%
(1.7%) (2.3%) (4%)
(2%)
0%
2%
4%
6%
(4%)
(2%)
0%
2%
4%
6%
Cloud and Infrastructure Providers Traditional Automation Robots Industrial Software
Positive spread - current Negative spread - current 10 year median spread

Source: HOLT.
Note : AZPN data is off the chart due to scale: LFY CFROI was 70%, both NTM and market-implied CFROI are 92%. 47
Outperform-rated stocks ETN, SCHN, SIEGN, AMZN, IBM and Mitsubishi Electric have both low expectations today and are cheap relative to history
Returns on capital (CFROI): historical, forecast and market-implied
Spread: NTM forecast returns on capital vs. market-implied
CONSERVATIVE EXPECTATIONS
Current price embeds expectations of returns on
capital declining
DEMANDING EXPECTATIONS
Current price embeds expectations
of returns on capital increasing
7% 5% 4% 2% 2%
2% 2% 2% 2% 1% 1% 1% 0% 0% 0%
(1%)
(1%)
(1%) (1%) (1%) (1%) (1%) (2%) (2%)
(4%) (5%) (5%) (7%)
(8%) (8%)
(12%) (16%)
(12%)
(8%)
(4%)
0%
4%
8%
(16%)
(12%)
(8%)
(4%)
0%
4%
8%
HO
LI
IBM
AM
ZN
MS
FT
SIE
GN
MIT
SH
EN
SC
HN
ETN
RO
K
SN
PS
HE
XA
B
DE
L
AZ
PN
CG
NX
EM
R
KE
Y
CD
NS
YA
S
KU
2G
AB
BN
HO
N
OM
R
FA
N
DA
ST
HIW SIA
AV
V
ES
T
PTC
SP
LK
Positive spread - current Negative spread - current 10 year median spread
(10%)
0%
10%
20%
30%
(10%)
0%
10%
20%
30%
HO
LI
IBM
AM
ZN
MS
FT
SIE
GN
MIT
SH
EN
SC
HN
ETN
RO
K
SN
PS
HE
XA
B
DE
L
AZ
PN
CG
NX
EM
R
KE
Y
CD
NS
YA
S
KU
2G
AB
BN
HO
N
OM
R
FA
N
DA
ST
HIW SIA
AV
V
ES
T
PTC
SP
LK
CFROI 10 year median CFROI LFY CFROI consensus forecast (NTM) Market implied CFROI

ABBN: 10.7x
CGNX: 28.2x
DEL: 9.9x
ETN: 9.6x
EMR: 10.9x
HIW: 12.5x
HOLI: 5.1x
HON: 14.1x
SHEN: 28.1x
KEY: 19.1x
MIT: 4.8x OMR: 8.9x
ROK: 14.2x
SCHN: 10.5x
SIEGN: 8.2x
YAS: 12.8x
EST: 33.0x
FAN: 17.7x
KU2G: 10.5x
SIA: 39.4x
AVV: 21.9x
CDNS: 22.4x
DAST: 23.0x
HEXAB: 13.7x
PTC: 28.6x
SPLK: 46.4x
SNPS: 18.6x
AMZN: 18.9x
IBM: 8.4x
MSFT: 13.4x
(5%)
0%
5%
10%
15%
20%
25%
30%
35%
(1%) 5% 10% 15% 20%
Traditional automation Robots Industrial software Cloud and infrastructure provider
Median sales growth: 7.8%
Median NTM CFROI: 13.1%
Returns on capital and growth should valuation drive multiples. Cloud and infrastructure providers have the strongest combination of growth and CFROI, followed by Industrial Software. Robots are at the other end with the lowest CFROI and growth around the median
48
Source: HOLT, IBES estimates.
(1) FY2- FY3 sales growth based on consensus estimates.
(2) NTM CFROI based on consensus EPS estimates and HOLT.
(3) AZPN is excluded from the above representation (outlier) however it is used in the analysis. ABB and Yasakawa also fall under robots.
Returns on capital and growth vs. valuation multiples Bubble size and label represent NTM EV/EBITDA
Ab
ove
me
dia
n g
row
th
Be
low
me
dia
n g
row
th
Above median profitabil ity Below median profitabil ity
FO
RE
CA
ST
GR
OW
TH
(1)
FORECAST CFROI(2)
Quadrant median NTM
EV/EBITDA: 17.7x
Quadrant median NTM
EV/EBITDA: 21.0x
Quadrant median NTM
EV/EBITDA: 10.5x
Quadrant median NTM
EV/EBITDA: 12.3x

Industrials Software and Cloud and Infrastructure providers generally have the highest CFROIs but also the most volatile. The majority of companies’ returns are above their 10-year medians
Source: HOLT.
49
Returns on capital (CFROI) – LFY, median and 10 year range
75% 23% 20% 18% 17% 17% 16% 16% 16% 16% 15% 15% 15% 13% 13% 13% 13% 12% 12% 12% 11% 11% 11% 9% 9% 7% 5% 4% 4% 3%
(-8%)
(10%)
0%
10%
20%
30%
(10%)
0%
10%
20%
30%
AZP
N
IBM
HEX
AB
EMR
SNP
S
RO
K
SHEN ET
N
MSF
T
CG
NX
AV
V
KEY
CD
NS
SCH
N
HO
N
PTC
DA
ST
AM
ZN YAS
HIW
SIEG
N
FAN
HO
LI
DEL
AB
BN
OM
R
SIA
MIT
EST
KU
2G
SPLK
10-year high CFROI
10-year median CFROI
10-year low CFROI
LFY CFROI
CFROI
Medians High Low Median LFY LFY vs. Median High vs. Low
Traditional Automation 16% 8% 12% 12% 1% 7%
Robots 13% 4% 9% 7% -3% 9%
Industrial Software 17% 7% 13% 15% 2% 11%
Cloud and Infrastructure Providers 27% 15% 19% 16% -2% 10%

ABBN: 9%
CGNX: 16%
DEL: 9%
ETN: 16%
EMR: 18%
HIW: 12% HOLI: 11%
HON: 13%
SHEN: 16%
KEY: 15%
MIT: 4%
OMR: 7%
ROK: 17% SCHN: 13%
SIEGN: 11%
YAS: 12%
EST: 4%
FAN: 11%
KU2G: 3%
SIA: 5%
AVV: 15%
CDNS: 15%
DAST: 13%
HEXAB: 20%
PTC: 13% SPLK: -8%
SNPS: 17%
AMZN: 12%
IBM: 23%
MSFT: 16%
0.2x
0.3x
0.4x
0.5x
0.6x
0.7x
0.8x
0.9x
1.0x
1.1x
10% 20% 30% 40% 50% 60% 70%
Traditional automation
Robots
Industrial software
Cloud and infrastructure provider
Median asset efficiency : 0.68x
Median gross cash flow margins : 25.6%
There is generally a trade-off between margins and asset efficiency. Industrial software has the highest margins and lowest turns, while Robots have both low margins and turns
Returns on capital (CFROI)
Gross cash flow margins(2)
Asse
t e
ffic
ien
cy
(1)
50
Source: HOLT. AZPN is off the bottom chart with margins of 52.7% and asset efficiency of 1.51(1) Asset Efficiency: Sales/ Invested Capital, which includes gross
PP&E, net working capital with cash, capitalized leases, capitalized R&D and excludes goodwill.
(2) Gross cash flow is a proxy for post-tax EBITDA adjusted for rent and R&D expenses. ABB and Yasakawa also fall under robots.
Drivers of returns: margins and asset efficiency Bubble size and labels represent LFY CFROI
75%
23% 20% 18% 17% 17% 16% 16% 16% 16% 15% 15% 15% 13% 13% 13% 13% 12% 12% 12% 11% 11% 11% 9% 9% 7% 5% 4% 4% 3%
(8%) (10%)
10%
30%
50%
70%

Industrial Software’s lower turns are driven by higher capitalized R&D, while Robots have higher PP&E
51
Source: HOLT.
(1) Asset Efficiency: Sales/ Invested Capital, which includes gross PP&E, net working capital with cash, capitalized leases, capitalized R&D and excludes goodwill.
Asset efficiency: Sales / Invested Capital (LFY)
$ invested for every $ of revenue generated, by asset category (LFY), (1 / Asset efficiency)
Lower investment per $ of revenue = Higher asset efficiency
1.51
1.07 1.01 0.96 0.95 0.91 0.91 0.90 0.88 0.86 0.81 0.80 0.78 0.72 0.69 0.68 0.67 0.64 0.61 0.56 0.52 0.52 0.52 0.48 0.48 0.44 0.42 0.41 0.36 0.36 0.34
0.0x
0.5x
1.0x
1.5x
2.0x
0.2 0.2 0.1 0.1 0.1 0.1 0.1 0.1 0.1 0.1 0.1 0.3 0.3 0.1 0.1 0.1
0.9
0.2 0.2 0.5
0.1 0.2
0.8 0.8 0.7
1.2
0.3 0.2
1.0 1.5
0.7 0.3 0.4 0.3
0.3 0.4 0.5 0.4 0.6 0.4 0.4
0.4 0.4 0.4 0.4 0.6
0.3
0.2
0.3
0.1
0.3 1.2
0.3
0.3
0.1
0.2 0.6 0.5
0.5
0.9
0.1 0.6
0.6 0.3 0.2 0.2
0.3 0.2 0.2 0.1 0.3 0.3 0.3 0.3 0.3 0.3
0.2 0.7
0.8 0.8
0.7
0.3
0.2 1.2
0.3 0.7
0.5
0.5 0.3
1.5
0.2 0.1 0.1
(1.0)
(0.5)
0.0
0.5
1.0
1.5
2.0
2.5
3.0
Cash - peer median: 0.2 NWC - peer median: 0.1
Other non-depreciating assets - peer median: 0.1 Inflation adjusted gross plant and capitalized software - peer median: 0.4
Capitalized leases - peer median: 0.1 Capitalized R&D - peer median: 0.3
Operating intangibles - peer median: 0.0
Medians Cash NWC
Other
assets
PP&E and
capitalize
d software
Capitaliz
ed
leases
Capitalized
R&D
Operating
intangibles
Traditional Automation 0.1 0.1 0.1 0.4 0.1 0.3 0.0
Robots 0.2 0.3 0.1 0.5 0.0 0.2 0.0
Industrial Software 0.2 (0.3) 0.1 0.3 0.2 0.8 -
Cloud and Infrastructure Providers 0.2 (0.2) 0.1 0.4 0.1 0.3 -

52 Source: HOLT. Note: HOLT's management incentive score quantifies how well the CEO's performance based incentives are aligned with shareholder value
creation principles. Scores range from positive 7 to negative 8. Scores between 7 and 4 are deemed Good, between 0 to 3 Average and below -1 Poor.
ABB and Yaskawa also fall under robots
HOLT scorecard
IBM and SIEGN have one of the highest overall scores as per the HOLT scorecard
Score > 60
Score 40-60
Score < 40
Ticker Company Name Overall
Rank
Quality
score
Momentum
score
Valuation
score Investment Style
Accounting
score
Management
incentive score
NTM
CFROI
ABBN Abb Limited 8 63 4 26 Quality Trap 1 0 10.5
CGNX Cognex Corp 30 52 19 39 Style Neutral 5 -1 14.5
2308 Delta Electronics, Inc. 81 63 85 49 Style Neutral 2 0 9.3
ETN Eaton Corp Plc 83 87 52 71 Style Neutral 1 3 18.5
EMR Emerson Electric Co 50 54 62 27 Style Neutral 4 2 19.3
2049 Hiwin Technologies Corp. 9 73 8 10 Quality Trap 1 0 6.5
HOLI Hollysys Automation Tech Ltd 79 68 36 88 Contrarian 5 0 11.4
HON Honeywell International Inc 40 58 71 11 Style Neutral 1 6 10.8
300124 Shenzhen Inovance Technology Co Ltd 42 99 16 32 Quality Trap 5 0 14.9
6861 Keyence Corporation 51 93 57 9 Style Neutral 5 0 13.7
6503 Mitsubishi Electric Corporation 39 45 19 62 Style Neutral 1 0 3.2
6645 Omron Corporation 39 65 39 25 Quality Trap 2 0 4.8
ROK Rockwell Automation 65 62 62 44 Style Neutral 3 2 18.7
SCHN Schneider Electric Se 92 93 48 74 Style Neutral 2 4 13.3
SIEGN Siemens Ag 96 78 44 95 Style Neutral 3 3 10.8
6506 Yaskawa Electric Corporation 32 88 21 17 Quality Trap 2 0 10.6
002747 Estun Automation Co Ltd 2 28 23 1 Worst In Class 2 0 6.7
6954 Fanuc Corporation 14 82 7 16 Quality Trap 5 0 7.1
KU2G Kuka Ag 25 35 10 34 Worst In Class 1 0 4.2
300024 Siasun Robot & Automation Company Limited 3 11 24 4 Worst In Class 4 0 5.7
AZPN Aspen Technology Inc 64 71 95 23 Quality At Any Price 5 0 91.5
AVV Aveva Group Plc 26 39 79 9 Style Neutral 5 0 15.2
CDNS Cadence Design Systems Inc 63 58 89 37 Style Neutral 3 0 14.1
DAST Dassault Systemes Se 35 56 76 12 Style Neutral 3 0 13.1
HEXAB Hexagon Ab 77 86 53 47 Style Neutral 3 -1 19.3
PTC Ptc Inc 25 31 71 17 Momentum Trap 2 3 9.5
SPLK Splunk Inc 9 7 72 9 Momentum Trap 3 0 0.0
SNPS Synopsys Inc 73 67 69 52 Style Neutral 1 0 13.8
AMZN Amazon.com Inc 41 37 80 30 Momentum Trap 3 0 13.0
IBM Intl Business Machines Corp 96 93 36 96 Contrarian 1 3 21.7
MSFT Microsoft Corp 80 76 55 71 Style Neutral 1 1 16.9
Median Quality
score
Momentu
m score
Valuation
score
Accounting
score
Management
incentive score NTM CFROI
Traditional automation 67 42 35 2 0 11
Robots 63 10 17 2 0 7
Industrial software 57 74 20 3 0 14
Cloud and infrastructure provider 76 55 71 1 1 17

53
Appendix: Details of aggregates constituents and the symbol used to denote the companies
SYMBOL NAME
ABBN ABB LIMITED
CGNX COGNEX CORP
DEL DELTA ELECTRONICS, INC.
ETN EATON CORP PLC
EMR EMERSON ELECTRIC CO
HIW HIWIN TECHNOLOGIES CORP.
HOLI HOLLYSYS AUTOMATION TECH LTD
HON HONEYWELL INTERNATIONAL INC
SHEN SHENZHEN INOVANCE TECHNOLOGY CO LTD
KEY KEYENCE CORPORATION
MIT MITSUBISHI ELECTRIC CORPORATION
OMR OMRON CORPORATION
ROK ROCKWELL AUTOMATION
SCHN SCHNEIDER ELECTRIC SE
SIEGN SIEMENS AG
YAS YASKAWA ELECTRIC CORPORATION
SYMBOL NAME
ABBN ABB LIMITED
EST ESTUN AUTOMATION CO LTD
FAN FANUC CORPORATION
KU2G KUKA AG
SIA SIASUN ROBOT & AUTOMATION COMPANY LIMITED
YAS YASKAWA ELECTRIC CORPORATION
ROBOTS
TRADITIONAL AUTOMATION
SYMBOL NAME
AZPN ASPEN TECHNOLOGY INC
AVV AVEVA GROUP PLC
CDNS CADENCE DESIGN SYSTEMS INC
DAST DASSAULT SYSTEMES SE
HEXAB HEXAGON AB
PTC PTC INC
SPLK SPLUNK INC
SNPS SYNOPSYS INC
SYMBOL NAME
AMZN AMAZON.COM INC
IBM INTL BUSINESS MACHINES CORP
MSFT MICROSOFT CORP
INDUSTRIAL SOFTWARE
CLOUD AND INFRASTRUCTURE PROVIDER

54
Industrial Automation – Company Comp Sheet

Major Industrial Automation Players Comp Sheet
Source: Credit Suisse estimates, Company data, Thomson Reuters I/B/E/S
Slide 55
2018 2019 2020 2018 2019 2020 2018 2019 2020 2018 2019 2020 2018 2019 2020
Industrial Software
Aveva (Cal) CS GB GBP Mar 34 40.8 36.4 32.3 7.2 6.6 6.2 30.3 26.6 23.1 29.2 25.4 22.0 23.7% 25.0% 26.7%
Dassault CS FR EUR Dec 141 45.3 40.4 36.5 10.1 8.8 7.9 37.3 30.2 26.6 26.2 22.7 20.6 27.2% 29.2% 29.8%
Autodesk (Cal) CS US USD Jan 174 196.8 65.0 37.8 15.3 12.3 9.7 137.9 50.2 29.5 112.7 45.4 27.7 11.1% 24.4% 32.9%
Synopsys CS SE SEK Dec 483 23.4 20.1 18.2 4.9 4.2 3.9 19.7 16.8 14.9 15.3 12.7 11.3 24.7% 25.3% 26.0%
Cadence CS US USD Jun 116 39.2 32.9 31.2 15.0 14.1 13.3 30.6 28.7 27.2 29.8 27.8 26.1 49.0% 49.1% 48.9%
Hexagon IBES SE SEK Dec 483 23.4 20.1 18.2 4.9 4.2 3.9 19.7 16.8 14.9 15.3 12.7 11.3 24.7% 25.3% 26.0%
Aspen Tech (Cal) IBES US USD Jun 116 39.2 32.9 31.2 15.0 14.1 13.3 30.6 28.7 27.2 29.8 27.8 26.1 49.0% 49.1% 48.9%
PTC inc (Cal) IBES US USD Sep 87 56.6 43.8 30.1 8.2 7.5 6.4 41.8 31.3 22.4 36.2 25.9 19.4 19.5% 24.0% 28.6%
IS Average (Ex Autodesk) 41.0 34.7 29.7 9.1 8.3 7.5 31.9 26.7 22.8 27.3 22.9 19.9 28.8% 30.5% 32.0%
Discrete Automation
Rockwell Automation (Cal) CS US USD Sep 160 19.3 17.6 16.5 3.0 2.9 2.8 14.6 14.4 13.6 13.0 12.8 12.2 20.3% 20.5% 20.9%
Fanuc (Cal) CS JP JPY Mar 18655 23.6 40.5 32.4 4.6 5.3 5.0 17.7 30.1 22.7 14.4 20.9 16.8 25.9% 17.4% 21.9%
Yaskawa (Cal) CS JP JPY Feb 3380 20.5 24.3 21.3 1.9 1.8 1.7 16.8 17.6 14.2 13.3 13.5 11.2 11.1% 10.4% 11.7%
Siasun Robot IBES CN CNY Dec 16 53.9 41.3 34.3 7.9 6.6 5.5 43.7 41.1 32.6 37.8 35.5 28.4 18.0% 16.2% 17.0%
Omron (Cal) IBES JP JPY Mar 5260 19.5 20.9 19.2 1.2 1.2 1.2 9.3 9.8 8.9
Kuka IBES DE EUR Dec 53 34.7 35.1 23.9 0.5 0.7 0.7 19.8 18.9 15.2 9.7 10.6 8.9 2.6% 3.8% 4.5%
Cognex IBES US USD Dec 44 35.5 41.8 32.8 8.7 9.0 7.6 31.7 36.2 27.3 28.9 29.8 22.9 27.4% 24.8% 27.8%
DA Average 31.2 33.4 26.8 4.4 4.4 3.9 24.1 26.4 20.9 19.5 20.5 16.7 17.5% 15.5% 17.3%
DA Average (Ex Siasun, Cognex) 24.5 29.4 23.5 2.5 2.7 2.5 17.2 20.2 16.4 12.6 14.4 12.3 15.0% 13.0% 14.7%
Process Automation
Emerson (Cal) CS US USD Sep 65 18.8 17.3 15.7 2.5 2.3 2.2 14.8 13.0 11.8 11.8 10.6 9.8 16.6% 17.7% 18.3%
Yokogawa (Cal) CS JP JPY Mar 2077 22.3 20.0 18.0 1.3 1.2 1.1 14.3 12.7 11.4 9.5 8.6 7.8 8.7% 9.4% 9.7%
IMI IBES GB GBp Dec 10 13.4 13.5 12.7 1.6 1.6 1.5 11.5 11.6 10.7 8.9 9.4 8.7 13.9% 13.9% 14.3%
Rotork IBES GB GBp Dec 3 27.9 22.3 20.5 3.6 3.5 3.3 17.2 16.8 15.0 15.7 14.9 13.4 21.0% 20.8% 21.8%
Hollysys (Cal) CS US 18 9.6 8.4 7.6 1.5 1.2 0.9 6.9 5.5 4.3 6.3 4.9 3.9 21.8% 21.5% 21.8%
Flowserve IBES US USD Dec 49 28.3 22.7 19.4 1.9 1.8 1.7 19.6 15.9 13.9 15.1 12.8 11.4 9.8% 11.4% 12.5%
PA Average 20.0 17.4 15.6 2.1 1.9 1.8 14.1 12.6 11.2 11.2 10.2 9.2 15.3% 15.8% 16.4%
PA Average (ex Hollysys) 22.1 19.2 17.2 2.2 2.1 2.0 15.5 14.0 12.5 12.2 11.3 10.2 14.0% 14.6% 15.3%
PriceCompanies Source Country Curr YEEBIT MarginEV/EBITDAEV/EBITAEV/Sales PE

56
Industrial Automation – Company One-Pagers

ABB
Source: Credit Suisse research, Company data
Slide 57
Sales Mix Geographic Mix
Management
Chairman Peter Voser
CEO Ulrich Spiesshofer
CFO Timo Ihamuotila
IR Jessica Mitchell
Division Products End Markets / Channels Main Competitors Revenue Split by Geo Key Drivers/ Themes Product Example
Electrification Products
FY 2018 Sales $ 11.69bn
3.0% YoY organic growth
FY 2018 Und. EBITA $ 1.63bn
13.9% Margin
Low and Medium Voltage systems,
LV breakers & switches, Enclosures
& DIN-Rail products, Control products
& Wiring Accessories.
Industry 39%, Utilities 22% and
Transport & Infrastructure 39%
Legrand, Leviton, Schneider, Eaton,
General Electric, Siemens, Hager,
Rittal, Phoenix Contact, Mitsubishi
Europe 34%, Americas 33%, Asia,
Middle East/Africa 33%
Residential & commercial building
construction; Increasing emphasis on
power-saving in buildings
Robotics & Motion (prev. Discrete
Automation & Motion)
FY 2018 Sales $ 9.15bn
8% YoY organic growth
FY 2018 Und. EBITA $ 1.45bn
15.8% Margin
Motors & Generators, Drives &
Controls, Power Conversion, Robotics
Industry 76%, Utilities 9% and
Transport & Infrastructure 15%
Fanuc, Kuka, Siemens, Rockwell,
SMA, Schneider, Weg, Alstom,
Yasukawa, GE/ Converteam,
Hyundai, Enercon, Vestas,
Bombardier, Areva, Emerson,
Mitsubishi
Europe 34%, Americas 32%, Asia,
Middle East/Africa 34%
Emerging market wage inflation;
Increasing automation of production
processes; General industrial capex
Industrial Automation (prev.
Process Automation)
FY 2018 Sales $ 7.39bn
1.0% YoY organic growth
FY 2018 Und. EBITA $ 1.02bn
13.8% Margin
Fully engineered solutions and
standalone products for process
automation, safety, energy
management and plant electrification
and DCS
Industry 61%, Utilities 16% and
Transport & Infrastructure 23%
Emerson, Honeywell, Schneider,
Rockwell , Yokogawa, FLS, Siemens,
MAN, Voith, TMEIC, Converteam,
Siemens, Wartsila, Andritz,
Mitsubishi
Europe 43%, Americas 22%, Asia,
Middle East/Africa 35%
Oil, gas & mining capex; Increasing
emphasis on health & safety in
manufacturing in EM
ABB (ABBN.VX) - ANDRE KUKHNIN, CFA +44 20 7883 0350/ [email protected]
Operating Profit Split End Market Mix Shareholding Structure
Free Float: 89.29%
Top 5 shareholders
Investor AB 10.71%, Cevian Capital
5.34%, Blackrock 4.79%, Vanguard
Group Inc 2.44%, Artisan Partners LP
2.36%
Ownership by country
Sweden 30%, USA 26%, Switzerland
15%, Jersey 10%, Luxembourg 5% and
others
Electrification Products
40%
Robotics & Motion35%
Industrial Automation
25% Electrification Products
41%
Robotics & Motion33%
Industrial Automation
26%
Europe36%
Americas29%
Asia, Middle East/Africa
35%
Automation22%
Residential5%
Commercial5%
Construction Gov't 1%
Power T & D25%
Power Generation
12% Transportation5%
Oil & Gas 10%
Mining OE9%
Water1%
Pulp &Paper2%
Others5%

Emerson
Source: Credit Suisse research, Company data
Slide 58
Operating Profit Split Sales Mix Geographic Mix End Market Mix
Management
Chairman/ CEO David Farr
CFO Frank Dellaquila
IR Tim Reeves
Division Products End Markets / Channels Main Competitors Revenue Split by Geo Key Drivers/ Themes Product Example
Automation Solutions
FY 2018 Sales $11.4bn
10.1% YoY organic growth
FY 2018 Adj EBIT $1.89bn
16.5% Margin
Measurement & Analytical
Instrumentation, Valves,
Actuators, & Regulators,
Filtration & Engineering
Materials, Process Control
Systems & Solutions, Industrial
Solutions
Oil & gas (upstream,
midstream, and downstream),
chemical, power, hybrid,
discrete
Rockwell, Flowserve,
Siemens, ABB, Yokogawa,
Honeywell, Endress+Hauser
(Instrumentation)
North America 44%, APAC
23%, Europe 20%, ME/ Africa
8%, LatAm 5%
Process and Hybrid market
growth; moving into Discrete
islands of automation with new
product introductions (PK
Controller & Ovation OCC100)
and GE Intelligent Platforms
(recent acquisition)
Commercial & Residential
Solutions
(Climate Technologies and
Tools & Home Products)
FY 2018 Sales $5.98bn
3.9% YoY organic growth
FY 2018 Adj EBIT $1.35bn
22.6% Margin
Compressors, Controls,
Thermostats, Refrigeration
Systems, Loggers & Trackers,
Temperature Management,
ProAct Services, Project
Management, Remote
monitoring technology
Residential, commercial, and
cold chain
Ingersoll-Rand, United
Technologies, Resideo
North America 62%, APAC
19%, Europe 10%, LatAm 5%,
ME/ Africa 4%
HVAC and cold chain market
growth
EMERSON (EMR) - JOHN WALSH, +1 212 538 1664/ [email protected] Structure
Free Float: 99.3%
Top 5 shareholders
The Vanguard Group 8.09%,
BlackRock 4.8%, SSgA 4.59%,
Capital World Investors 2.44%,
and Longview Partners 2.14%
Ownership by country
USA 60.4%, UK 5.5%, Canada,
1.6%, Switzerland 1.1%, and
others
Automation Solutions
66%
ClimateTech26%
Tools & Home
Products 9%
Automation
Solutions 66%
Climate Tech26%
Tools & Home
Products 9%
Oil & Gas 24%
Chemical 9%
Power9%
Discrete8%
Hybrid6%
Residential & Comm'l
29%
Cold Chain8%
Other8%
North America
50%
Asia23%
Europe 17%
Latin America
5%
Middle East/ Africa
6%

Honeywell
Source: Credit Suisse research, Company data
Slide 59
Operating Profit Split Sales Mix Geographic Mix End Market Mix
Management
Chairman/CEO Darius Adamczyk
CFO Greg Lewis
IR Mark Macaluso
Division Products End Markets / Channels Main Competitors Revenue Split by Geo Key Drivers/ Themes Product Example
Aerospace
FY 2018 Sales $15.5bn
9% YoY organic growth
FY 2018 Adj EBIT $3.5bn
22.6% Margin
Auxiliary power units, propulsion engines, environmental
control systems, electric power systems, engine controls,
flight safety, communications, navigation, radar and
surveillance systems, aircraft lighting, management and
technical services, logistics services, advanced systems and
instruments, aircraft wheels and brakes, repair and overhaul
services and turbochargers and thermal systems
Commercial OE (22%),
Commercial Aftermarket
(42%), U.S. Defense
(27%), International
Defense (9%)
Garmin, Thales, Safran,
GE, and UTX
North America 63%, EMEA
22%, APAC 13%, Other 2%
Leveraging large installed base;
growth through connected aircraft
services, software offerings, and
retrofit upgrades
Building Technologies
FY 2018 Sales $9.3bn
3.0% YoY organic growth
FY 2018 Adj EBIT $1.6bn
17.3% Margin
Software applications for building control and optimization;
sensors, switches, control systems and instruments for energy
management; access control; video surveillance; fire
products; remote patient monitoring systems; and installation,
maintenance and upgrades of systems
Building Solutions (45%),
Building Products (40%),
and Connected Buildings
(15%)
(Non-res construction)
Itron, Johnson Controls,
Schneider Electric and
Siemens
New product introductions; non-res
construction
Performance Materials & Tech
FY 2018 Sales $10.7bn
2.0% YoY organic growth
FY 2018 Adj EBIT $2.3bn
21.8% Margin
Resins & chemicals, hydrofluoric acid, fluorocarbons, fluorine
specialties, nuclear services, research and fine chemicals,
performance chemicals, imaging chemicals, chemical
processing sealants, advanced fibers & composites,
renewable fuels and chemicals, process automation and
products and solutions
Oil & Gas (48% =
Downstream 30%,
Midstream 12%, and
Upstream 6%),
Refrigerants/ Foams (14%),
Utilities (12%), Chemicals
(10%), Mining Pulp & Paper
(6%), Electronic Materials
(4%), and Other (7%)
Albemarle, BASF,
DowDupont, Emerson and
Sinopec
North America 42%, EMEA
38%, APAC 20%
Oil price, global demand for cleaner
transportation fuels
Safety & Productivity Solutions
FY 2018 Sales $6.3bn
11.0% YoY organic growth
FY 2018 Adj EBIT $1.0bn
16.3% Margin
Personal protection equipment, gas detection technology, and
cloud-based notification and emergency messaging, mobile
devices and software for computing, data collection and
thermal printing; supply chain and warehouse automation
equipment, software and solutions; custom-engineered
sensors, switches and controls for sensing and productivity
solutions; and software-based data and asset management
productivity solutions
Warehouse Distribution
(32%), Industrial
Manufacturing (22%), Retail
(9%), Transportation
Logistics (8%), Utilities
(8%), Oil & Gas (6%), and
Other (15%)
3M, Mine Safety
Appliances (MSA), Kion
Group, TE Connectivity
and Zebra Technologies
Growing global installed base;
differentiated technology in voice
sensing, safety, and automation;
deep domain expertise
HONEYWELL (HON) - JOHN WALSH, +1 212 538 1664/ [email protected] Structure
Free Float: 99.6%
Top 5 shareholders
The Vanguard Group 7.12%,
BlackRock 4.24%, SSgA 3.92%,
Massachusetts Financial Services
3.39%, and Newport Trust Co.
2.66%
Ownership by country
USA 65.8%, UK 3.3%, Canada,
2.3%, Germany 1.0%, and others
Commercial Aerospace
23%
Industrial Productivity
22%
Non-Resi19%
Oil & Gas / PetroChem
15%
Defense13%
Specialty Chemical
8%
Aerospace37%
Performance Material & Tech
26%
Building Technologies
22%
Safety Productivity &
Solutions15%
Aerospace41%
Performance Material &
Tech27%
Building Technologies
9%
Safety Productivity &
Solutions12%
United States57%
Europe24%
Other19%

Rockwell Automation
Source: Credit Suisse research, Company data
Slide 60
Operating Profit Split Sales Mix Geographic Mix End Market Mix
Management
Chairman/ CEO Blake Moret
CFO Patrick Goris
IR Steve Etzel
Division Products End Markets / Channels Main Competitors Revenue Split by Geo Key Drivers/ Themes Product Example
Architecture & Software
FY 2018 Sales $3.05bn
5.2% YoY organic growth
FY 2018 Adj EBIT $0.9bn
29.4% Margin
Control platforms,
Software products,
Sensors, machine safety
components, linear motion
control products
North America 60%,
EMEA 21%, APAC 13%,
LatAm 7%
Control Products &
Solutions
FY 2018 Sales $3.62bn
5.7% YoY organic growth
FY 2018 Adj EBIT $0.5bn
15.0% Margin
Intelligent motor control
and industrials control
products, project mgmt.
North America 63%,
EMEA 16%, APAC 13%,
LatAm 9%
ROCKWELL AUTOMATION (ROK) - JOHN WALSH, +1 212 538 1664/ [email protected]
Transportation, consumer,
life sciences, mining &
cement, oil & gas,
chemical
Siemens, ABB , Schneider
Electric, Emerson,
Mitsubishi Electric, and
Honeywell
Growth of middle class in
EM, aging workforce,
IT/OT convergence, lower
cost of
computing/connectivity,
avg age of industrial
equipment >20yrs
Shareholding Structure
Free Float: 99.2%
Top 5 shareholders
The Vanguard Group 7.26%,
BlackRock 5.57%, SSgA
4.09%, UBS Financial Services
3.6%, and Lazard Asset
Management 3.13%
Ownership by country
USA 61.5%, UK 5.3%,
Sweden 3.5%, Switzerland
2.2%, and others
Architecture & Software
62%
Control Products & Solutions
38%
Architecture & Software
46%
Control Products & Solutions
54%U.S.54%
Canada5%
EMEA19%
APAC14%
LatAm7%
Transportation15%
Consumer (CPG)30%
Heavy Industry50%
Other5%

Schneider
Source: Credit Suisse research, Company data
Slide 61
Operating Profit Split Sales Mix Geographic Mix End Market Mix
Management
Chairman & CEO Jean-Pascal Tricoire
CFO Emmanuel Babeau
IR Amit Bhalla
Division Products End Markets / Channels Main Competitors Revenue Split by Geo Key Drivers/ Themes Product Example
Energy Management
FY 2018 Sales EUR 19.52bn
6.3% YoY organic growth
FY 2018 Adj. EBITA EUR 3.48 Bn
17.8% Margin
Low Voltage, Renewable Energies
products and solutions, Building
security & automation. Medium
Voltage products such as switchgear,
transformersand also includes
software for integrated
management of mission-critical
infrastructure. Consumer and small
business products , Three-phase
Uninterruptable Power Supplies
Marine, Residential and Non
Residential, Hotels & Hospitals.
Utilities, Building, Industries and Oil &
Gas. Data Centers and Financial
Service
ABB, Siemens, Eaton, Legrand,
Emerson
Western Europe 26%, North America
30%, Asia Pacific 28%, ROW 16%
Residential & commercial
construction; Emphasis on power-
saving in buildings, Regulations on
building energy consumption;
Increasing building automation to
lower energy consumption. Utility
capex (distribution network
refurbisment). Data centre
investment; Lower energy cost for
companies
Industry
FY 2018 Sales EUR 6.2bn
7.6% YoY organic growth
FY 2018 Adj. EBITA EUR 1.12bn
18.0% Margin
Motion controllers, Variable speed
drives, Motor starters & contractors,
HMI operator panels, Signaling
devices, Discrete sensors & software,
DCS and instrumentation, Industrial
software, Modeling/ simulation and
asset management.
OEMs, Water Treatment, Mining,
Minerals & Metals, Life Sciences,
Power, Oil & Gas and
Food & Beverage
ABB, Emerson, Siemens & Rockwell Western Europe 31%, North America
22%, Asia Pacific 31%, ROW 16%
Emerging market wage inflation;
Increasing automation of production
processes; General industrial capex
SCHNEIDER (SCHN.PA) - ANDRE KUKHNIN, CFA +44 20 7883 0350/ [email protected] Structure
Free Float:100%
Top 5 shareholders
Schneider Electric SE 6.79%, Sun Life
Financial Inc 6.08%, Blackrock 5.26%, The
Vanguard Group Inc. 3.57% and Norges
Bank 2.53%
Ownership by country
USA 42.84%, France 17.79%, Canada
12.39%, Luxembourg 9.72%, Norway 4.26%
and others
Energy Management
76%
Industry24%
Energy Management
76%
Industry24%
Western Europe
27%
Asia Pacific29%
North America
28%
Rest of World16%
Utilities & Infrastructur
e
26%
Industrial & Machines
27%
Data Centers & Network
14%
Non-Residential
&
Residential33%

Siemens
Source: Credit Suisse research, Company data
Slide 62
Operating Profit Split Geographic Mix
Management
Chairman Gerhard Cromme
CEO Joe Kaeser
CFO Ralf P.Thomas
IR Sabine Reichel
Division Products End Markets / Channels Main Competitors Revenue Split by Geo Key Drivers/ Themes Product Example
Digital Industries
FY 2018 Sales EUR 15.59bn
+10.8% YoY organic growth
FY 2018 Clean EBIT EUR 2.97bn
19.1% Margin
Factory Automation, Motion control,
Process Automation, Software,
Customer services
Manufacturing industry and its major
markets:
automotive, aerospace, and machine
tool and production equipment
ABB, Rockwell, PTC, Schneider,
Mitsubishi
Europe, CIS, MEA - 56%, Asia,
Australia - 29%, Americas - 15%
Gradual increase in interest rates by
central banks leading to limited but
focused investments, change from
globalisation to localisation, trend towards
digitalisation
Smart Infrastructure
FY 2018 Sales EUR 14.45bn
5.1% YoY organic growth
FY 2018 Clean EBIT EUR 1.61bn
11.1% Margin
Low voltage Products, Control
Products, Building Products, Digital
Grid, Distribution Systems, Regional
Solutions and Services
Utilities, Minerals & Metals, Chemical,
Non residential Construction,
Infrastructure companies, Data
centres, Hospitals, Life science
companies, Airports
ABB, Legrand, General Electric,
Emerson, Schneider
EMEA - 51%, Americas - 33%. Asia
and Austrialia - 16%
Decarbonisation, decentralisation and
digitalisation of global electrical power
systems, Energy efficiency of buildings,
Smart space solutions
Gas & Power
FY 2018 Sales EUR 18.13bn
-14.2% YoY organic growth
FY 2018 Clean EBIT EUR 1.02bn
5.6% Margin
Power generation operations, Power
generation, Oil and Gas, HV
transmission products, EPC Projects,
Service and Digital
Utilities, IPPs, TSOs, Oil & Gas and
IndustrialsGeneral Electric, Mitsubishi Electric
Americas - 30%, Europe, CIS - 28%,
Asia, Australia - 22%, MEA- 20%
Demand for renewable power generation
and ssociated volatility, Increasing
requirement of financing by OEMs in large
projects, particularly in Latin America, shift
to more flexible and decentralised power
generation.
Mobility
FY 2018 Sales EUR 8.82bn
+11.0% YoY organic growth
FY 2018 Clean EBIT EUR .97bn
11.0% Margin
Rail (regional, intercity & high speed
trains, metro cars, light rail etc.), Signal
and control tech., Electrification
solutions, Maintenance & service,
Electronic payment and toll systems,
Turnkey mobility systems and
Integrated mobility solutions.
Mobility Management, Turnkey
Projects & Electrification, Mainline
Transport, Urban Transport and
Customer Services
Alstom, Bombardier, CRRC
Need for simpler, faster, more flexible,
affordable and reliable mobility,
challenges faced by national econmies to
reduce costs, space and emissions.
Healthineers
FY 2018 Sales EUR 13.42bn
+3.5% YoY organic growth
FY 2018 Clean EBIT EUR 2.33bn
17.4% Margin
Imaging systems, laboratory
diagnostics, healthcare IT, and hearing
aids
Imaging - 60%, Diagnostics - 29%,
Advanced Therapies - 11%
General Electric, Philips, Mindray,
Toshiba, United Imaging, Hitachi,
Danaher
USA 33%, Europe, CIS, Africa, ME
26%, Asia/Australia (ex. China) 15%,
China 13%, Germany 6%, Americas
(ex US) 6%
Ageing population in EM; Increasing
emphasis on quality of life; Increasing
access to healthcare; Urbanization; FX
tailwinds not evident
Siemens Gamesa Ren. Energy
FY 2018 Sales EUR 9.12bn
-5.2% YoY organic growth
FY 2018 Clean EBIT EUR 6.34bn
7.0% Margin
Products & technology for onshore and
offshore wind, solar and hydro power
plants
Offshore, Onshore & Service Vestas, Nordex Acciona, Senvion Energy policy framework
SIEMENS (SIEGn.DE) - ANDRE KUKHNIN, CFA +44 20 7883 0350/ [email protected]
Sales Mix End Market Mix Shareholding Structure
Free Float:100%
Top 5 shareholders
BlackRock 5.93%, Siemens Family
5.64%, Siemens AG 4.78%, Qatar
Holdings 3.27% & Vanguard Group 2.97%
Ownership by country
Germany 29%, US 21%, UK 13%, Rest of
World 8%, Switzerland 8%, France 8%,
Rest of Europe 7%, Others 6%
Digital Industries
31%
Smart Infrastructure
17%
Gas & Power11%
Mobility10%
Healthineers24%
Siemens Gamesa
Ren. Energy7%
Digital Industries
20%
Smart Infrastructure
18%Gas & Power23%
Mobility11%
Healthineers17%
Siemens Gamesa Ren.
Energy11%
Automation13%
Automotive0%
Contruction commercial
8%
PowerT & D13%
Power Generation
28%
Transportation
10%Medical/
Healthcare16%
Oil & Gas 6%
MiningOE2%
Europe (ex Germany), CIS, Africa,
ME38%
Germany14%
Americas (ex US)
8%
US19%Asia, Australia
(ex China)12%
China10%

63
Disclosures

Companies Mentioned (Price as of 19-May-2019)
3D Systems (DDD.N, $8.77) ABB (ABBN.S, SFr19.38) AMADA Holdings (6113.T, ¥1,113) AVEVA (AVV.L, 3420.0p) Amazon com Inc. (AMZN.OQ, $1869.0) AspenTech (AZPN.OQ, $116.05) Autodesk Inc. (ADSK.OQ, $174.33) Baosight (600845.SS, Rmb30.63) Bosch Ltd. (BOSH.BO, Rs17237.85) Brilliant Circle (1008.HK, HK$0.82) CIT Group Inc. (CIT.N, $51.16) CTN (300430.SZ, Rmb14.78) Cadence Design System (CDNS.OQ, $68.66) Cognex (CGNX.OQ, $44.01) DMG Mori Seiki (6141.T, ¥1,430) Danaher Corporation (DHR.N, $131.1) Dassault Systemes (DAST.PA, €141.3) Delta Electronics (2308.TW, NT$142.5) Denso (6902.T, ¥4,316) ESTUN (002747.SZ, Rmb8.74) Eaton Corporation (ETN.N, $78.75) Emerson Electric (EMR.N, $64.82) ExOne (XONE.OQ, $8.26) FARO Tech (FARO.OQ, $48.58) Fanuc (6954.T, ¥18,925) Flowserve Corp. (FLS.N, $49.48) Fortive (FTV.N, $80.52) Fujitsu (6702.T, ¥7,430) GreatStar (002444.SZ, Rmb9.85) Greatoo Intellig (002031.SZ, Rmb2.22) Han's Laser Technology Co., Ltd (002008.SZ, Rmb33.27) Hexagon AB (HEXAb.ST, Skr482.9) Hiwin (2049.TW, NT$245.0) Hollysys Automation Technologies Ltd. (HOLI.OQ, $18.45) Honeywell International Inc. (HON.N, $169.95) Huazhong (6830.HK, HK$1.39) IMI (IMI.L, 977.8p) International Business Machines (IBM.N, $134.32) Intuit Inc. (INTU.OQ, $245.45) Kawasaki Heavy Industries (7012.T, ¥2,458) Keyence (6861.T, ¥66,390) Kuka (KU2G.DE, €53.4) Megmeet (002851.SZ, Rmb30.88) Microsoft (MSFT.OQ, $128.07) Mitsubishi Electric (6503.T, ¥1,440) Okuma Corp (6103.T, ¥5,740) Omron (6645.OS) Oracle Corporation (ORCL.N, $54.5) PTC (PTC.OQ, $86.84) Regal Beloit (RBC.N, $75.45) Renishaw (RSW.L, 4032.0p) Rockwell Automation (ROK.N, $160.32) Rotork (ROR.L, 293.0p) SAP (SAPG.F, €114.72) SCIYON (002380.SZ, Rmb14.4) SIASUN Robot & Automation Co., Ltd (300024.SZ, Rmb15.38) Sage Group (SGE.L, 746.8p) Schneider Electric (SCHN.PA, €72.68) Sensata Tech (ST.N, $45.92) Shenzhen Inovance Technology (300124.SZ, Rmb23.6) Siemens (SIEGn.DE, €107.42) Splunk, Inc. (SPLK.OQ, $136.49) Stratasys (SSYS.OQ, $23.39) Synopsys Inc. (SNPS.OQ, $121.39) Teco (1504.TW, NT$21.9) Teledyne Tech (TDY.N, $240.67) WEG (WEGE3.SA, R$18.13) Yaskawa Electric Corp (6506.T, ¥3,585) Yokogawa Electric Corp (6841.T, ¥2,113)
Disclosure Appendix
Analyst Certification
Andre Kukhnin, CFA, Max Yates, Leo Carrington, Artem Tokarenko, Iris Zheng, CFA, John Walsh, Shinji Kuroda, Edmond Huang, Zhao Zhang, HOLT Specialist: Conchita Gonzalez de Castejon and HOLT Specialist: Brendan Munson each certify, with respect to the companies or securities that the individual analyzes, that (1) the views expressed in this report accurately reflect his or her personal views about all of the subject companies and securities and (2) no part of his or her compensation was, is or will be directly or indirectly related to the specific recommendations or views expressed in this report.
As of December 10, 2012 Analysts’ stock rating are defined as follows:
Outperform (O) : The stock’s total return is expected to outperform the relevant benchmark* over the next 12 months.
Neutral (N) : The stock’s total return is expected to be in line with the relevant benchmark* over the next 12 months.
Underperform (U) : The stock’s total return is expected to underperform the relevant benchmark* over the next 12 months.
*Relevant benchmark by region: As of 10th December 2012, Japanese ratings are based on a stock’s total return relative to the analyst's coverage universe which consists of all companies covered by the analyst within the relevant sector, with Outperforms representing the most attractive, Neutrals the less attractive, and Underperforms the least attractive investment opportunities. As of 2nd October 2012, U.S. and Canadian as well as European ra tings are based on a stock’s total return relative to the analyst's coverage universe which consists of all companies covered by the analyst within the relevant sector, with Outperforms representing the most attractive, Neutrals the less attractive, and Underperforms the least attractive investment opportunities. For Latin American and Asia stocks (excluding Japan
Australia), ratings are based on a stock’s total return relative to the average total return of the relevant country or regional benchmark (India - S&P BSE Sensex Index); prior to 2nd October 2012 U.S. and Canadian rat ings were based on (1) a stock’s absolute total return potential to its current share price and (2) the relative attractiveness of a stock’s total return potential within an analyst’s coverage universe. For Australian and New Zealand stoc ks, the expected total return (ETR) calculation includes 12-month rolling dividend yield. An Outperform rating is assigned where an ETR is greater than or equal to 7.5%; Underperform wh ere an ETR less than or equal to 5%. A Neutral may be assigned where the ETR is between -5% and 15%. The overlapping rating range allows analysts to assign a rating that puts ETR in the context of associated risks. Prior to 18 May 2015, ETR ranges for Outperform and Underperform ratings did not overlap with Neutral thresholds between 15% and 7.5%, which was in operation from 7 July 2011.
Restricted (R) : In certain circumstances, Credit Suisse policy and/or applicable law and regulations preclude certain types of communications, including an investment recommendation, during the course of Credit Suisse's engagement in an investment banking transaction and in certain other circumstances.
Not Rated (NR) : Credit Suisse Equity Research does not have an investment rating or view on the stock or any other securities related to the company at this time.
Not Covered (NC) : Credit Suisse Equity Research does not provide ongoing coverage of the company or offer an investment rating or investment view on the equity security of the company or related products.
Volatility Indicator [V] : A stock is defined as volatile if the stock price has moved up or down by 20% or more in a month in at least 8 of the past 24 months or the analyst expects significant volatility going forward.
Analysts’ sector weightings are distinct from analysts’ stock ratings and are based on the analyst’s expectations for the fundamentals and/or valuation of the sector* relative to the group’s historic fundamentals and/or valuation:
Overweight : The analyst’s expectation for the sector’s fundamentals and/or valuation is favorable over the next 12 months.
Market Weight : The analyst’s expectation for the sector’s fundamentals and/or valuation is neutral over the next 12 months.
Underweight : The analyst’s expectation for the sector’s fundamentals and/or valuation is cautious over the next 12 months.
*An analyst’s coverage sector consists of all companies covered by the analyst within the relevant sector. An analyst may cover multiple sectors.
Credit Suisse's distribution of stock ratings (and banking clients) is:
Global Ratings Distribution
Rating Versus universe (%) Of which banking clients (%)
Outperform/Buy* 46% (32% banking clients)
Neutral/Hold* 39% (27% banking clients)
Underperform/Sell* 13% (21% banking clients)
Restricted 2%
*For purposes of the NYSE and FINRA ratings distribution disclosure requirements, our stock ratings of Outperform, Neutral, a nd Underperform most closely correspond to Buy, Hold, and Sell, respectively; however, the meanings are not the same, as our stock ratings are determined on a relative basis. (Please refer to definitions above.) An investor's decision to buy or sell a security should be based on investment objectives, current holdings, and other individual factors.
Important Global Disclosures
Credit Suisse’s research reports are made available to clients through our proprietary research portal on CS PLUS. Credit Suisse research products may also be made available through third-party vendors or alternate electronic means as a convenience. Certain research products are only made available through CS PLUS. The services provided by Credit Suisse’s analysts to clients may depend on a specific client’s preferences regarding the frequency and manner of receiving communications, the client’s risk profile and investment, the size and scope of the overall client relationship with the Firm, as well as legal and regulatory constraints. To access all of Credit Suisse’s research that you are entitled to receive in the most timely manner, please contact your sales representative or go to https://plus.credit-suisse.com .
Credit Suisse’s policy is to update research reports as it deems appropriate, based on developments with the subject company, the sector or the market that may have a material impact on the research views or opinions stated herein.
Credit Suisse's policy is only to publish investment research that is impartial, independent, clear, fair and not misleading. For more detail please refer to Credit Suisse's Policies for Managing Conflicts of Interest in connection with Investment Research: https://www.credit-suisse.com/sites/disclaimers-ib/en/managing-conflicts.html .
Any information relating to the tax status of financial instruments discussed herein is not intended to provide tax advice or to be used by anyone to provide tax advice. Investors are urged to seek tax advice based on their particular circumstances from an independent tax professional.
Credit Suisse has decided not to enter into business relationships with companies that Credit Suisse has determined to be involved in the development, manufacture, or acquisition of anti-personnel mines and cluster munitions. For Credit Suisse's position on the issue, please see https://www.credit-suisse.com/media/assets/corporate/docs/about-us/responsibility/banking/policy-summaries-en.pdf .
The analyst(s) responsible for preparing this research report received compensation that is based upon various factors including Credit Suisse's total revenues, a portion of which are generated by Credit Suisse's investment banking activities
See the Companies Mentioned section for full company names
Credit Suisse currently has, or had within the past 12 months, the following as investment banking client(s): ABBN.S, ETN.N, EMR.N, FTV.N, SIEGn.DE, DHR.N, CIT.N, CDNS.OQ, SPLK.OQ, AMZN.OQ, IBM.N, MSFT.OQ
Credit Suisse provided investment banking services to the subject company (ABBN.S, ETN.N, EMR.N, FTV.N, SIEGn.DE, DHR.N, CIT.N, CDNS.OQ, SPLK.OQ, AMZN.OQ, IBM.N, MSFT.OQ) within the past 12 months.
Within the last 12 months, Credit Suisse has received compensation for non-investment banking services or products from the following issuer(s): HON.N, SIEGn.DE, DHR.N, CIT.N, CDNS.OQ, AMZN.OQ, IBM.N, MSFT.OQ
Credit Suisse has managed or co-managed a public offering of securities for the subject company (ABBN.S, FTV.N, DHR.N, CIT.N, SPLK.OQ, IBM.N) within the past 12 months.
Within the past 12 months, Credit Suisse has received compensation for investment banking services from the following issuer(s): ABBN.S, ETN.N, EMR.N, FTV.N, SIEGn.DE, DHR.N, CIT.N, CDNS.OQ, SPLK.OQ, AMZN.OQ, IBM.N, MSFT.OQ

Credit Suisse expects to receive or intends to seek investment banking related compensation from the subject company (ABBN.S, AVV.L, ADSK.OQ, ETN.N, FTV.N, HON.N, IMI.L, INTU.OQ, SAPG.F, SCHN.PA, SIEGn.DE, BOSH.BO, DHR.N, CIT.N, CDNS.OQ, SPLK.OQ, AMZN.OQ, IBM.N, MSFT.OQ) within the next 3 months.
Credit Suisse currently has, or had within the past 12 months, the following issuer(s) as client(s), and the services provided were non-investment-banking, securities-related: HON.N, SIEGn.DE, CIT.N, AMZN.OQ, IBM.N, MSFT.OQ
Credit Suisse currently has, or had within the past 12 months, the following issuer(s) as client(s), and the services provided were non-investment-banking, non securities-related: SIEGn.DE, DHR.N, CDNS.OQ, AMZN.OQ, IBM.N
Credit Suisse or a member of the Credit Suisse Group is a market maker or liquidity provider in the securities of the following subject issuer(s): ABBN.S, 6113.T, AVV.L, AMZN.OQ, ADSK.OQ, BOSH.BO, CIT.N, CDNS.OQ, 6141.T, DHR.N, DAST.PA, 2308.TW, 6902.T, ETN.N, EMR.N, 6954.T, FTV.N, 6702.T, 002008.SZ, 2049.TW, HOLI.OQ, HON.N, IMI.L, IBM.N, INTU.OQ, 7012.T, 6861.T, MSFT.OQ, 6503.T, 6103.T, RBC.N, ROK.N, ROR.L, SAPG.F, SGE.L, SCHN.PA, 300124.SZ, SIEGn.DE, SPLK.OQ, SNPS.OQ, 1504.TW, WEGE3.SA, 6506.T, 6841.T
A member of the Credit Suisse Group is party to an agreement with, or may have provided services set out in sections A and B of Annex I of Directive 2014/65/EU of the European Parliament and Council ("MiFID Services") to, the subject issuer (ABBN.S, ETN.N, EMR.N, FTV.N, SCHN.PA, SIEGn.DE, DHR.N, CIT.N, CDNS.OQ, SPLK.OQ, AMZN.OQ, IBM.N, MSFT.OQ) within the past 12 months.
As of the date of this report, Credit Suisse beneficially own 1% or more of a class of common equity securities of (ABBN.S, 6141.T, HOLI.OQ, 7012.T, SAPG.F, 6506.T, 2049.TW).
Credit Suisse beneficially holds >0.5% long position of the total issued share capital of the subject company (6141.T, 6954.T, 7012.T, 6861.T, BOSH.BO, 6902.T, 6702.T).
Credit Suisse is acting as financial advisor to ABB (ABBN.S) in relation to the divestiture of its power grid unit to Hitachi ltd (6501.T)
For date and time of production, dissemination and history of recommendation for the subject company(ies) featured in this report, disseminated within the past 12 months, please refer to the link: https://rave.credit-suisse.com/disclosures/view/report?i=296172&v=29kdq1myy5s1htm4bk5wooeyw .
Important Regional Disclosures
Singapore recipients should contact Credit Suisse AG, Singapore Branch for any matters arising from this research report.
The analyst(s) involved in the preparation of this report may participate in events hosted by the subject company, including site visits. Credit Suisse does not accept or permit analysts to accept payment or reimbursement for travel expenses associated with these events.
For Credit Suisse Securities (Canada), Inc.'s policies and procedures regarding the dissemination of equity research, please visit https://www.credit-suisse.com/sites/disclaimers-ib/en/canada-research-policy.html.
Investors should note that income from such securities and other financial instruments, if any, may fluctuate and that price or value of such securities and instruments may rise or fall and, in some cases, investors may lose their entire principal investment.
Please visit https://www.credit-suisse.com/in/en/legal/research-disclosure.html for additional disclosures required under the Securities And Exchange Board of India (Research Analysts) Regulations, 2014
This research report is authored by:
Credit Suisse (Hong Kong) Limited ............................................................................................................................ Edmond Huang ; Zhao Zhang
Credit Suisse Securities (Japan) Limited ............................................................................................................................................. Shinji Kuroda
Credit Suisse International .............................................. Andre Kukhnin, CFA ; Max Yates ; Leo Carrington ; Artem Tokarenko ; Iris Zheng, CFA
Credit Suisse Securities (USA) LLC . John Walsh ; Caroline Murphy ; Corey Shubiak ; HOLT Specialist: Conchita Gonzalez de Castejon ; HOLT Specialist: Brendan Munson
To the extent this is a report authored in whole or in part by a non-U.S. analyst and is made available in the U.S., the following are important disclosures regarding any non-U.S. analyst contributors: The non-U.S. research analysts listed below (if any) are not registered/qualified as research analysts with FINRA. The non-U.S. research analysts listed below may not be associated persons of CSSU and therefore may not be subject to the FINRA 2241 and NYSE Rule 472 restrictions on communications with a subject company, public appearances and trading securities held by a research analyst account.
Credit Suisse (Hong Kong) Limited ............................................................................................................................ Edmond Huang ; Zhao Zhang
Credit Suisse Securities (Japan) Limited ............................................................................................................................................. Shinji Kuroda
Credit Suisse International .............................................. Andre Kukhnin, CFA ; Max Yates ; Leo Carrington ; Artem Tokarenko ; Iris Zheng, CFA
Important Credit Suisse HOLT Disclosures
The HOLT methodology does not assign ratings or a target price to a security. It is an analytical tool that involves use of a set of proprietary quantitative algorithms and warranted value calculations, collectively called the HOLT valuation model, that are consistently applied to all the companies included in its database. Third-party data (including consensus earnings estimates) are systematically translated into a number of default variables and incorporated into the algorithms available in the HOLT valuation model. The source financial statement, pricing, and earnings data provided by outside data vendors are subject to quality control and may also be adjusted to more closely measure the underlying economics of firm performance. These adjustments provide consistency when analyzing a single company across time, or analyzing multiple companies across industries or national borders. The default scenario that is produced by the HOLT valuation model establishes a warranted price for a security, and as the third-party data are updated, the warranted price may also change. The default variables may also be adjusted to produce alternative warranted prices, any of which could occur. The warranted price is an algorithmic output applied systematically across all companies based on historical levels and volatility of returns. Additional information about the HOLT methodology is available on request.
CFROI, CFROE, HOLT, HOLT Lens, HOLTfolio, "Clarity is Confidence" and "Powered by HOLT" are trademarks or registered trademarks of Credit Suisse Group AG or its affiliates in the United States and other countries.
HOLT is a corporate performance and valuation advisory service of Credit Suisse.
© 2019 Credit Suisse Group AG and its subsidiaries and affiliates. All rights reserved.
Important disclosures regarding companies that are the subject of this report are available by calling +1 (877) 291-2683. The same important disclosures, with the exception of valuation methodology and risk discussions, are also available on Credit Suisse’s disclosure website at https://rave.credit-suisse.com/disclosures . For valuation methodology and risks associated with any recommendation, price target, or rating referenced in this report, please refer to the disclosures section of the most recent report regarding the subject company.

This report is produced by subsidiaries and affiliates of Credit Suisse operating under its Global Markets Division. For more information on our structure, please use the following link: https://www.credit-suisse.com/who-we-are This report may contain material that is not directed to, or intended for distribution to or use by, any person or entity who is a citizen or resident of or located in any locality, state, country or other jurisdiction where such distribution, publication, availability or use would be contrary to law or regulation or which would subject Credit Suisse or its affiliates ("CS") to any registration or licensing requirement within such jurisdiction. All material presented in this report, unless specifically indicated otherwise, is under copyright to CS. None of the material, nor its content, nor any copy of it, may be altered in any way, transmitted to, copied or distributed to any other party, without the prior express written permission of CS. All trademarks, service marks and logos used in this report are trademarks or service marks or registered trademarks or service marks of CS or its affiliates.The information, tools and material presented in this report are provided to you for information purposes only and are not to be used or considered as an offer or the solicitation of an offer to sell or to buy or subscribe for securities or other financial instruments. CS may not have taken any steps to ensure that the securities referred to in this report are suitable for any particular investor. CS will not treat recipients of this report as its customers by virtue of their receiving this report. The investments and services contained or referred to in this report may not be suitable for you and it is recommended that you consult an independent investment advisor if you are in doubt about such investments or investment services. Nothing in this report constitutes investment, legal, accounting or tax advice, or a representation that any investment or strategy is suitable or appropriate to your individual circumstances, or otherwise constitutes a personal recommendation to you. Please note in particular that the bases and levels of taxation may change. Information and opinions presented in this report have been obtained or derived from sources believed by CS to be reliable, but CS makes no representation as to their accuracy or completeness. CS accepts no liability for loss arising from the use of the material presented in this report, except that this exclusion of liability does not apply to the extent that such liability arises under specific statutes or regulations applicable to CS. This report is not to be relied upon in substitution for the exercise of independent judgment. CS may have issued, and may in the future issue, other communications that are inconsistent with, and reach different conclusions from, the information presented in this report. Those communications reflect the different assumptions, views and analytical methods of the analysts who prepared them and CS is under no obligation to ensure that such other communications are brought to the attention of any recipient of this report. Some investments referred to in this report will be offered solely by a single entity and in the case of some investments solely by CS, or an associate of CS or CS may be the only market maker in such investments. Past performance should not be taken as an indication or guarantee of future performance, and no representation or warranty, express or implied, is made regarding future performance. Information, opinions and estimates contained in this report reflect a judgment at its original date of publication by CS and are subject to change without notice. The price, value of and income from any of the securities or financial instruments mentioned in this report can fall as well as rise. The value of securities and financial instruments is subject to exchange rate fluctuation that may have a positive or adverse effect on the price or income of such securities or financial instruments. Investors in securities such as ADR's, the values of which are influenced by currency volatility, effectively assume this risk. Structured securities are complex instruments, typically involve a high degree of risk and are intended for sale only to sophisticated investors who are capable of understanding and assuming the risks involved. The market value of any structured security may be affected by changes in economic, financial and political factors (including, but not limited to, spot and forward interest and exchange rates), time to maturity, market conditions and volatility, and the credit quality of any issuer or reference issuer. Any investor interested in purchasing a structured product should conduct their own investigation and analysis of the product and consult with their own professional advisers as to the risks involved in making such a purchase. Some investments discussed in this report may have a high level of volatility. High volatility investments may experience sudden and large falls in their value causing losses when that investment is realised. Those losses may equal your original investment. Indeed, in the case of some investments the potential losses may exceed the amount of initial investment and, in such circumstances, you may be required to pay more money to support those losses. Income yields from investments may fluctuate and, in consequence, initial capital paid to make the investment may be used as part of that income yield. Some investments may not be readily realisable and it may be difficult to sell or realise those investments, similarly it may prove difficult for you to obtain reliable information about the value, or risks, to which such an investment is exposed. This report may provide the addresses of, or contain hyperlinks to, websites. Except to the extent to which the report refers to website material of CS, CS has not reviewed any such site and takes no responsibility for the content contained therein. Such address or hyperlink (including addresses or hyperlinks to CS's own website material) is provided solely for your convenience and information and the content of any such website does not in any way form part of this document. Accessing such website or following such link through this report or CS's website shall be at your own risk.
This report is issued and distributed in European Union (except Switzerland): by Credit Suisse Securities (Europe) Limited, One Cabot Square, London E14 4QJ, England, which is authorised by the Prudential Regulation Authority and regulated by the Financial Conduct Authority and the Prudential Regulation Authority. Germany: Credit Suisse (Deutschland) Aktiengesellschaft regulated by the Bundesanstalt fuer Finanzdienstleistungsaufsicht ("BaFin"). United States and Canada: Credit Suisse Securities (USA) LLC; Switzerland: Credit Suisse AG; Brazil: Banco de Investimentos Credit Suisse (Brasil) S.A or its affiliates; Mexico: Banco Credit Suisse (México), S.A., Institución de Banca Múltiple, Grupo Financiero Credit Suisse (México) and Casa de Bolsa Credit Suisse (México), S.A. de C.V., Grupo Financiero Credit Suisse (México) ("Credit Suisse Mexico"). This document has been prepared for information purposes only and is exclusively distributed in Mexico to Institutional Investors. Credit Suisse Mexico is not responsible for any onward distribution of this report to non-institutional investors by any third party. The authors of this report have not received payment or compensation from any entity or company other than from the relevant Credit Suisse Group company employing them; Japan: by Credit Suisse Securities (Japan) Limited, Financial Instruments Firm, Director-General of Kanto Local Finance Bureau ( Kinsho) No. 66, a member of Japan Securities Dealers Association, The Financial Futures Association of Japan, Japan Investment Advisers Association, Type II Financial Instruments Firms Association; Hong Kong: Credit Suisse (Hong Kong) Limited; Australia: Credit Suisse Equities (Australia) Limited; Thailand: Credit Suisse Securities (Thailand) Limited, regulated by the Office of the Securities and Exchange Commission, Thailand, having registered address at 990 Abdulrahim Place, 27th Floor, Unit 2701, Rama IV Road, Silom, Bangrak, Bangkok10500, Thailand, Tel. +66 2614 6000; Malaysia: Credit Suisse Securities (Malaysia) Sdn Bhd; Singapore: Credit Suisse AG, Singapore Branch; India: Credit Suisse Securities (India) Private Limited (CIN no.U67120MH1996PTC104392) regulated by the Securities and Exchange Board of India as Research Analyst (registration no. INH 000001030) and as Stock Broker (registration no. INZ000248233), having registered address at 9th Floor, Ceejay House, Dr.A.B. Road, Worli, Mumbai - 18, India, T- +91-22 6777 3777;
South Korea: Credit Suisse Securities (Europe) Limited, Seoul Branch; Taiwan: Credit Suisse AG Taipei Securities Branch; Indonesia: PT Credit Suisse Sekuritas Indonesia; Philippines:Credit Suisse Securities (Philippines ) Inc., and elsewhere in the world by the relevant authorised affiliate of the above. Additional Regional Disclaimers Australia: Credit Suisse Securities (Europe) Limited ("CSSEL") and Credit Suisse International ("CSI") are authorised by the Prudential Regulation Authority and regulated by the Financial Conduct Authority ("FCA") and the Prudential Regulation Authority under UK laws, which differ from Australian Laws. CSSEL and CSI do not hold an Australian Financial Services Licence ("AFSL") and are exempt from the requirement to hold an AFSL under the Corporations Act (Cth) 2001 ("Corporations Act") in respect of the financial services provided to Australian wholesale clients (within the meaning of section 761G of the Corporations Act) (hereinafter referred to as “Financial Services”). This material is not for distribution to retail clients and is directed exclusively at Credit Suisse's professional clients and eligible counterparties as defined by the FCA, and wholesale clients as defined under section 761G of the Corporations Act. Credit Suisse (Hong Kong) Limited ("CSHK") is licensed and regulated by the Securities and Futures Commission of Hong Kong under the laws of Hong Kong, which differ from Australian laws. CSHKL does not hold an AFSL and is exempt from the requirement to hold an AFSL under the Corporations Act in respect of providing Financial Services. Investment banking services in the United States are provided by Credit Suisse Securities (USA) LLC, an affiliate of Credit Suisse Group. CSSU is regulated by the United States Securities and Exchange Commission under United States laws, which differ from Australian laws. CSSU does not hold an AFSL and is exempt from the requirement to hold an AFSL under the Corporations Act in respect of providing Financial Services. Credit Suisse Asset Management LLC (CSAM) is authorised by the Securities and Exchange Commission under US laws, which differ from Australian laws. CSAM does not hold an AFSL and is exempt from the requirement to hold an AFSL under the Corporations Act in respect of providing Financial Services. This material is provided solely to Institutional Accounts (as defined in the FINRA rules) who are Eligible Contract Participants (as defined in the US Commodity Exchange Act). Credit Suisse Equities (Australia) Limited (ABN 35 068 232 708) ("CSEAL") is an AFSL holder in Australia (AFSL 237237). Malaysia: Research provided to residents of Malaysia is authorised by the Head of Research for Credit Suisse Securities (Malaysia) Sdn Bhd, to whom they should direct any queries on +603 2723 2020. Singapore: This report has been prepared and issued for distribution in Singapore to institutional investors, accredited investors and expert investors (each as defined under the Financial Advisers Regulations) only, and is also distributed by Credit Suisse AG, Singapore Branch to overseas investors (as defined under the Financial Advisers Regulations). Credit Suisse AG, Singapore Branch may distribute reports produced by its foreign entities or affiliates pursuant to an arrangement under Regulation 32C of the Financial Advisers Regulations. Singapore recipients should contact Credit Suisse AG, Singapore Branch at +65-6212-2000 for matters arising from, or in connection with, this report. By virtue of your status as an institutional investor, accredited investor, expert investor or overseas investor, Credit Suisse AG, Singapore Branch is exempted from complying with certain compliance requirements under the Financial Advisers Act, Chapter 110 of Singapore (the “FAA”), the Financial Advisers Regulations and the relevant Notices and Guidelines issued thereunder, in respect of any financial advisory service which Credit Suisse AG, Singapore Branch may provide to you. EU: This report has been produced by subsidiaries and affiliates of Credit Suisse operating under its Global Markets Division In jurisdictions where CS is not already registered or licensed to trade in securities, transactions will only be effected in accordance with applicable securities legislation, which will vary from jurisdiction to jurisdiction and may require that the trade be made in accordance with applicable exemptions from registration or licensing requirements. This material is issued and distributed in the U.S. by CSSU, a member of NYSE, FINRA, SIPC and the NFA, and CSSU accepts responsibility for its contents. Clients should contact analysts and execute transactions through a Credit Suisse subsidiary or affiliate in their home jurisdiction unless governing law permits otherwise. Please note that this research was originally prepared and issued by CS for distribution to their market professional and institutional investor customers. Recipients who are not market professional or institutional investor customers of CS should seek the advice of their independent financial advisor prior to taking any investment decision based on this report or for any necessary explanation of its contents. CS may provide various services to US municipal entities or obligated persons ("municipalities"), including suggesting individual transactions or trades and entering into such transactions. Any services CS provides to municipalities are not viewed as "advice" within the meaning of Section 975 of the Dodd-Frank Wall Street Reform and Consumer Protection Act. CS is providing any such services and related information solely on an arm's length basis and not as an advisor or fiduciary to the municipality. In connection with the provision of the any such services, there is no agreement, direct or indirect, between any municipality (including the officials,management, employees or agents thereof) and CS for CS to provide advice to the municipality. Municipalities should consult with their financial, accounting and legal advisors regarding any such services provided by CS. In addition, CS is not acting for direct or indirect compensation to solicit the municipality on behalf of an unaffiliated broker, dealer, municipal securities dealer, municipal advisor, or investment adviser for the purpose of obtaining or retaining an engagement by the municipality for or in connection with Municipal Financial Products, the issuance of municipal securities, or of an investment adviser to provide investment advisory services to or on behalf of the municipality. If this report is being distributed by a financial institution other than Credit Suisse AG, or its affiliates, that financial institution is solely responsible for distribution. Clients of that institution should contact that institution to effect a transaction in the securities mentioned in this report or require further information. This report does not constitute investment advice by Credit Suisse to the clients of the distributing financial institution, and neither Credit Suisse AG, its affiliates, and their respective officers, directors and employees accept any liability whatsoever for any direct or consequential loss arising from their use of this report or its content. No information or communication provided herein or otherwise is intended to be, or should be construed as, a recommendation within the meaning of the US Department of Labor’s final regulation defining "investment advice" for purposes of the Employee Retirement Income Security Act of 1974, as amended and Section 4975 of the Internal Revenue Code of 1986, as amended, and the information provided herein is intended to be general information, and should not be construed as, providing investment advice (impartial or otherwise). Copyright © 2019 CREDIT SUISSE AG and/or its affiliates. All rights reserved. When you purchase non-listed Japanese fixed income securities (Japanese government bonds, Japanese municipal bonds, Japanese government guaranteed bonds, Japanese corporate bonds) from CS as a seller, you will be requested to pay the purchase price only

起点财经,网罗天下报告
Start Your Finance