global insurance cfo survey - building a better … 3 global insurance cfo survey while growth is...
TRANSCRIPT

Global Insurance CFO Survey Summary of findings
Global Insurance CFO Survey Page 1
Introduction
► Conducted during the first half of 2014, this survey of senior executives across 35 global insurers (13 non-life, 9 life, 9 multi-line, 4 specialty/reinsurance) seeks to understand the issues and challenges facing finance and actuarial organizations and the possible activities these carriers intend to implement to respond ► Questions cover a variety of issues including key business drivers, finance and actuarial priorities and current and
future operating models
► Key benchmarks including headcount and expense metrics were collected to better understand the current state of the finance and actuarial functions and to provide survey participants with useful information to gauge their current situation
► The survey also sought to understand trends involving shared services and outsourcing programs currently in use and planned in the next several years
► Survey participants included senior finance, accounting and actuarial executives in life, non-life and multi-line insurance companies across 10 leading insurance markets ► Executives interviewed included, but were not limited to CFOs, chief accounting officers, and
corporate controllers
► Premium volume across all participants totalled more than $330 billion with per carrier amounts ranging from just under $2 billion to nearly $50 billion
► Carriers included 10 of the top 25 global insurers as ranked by A.M. Best Company
► We hope you find the results of this survey informative and thought provoking. EY welcomes the opportunity to discuss these findings in more detail and review potential approaches to improve the finance and actuarial function within your organization.

Global Insurance CFO Survey Page 2
Executive summary
► Our new Global Insurance CFO Survey – 2014 highlights major issues and challenges for financial and actuarial functions. Data, technology and people are key focus areas for improvement through 2020
► Our major findings highlight: ► Among the most cited business drivers’ facing the organization through 2020 – growth was ranked
first, followed by Managing Costs and Regulatory Changes ► Two-thirds of the respondents ranked data and technology issues among the top three challenges
facing the finance and actuarial departments ► Preparing for 2020, the biggest shifts in maturity levels by operating model will be in data
management and technology capabilities – from current to future state ► Onshore shared services are expected to be highly leveraged across transaction processing
functions, with outsourcing selectively targeted at payroll and internal audit ► Decision support and controls are expected to account for a larger share of total finance and
actuarial headcount in 2020
For additional information about this survey, go to ey.com/insurance/CFO2015
Global Insurance CFO Survey Page 3
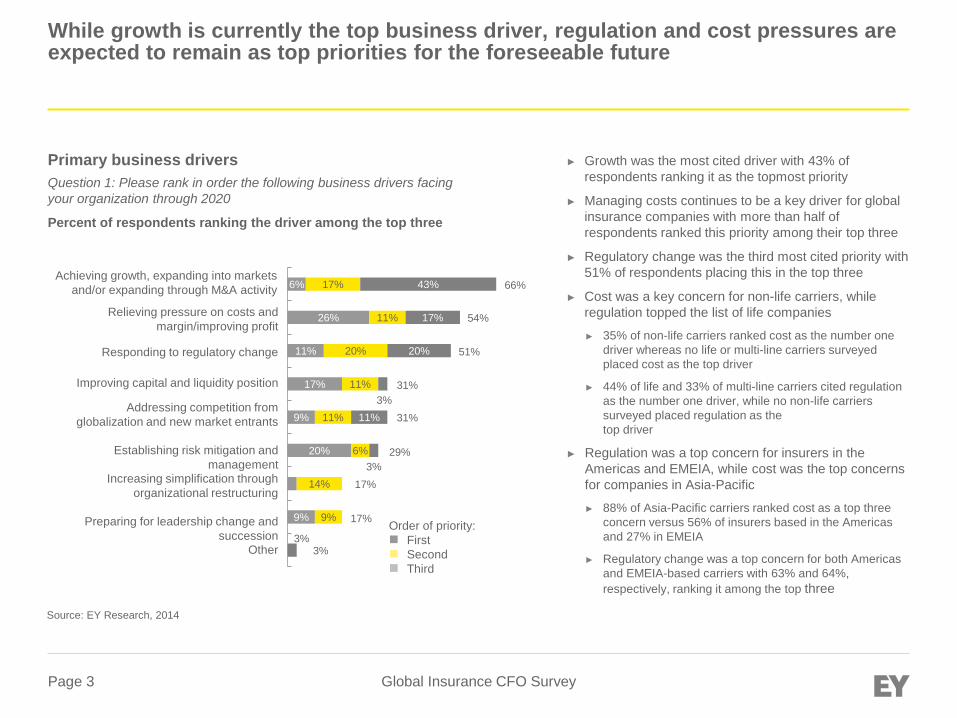
While growth is currently the top business driver, regulation and cost pressures are expected to remain as top priorities for the foreseeable future
► Growth was the most cited driver with 43% of respondents ranking it as the topmost priority
► Managing costs continues to be a key driver for global insurance companies with more than half of respondents ranked this priority among their top three
► Regulatory change was the third most cited priority with 51% of respondents placing this in the top three
► Cost was a key concern for non-life carriers, while regulation topped the list of life companies
► 35% of non-life carriers ranked cost as the number one driver whereas no life or multi-line carriers surveyed placed cost as the top driver
► 44% of life and 33% of multi-line carriers cited regulation as the number one driver, while no non-life carriers surveyed placed regulation as the top driver
► Regulation was a top concern for insurers in the Americas and EMEIA, while cost was the top concerns for companies in Asia-Pacific
► 88% of Asia-Pacific carriers ranked cost as a top three concern versus 56% of insurers based in the Americas and 27% in EMEIA
► Regulatory change was a top concern for both Americas and EMEIA-based carriers with 63% and 64%, respectively, ranking it among the top three
Primary business drivers Question 1: Please rank in order the following business drivers facing your organization through 2020
Percent of respondents ranking the driver among the top three
Source: EY Research, 2014
Achieving growth, expanding into markets and/or expanding through M&A activity
Establishing risk mitigation and management
9%
3%
20%
9%
17%
11%
26%
6%
9%
14%
6%
11%
11%
20%
11%
17%
3%
3%
11% 3%
20%
17%
43% 66%
51%
54%
31%
31%
29%
17%
17%
3% Other
Relieving pressure on costs and margin/improving profit
Responding to regulatory change
Improving capital and liquidity position
Addressing competition from globalization and new market entrants
Increasing simplification through organizational restructuring
Preparing for leadership change and succession
Order of priority: First Second Third
Global Insurance CFO Survey Page 4
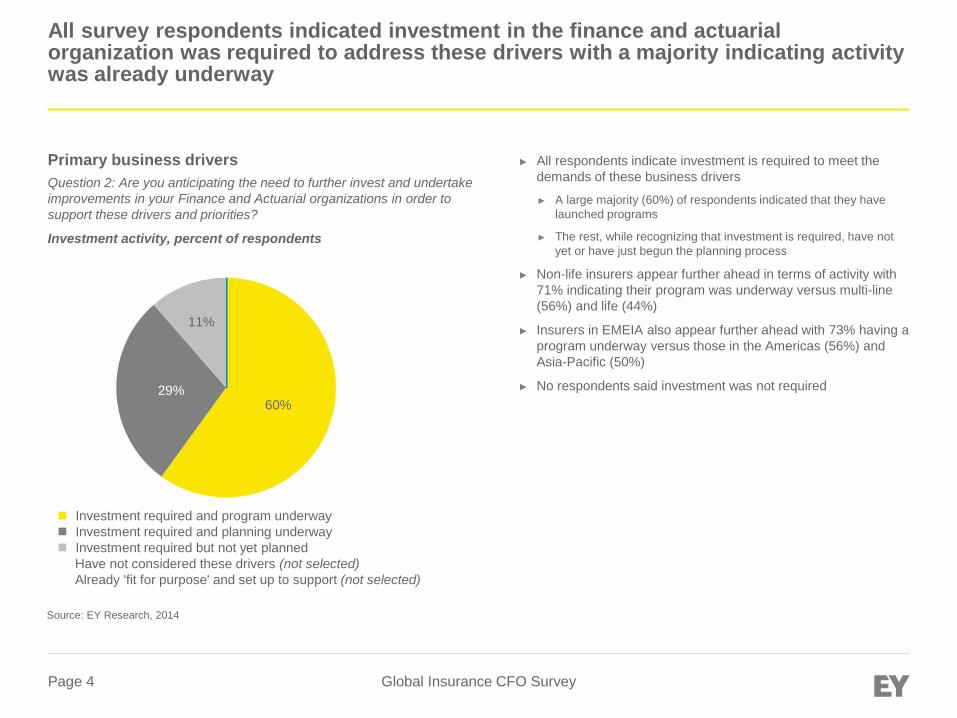
All survey respondents indicated investment in the finance and actuarial organization was required to address these drivers with a majority indicating activity was already underway
► All respondents indicate investment is required to meet the demands of these business drivers
► A large majority (60%) of respondents indicated that they have launched programs
► The rest, while recognizing that investment is required, have not yet or have just begun the planning process
► Non-life insurers appear further ahead in terms of activity with 71% indicating their program was underway versus multi-line (56%) and life (44%)
► Insurers in EMEIA also appear further ahead with 73% having a program underway versus those in the Americas (56%) and Asia-Pacific (50%)
► No respondents said investment was not required
Primary business drivers Question 2: Are you anticipating the need to further invest and undertake improvements in your Finance and Actuarial organizations in order to support these drivers and priorities?
Investment activity, percent of respondents
60% 29%
11%
Investment required and program underway Investment required and planning underway Investment required but not yet planned
Have not considered these drivers (not selected) Already 'fit for purpose' and set up to support (not selected)
Source: EY Research, 2014
Global Insurance CFO Survey Page 5
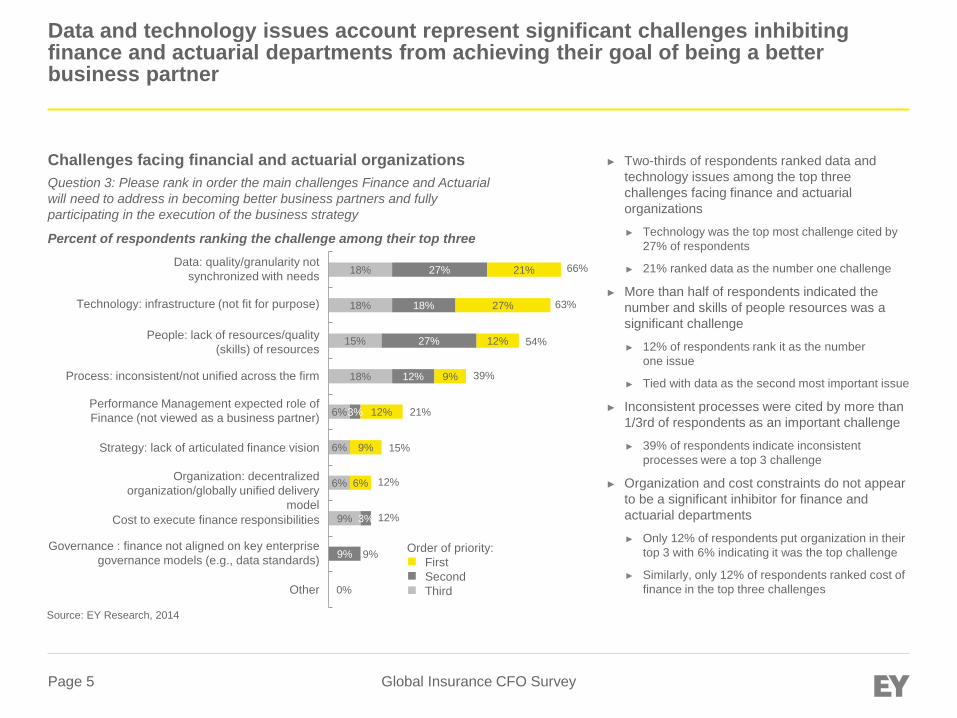
Data and technology issues account represent significant challenges inhibiting finance and actuarial departments from achieving their goal of being a better business partner
► Two-thirds of respondents ranked data and technology issues among the top three challenges facing finance and actuarial organizations
► Technology was the top most challenge cited by 27% of respondents
► 21% ranked data as the number one challenge
► More than half of respondents indicated the number and skills of people resources was a significant challenge
► 12% of respondents rank it as the number one issue
► Tied with data as the second most important issue
► Inconsistent processes were cited by more than 1/3rd of respondents as an important challenge
► 39% of respondents indicate inconsistent processes were a top 3 challenge
► Organization and cost constraints do not appear to be a significant inhibitor for finance and actuarial departments
► Only 12% of respondents put organization in their top 3 with 6% indicating it was the top challenge
► Similarly, only 12% of respondents ranked cost of finance in the top three challenges
Challenges facing financial and actuarial organizations Question 3: Please rank in order the main challenges Finance and Actuarial will need to address in becoming better business partners and fully participating in the execution of the business strategy
Percent of respondents ranking the challenge among their top three
18%
18%
15%
18%
6%
6%
6%
9%
27%
18%
27%
12%
3%
3%
9%
21%
27%
12%
9%
12%
9%
6%
66%
63%
54%
39%
21%
12%
12%
9% Order of priority: First Second Third
15%
Other 0%
Data: quality/granularity not synchronized with needs
Technology: infrastructure (not fit for purpose)
People: lack of resources/quality (skills) of resources
Process: inconsistent/not unified across the firm
Performance Management expected role of Finance (not viewed as a business partner)
Strategy: lack of articulated finance vision
Organization: decentralized organization/globally unified delivery
model Cost to execute finance responsibilities
Governance : finance not aligned on key enterprise governance models (e.g., data standards)
Source: EY Research, 2014
Global Insurance CFO Survey Page 6
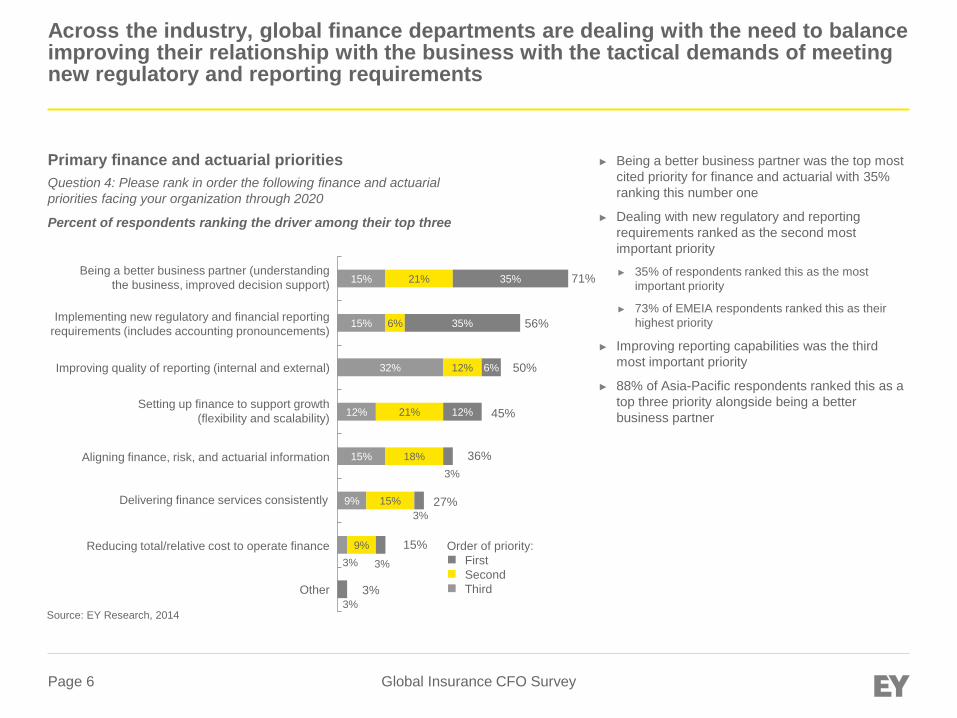
Across the industry, global finance departments are dealing with the need to balance improving their relationship with the business with the tactical demands of meeting new regulatory and reporting requirements
► Being a better business partner was the top most cited priority for finance and actuarial with 35% ranking this number one
► Dealing with new regulatory and reporting requirements ranked as the second most important priority
► 35% of respondents ranked this as the most important priority
► 73% of EMEIA respondents ranked this as their highest priority
► Improving reporting capabilities was the third most important priority
► 88% of Asia-Pacific respondents ranked this as a top three priority alongside being a better business partner
Primary finance and actuarial priorities Question 4: Please rank in order the following finance and actuarial priorities facing your organization through 2020
Percent of respondents ranking the driver among their top three
15%
15%
32%
12%
15%
9%
3%
21%
6%
12%
21%
18%
15%
9%
35%
35%
6%
12%
3%
3%
3%
3%
71%
56%
50%
45%
36%
27%
15% Order of priority: First Second Third 3%
Reducing total/relative cost to operate finance
Being a better business partner (understanding the business, improved decision support)
Implementing new regulatory and financial reporting requirements (includes accounting pronouncements)
Improving quality of reporting (internal and external)
Setting up finance to support growth (flexibility and scalability)
Aligning finance, risk, and actuarial information
Delivering finance services consistently
Other
Source: EY Research, 2014

Global Insurance CFO Survey Page 7
To address these priorities, the majority of respondents have implemented change programs or are in the planning stage while only a small number believe they have the right capabilities in place
► 85% of respondents have programs underway or are planning change programs
► 44% indicated that programs are currently underway
► 41% indicated that planning is in progress
► Less than 10% recognize that investment is required, but have not yet begun the planning process
► Only 6% believe they have the right capabilities in place
► No respondents indicated that these priorities have not been considered
► Non-life companies are more likely to have a program underway (50%) while life companies are more likely to be in the planning stage (56%)
► 60% of Americas respondents noted that planning is already underway to address the priorities for Finance and Actuarial while 64% of EMEIA respondents already had a change program underway
Primary finance and actuarial priorities Question 5: Where are you in your Finance and Actuarial planning to address the top five priorities
Change program activity, percent of respondents
Plans in place and change program underway to deliver on priorities
Priorities considered and planning underway to address Have considered priorities but no planning in place yet All ready 'fit for purpose' and limited improvements required
Have not considered these priorities (not selected)
44%
41%
9%
6%
Source: EY Research, 2014
Global Insurance CFO Survey Page 8
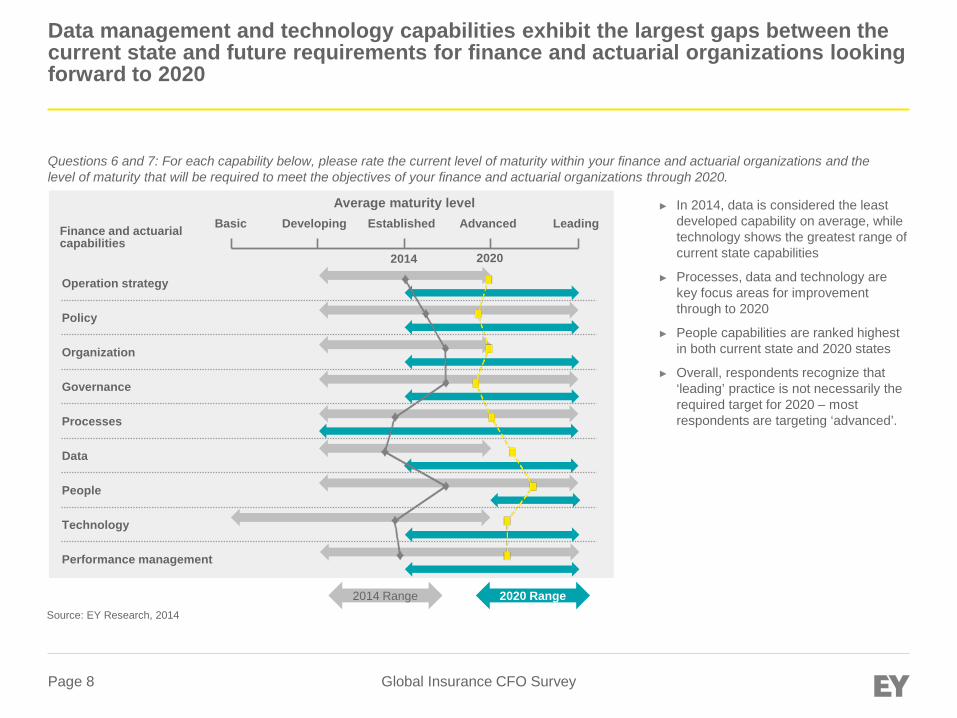
Data management and technology capabilities exhibit the largest gaps between the current state and future requirements for finance and actuarial organizations looking forward to 2020
► In 2014, data is considered the least developed capability on average, while technology shows the greatest range of current state capabilities
► Processes, data and technology are key focus areas for improvement through to 2020
► People capabilities are ranked highest in both current state and 2020 states
► Overall, respondents recognize that ‘leading’ practice is not necessarily the required target for 2020 – most respondents are targeting ‘advanced’.
Questions 6 and 7: For each capability below, please rate the current level of maturity within your finance and actuarial organizations and the level of maturity that will be required to meet the objectives of your finance and actuarial organizations through 2020.
Finance and actuarial capabilities
Basic Developing Established Advanced Leading
2014 Range 2020 Range
Average maturity level
2014 2020
Source: EY Research, 2014
Operation strategy
Policy
Organization
Governance
Processes
Data
People
Technology
Performance management

Global Insurance CFO Survey Page 9
Decision support functions will require the greatest shift from current to future state
► All process groups require an upgrade in capability
► Transaction processing and decision support are felt to be the least advanced in current state
► Decision support capabilities are seen as the key focus for improvement
Questions 8 and 9: For each finance process group, please rate the current and expected (2020) levels of maturity within your finance and actuarial organizations.
Finance and actuarial process groups
Basic Developing Established Advanced Leading
2014 Range 2020 Range
Average maturity level
2014 2020
Source: EY Research, 2014
Transaction processing
Reporting
Decision support
Controls
Finance function management
Global Insurance CFO Survey Page 10
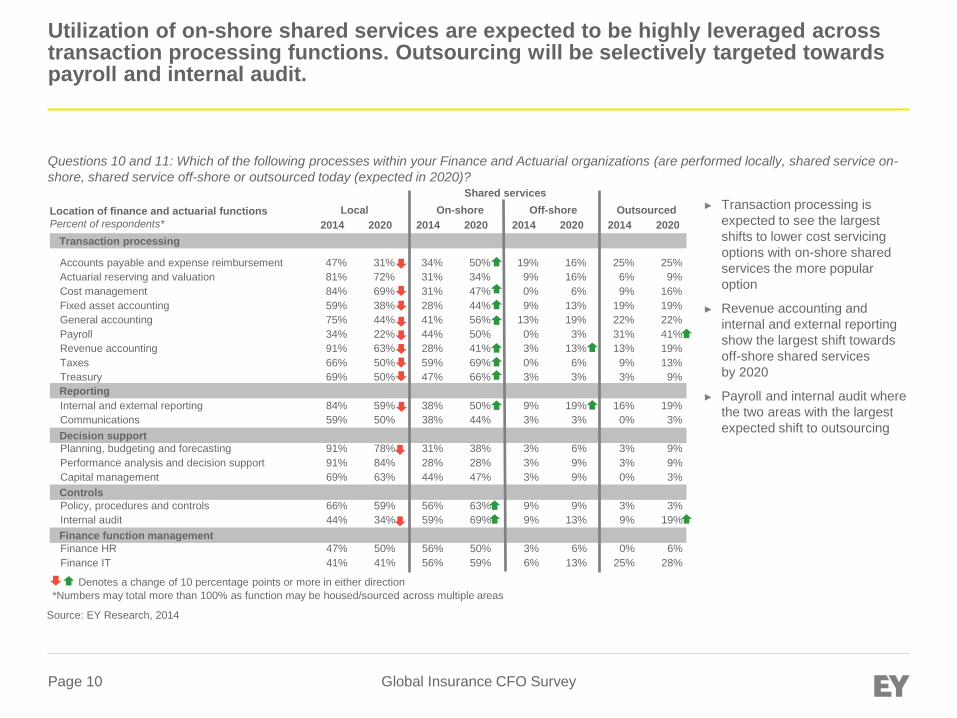
Utilization of on-shore shared services are expected to be highly leveraged across transaction processing functions. Outsourcing will be selectively targeted towards payroll and internal audit.
Transaction processing
Reporting
Decision support
Controls
Finance function management
Accounts payable and expense reimbursement 47% 31% 34% 50% 19% 16% 25% 25% Actuarial reserving and valuation 81% 72% 31% 34% 9% 16% 6% 9% Cost management 84% 69% 31% 47% 0% 6% 9% 16% Fixed asset accounting 59% 38% 28% 44% 9% 13% 19% 19% General accounting 75% 44% 41% 56% 13% 19% 22% 22% Payroll 34% 22% 44% 50% 0% 3% 31% 41% Revenue accounting 91% 63% 28% 41% 3% 13% 13% 19% Taxes 66% 50% 59% 69% 0% 6% 9% 13% Treasury 69% 50% 47% 66% 3% 3% 3% 9% Internal and external reporting 84% 59% 38% 50% 9% 19% 16% 19% Communications 59% 50% 38% 44% 3% 3% 0% 3% Planning, budgeting and forecasting 91% 78% 31% 38% 3% 6% 3% 9% Performance analysis and decision support 91% 84% 28% 28% 3% 9% 3% 9% Capital management 69% 63% 44% 47% 3% 9% 0% 3% Policy, procedures and controls 66% 59% 56% 63% 9% 9% 3% 3% Internal audit 44% 34% 59% 69% 9% 13% 9% 19% Finance HR 47% 50% 56% 50% 3% 6% 0% 6% Finance IT 41% 41% 56% 59% 6% 13% 25% 28%
2014 2020 2014 2020 2014 2020 2014 2020 Local
Shared services On-shore Off-shore Outsourced Location of finance and actuarial functions
Percent of respondents*
Denotes a change of 10 percentage points or more in either direction *Numbers may total more than 100% as function may be housed/sourced across multiple areas
► Transaction processing is expected to see the largest shifts to lower cost servicing options with on-shore shared services the more popular option
► Revenue accounting and internal and external reporting show the largest shift towards off-shore shared services by 2020
► Payroll and internal audit where the two areas with the largest expected shift to outsourcing
Questions 10 and 11: Which of the following processes within your Finance and Actuarial organizations (are performed locally, shared service on-shore, shared service off-shore or outsourced today (expected in 2020)?
Source: EY Research, 2014
Global Insurance CFO Survey Page 11
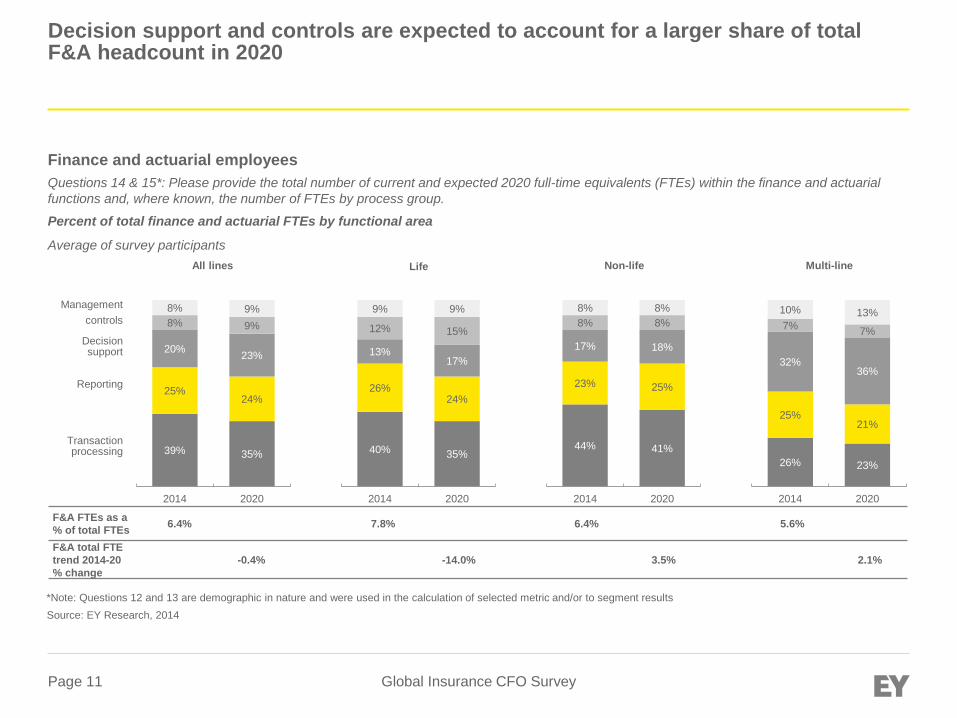
Decision support and controls are expected to account for a larger share of total F&A headcount in 2020
Finance and actuarial employees Questions 14 & 15*: Please provide the total number of current and expected 2020 full-time equivalents (FTEs) within the finance and actuarial functions and, where known, the number of FTEs by process group.
Percent of total finance and actuarial FTEs by functional area
Average of survey participants
F&A FTEs as a % of total FTEs 6.4% 7.8% 6.4% 5.6%
F&A total FTE trend 2014-20 % change
-0.4% -14.0% 3.5% 2.1%
39% 35%
25% 24%
20% 23%
8% 9% 8% 9%
2014 2020
Transaction processing
Reporting
Decision support
controls Management
All lines
40% 35%
26% 24%
13% 17%
12% 15%
9% 9%
2014 2020
44% 41%
23% 25%
17% 18%
8% 8% 8% 8%
2014 2020
26% 23%
25% 21%
32% 36%
7% 7%
10% 13%
2014 2020
Life Non-life Multi-line
*Note: Questions 12 and 13 are demographic in nature and were used in the calculation of selected metric and/or to segment results Source: EY Research, 2014
Global Insurance CFO Survey Page 12
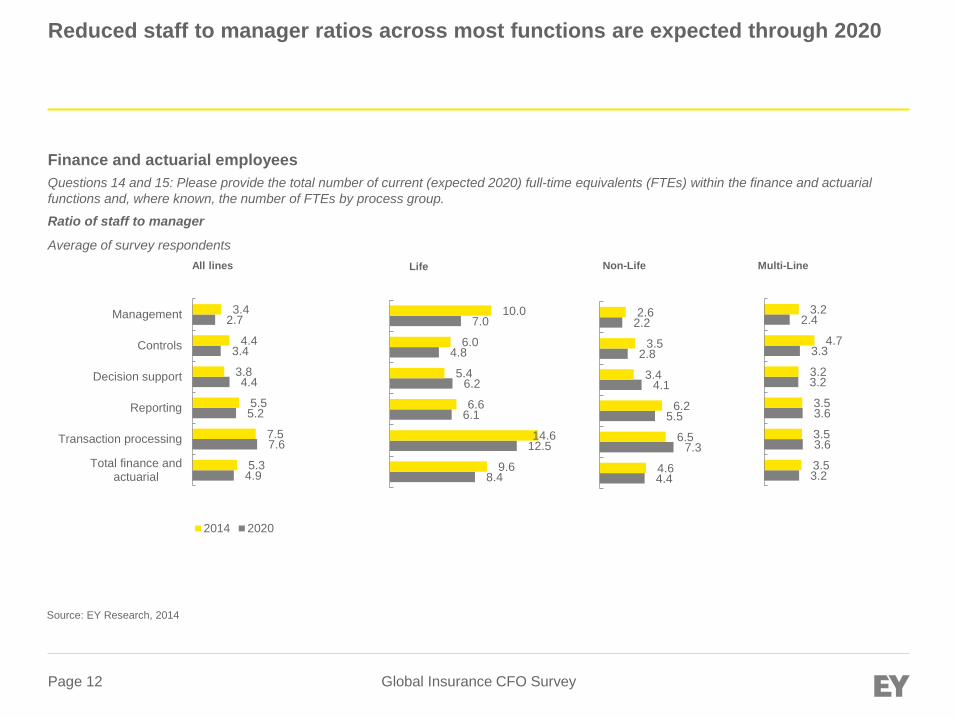
Reduced staff to manager ratios across most functions are expected through 2020
Finance and actuarial employees Questions 14 and 15: Please provide the total number of current (expected 2020) full-time equivalents (FTEs) within the finance and actuarial functions and, where known, the number of FTEs by process group.
Ratio of staff to manager
Average of survey respondents
4.9
7.6
5.2
4.4
3.4
2.7
5.3
7.5
5.5
3.8
4.4
3.4
Total finance andactuarial
Transaction processing
Reporting
Decision support
Controls
Management
2014 2020
4.4
7.3
5.5
4.1
2.8
2.2
4.6
6.5
6.2
3.4
3.5
2.6
3.2
3.6
3.6
3.2
3.3
2.4
3.5
3.5
3.5
3.2
4.7
3.2
All lines Non-Life Multi-Line
8.4
12.5
6.1
6.2
4.8
7.0
9.6
14.6
6.6
5.4
6.0
10.0
Life
Source: EY Research, 2014

Global Insurance CFO Survey Page 13
Transaction processing and decision support account for the largest share of finance and actuarial (F&A) expenses
6.7%
5.1%
5.5%
5.4%
Life
Non-Life
Multi-line
Total
0.8%
0.8%
1.0%
0.8%
Life
Non-life
Multi-line
Total
Cost of finance Question 16: What was the amount of General and Administrative expenses across the enterprise for 2012 (USD)? Finance and actuarial as a percent of general and administrative expenses Percent
Finance and actuarial as a percent of total premium Percent
Question 17: Please provide the total cost of finance and actuarial and, where known the cost by process group.
Cost of finance and actuarial by function* Percent of total
*Cost is defined as personnel cost, systems, outsourcing, overhead, and other expenses Source: EY Research, 2014
Transaction processing
Reporting
Decision support
Management
Controls
37%
22%
25%
6%
10%
All lines
Global Insurance CFO Survey Page 14
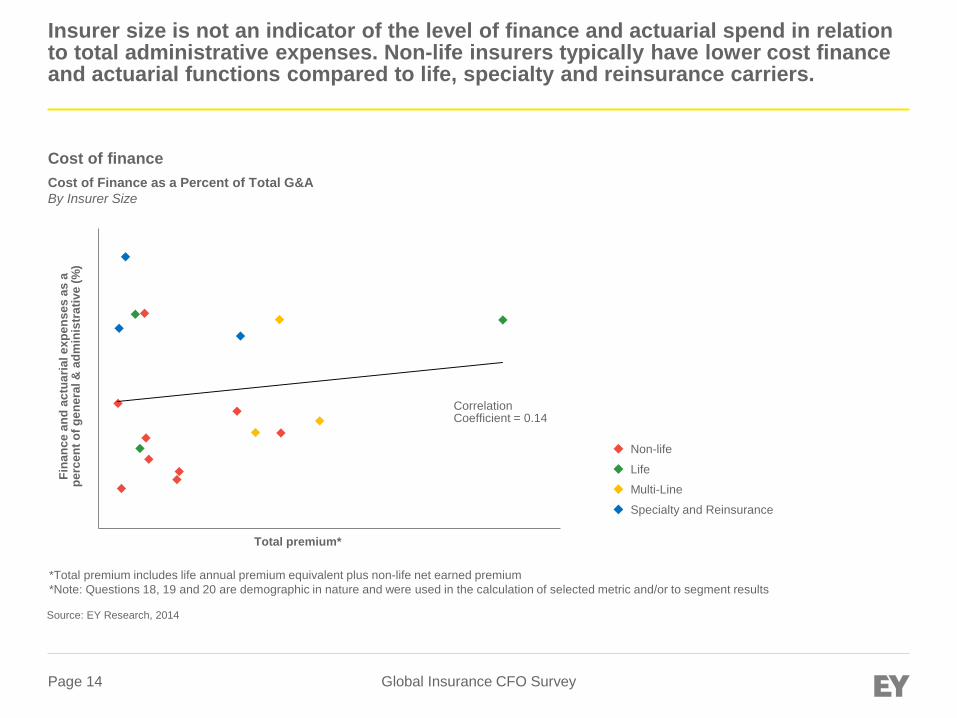
Insurer size is not an indicator of the level of finance and actuarial spend in relation to total administrative expenses. Non-life insurers typically have lower cost finance and actuarial functions compared to life, specialty and reinsurance carriers.
Cost of finance Cost of Finance as a Percent of Total G&A By Insurer Size
*Total premium includes life annual premium equivalent plus non-life net earned premium *Note: Questions 18, 19 and 20 are demographic in nature and were used in the calculation of selected metric and/or to segment results
Source: EY Research, 2014
Total premium*
Fina
nce
and
actu
aria
l exp
ense
s as
a
perc
ent o
f gen
eral
& a
dmin
istr
ativ
e (%
)
Correlation Coefficient = 0.14
Non-life
Life
Multi-Line
Specialty and Reinsurance

Global Insurance CFO Survey Page 15
The time to complete given tasks within a reporting cycle varies, with management reporting taking the longest within the monthly reporting cycle
► On average, the number of days to complete a given finance activity is correlated to the timing of the reporting cycle (monthly, quarterly, annually) ► Monthly activities were completed in 18
days on average
► Quarterly activities took 32 days to complete
► Year end activities totaled more than 45 days
► Management reporting consumes the most time among monthly activities
Finance and actuarial cycle times Question: 21 Please provide the number of working days to complete the following activities monthly, quarterly and at year end Number of days to complete activity Average number of working days
8
13
18
7
Close the books Produce external reporting
Produce management reporting Produce forecast reporting package M
onth
ly
Qua
rter
ly
Year
-end
Close the books Produce external reporting
Produce management reporting Produce forecast reporting package
Close the books Produce external reporting
Produce management reporting Produce forecast reporting package
12
32
25
13
15
45
34
19
Source: EY Research, 2014

Global Insurance CFO Survey Page 16
Transformation programs are more likely for finance operations than actuarial with 71% planning or completing an project in the next three years. Nearly 1/3rd of respondents do not expect to transform the actuarial function.
No, and no plans to
No, but plan to in 1-3 years
Yes, expect completion in
1-3 years
Yes, completed
Finance and actuarial transformation programs Questions 22 and 23: Has your company undergone a transformation of its Finance and Actuarial functions?
Percent of respondents Percent
13%
32% 16%
13%
61%
45%
10% 10%
Finance Actuarial
13% 25%
13%
25%
75%
50%
Finance Actuarial
20%
47% 13%
7%
53%
40%
13% 7%
Finance Actuarial
13% 25%
13%
63% 50%
13% 25%
Finance Actuarial
All lines Life Non-life Multi-line
Source: EY Research, 2014

Global Insurance CFO Survey Page 17
All respondents indicated some level of integration between the finance and actuarial functions with 81% indicating full integration completed or expected by 2020
19%
19%
42%
19%
Completely Integrated
Full Integration Nearly Complete
Partial Integration with Plans for Full by 2020
Partial Integration with No Plans for Full
Question 24 How aligned are Finance and Actuarial in the planning, budgeting and forecasting areas?
Integration of finance and actuarial functions
Percent of respondents Percent
► The majority of respondents have integrated or nearly integrated their finance and actuarial functions for planning, budgeting and forecasting purposes
► 38% of respondents have completely or nearly completely integrated their finance and actuarial functions
► Nearly half (42%) of respondents indicated that they expect full integration by 2020
► Less than 20% do not expect to fully integrate their finance and actuarial functions
► No respondents indicated that these functions are not at all integrated
► 83% of Asia-Pacific respondents noted that they had no plans to further integrate finance and actuarial by 2020
Source: EY Research, 2014

Appendix 1 – Participant demographics

Global Insurance CFO Survey Page 19
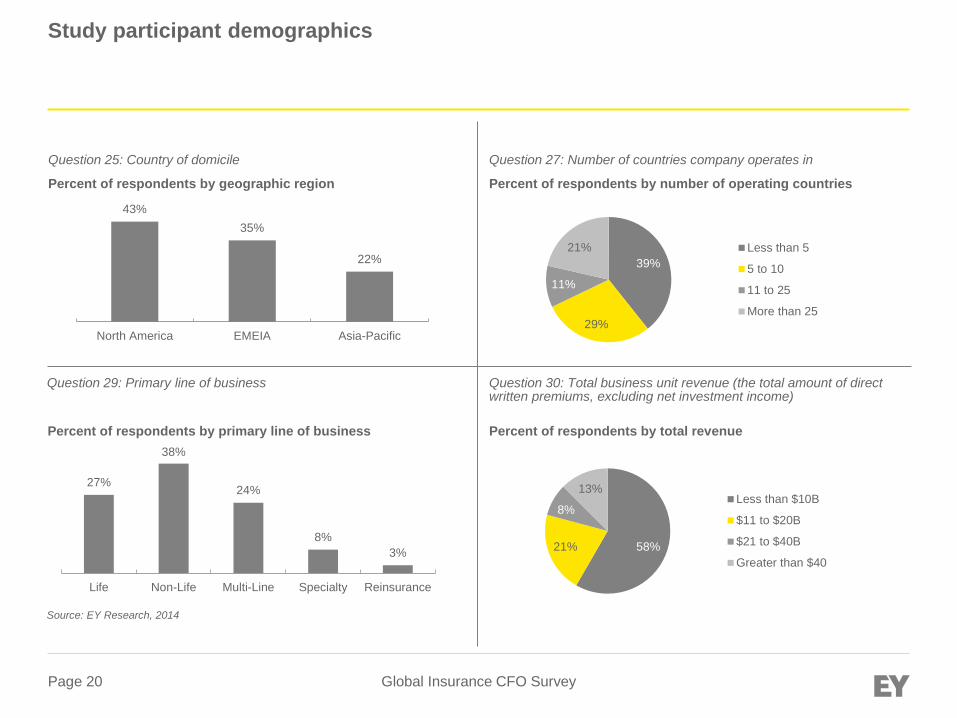
Study participant demographics
Question 12: What was your organization's level of premiums that were written in 2012? Please provide in USD.; Total Life Premium Volume (Annual Premium Equivalent) and Total non-life Premium (Net Earned Premium)
Question 13: How many employees are employed by your company worldwide, across all functions?
44%
12%
18%
26% $1B to $5B
$6B to $10B
$11B to $20B
More than $20B
Percent of respondents by 2012 total premium size Percent of respondents by number of employees
39%
42%
18% Less than 10K
10K to 50K
More than 50K
Question 18: How many geographical locations does Finance and Actuarial operate in across your organization? Percent of respondents by number of F&A locations
52%
14%
0% 3%
31%
1 to 5 6 to 10 11 to 15 16 to 20 More than 20
Question 19: How many legal entities in your company are supported by your Finance organization? Percent of respondents by number of entities supported by F&A
10% 7% 3% 7%
73%
1 to 5 6 to 10 11 to 15 16 to 20 More than 20
Source: EY Research, 2014
Global Insurance CFO Survey Page 20
Study participant demographics
Question 29: Primary line of business Question 30: Total business unit revenue (the total amount of direct written premiums, excluding net investment income)
27%
38%
24%
8% 3%
Life Non-Life Multi-Line Specialty Reinsurance
Percent of respondents by total revenue Percent of respondents by primary line of business
58% 21%
8%
13% Less than $10B
$11 to $20B
$21 to $40B
Greater than $40
Question 25: Country of domicile
Percent of respondents by geographic region
43% 35%
22%
North America EMEIA Asia-Pacific
Question 27: Number of countries company operates in
Percent of respondents by number of operating countries
39%
29%
11%
21% Less than 5
5 to 10
11 to 25
More than 25
Source: EY Research, 2014

Appendix 2 – Maturity models

Global Insurance CFO Survey Page 22
Basic Developing Established Advanced Leading
Operation Strategy
Policy
Organization
Governance
Processes
Organized on a divisional with divisional / regional shared services. Business area teams primary focus is production of reporting with value adding commentaries and insight
Identified and managed formally across divisions and regional / global shared service centers, process owners exist globally covering all divisions and BU’s
Q6 – For each capability below, please rate the current level of maturity within your Finance and Actuarial organizations. Q7 – For each capability below, please indicate the level of maturity that will be required to meet the objectives of your Finance and Actuarial organizations through 2020.
Policies are set at BU level ensuring that division policies are complied with, policies are regularly reviewed and updated within Finance, responsibility for execution of policies is clear within divisions
Policies are defined centrally and are mandated in all divisions, regularly reviewed and updated with consultation, responsibility for policy execution is clear across divisions and is formally documented
Legend: Current state 2020 target
Organized on Regional basis driven by a global strategy or approach and some global functions, shared services and global services
Identified, standardized and managed formally within divisions and regional shared service centers, divisional process owners exist covering all business unit level processes
Corporate finance steering committees w/ cross-functional representation established for main finance service delivery areas; High-level definitions of roles & responsibilities in place, some accountability gaps; Global process ownership concept accepted at enterprise level, impacting some finance processes
Use of multiple governance methods to gain cross-functional alignment; Clear definitions of roles and responsibilities, accountability for performance; Global process ownership successfully implemented in some areas of the business, crossing functional boundaries, impacting the majority of finance processes
Some services moved off shore, no globalization strategy in place; Small number of roles w/ individual goals, performance measurement aligned to process performance objectives, measures resulting in matching goals and priorities in some parts of the organization; Limited number of staff w/ adequate knowledge of industry, marketplace, business environment
Formulated, implementing strategy to globalize service delivery model to realize labor arbitrage opportunities; large number of roles w/ individual goals, performance measurement aligned to process performance objectives, measures; Most staff has adequate knowledge of industry, marketplace, business environment
Source: EY Research, 2014
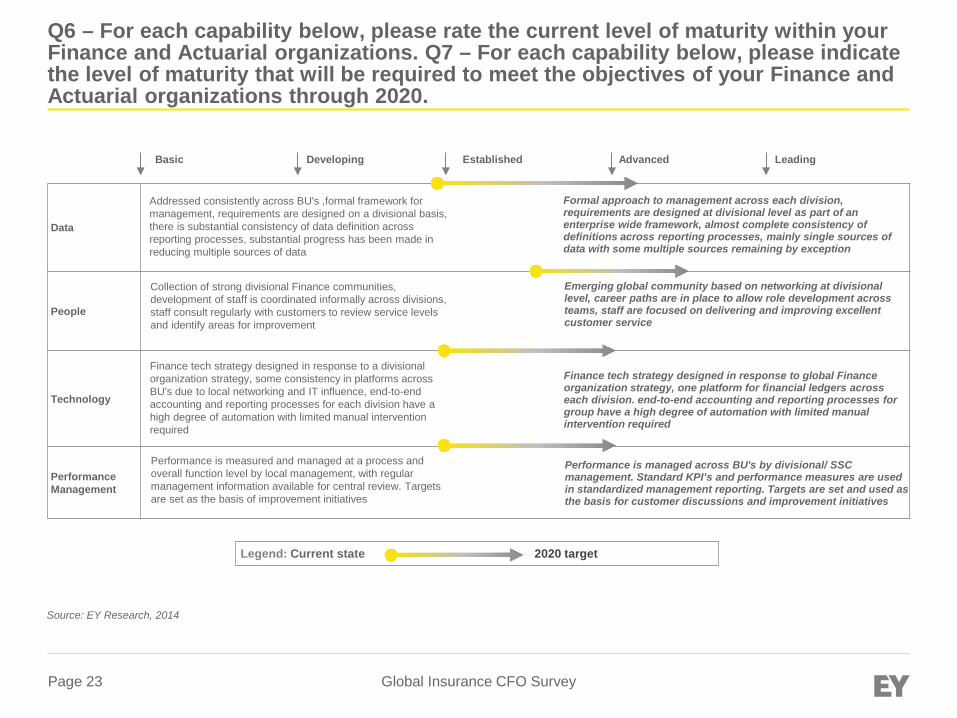
Global Insurance CFO Survey Page 23
Basic Developing Established Advanced Leading
Data
People
Technology
Performance Management
Addressed consistently across BU's ,formal framework for management, requirements are designed on a divisional basis, there is substantial consistency of data definition across reporting processes, substantial progress has been made in reducing multiple sources of data
Formal approach to management across each division, requirements are designed at divisional level as part of an enterprise wide framework, almost complete consistency of definitions across reporting processes, mainly single sources of data with some multiple sources remaining by exception
Collection of strong divisional Finance communities, development of staff is coordinated informally across divisions, staff consult regularly with customers to review service levels and identify areas for improvement
Emerging global community based on networking at divisional level, career paths are in place to allow role development across teams, staff are focused on delivering and improving excellent customer service
Finance tech strategy designed in response to a divisional organization strategy, some consistency in platforms across BU's due to local networking and IT influence, end-to-end accounting and reporting processes for each division have a high degree of automation with limited manual intervention required
Finance tech strategy designed in response to global Finance organization strategy, one platform for financial ledgers across each division. end-to-end accounting and reporting processes for group have a high degree of automation with limited manual intervention required
Performance is measured and managed at a process and overall function level by local management, with regular management information available for central review. Targets are set as the basis of improvement initiatives
Performance is managed across BU's by divisional/ SSC management. Standard KPI’s and performance measures are used in standardized management reporting. Targets are set and used as the basis for customer discussions and improvement initiatives
Q6 – For each capability below, please rate the current level of maturity within your Finance and Actuarial organizations. Q7 – For each capability below, please indicate the level of maturity that will be required to meet the objectives of your Finance and Actuarial organizations through 2020.
Legend: Current state 2020 target
Source: EY Research, 2014

Global Insurance CFO Survey Page 24
Basic Developing Established Advanced Leading
Transaction processing
Reporting
Decision support
Controls
Finance function management
Budget/forecast somewhat models the business; consistent timeframes across org; Execs responsible target setting, achievement;, and motivated to set realistic budgets; Most leaders understand the process; Tech platform is implemented, off-line data analysis, use of spreadsheets, and ineffective use of data common; data correctly mapped; moderate confidence in the data; tools relatively easy to use
Q8 – For each finance process group below, please rate the current level of maturity within your Finance and Actuarial organizations. Q9 – For each finance process group below, please indicate the level of maturity that will be required to meet the objectives of your Finance and Actuarial organizations through 2020.
SLs pull from systems require manual intervention; SL data transferred to GL electronically; top-side JEs required; manual &automated processes exist; account analysis is common; electronic document storage exists not user friendly not integrated with system; KPIs defined, established & reporting available,; processes regionally centralized not standardized; common COA in use, limited rationalization; receipt and distribution of electronic documents being tested
Components of rolling forecast utilized; BF is a fairly accurate model of business; incentive comp motivates behaviors; leaders understand the process; confidence among leaders; tech implemented to achieve integration of key metrics in BF, decision making; sources of data traceable, confidence in the data, issues exist; tools’ functionality easily understood
Preparation of the BS and P&L automated; Cash Flow manual: established limited set of report types; Adequate and consistent finance technical skills; uneven business acumen within finance; Single master data system within BUs; some manual procedures to interface; consolidation done primarily in ledger with some Excel reporting
All Financial Statement preparation is automated; adequate and consistent technical skills and business understanding within finance; rotation programs and leadership training is available for select individuals; streamlined consolidation using a dedicated consolidation tool
Automated processes with improved first time match rates; common close calendar in place; transactions standardized, centralized by region; workflow approvals exists; automated reconciliations; Standard COA, governance in place; sub-ledger data electronically transferred to GL, web-enable interfaces, automatic data capture; few JEs needed; KPI are reported to management and effectively utilized; majority originating transactions submitted electronically
Enterprise & departmental policies, procedures documented, communicated; IA’s coordination w/ other risk functions recent; plan developed on dynamic basis, annually, includes subject matter specialists; on major change initiative teams; deployed globally, cost effective structure, leverage local knowledge, presence; co-sourcing showing effectiveness; data analytics not used extensively; tools deployed, not fully integrated, for planning, repository, not internal controls
Enterprise & departmental policies, procedures reflect values of the org; audit plan created in dynamic, flexible format, years’ work planned/forecasted, auditee input; key member of change initiative teams; rotational program; leverage off-shore/low cost areas for talent; establishes data analytics to facilitate real-time auditing; tech integrated w/other risk activities; integrated tool automates performance, monitoring risk data capture
HR has a functional relationship w/ BUs, input on strategic people-related initiatives;:IT org has formal plan/approach to ensure alignment of IT with the key business drivers and corporate strategy, effective IT leadership, addresses overall IT governance issues; IT org has formal service delivery plan/approach to dealing w/ issues, problems and risks of delivering IT support services, infrastructure, applications
HR operates efficiently, seamlessly w/ BUs, consulted on people-related initiatives; provides process improvement, controls recommendations: IT org fairly advanced, sophisticated experience, expertise ensuring IT aligns w/key business drivers, corp. strategy; effective leadership, addresses IT governance issues; Fairly advanced service delivery model, sophisticated experience, expertise dealing w/ issues, concerns delivering IT support, infrastructure, applications
Legend: Current state 2020 target Source: EY Research, 2014

EY | Assurance | Tax | Transactions | Advisory About EY EY is a global leader in assurance, tax, transaction and advisory services. The insights and quality services we deliver help build trust and confidence in the capital markets and in economies the world over. We develop outstanding leaders who team to deliver on our promises to all of our stakeholders. In so doing, we play a critical role in building a better working world for our people, for our clients and for our communities. EY refers to the global organization, and may refer to one or more, of the member firms of Ernst & Young Global Limited, each of which is a separate legal entity. Ernst & Young Global Limited, a UK company limited by guarantee, does not provide services to clients. For more information about our organization, please visit ey.com. Ernst & Young LLP is a client-serving member firm of Ernst & Young Global Limited operating in the US. © 2015 Ernst & Young LLP. All Rights Reserved. 1410-13244536 NY EYG no: EG0206 ED None This material has been prepared for general informational purposes only and is not intended to be relied upon as accounting, tax or other professional advice. Please refer to your advisors for specific advice.
ey.com
Contacts Global David Foster [email protected] +44 20 7951 5687 ASEAN Esther See [email protected] +65 6309 6182 EMEIA Ian J. Robinson [email protected] +44 20 7951 6106 Greater China Phil Gough [email protected] +852 28469778 Oceania Andy Robertson [email protected] +61 2 9248 5436 US Sandy Sposato [email protected] +1 212-773 6231