global insurance review 2016 and outlook 2017/18 · 2 swiss re global insurance review 2016 and...
TRANSCRIPT

Swiss Re Dots ImageryTitle: Continent AsiaCategory: Agriculture and Nature
Copyright © 2010 Swiss Re
Scriptographer Plugin
10
50
November 2016
Global insurance review 2016 and outlook 2017/18
01 Executive summary
02 The macro environmment: modest growth expected
12 Non-life re/insurance: improving growth, challenges to profitability
24 Life re/insurance: transition to a new reality
35 Emerging markets: improved growth in non-life, strong performance in life
Swiss Re Global insurance review 2016 and outlook 2017/18 1
Executive summary
Moderate growth is expected over the next two years, with US real GDP growing slightly faster than 2%, the Euro area by about 1.5%, and the UK by 1.0-1.5%. The election of Donald Trump as president-elect in the US has increased uncertainty about future US policies, but is unlikely to derail this outlook. Japan will grow by less than 1%, and China by about 6.5%. Most emerging markets will expand by 2–4%, with Asia performing particularly well. Inflation remains subdued but concerns are rising about US wages and fiscal policy. Monetary policy will remain highly accommodative in the next two years, even as the US gradually raises rates. Other central banks are expected to keep rates on hold and quantitative easing (QE) policies intact, with perhaps some expanded QE action in Japan and the Euro area. Key risks to the outlook are a potential hard landing in China, US Federal Reserve (Fed) tightening on higher inflation, and ongoing political issues in Europe (eg, Brexit, Ukraine). With the Fed raising rates, US 10-year government bond yields will likely rise, pulling yields in Europe up also.
In inflation-adjusted (real) terms, insurance premium volumes continue to expand, bolstered by strong growth in emerging markets. Global primary non-life premium growth is forecast to be slightly weaker at 2.2% in 2017 compared with 2.4% this year, and then improve to 3.0% in 2018. Premium growth in emerging markets will improve steadily from 5.3% in 2016 to 5.7% in 2017 and 6.7% in 2018. Though the pricing environment in non-life remains challenging, underwriting profits have been sustained by low natural catastrophe losses and reserve releases. Pricing in commercial lines continues to deteriorate, but at a slower pace. Research on trade in goods indicates that marine insurance premium growth will be weak for the time being. On the other hand, premium growth for cyber risk is expected to grow from a low base over the next decade. For non-life primary insurers, assuming average natural catastrophe losses and shrinking reserve releases, sector return on equity (RoE) is likely to decline from 8% in 2015 to 6% in 2016-18. Global reinsurance premium growth will be slightly less, and profits slightly higher than the levels for primary non-life insurers, but follow the same pattern.
Growth in real primary life insurer premiums will be significantly stronger than non-life premium growth, sustained by robust growth of savings products in emerging markets, particularly Asia. Global premiums are forecast to grow by 5.4%, 4.8% and 4.2% in 2016, 2017 and 2018, respectively. The declining pace of growth is attributable to emerging Asia, with premiums forecast to rise by 27%, 17% and 12% in these three years. The RoE for the sector has declined from 13% in early 2015 to 10% recently as investment returns have weakened and pricing pressures have increased. Life insurers are adjusting product and asset portfolios in a bid to boost profitability. Global medical expense premiums will likely follow global economic trends, with rises of 3.6%, 3.4% and 3.2% for the years 2016 to 2018. Global life reinsurance premium growth is expected to be about 1.5% this year and around 1% in the following two years, primarily due to the close-to-zero growth in the advanced economies where the bulk of cessions originate. Reinsurance premium growth in the emerging markets will be 8% or higher, with a particularly strong contribution from China, where the government has a target to increase the insurance penetration rate.
Non-life real premium growth in emerging markets is expected to improve to 6–7% in 2017 and 2018, from 5.3% in 2016. As usual, Emerging Asia will have the strongest growth rate at near 8% in 2017 and 9% in 2018. Now that commodity prices have stabilised, growth in premiums in Latin America and Sub-Saharan Africa (SSA) will return to about 4% by 2018, while the Middle East and North Africa (MENA) and Central and Eastern Europe (CEE) are expected to sustain growth near 5% and 4%, respectively. Life premium growth will likely be strong in Emerging Asia over the next two years. In MENA and Latin America, premium growth is forecast to exceed 5%, and SSA and CEE are expected to recover from the recent slump. Insurance premium growth in the emerging markets will be fuelled by the rising middle class and also by Chinese investments in the One Belt, One Road Initiative, a stronger regulatory environment, improving economic policy frameworks in Latin America, and increasing interest in insurance products such as critical illness cover. These areas are covered as special topics in the emerging markets chapter of this report.
Global economic growth will be moderate through 2018.
Non-life re/insurance premium growth will be modest, but improve by 2018.
Life insurers are expected to have substantially higher premium growth than non-life insurers and life reinsurers.
Non-life and life insurance premium growth in the emerging markets is expected to be robust as commodity prices improve and demand for insurance continues to increase, particularly in Emerging Asia.

2 Swiss Re Global insurance review 2016 and outlook 2017/18
The macro environmment: modest growth expected
The major economiesThe US economy barely grew in the first half of 2016 but recovered in the third quarter, so gross domestic product (GDP) is forecast to increase by a modest 2.2% in 2017. The Trump presidency has increased uncertainty about future US policies, but is unlikely to derail this outlook. Growth in Europe has also been moderate, and Euro area GDP growth is forecast to slow to 1.4% next year from 1.6% this year. The UK will be negatively affected by its exit from the European Union, but the timing of the impact is difficult to forecast. Given the lengthy period of uncertainty, businesses are likely to shift some jobs and investments out of the UK, hampering growth. At the same time, the pound is weak and the UK is still a full member of the EU, which is benefiting its exports. China is also expected to slow over the next few years but growth will likely remain close to 6.5% in the near term, while Japan continues to muddle along with 0.5% to 1.0% growth.
The International Monetary Fund (IMF) and the World Bank (WB) expect world GDP growth to improve next year compared to 2016. The IMF projects growth of 3.1% this year, rising to 3.4% in 2017. The WB forecasts growth of 2.4% in 2016, 2.8% in 2017 and 3.0% in 2018. Forecastersʼ track record (including our own) has been poor in recent years, but today there is room for optimism in the global growth outlook. In the US, the dual headwinds of the impact of low oil prices on mining investments and that of the strong dollar on exports have abated. Of the larger emerging markets, Brazil and Russia growth will likely return to positive territory next year. And for many commodity-exporting countries, improving prices of oil and metals will support growth.
With this growth backdrop and no major concerns about inflation, monetary policy will remain accommodative. In the US, where core inflation (which excludes food and energy prices) is rising slowly, the Fed is expected to raise its policy rate in December to the 0.5–0.75% target range, and increase it in three further steps of 25 basis points (bps) next year. The European Central Bank (ECB) and the Bank of Japan (BoJ) will likely deploy further quantitative easing to stimulate lending. The Bank of England (BoE) will need to find a balance between supporting growth and preventing inflation due to the weak pound, but is unlikely to adjust its policy rate this year or next. Chinaʼs monetary policy will focus on sustaining growth while constraining credit expansion to state-owned enterprises and residential investment.
While monetary policy remains expansionary in many markets, its marginal benefits are decreasing and the associated risks are rising. A combination of structural reform and fiscal stimulus could boost productivity and growth, but governmentsʼ efforts on both fronts are likely to be limited. While US fiscal spending is set to increase under the new Trump administration (see Box: The implications of a Trump presidency for the economy and insurance), governments in Europe are likely to be distracted by the Brexit negotiations to pursue major structural reforms.
In this macroeconomic environment, government bond yields are projected to rise a little from their current very low levels. With Fed tightening next year, the yield on the US 10-year Treasury note is expected to rise to 2.5% in 2017 from 2.2% recently. The US yield affects Euro area yields (and vice versa), and the German 10-year Bund yield is forecast to rise to 0.7%, maintaining its negative 180-basis-point yield spread to the US Treasury bond. Yields on Japanʼs 10-year government bond on the other hand will likely stay close to 0.0%, in line with the BoJʼs target. Equities tend to retain or gain value when interest rates are low, especially if earnings perform well. Corporate bond yields could also tighten further, after widening earlier in the year. Bond yields and equity valuations are currently very dependent on low interest rates.
The global economy is projected to grow at a modest pace in 2017.
Past forecasts of economic growth have been too optimistic. Irrespective, global growth could improve next year.
Monetary policy, even with Fed hikes, will remain accommodative.
The benefits of expansionary monetary policies are declining.
It is increasingly difficult to find asset classes with robust upside potential.

Swiss Re Global insurance review 2016 and outlook 2017/18 3
2015 2016E 2017F 2018F
Real GDP growth, annual avg., % US 2.4 1.6 2.2 2.2UK 2.2 2.0 1.1 1.5Euro area 1.9 1.6 1.4 1.5Japan 0.6 0.6 0.8 0.9China 6.9 6.6 6.5 6.4
Inflation, all-items CPI, annual avg., % US 0.1 1.3 2.3 2.4UK 0.1 0.7 2.6 2.2Euro area 0.0 0.3 1.4 1.3Japan 0.8 0.0 0.3 0.8China 1.4 1.6 1.9 2.2
Policy rate, year-end, % US 0.38 0.63 1.38 2.13UK 0.50 0.25 0.25 0.25Euro area 0.05 0.00 0.00 0.00Japan 0.04 0.00 0.00 0.00
Yield, 10-year govt bond, year-end, % US 2.3 1.8 2.5 3.3UK 2.0 1.2 1.5 1.8Euro area 0.6 0.2 0.7 1.1Japan 0.3 0.0 0.0 0.0
E = estimates, F = forecasts. Source: Swiss Re Economic Research & Consulting.
Where has all the growth gone?In 2011, the IMF forecast world GDP growth in 2015 to be about 4.7%. Last yearʼs outcome was actually about 3.1%. Growth forecasts have been revised downward for many years running recently, and the actual outcomes have almost always been weaker than expected. Many factors have contributed to the disappointing outcomes. First, productivity growth in the advanced economies has been surprisingly weak. Second, the commodity boom period in the decade prior to the financial crisis created expectations of stronger emerging market growth than could be sustained. Additionally, international trade growth has slowed, as globalisation and trade penetration seem to have reached a limit and are no longer supporting economic growth as they did previously.
The decline in productivity in virtually all advanced economies is due to a number of reasons. First, the benefits of telecommunications and increasing technology penetration are fading. Second, global trade growth has slowed (trade tends to increase efficiency and competition). Third, the low levels of private and public investment since the global financial crisis have hampered productivity increases. Fourth, services have increased as a share of total output. Measuring productivity in service industries has never been easy, and is often implicitly assumed to be zero. Finally, improvements in productivity in the technology sector have probably been under reported.
The commodity boom in the years before the financial crisis, driven by very strong growth in China, boosted expectations of strong growth in commodity exporting emerging markets. However, this was not sustainable, in particular because commodity exporting countries failed to employ the windfall gains to support growth beyond the boom years (eg, by improving infrastructure or diversifying economies away from an over-reliance on commodity exports). Commodity prices move in long waves, rising for a prolonged period, then falling only to recover again. Real GDP growth in the emerging markets, on aggregate, has now returned to the pace of the 1990s, at about 4%, which seems a more realistic expectation for the future than the 5–6% growth seen during the boom.
Table 1 Real GDP growth, inflation and interest rates in select regions, 2015 to 2018F
Growth expectations have consistently disappointed.
Weak productivity, …
… an expectation of high levels of growth due to the commodity boom before the financial crisis …

4 Swiss Re Global insurance review 2016 and outlook 2017/18
The macro environmment: modest growth expected
Lastly, the slowdown in international trade can be attributed partially to cyclical demand factors, such as recessions in commodity-producing countries and weakness in investments globally. Concurrently, it also reflects structural changes such as (1) a lack of new trade agreements; (2) increased protectionism (the Global Trade Alert reported over 150 protectionist measures in the first four months of 2016, compared to 50–100 new measures in the first four months of each year since 20101); and (3) fewer businesses further expanding their supply chain overseas.
What can be expected on the global growth front? Current levels of growth in Europe and the US are close to potential, and it is difficult to assume productivity will revive anytime soon, despite talk of workers being replaced by robots. The technological developments of today may well benefit productivity in the 2020s, but there is no sign of a lift today. On the positive side, commodity prices are improving slowly so the worst seems to be over for commodity producing economies. Not so for trade growth, however, which faces headwinds with the rise of anti-globalisation populist parties and can no longer be relied upon to generate strong economic expansion. Protectionism is taking new forms also. For example, retroactive tax demands and/or excessive levels of fines for foreign firms, especially for banks, could be considered protectionist measures. The uncertainty coming from these seemingly arbitrary rulings may hamper cross-border investments. Finally, the post financial crisis expansion of the advanced economies has lasted for eight years now, but expansions tend to lose strength as they age. All in all therefore, the new normal is likely to be moderate growth, with up- and down-ticks from time to time.
2016F (actual forecast)
2015F
2014F
2013F
2012F
2011F
Actual
Forecast July 2016Forecast October 2015Forecast October 2014Forecast October 2013Forecast October 2012Forecast September 2011
Forecast date:
20112012
2013 2014
2016
2015
Actual growth
2.5%
3.0%
3.5%
4.0%
4.5%
5.0%
5.5% Percent change, y-o-y
20202019201820172016201520142013201220112010
Source: International Monetary Fund.
1 S.J. Evenett, J. Fritz, Global Trade Plateaus. The 19th GTA Report, CEPR Press, 2016.
… and a slowdown in international trade have all contributed to the disappointing growth rates of recent years.
Ultimately, the new normal looks set to be moderate growth.
Figure 1 IMF forecasts of world GDP growth vs actual growth, 2011 to 2016
Swiss Re Global insurance review 2016 and outlook 2017/18 5
The implications of a Trump presidency for the economy and insuranceDonald Trump's victory in the US presidential election will likely lead to significant policy changes from those of the current administration. His core priorities during the presidential campaign focused on protectionism, reducing taxes and deregulation. Trump has proposed economic policies that include large tax cuts for individuals and businesses, additional spending on infrastructure and the military and veterans, substantial new trade barriers, renegotiation of existing trade agreements, restrictive immigration policy and indications that aspects of Obamacare will be repealed.
There is high degree of uncertainty as to the extent to which Trump's stated policy agenda will be implemented once he is in office. While he will work with a Republican-dominated Congress that will be receptive to many of his proposals, his views on trade are not aligned with long-standing Republican positions. Since the President has a relatively wide berth for executive action and can enact policies without the express authorisation from Congress, Trump could by executive order institute tariffs on China or any other country that engages in “unfair trade practices” as determined by trade officials. Such protectionist policies would lead to import price increases, higher inflation and lower exports due to likely retaliation from other countries. On existing trade treaties, it is unclear if Trump would be able to unilaterally withdraw from them. It is more likely that his presidency will disrupt ongoing trade negotiations such as the Trans-Pacific Partnership and the Transatlantic Trade and Investment Partnership.
For many of his other policy priorities, such as business and individual tax cuts, infrastructure spending and the repeal of Obamacare, Trump would require the cooperation of Congress. Since the Republican Senate majority is not large enough to overcome a Democratic filibuster, these policies are unlikely to be enacted in full, even though the tax cuts and repeal of Obamacare are aligned with the policy views of Republican leadership.
Implementation of the president-elect's fiscal policy proposals, which involve large across-the-board tax cuts accompanied by higher spending on infrastructure and the military, will provide a short-term stimulus to the economy. At the same time, these policies will lead to large budget deficits, creating inflationary pressures and a probable rise in interest rates. Inflationary pressures will prompt the Fed to be more aggressive in raising rates.
Insurers will be most affected by Trump's proposals relating to Obamacare and the environment. On Obamacare, no clear alternative has been laid out yet. On the environment, Trump could put a stop to efforts to curb carbon dioxide emissions and fight climate change by rejecting the Paris climate treaty. He could also re-start the review of the Keystone oil pipeline, allow oil exploration in Alaska and the Arctic Ocean, and withdraw existing climate regulations or stop their enforcement.
Given the many uncertainties regarding Trump's policy proposals, it is very hard to estimate the extent of impact on the economy and its timing. Our view is that most of the impact will be slow moving and occur in 2018-2019 at the earliest.
Trump's policy priorities are significantly different from the status quo.
However, there is high uncertainty about which policies will be implemented once he takes office.
Some of Trump's proposals will require the cooperation of Congress.
Proposed fiscal policies will provide short-term economic stimulus but create inflationary pressures down the road.
Insurers will be most impacted by policies on Obamacare and climate change.
Given the uncertainties about future policies, our near-term forecasts are unchanged.

6 Swiss Re Global insurance review 2016 and outlook 2017/18
The macro environmment: modest growth expected
Emerging markets
Emerging AsiaGrowth of emerging Asian markets is expected to remain fairly robust in 2017 and 2018, partly reflecting the success of China so far in stabilising its economy and containing credit risks. The regionʼs export outlook remains bleak, however, given the slow pace of improvement in major advanced markets and ongoing structural changes in the regionʼs supply chain. Inflation remains subdued, which will allow central banks to maintain loose monetary policy. In any case, countries in emerging Asia are increasingly relying on fiscal support to generate growth, as the marginal effectiveness of monetary policies is fading.
2018F
2017F
2016F
2015
2014
–2%
–1%
0%
1%
2%
3%
4%
5%
6%
7%
8%
2018F2017F2016E20152014
Advancedmarkets
Sub-SaharanAfrica
Central &EasternEurope
LatinAmerica
MiddleEast &North Africa
EmergingAsia
Source: Swiss Re Economic Research & Consulting.
China will likely continue to grow at current or slightly lower levels, although there are still significant downside risks (see Box: The risk of a hard landing in China). India has outperformed since the start of the Modi-administration, and robust business and consumer sentiment point to strong economic growth in the near term. Growth in the Philippines, Vietnam and Indonesia is also expected to remain robust.
Growth in emerging Asia will remain strong in 2017.
Figure 2 Real GDP growth in select regions, 2014 to 2018F
India, the Philippines, Vietnam and Indonesia will remain among the fastest growing markets.

Swiss Re Global insurance review 2016 and outlook 2017/18 7
The risk of a hard landing in ChinaChina reported stable economic growth (6.7%) in the first three quarters of 2016, underpinned by strong public investment and solid consumption spending. Even so, there is still high credit risk as a result of excess corporate leverage. Chinaʼs debts are the highest among the emerging markets and continue to rise: the total debt-to-GDP ratio reached 255% at the end of second quarter of 2016, up from 149% at the end of 2008. This was driven mainly by a rapid build-up of corporate sector (mostly state-owned-enterprise) debt, which rose to 169% of GDP from 99% over the same period.
The credit market will face added stress over the next several quarters as a large number of bonds mature and need to be redeemed or rolled-over. As many issuers are from the resources and construction sectors, which are suffering from low profitability and are operating with large excess capacity, there are doubts about the sustainability of this debt situation. Chinaʼs rising credit risk will increasingly be reflected in higher non-performing loans. The official commercial bank non-performing loans ratio reached a seven-year high of 1.75% in the second quarter of 2016. On 10 October 2016, the State Council approved a debt-for-equity swaps programme, paving the way for indebted corporations to turn bank loans into equity and ease near-term repayment pressures. These high debt level worries are a main factor underpinning our assessment of a 20% risk of a hard landing in China
Central and Eastern Europe (CEE)Aggregate economic growth in CEE was stronger this year as performance in Russia improved from –4% to –1% contraction, and CEE EU-member countries continued to grow albeit at a slower pace. Higher oil prices have helped slow the contraction in the economies of the Commonwealth of Independent States (CIS), particularly in the second half of this year. Russia is expected to return to positive growth in 2017, given rising oil prices and declining inflation. That means the central bank will be able to reduce interest rates further, supporting consumer expenditure and credit expansion.
The slower growth in CEE EU-member countries like Poland and Hungary in 2016 was expected, because of lower investment at the start of a new EU budget period (which means lower EU funding as projects come online). Growth is expected to remain at similar levels in 2017, but risks have tilted to the downside due to Brexit. CEE countries are disproportionately exposed to the UK via direct trade, slower growth in Western Europe due to Brexit, and reduced remittances due to the depreciation of the pound since the Brexit vote. There are nearly 2 million CEE citizens living in the UK, and their remittances back home will be worth less because of the much weaker pound. Meanwhile, the economic situation in the Ukraine is still extremely difficult, due to its ongoing conflict with Russia. Upside growth prospects are dependent on external factors: reduced tensions with Russia leading to the removal of sanctions, and stronger-than-expected growth in Western Europe.
Middle East and North Africa (MENA)Economic activity in MENA countries has been subdued in 2016. Growth in oil-importing countries has been modest, and low oil prices have taken a toll on oil-exporting countries. Business sentiment has suffered from a deteriorating security situation, political uncertainty and rising anxiety about financial stability after the Brexit vote. Inflationary pressures remain largely contained, but the removal of subsidies in the Gulf countries, and a weakening currency and rising administered prices in Egypt are now putting pressure on inflation.
Credit risks remain a key concern in China …
… more so as corporate bonds enter peak redemption season.
The CEE region returned to growth in 2016 as economic contraction eased in the CIS countries.
CEE EU-member countries will continue to grow, but Brexit has increased the downside risks for the region.
Growth in the MENA nations remains low due to low oil prices and geopolitical tensions.

8 Swiss Re Global insurance review 2016 and outlook 2017/18
The macro environmment: modest growth expected
The near-term outlook for the MENA region is mixed. In the UAE, large-scale investments in the run-up to Expo 2020 are expected to start materialising and will help diversify the economy. Saudi Arabiaʼs economic outlook remains challenging: the prolonged slump in oil prices is reducing government spending and investment, dampening growth. Assuming oil prices improve gradually in 2017, the pressure on the real economy will ease. Geopolitical uncertainty poses a major risk to Turkeyʼs economy. However, growth will partially be sustained by government stimulus, offsetting the impact of tightening external financing and decreasing security.
Sub-Saharan Africa (SSA)Growth in SSA countries is diverging. Non-commodity intensive markets such as Kenya and Côte dʼIvoire, continue to deliver solid-to-strong growth. In contrast, commodity intensive nations are growing only slowly or are even in recession due to low commodity prices and insufficient policy adjustments (eg, Nigeria and Angola). South Africa has avoided a recession but needs to deliver on its plans to consolidate its fiscal budget, control run-away spending at state-owned enterprises, and reverse the trend of rising corruption and government inefficiency if it is to fend off an imminent sovereign downgrade to junk. The recent judicial decision to drop unsubstantiated charges against the finance minister and to order the release of a report on the influence of the Gupta family on government are positive developments in this respect. It also signals that support for president Zuma within the ruling African National Congress (ANC) is waning.
The regionʼs fundamental prospects remain solid, given its youthful population profile and strong economic growth in non-commodity intensive countries. Assuming commodity prices continue to recover, growth should slowly improve in commodity-intensive countries, but structural reforms and debt management will be key. Nigeria will need more stringent economic policy to attract investment, ease infrastructure bottlenecks and lift potential growth. Kenya, Ghana and Mozambique will need to consolidate fiscal deficits and ensure debt funds are channelled into productive investment. Economic growth in South Africa will improve only slowly, given still-present structural bottlenecks (electricity, transport). Execution of the National Development Plan (NDP) is central to lifting growth potential in the longer term, but its implimentation will be restricted by the need to reduce government deficits.
Latin America Latin Americaʼs aggregate real GDP contracted for a second year in a row in 2016 (–0.5%, after –0.3% in 2015), dragged down by recessions in Brazil and Venezuela, a growth correction in Argentina, and sluggish growth across the rest of the region. Brazil has suffered one of the longest and deepest downturns of its modern history. More than two years of contraction produced a cumulative decline in per capita GDP of 9% between the second quarters of 2014 and 2016. Venezuelaʼs escalating political and economic crises continue to degrade the economyʼs foundations, returning real output back to the level of 2005. In Argentina, by contrast, a return to a more disciplined policy framework and concomitant fiscal and monetary adjustments, have been primarily responsible for the downturn. Meanwhile, the Pacific Alliance countries – Chile, Colombia, Mexico, and Peru – are adapting to less favourable terms of trade and foreign financing in a more orderly fashion than are their Mercosur counterparts.2 Financial market volatility and pass-through inflation from exchange-rate depreciations have forced Pacific Alliance central banks to tighten monetary policy, while the drop in export-related government revenues has reduced fiscal policy flexibility. Even so, economic growth has remained relatively resilient in the trading bloc: an estimated 2.3% in 2016, compared to –3.0% in Mercosur.
2 Mercosur comprises Brazil, Argentina, Venezuela, Uruguay, and Paraguay.
The outlook for MENA partly hinges on expectations of gradually rising oil prices.
Growth of SSA non-commodity intensive countries remains strong but commodity intensive ones are suffering.
Key challenges are rising debt levels in some countries, and the need for more robust economic policy frameworks in others.
The economic downturn in Latin America intensified during 2016 …

Swiss Re Global insurance review 2016 and outlook 2017/18 9
Despite deteriorating performance in 2016, green shoots are starting to emerge in the regionʼs larger economies. The recalibration of Argentina and Brazilʼs economic models has lifted business confidence and unlocked pent-up investment spending. This, and a modest rebound in foreign capital inflows to the region and an anticipated loosening of monetary policy, is expected to fuel sluggish recoveries in both economies beginning in 2017. However, a pullback in public and private consumption in addition to persistent structural growth constraints will keep medium-term growth in check. Mexicoʼs growth outlook is the mirror opposite: whereas recent structural reforms have raised medium-term prospects, ongoing policy tightening and investor caution will weigh on domestic demand in the near term. The central banks of Chile and Colombia have greater scope to loosen monetary policy and will likely do so in 2017. This will support comparatively robust recoveries in private-sector demand and mitigate the impact of fiscal consolidation in both countries.
Risk scenarios Risks to the global economic outlook have moved to the downside this year. In 2015, China and emerging markets were the main concerns, and these risks remain elevated. Growth in China is still overly dependent on government stimulus and credit expansion. Also, some emerging markets are viewed as vulnerable to rising interest rates in the US and are thus affected by capital outflows when US monetary policy tightens. In Europe, meanwhile, the banking sector remains a source of vulnerability as profitability and capitalisation remain low. Other downside risks are mainly political in nature (see Box: Political risks). For instance, Brexit increases the risk of further destabilisation in the EU, which could result in a global financial crisis. And the escalation of regional conflicts (Russia/Ukraine, China South Sea, etc.) could also spark risk aversion and financial market volatility. Overall, the likelihood of a major slowdown in global growth on these grounds is around 15%.
Upside risks are more limited in GDP impact (~0.5 percentage points (ppt) upside, vs. 1 to 2 ppt downside) and in probability, at around 10%. Stronger growth could result from a more-robust-than-expected upswing in the US as the drag from low oil prices and the strong US dollar fade. In Europe, a pick-up in structural reform momentum could boost sentiment and growth. In addition, increased government spending may lead to stronger growth in the US and Europe. A more rapid upswing in commodity prices could bolster emerging market growth substantially, but would dampen growth elsewhere.
Downside
Upside
Baseline
2021F2020F2019F2018F2017F2016E
–1.0%
–0.5%
0.0%
0.5%
1.0%
1.5%
2.0%
2.5%
DownsideUpside Baseline
Source: Swiss Re Economic Research & Consulting.
… and a sluggish recovery is projected for 2017.
Risks are skewed to the downside.
Global growth could be stronger than expected, driven by the US and Europe.
Figure 3 Real GDP growth in upside, baseline and downside scenarios, 2016‒2021F, based on Euro area real growth

10 Swiss Re Global insurance review 2016 and outlook 2017/18
The macro environmment: modest growth expected
In the downside scenario, yields on government bonds would decline further from current lows and stay very depressed for another few years at least. Equity markets would decline and credit spreads would widen, although the extent of spread widening is unclear because central banks would likely increase their private and public asset purchases as a reaction to the downturn.
Under the baseline and upside scenarios, insurance premium growth will be close to GDP growth in the advanced economies and generally higher than GDP growth in the emerging markets, which stand to benefit from increased insurance penetration. Under the downside scenario, there would be stress from lower premium growth and pressure on asset valuations. The upside scenario would be more favourable for the re/insurance industry. Investment yields would improve, but only slowly, and premium volumes would rise along with economic activity.
Political risksPolitical instability has the potential to undermine economic growth and derail the projected modest global recovery. Increased anti-globalisation sentiment and immigration issues bolstered the Brexit vote and have boosted support for populist politicians like Donald Trump in the US and Marine Le Pen in France. In addition, ongoing geo-political tensions around the world, most notably in Ukraine, the Middle East and parts of Southeast Asia, represent a serious impediment to economic activity. These developments will continue to shape the political risk environment next year.
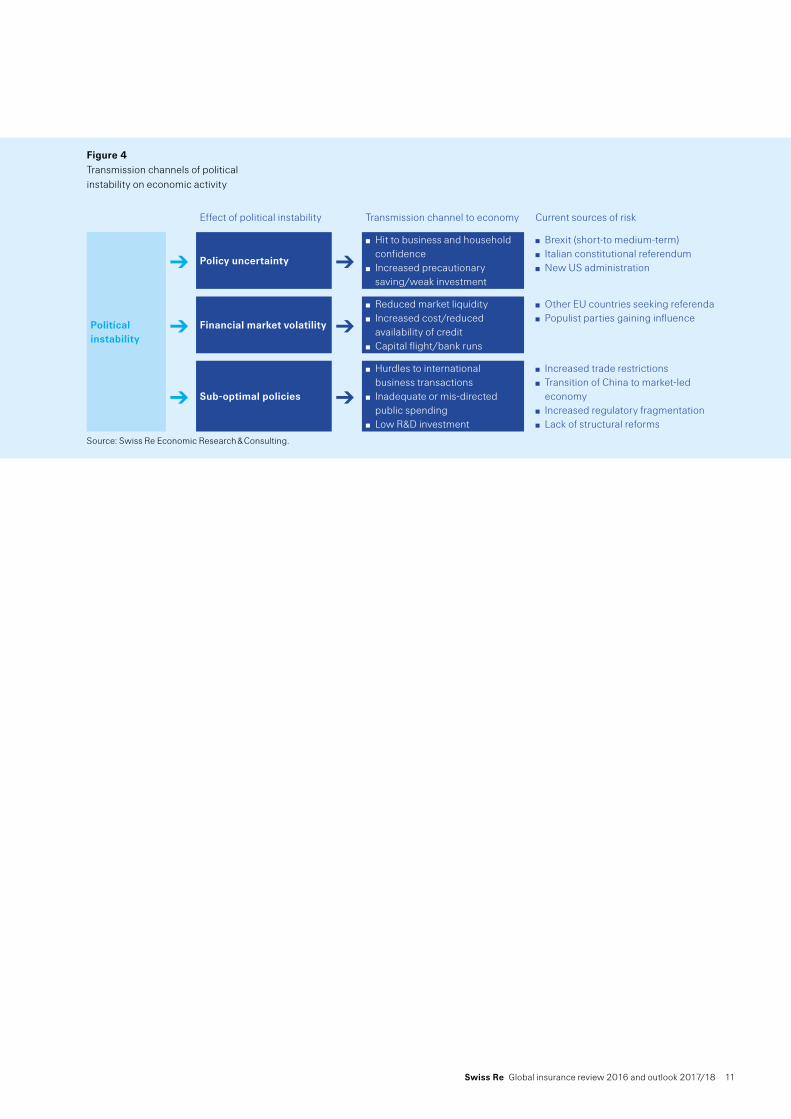
While it is hard to gauge the likelihood of different political risks materialising, it is nevertheless useful to frame possible economic outcomes of relevance for the re/insurance industry. Aside from the obvious impacts associated with military conflict and civil unrest, the political environment can adversely influence the economic outlook through three main transmission channels: heightened policy uncertainty, increased financial market volatility and sub-optimal economic policies (see Figure 4). These channels are likely to reinforce each other. The first two are likely to impact aggregate demand in the short term, and the latter could undermine long-run productive potential.
Over the short term, re/insurers will be mostly affected on the asset side in a scenario of heightened financial market volatility. In addition, slower growth may dampen the outlook for re/insurersʼ premium growth. It is hard to quantify the economic damage resulting from political instability although the economic downturn is likely to be less severe as a result of policy uncertainty alone compared to a scenario which also involves financial market volatility. Beyond the short term, re/insurers are likely to suffer most if political instability results in policies that complicate or hamper international business transactions, such as increased regulatory fragmentation or capital restrictions.
In the downside scenario, yields and equities would fall and credit spreads would widen.
Real GDP growth drives insurance premium growth in all scenarios.
Political trends present major downside risks to global economic growth.
The economy is affected via three main transmission channels: policy uncertainty, financial market volatility and sub-optimal policies.
Re/insurers could suffer from both short- and long-term effects.
Swiss Re Global insurance review 2016 and outlook 2017/18 11
Figure 4 Transmission channels of political instability on economic activity
Effect of political instability Transmission channel to economy Current sources of risk
Political instability
➔ Policy uncertainty ➔
Hit to business and household confidence
Increased precautionary saving/weak investment
Brexit (short-to medium-term) Italian constitutional referendum New US administration
➔ Financial market volatility ➔
Reduced market liquidity Increased cost/reduced
availability of credit Capital flight/bank runs
Other EU countries seeking referenda Populist parties gaining influence
➔ Sub-optimal policies ➔
Hurdles to international business transactions
Inadequate or mis-directed public spending
Low R&D investment
Increased trade restrictions Transition of China to market-led
economy Increased regulatory fragmentation Lack of structural reforms
Source: Swiss Re Economic Research & Consulting.

12 Swiss Re Global insurance review 2016 and outlook 2017/18
Non-life re/insurance: improving growth, challenges to profitability
Non-life insurance in 2016: premium growth slows on weak economy, soft ratesNon-life premium growth was slower in 2016 than in 2015. Global non-life premiums are estimated to have risen by 2.4% in real terms in 2016, after 3.0% in 2015. In the advanced countries, premium growth decelerated to 1.7% from 2.5% last year3 due to weaker economic growth and a softer pricing environment in commercial insurance. The Western European markets exhibited some momentum mainly from stronger motor business in Germany and Spain. The UK and France were stable, but weak. In Italy, premium income declined again, albeit at a slower pace than in previous years. Larger markets with accelerating growth include Canada, Japan and South Korea.
Non-life premiums in the emerging markets grew by an estimated 5.3% in 2016, up slightly from 2015, but significantly slower than the 8% annual average growth between 2010 and 2014. The weaker increase was due to continued economic slowdown in Latin America with inflation-adjusted declines in Brazil, Argentina and Venezuela, sluggish-to-negative developments in the larger markets in SSA, and a premium growth slowdown in China (7% vs 10% in 2015). This was partly offset by recovery in CEE and strong growth in the MENA (+9%).
In contrast to the moderately accelerating real growth in the emerging markets, premium growth in nominal USD terms was held back by currency depreciation in many of the countries, although the effect was less pronounced in 2016 than in 2015. Emerging market premiums grew by 3.8% in USD terms in 2016, after a decline of 2.0% in the previous year.
Underwriting profitability deteriorates in the US, remains stable in EuropeThe US P&C industryʼs combined ratio deteriorated by 2.2 ppt to 99.8% in the first half of this year. This was driven by higher catastrophe losses and lower reserve releases than in the same period a year earlier. Excluding the impact of reserve releases, the accident year combined ratio for the US P&C industry increased to 102.8% by the end of the first half of 2016, up from 101.1% a year earlier. Rate increases contributed to strong premium growth in personal lines, while softening rates contributed to a decline in commercial line premiums. Losses from Hurricane Matthew are likely to add to an above-average natcat loss burden for 2016.
Combined ratio, accident year
Combined ratio, calendar year
80%
85%
90%
95%
100%
105%
110%
115%2
Q16
1Q
16
4Q
15
3Q
15
2Q
15
1Q
15
4Q
14
3Q
14
2Q
14
1Q
14
4Q
13
3Q
13
2Q
13
1Q
13
4Q
12
3Q
12
2Q
12
1Q
12
Combined ratio, accident yearCombined ratio, calendar year
Source: A.M. Best, Swiss Re Economic Research & Consulting.
3 Real growth of advanced markets in 2015 was distorted by a drop in inflation by about 1 ppt in 2015 from the collapse in energy prices. Using core consumer price inflation indices that exclude food and energy prices, real premium growth in most mature markets slowed down slightly in 2015.
Global non-life premium growth slowed in 2016.
Premium growth in the emerging markets was slightly stronger, but still below average.
Depreciation of emerging economiesʼ currencies reduced premiums in USD terms.
In the US, underwriting results deteriorated in the first half of 2016.
Figure 5 Quarterly US combined ratios, Q1 2012 to Q2 2016

Swiss Re Global insurance review 2016 and outlook 2017/18 13
Underwriting profitability in Europe4 was about the same in the first two quarters of 2016 compared to the 2015 full-year outcome, with the average combined ratio close to 95%. Underwriting results in Germany and France suffered from the severe storms and floods of Elvira and Friederike in May and June, which caused overall insured losses of around EUR 2.7 billion (USD 3 billion). The industryʼs combined ratio was up 2 ppt in France and 1 ppt in Germany. Underwriting profits remained stable in Switzerland and were slightly worse in Italy, mainly driven by weaker but still profitable motor business. The earthquakes that hit Italy in August and October are expected to have only a minimal impact on 2016 underwriting profitability due to low insurance penetration (see Box: Italy struck by devastating earthquakes). Other markets like the UK, Nordic countries and Spain experienced some improvements, mainly based on motor.
2016 annual
2015 annual
2014 annual
2013 annual
2012 annual
Europe
2016 annual
2015 annual
2014 annual
2013 annual
2012 annual
Europe
75%
80%
85%
90%
95%
100%
2Q
16
1Q
16
4Q
15
3Q
15
2Q
15
1Q
15
4Q
14
3Q
14
2Q
14
1Q
14
4Q
13
3Q
13
2Q
13
1Q
13
4Q
12
3Q
12
2Q
12
1Q
12
Note: the horizontal bars represent the annual average.
Source: Swiss Re Economic Research & Consulting.
Underwriting results in Japan and Australia, the biggest mature markets in Asia Pacific, have been mixed. In Japan, overall underwriting results deteriorated, reflecting mainly higher natural catastrophes losses due to the Kumamoto Earthquake and higher losses in auto insurance. Underwriting performance in Australia, however, improved. By line of business, deteriorating liability and motor segment profitability was offset by improvement in property risk (homeowners, fire & industrial special risks).
4 Based on an aggregated sample of large European insurers active in Germany, France, the UK, Italy, Spain, Switzerland and the Nordic countries.
Underwriting results in Europe were about the same in 2016 vs 2015.
Figure 6 Combined ratios in Europe, Q1 2012 to Q2 2016
Japan and Australia saw mixed underwriting results in 2016.

14 Swiss Re Global insurance review 2016 and outlook 2017/18
Non-life re/insurance: improving growth, challenges to profitability
Italy struck by devastating earthquakes in 2016Central Italy has been hit by a series of severe earthquakes this year. On 24 August 2016, a magnitude 6.2 earthquake in the Apennines killed 298 people and destroyed the small towns of Amatrice, Accumoli and Pescara del Tronto. However, that was just the first of an extended series of quakes in the region. On 26 October, two aftershocks of magnitude 5.5 and 6.1 hit Visso, north of Amatrice. And on 30 October, a magnitude 6.6, struck Norcia, situated between Amatrice and Visso. This last seism was the most powerful to hit Italy since 1980, and its tremors were felt across most of the country. The more recent earthquakes did not claim any lives, thanks to widespread evacuations. But they added to the damage and destruction of buildings that had already been affected by the first quake in August.
After the Amatrice earthquake, government sources estimated the overall reconstruction cost to be as high as USD 5 billion, but this figure will likely be revised after the more recent events. Insured losses were estimated at just USD 38 million,5 mainly from commercial assets, leaving the great majority of the reconstruction cost to society. With only just over 1% of the residential buildings in Italy insured against quake risk, home earthquake insurance penetration is among the lowest in the industrialised countries. Italy has no public natural catastrophe scheme, but the government has historically intervened with post-disaster programmes set up under the pressure of the emergency. This has resulted in long-lasting and much-more-than-budgeted-for reconstruction drives. Public debate regarding the need for increased insurance penetration, or for alternative public solutions, arises in the wake of major disasters. However, to date no scheme is in place, and a huge protection gap remains.
Commercial insurance rate trendsThe deterioration of rates in US commercial insurance slowed in 2016. According to MarketScout, average rates were near stable in the third quarter, with the exception of hardening in commercial auto. The Council of Insurance Agents & Brokers (CIAB) reported slightly softer but also moderating rate trends through the third quarter. Liability lines continue to fare better than property, and rates for larger accounts are softer than for smaller ones. Pricing is expected to improve once reserve releases turn into adverse development. Growth in claims costs likely exceeds rate trends in all lines, eroding underwriting profitability.
Globally, Marsh reported commercial rate declines across all regions and lines of business. In the second quarter of 2016, global commercial insurance rates fell for the 13th consecutive quarter (–3.6%), driven mostly by abundant capacity and an absence of large natural catastrophe losses. Property rates continued to show the biggest decrease (–4.5%) but moderated in the first half of 2016. Rate reductions slowed globally in Europe, Latin America and Asia Pacific. The rate of decline in the US accelerated in the first half of 2016 but moderated in the third quarter.
5 Perils AG.
Several earthquakes hit Central Italy this year.
Overall losses have been high, at least USD 5 billion. But insured losses are low, estimated at USD 38 million.
The softening of US commercial rates is moderating.
Rate are softening more rapidly in Europe, Asia and Latin America.

Swiss Re Global insurance review 2016 and outlook 2017/18 15
Financial and Professional
Property
Casualty
Composite
–10%
–8%
–6%
–4%
–2%
0%
2%
4%
2Q
16
1Q
16
4Q
15
3Q
15
2Q
15
1Q
15
4Q
14
3Q
14
2Q
14
1Q
14
4Q
13
3Q
13
2Q
13
1Q
13
4Q
12
3Q
12
2Q
12
1Q
12
Financial and ProfessionalPropertyCasualtyComposite
Source: Marsh.
The pricing outlook in non-life insurance remains challenging due to abundant capital and benign claims development. Even so, an inflection point seems to have been reached and the momentum of rate softening has slowed recently. Several factors could instigate a turn in the low price environment and set the scene for rate hardening. Reserving may soon prove insufficient in key markets like the US. Reserves from
the redundant hard-market years are wearing thin and the reserve adequacy of more recent loss years is unclear. This is because the current benign loss trends are prolonging the period of releases. Reserve releases will eventually morph into a need to strengthen reserves, but it is difficult to forecast when that will happen.
Stricter solvency regulations and higher capital requirements will help turn the market. Solvency II has been implemented in 2016 and a further tightening of rating agency models is also expected. For example, A.M. Best is changing its model to require more capital for tail risk events.
Volatile and significant capital market developments impacting insurersʼ capital base may be another trigger for rate hardening. These include impairments of invested assets, or a quick and strong rise in interest rates.
Underwriting profitability in non-life insurance will likely deteriorate in 2017 and 2018, assuming natural catastrophe losses at historical averages and an erosion of reserve releases. Casualty claim trends are picking up momentum in markets like US commercial auto and other liability lines, and this will reduce profitability and accelerate rate hardening in casualty.
Insurersʼ investment income has been weak for a while due to the ultra-low interest rate environment, and will not recover anytime soon. As interest rates gradually rise, investment income will grow only slowly, and with a lag to the rising rates. Overall profitability in 2017 and 2018 is expected to remain at current lows, with RoE of around 6%.
Figure 7 Global renewal rate changes by line of business
Pricing seems to have reached an inflection point.
Underwriting profitability, assuming average cat losses and declining reserve releases, is likely to deteriorate further before improving.
As interest rates rise, investment income will improve, but with a lag.

16 Swiss Re Global insurance review 2016 and outlook 2017/18
Non-life re/insurance: improving growth, challenges to profitability
Specialty lines focus: marine and cyber insuranceThe slowdown in world trade volumes represents a significant headwind for marine insurers. It is crimping demand for cover from shippers, themselves under pressure from the adverse effects of overcapacity on freight rates. With overall re/insurance capital still abundant, marine insurers face the double-whammy of weak growth in risk exposure and continued downward pressure on premium rates and/or policy terms (ie, increased limits, reduced deductibles and broader coverage etc).6 As a result, global marine insurance premiums continue to slide in both cargo and hull. According to the International Union of Marine Insurance (IUMI), total premiums fell by 10.5% in 2015 after a 0.5% decline in 2014, although a large part of the deceleration in 2015 was due to US dollar strength, which reduced overall premiums in common currency terms.7
Some of the weakness in trade is cyclical which should unwind as the global economy recovers. A number of recent studies have found that the changes in the composition of global demand and weakness in investment have been a restraint on trade growth.8 Current policies to support overall demand, especially those that encourage capital expenditure, should indirectly boost trade in absolute terms and relative to overall activity.9 This should underpin future growth in marine premiums.
However, structural developments such as waning growth in global value chains, a rise in non-tariff protectionist measures and a declining marginal impact of financial deepening, are also dampening global trade.10 These factors mean that the trade intensity of global production is likely to be permanently lower than before. Instead of world trade growing at more than double the rate of global GDP as it did during the period 1985–2007, trade and GDP are more likely to grow at close to the same pace. Over the long term, marine insurance premiums tend to echo developments in world trade growth, so the implication is that marine insurers may have to adjust to an environment of lower premium growth.11 This will in turn require increased underwriting discipline to underpin profits, especially given weak investment returns from persistently low interest rates.
In contrast to many other commercial lines, market conditions in cyber insurance continue to harden, albeit at a slower rate than in 2015. Increased awareness of the risks associated with cyber attacks and data breaches is boosting demand for insurance solutions (see Box: Cyber insurance: a nascent but fast-growing market). Combined with limited risk-absorbing capacity and heightened underwriting scrutiny following recent high-profile cyber incidents, premium rates continue to rise, particularly for healthcare and retail cyber risks. According to insurance broker Willis, renewal rates typically rose by between 5-15% in early 2016, but more recent signals suggest rates may be beginning to stabilise.12,13 Coverage is being secured through a broad spectrum of structures, including aggregate stop loss, proportional and per risk /event excess of loss.
6 Marketplace Realities, 2016 Spring Update: Bringing the Pieces Together, Willis, 2016.7 As an Illustration of the currency effect, German marine insurersʼ premiums fell by 2% when measured in
euros compared with a 12% decline in US dollar terms, according to IUMI.8 See for example: Global Trade: Whatʼs Behind The Slowdown?, Chapter 2, World Economic Outlook,
IMF, October 2016; Understanding the weakness in global trade: What is the new normal?, ECB Occasional Paper No 178 / September 2016; and Cardiac Arrest or Dizzy Spell: Why Is World Trade so Weak And What Can Policy Do About It?, OECD Economic Policy Paper No. 18, September 2016.
9 Since investment relies more heavily on trade than consumption, some researchers argue that an investment slump (boom) will almost inevitably lead to a slowdown (pick-up) in trade growth. See for example, C. Freund, “The Global Trade Slowdown and Secular Stagnation.” Peterson Institute of International Economics blog, https://piie.com/blogs/trade-investment-policy-watch/global-trade-slowdown-and-secular-stagnation
10 ECB 2016, op cit.11 For more discussion of the long-run relationship between marine insurance global trade see
sigma 4/2013: Navigating recent developments in marine and airline insurnace, Swiss Re..12 Marketplace Realities, 2016 Spring Update: Bringing the Pieces Together, Willis, 2016.13 A recent survey by the Council of Insurance Agents and Brokers (CIAB) indicates that 72% of
respondents reported premium rates for cyber policies generally stayed the same, compared with 48% earlier in 2016. See Cyber insurance Market Watch Survey, CIAB, October 2016.
Marine insurance premiums remain weak, reflecting a slowdown in trade and downward pressure on rates.
Some of the weakness in trade should unwind as the global recovery strengthens, underpinning future premium growth.
But some may reflect a permanent fall in the trade intensity of production, which implies lower long-run revenue growth for marine insurers.
Unlike other lines, cyber premium rates have been increasing but at a slowing pace, and could level out soon.

Swiss Re Global insurance review 2016 and outlook 2017/18 17
Cyber insurance: a nascent but fast-growing marketAgainst the backdrop of a number of high-profile online attacks, cyber risk is a growing concern for companies. In a recent global survey, close to half of corporations polled (48%) consider cyber to be a greater risk than others.14 Firms anticipate that the frequency and severity of cyber incidents will increase – 60% of companies expect cyber will become a bigger risk in 10 yearsʼ time. Moreover, worries about the costs of a cyberattack/security breach are no longer confined to coping with lost or corrupted data, but increasingly include potential damage to a firmʼs reputation, as well as the costs associated with business interruption.
2016
2015
2015 2016
Loss of reputation
Business interruption
Damage from lostcustomer data
0% 10% 20% 30% 40% 50% 60% 70% 80%
Q. What are the main causes of economic loss after a cyber incident?
Source: Allianz Global Corporate & Specialty.
Yes No
18237% 63%
63246% 54%
19045% 55%
Yes No
51% 49%
49% 51%
47% 53%
45% 55%
44% 56%
44% 56%
54% 46%
54% 46%
Very large(>10 000 empl.)
Medium – large(500–10 000 empl.)
Small (<500 empl.)
Chemicals & petroleum
Electronics
Industrial products
Auto manufacturers
Telecom infrastructure
Hotels
Pharma & biotech
Banking
Q. Do you currently have a specific cyber insurance policy? (The numbers at the end of first three bars refer to the number of surveyed firms in that size category).
Source: Swiss Re/IBM.
14 Cyber: in search of resilience in an interconnected world, Swiss Re/IBM Institute for Business Value, October 2016.
Cyber threats are a growing concern for companies
Figure 8 Corporate views about the Top 3 sources of cyber losses (2015 and 2016 surveys)
Figure 9 Corporationsʼ cyber insurance buying (by firm size and industry)
18 Swiss Re Global insurance review 2016 and outlook 2017/18
Non-life re/insurance: improving growth, challenges to profitability
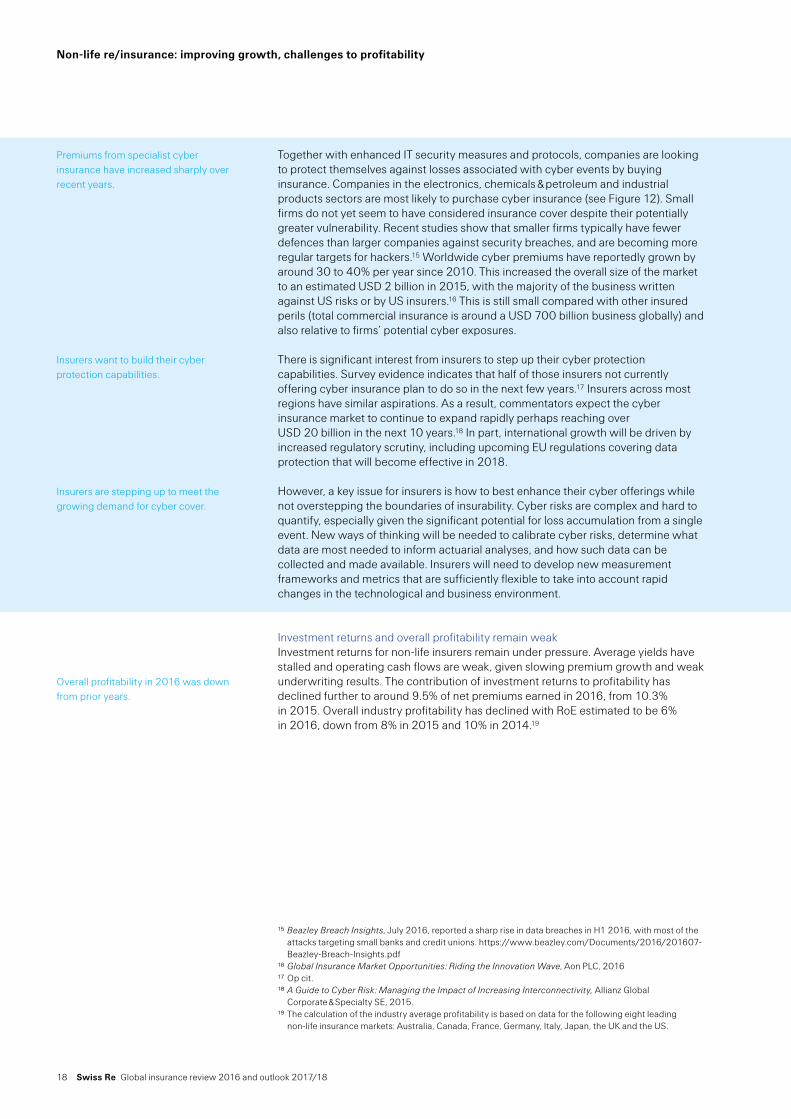
Together with enhanced IT security measures and protocols, companies are looking to protect themselves against losses associated with cyber events by buying insurance. Companies in the electronics, chemicals & petroleum and industrial products sectors are most likely to purchase cyber insurance (see Figure 12). Small firms do not yet seem to have considered insurance cover despite their potentially greater vulnerability. Recent studies show that smaller firms typically have fewer defences than larger companies against security breaches, and are becoming more regular targets for hackers.15 Worldwide cyber premiums have reportedly grown by around 30 to 40% per year since 2010. This increased the overall size of the market to an estimated USD 2 billion in 2015, with the majority of the business written against US risks or by US insurers.16 This is still small compared with other insured perils (total commercial insurance is around a USD 700 billion business globally) and also relative to firmsʼ potential cyber exposures.
There is significant interest from insurers to step up their cyber protection capabilities. Survey evidence indicates that half of those insurers not currently offering cyber insurance plan to do so in the next few years.17 Insurers across most regions have similar aspirations. As a result, commentators expect the cyber insurance market to continue to expand rapidly perhaps reaching over USD 20 billion in the next 10 years.18 In part, international growth will be driven by increased regulatory scrutiny, including upcoming EU regulations covering data protection that will become effective in 2018.
However, a key issue for insurers is how to best enhance their cyber offerings while not overstepping the boundaries of insurability. Cyber risks are complex and hard to quantify, especially given the significant potential for loss accumulation from a single event. New ways of thinking will be needed to calibrate cyber risks, determine what data are most needed to inform actuarial analyses, and how such data can be collected and made available. Insurers will need to develop new measurement frameworks and metrics that are sufficiently flexible to take into account rapid changes in the technological and business environment.
Investment returns and overall profitability remain weakInvestment returns for non-life insurers remain under pressure. Average yields have stalled and operating cash flows are weak, given slowing premium growth and weak underwriting results. The contribution of investment returns to profitability has declined further to around 9.5% of net premiums earned in 2016, from 10.3% in 2015. Overall industry profitability has declined with RoE estimated to be 6% in 2016, down from 8% in 2015 and 10% in 2014.19
15 Beazley Breach Insights, July 2016, reported a sharp rise in data breaches in H1 2016, with most of the attacks targeting small banks and credit unions. https://www.beazley.com/Documents/2016/201607-Beazley-Breach-Insights.pdf
16 Global Insurance Market Opportunities: Riding the Innovation Wave, Aon PLC, 201617 Op cit.18 A Guide to Cyber Risk: Managing the Impact of Increasing Interconnectivity, Allianz Global
Corporate & Specialty SE, 2015.19 The calculation of the industry average profitability is based on data for the following eight leading
non-life insurance markets: Australia, Canada, France, Germany, Italy, Japan, the UK and the US.
Premiums from specialist cyber insurance have increased sharply over recent years.
Insurers want to build their cyber protection capabilities.
Insurers are stepping up to meet the growing demand for cyber cover.
Overall profitability in 2016 was down from prior years.

Swiss Re Global insurance review 2016 and outlook 2017/18 19
ROE after tax
Operating result
Investment result
Underwriting result
–15%
–10%
–5%
0%
5%
10%
15%
20%
2017
F
2016
E
2015
2014
2013
2012
2011
2010
200
9
200
8
2007
200
6
200
5
200
4
200
3
200
2
2001
200
0
199
9
ROE after taxOperating resultInvestment resultUnderwriting result
Source: Swiss Re Economic Research & Consulting.
Outlook 2017 and 2018: low growth and low profitabilityThe global economic outlook for 2017 and 2018 is moderate growth. With repsect to non-life insurance, the emerging markets will be the main driver with premium growth forecast to improve strongly to 6‒7% in real terms in 2017 and 2018. Real growth in the advanced markets is expected to slow slightly next year since macroeconomic conditions will improve only modestly and inflation is expected to accelerate. Political instability could be a significant headwind for advanced market insurance sectors. For example, in Europe the path eventually adopted for Brexit may lead to structural changes in insurance markets, although at this stage the near-term outlook remains highly uncertain (see Box: Brexit and the insurance market). On the other hand, positive rate dynamics are likely to add to growth in the following years. Global non-life premium growth is forecast at 2.2% in 2017 and 3.0% in 2018.
Country/region 2014 2015 2016E 2017F 2018F
US 3.0% 3.6% 2.3% 1.3% 1.5%Canada 1.9% 4.1% 0.8% 1.7% 2.6%Japan 1.2% 1.3% –1.0% 1.2% 2.2%Australia 1.3% 0.5% –0.4% 0.6% 1.4%UK –1.7% 1.3% 1.5% 0.3% 1.4%Germany 1.8% 3.3% 2.5% 0.9% 1.1%France 0.3% 1.0% 0.8% 0.4% 2.8%Italy –3.0% –2.9% –1.8% 0.3% 2.3%Spain –0.2% 3.0% 4.6% 4.1% 4.3%Advanced markets* 1.8% 2.5% 1.7% 1.3% 1.9%Emerging markets 6.4% 4.9% 5.3% 5.7% 6.7%World 2.7% 3.0% 2.4% 2.2% 3.0%
* Advanced markets include North America, Western Europe, Israel, Oceania, Japan, Korea, Hong Kong, Singapore, and Taiwan.
Source: Swiss Re, Economic Research & Consulting.
Brexit and the insurance industryThe UKʼs decision to leave the EU could have significant implications for the insurance industry. However, the scale of the effects remains uncertain and will depend on the shape of any new trade agreements between the UK and its former EU partners, and also the strategic decisions made by insurers to adapt to the new regulatory/market landscape.
Figure 10 Composition of profits as a % of net premiums earned and ROE, aggregate of eight major markets, 1999–2017
Premiums will grow in 2017 and 2018, driven by growth in the emerging markets.
Table 2 Real growth of direct premiums written in non-life insurance
The Brexit vote will likely have significant implications for insurers.

20 Swiss Re Global insurance review 2016 and outlook 2017/18
Non-life re/insurance: improving growth, challenges to profitability
Access to the single market: the existing EU financial services passport allows UK and continental Europe insurers to operate in all member states and establish branch offices throughout the region. These passporting rights mean Europeʼs insurers are not obliged to maintain expensive capital holdings in each of the EU member states in which they have a presence. Losing these rights means insurers wanting to continue to offer cover in the UK and the rest of the EU will likely need to restructure. In particular, UK insurers may need to set up operations in other European countries, and continental European firms writing UK business via branch offices in the UK will probably look to migrate business to a UK-domiciled subsidiary. A potential complication in the EU/UK negotiations could be how far current legislation may ultimately allow continued access to the single market. If the UK were to re-join the EEA following its withdrawal from the EU, European financial institutions would continue to benefit from the passporting regime. Moreover, for some financial activities (eg, investments services) non-EEA based financial institutions may also access the single market provided their home-state regulation is deemed equivalent to the EU regime. However, such passporting rights do not automatically apply for insurance services under Solvency II: third-country access is controlled by the European Commission.20 UK insurers may find market access hard to come by as a third-country entities, especially if they lobby successfully to amend some of the provisions of Solvency II within UK legislation.
Non-admitted business – risks that can be underwritten without the need for a local licence, such as marine and aviation re/insurance – should be less directly affected by the loss of access to the EU single market. That is unless local legislation presents other regulatory hurdles for third-country re/insurers wanting to offer services in EU member states.21 Brexit could, however, still be very disruptive for wholesale insurance, a large amount of which is distributed and underwritten both into and out of the UK. According to the International Underwriters Association, up to GBP 7.4 billion of premiums (ie, around a third of the London Company market, which excludes Lloydʼs of London) could be directly affected by a change to EU financial passporting.22 Similarly, nearly GBP £3 billion, or 11% of Lloydʼs premiums, comes from continental Europe some of which could be at risk if passporting rights were lost.23
Access to capital: Another change that UK-based insurers may need to effect is to look for alternative sources of capital to grow their business. The UK attracts more foreign direct investment than any other EU state, and the financial services more than any other sector.24 For example, most of Lloydʼs of Londonʼs capital base is sourced from outside the UK. The attraction is in part the platform the UK provides to firms to undertake cross-border business in the EU and globally. Absent access to the EU single market, foreign investors may choose to put their funds elsewhere.
Access to talent: Lastly, restrictions on free movement of labour will likely be central to any Brexit arrangement. That could impair UK insurersʼ ability to access the best talent and reduce the UKʼs competitive advantage as an international insurance hub.
20 Brexit: Passporting and equivalence implications for the UK insurance sector, Clifford Chance, August 2016.
21 The General Agreement on Trading Services which is annexed to the World Trade Organization rules contemplates marine, aviation and transport being written in this fashion, which Article 172 of Solvency II is being interpreted to mean that reinsurance may be written on a non-admitted basis provided the UK attains equivalence. See http://www.insidebrexitlaw.com/blog/what-impact-might-brexit-have-on-the-london-insurance-market
22 London company market Statistics Report, IUA, October 2016.23 J. Kollewe, "Lloyd's considers opening EU subsidiary to be ready for Brexit", theguardian.com, 22
September 2016, https://www.theguardian.com/business/2016/sep/22/brexit-vote-imajor-lloyds-insurance-markets-profits-rise
24 Foreign direct investment comprises investments from outside a country to start up new subsidiaries, to expand existing establishments or to acquire local companies. According to UK Trade and Investment, the UK is a major recipient of FDI with an estimated stock value of over GBP 1 trillion, about half of which is from other members of the EU. See Inward Investment Report 2014 to 2015, UKTI 2015, https://www.gov.uk/government/publications/ukti-inward-investment-report-2014-to-2015/ukti-inward-investment-report-2014-to-2015-online-viewing
The access rights for UK insurers to the EU single market, and vice versa for continental European insurers to the UK market, could change.
Business without the need for a local license should be less impacted by the more restricted access.
UK-based insurers may need to look for alternative sources of capital to grow their business.
They may also find it harder to attract top talent.
Swiss Re Global insurance review 2016 and outlook 2017/18 21
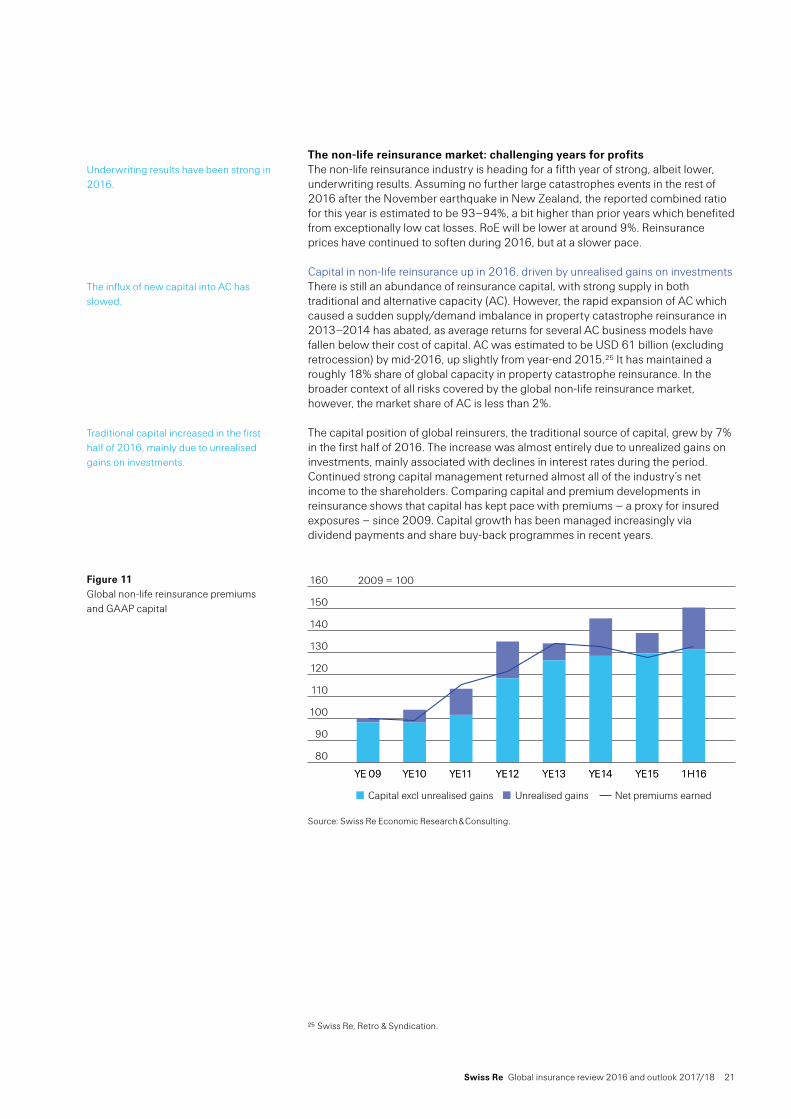
The non-life reinsurance market: challenging years for profitsThe non-life reinsurance industry is heading for a fifth year of strong, albeit lower, underwriting results. Assuming no further large catastrophes events in the rest of 2016 after the November earthquake in New Zealand, the reported combined ratio for this year is estimated to be 93‒94%, a bit higher than prior years which benefited from exceptionally low cat losses. RoE will be lower at around 9%. Reinsurance prices have continued to soften during 2016, but at a slower pace.
Capital in non-life reinsurance up in 2016, driven by unrealised gains on investmentsThere is still an abundance of reinsurance capital, with strong supply in both traditional and alternative capacity (AC). However, the rapid expansion of AC which caused a sudden supply/demand imbalance in property catastrophe reinsurance in 2013–2014 has abated, as average returns for several AC business models have fallen below their cost of capital. AC was estimated to be USD 61 billion (excluding retrocession) by mid-2016, up slightly from year-end 2015.25 It has maintained a roughly 18% share of global capacity in property catastrophe reinsurance. In the broader context of all risks covered by the global non-life reinsurance market, however, the market share of AC is less than 2%.
The capital position of global reinsurers, the traditional source of capital, grew by 7% in the first half of 2016. The increase was almost entirely due to unrealized gains on investments, mainly associated with declines in interest rates during the period. Continued strong capital management returned almost all of the industryʼs net income to the shareholders. Comparing capital and premium developments in reinsurance shows that capital has kept pace with premiums – a proxy for insured exposures – since 2009. Capital growth has been managed increasingly via dividend payments and share buy-back programmes in recent years.
Net premiums earned
Unrealised gains
Capital excl unr. gains
1H16YE15YE14YE13YE12YE11YE10YE 09
80
90
100
110
120
130
140
150
160
1H16YE15YE14YE13YE12YE11YE10YE 09
Net premiums earnedUnrealised gainsCapital excl unrealised gains
2009 = 100
Source: Swiss Re Economic Research & Consulting.
25 Swiss Re, Retro & Syndication.
Underwriting results have been strong in 2016.
The influx of new capital into AC has slowed.
Traditional capital increased in the first half of 2016, mainly due to unrealised gains on investments.
Figure 11 Global non-life reinsurance premiums and GAAP capital

22 Swiss Re Global insurance review 2016 and outlook 2017/18
Non-life re/insurance: improving growth, challenges to profitability
Underwriting results remain strong, driven by below-average natural catastrophe losses and reserve releases.Underwriting results in non-life reinsurance were strong again in 2016, due to the absence of large natural catastrophe losses. That said, the loss burden from natural catastrophes and man-made disasters increased in the first half of the year. Based on six- and nine-month data, the reinsurance industry is expected to report a combined ratio of around 93‒94% for the financial year 2016. However, this does not properly reflect underlying underwriting profitability, because natural catastrophe losses have been lower than anticipated and the claims ratio has been reduced by positive reserve releases from redundant reserves for prior yearsʼ claims.26 Excluding these two impacts, the underlying combined ratio will likely be close to 99% in 2016.
80%
85%
90%
95%
100%
105%
110%
115%Normalised combined ratio
Reported combined ratio
2016E20152014201320122011
80%
85%
90%
95%
100%
105%
110%
115%
2016E20152014201320122011
Normalised combined ratioReported combined ratio
Source: Swiss Re Economic Research & Consulting.
Profitability to weaken on lower investment returns, declining underwriting resultsIn the low-yield investment environment, underwriting results remain the main profit driver for non-life reinsurers. The industry achieved a meagre average 3.5% annualised investment yield in the first half of 2016, up slightly from 2015, 2.6% from investment income and 0.9% from capital gains. Based on a combined ratio of 93‒94%, an RoE around 9% is expected for the full-year 2016, down 3 ppt from 2015.
Outlook for 2017 and 2018 Global premiums in non-life reinsurance are expected to grow in 2017 in real terms, based on increasing cessions from emerging markets. Advanced markets premium growth will reflect a moderation in rate pressures, slowing growth in the primary market and accelerating inflation. Demand will likely also be supported by new solvency regulations. Non-life reinsurance has become more attractive for European insurers under Solvency II, since the new standards better reflect the risk mitigating effect of reinsurance. In the emerging markets, premium growth will improve on the back of macroeconomic recovery, particularly in Latin America, and rising cessions in China. Several other Latin American and Asian countries are strengthening solvency regulations. The addition of risk-based charges is likely to lead to higher capital requirements overall. The growth in global premiums is expected to recover further in 2018, driven by stronger sales of primary insurance in all regions.
26 With regards to the P&L account of insurers, claims reserve releases lower the amount of claims incurred which are booked in a certain financial year, thus positively impacting underwriting results and net income. Claims reserve additions add to the accounted claims burden in a financial year, with the opposite effect on the P&L. See http://media.swissre.com/documents/sigma4_2014_en.pdf
A combined ratio of 93-94% is expected for the industry.
Figure 12 Reported and normalised combined ratio of the reinsurance industry, 2011- 2016
RoE in the non-life reinsurance sector will be around 9% in 2016.
Premium growth will be subdued in the advanced markets in 2017 and gain traction in emerging markets

Swiss Re Global insurance review 2016 and outlook 2017/18 23
Region 2014 2015 2016E 2017F 2018F
Advanced markets –1.2% 0.8% 1.6% 1.1% 1.7%Emerging markets 3.7% 2.9% –0.7% 5.3% 6.3%World 0.0% 1.4% 1.0% 2.2% 2.9%
Source: Swiss Re Economic Research & Consulting
Given the strong erosion of profit margins over the last two years, property catastrophe reinsurance rates are close to bottoming out. The softening of average rates is expected to moderate across all lines of business. For casualty and specialty lines, significant differences in pricing developments by market and line of business are expected.
Assuming average catastrophe losses, moderating rates, a less-benign claims environment and declining reserve releases, the combined ratio in non-life reinsurance is forecast to be around 94‒96% in 2017 and 2018. Underwriting profitability is expected to remain below the average of recent years. Also, while interest rates in advanced markets are expected to rise, investment returns will improve, but with a lag, and they will remain below pre-financial crisis levels. The overall profitability outlook for the next two years is therefore moderate, with RoE of around 7%, assuming average natural catastrophes losses.
Increasing demand for customised and more strategically-motivated re/insurance solutionsThe reinsurance buying activities of insurance companies are becoming increasingly split between commodity buying and customised solutions. Commoditisation and increased retention of standard re/insurance risks contrast increased utilisation of larger and or more strategically motivated reinsurance solutions. Drivers of this development are insurance industry consolidation, globalisation of risks (eg, cyber, contingent business interruption), technological innovations (risk models, data analytics), AC and regulatory reforms.27
The trend of global insurers to centralise the purchase of reinsurance across lines of business and territories has led to higher limits and higher retentions, substituting local contracts with more complex and larger solutions. The spread of risk-based capital (RBC) and economic capital models for rating agency purposes and solvency regulation has also increased the sophistication of reinsurance buying.
Strategic reinsurance programs are customised to provide more efficient risk protection, and help insurers optimize their capital structure in order to improve capital returns and minimise capital costs. Increasingly, reinsurance is integrated into insurersʼ long-term strategy and growth plans. Event-driven solutions arise from challenging circumstances, such as a mergers and acquisitions, changes in regulatory regimes and market dislocations. Structured protection and risk transfer solutions are tailored to increase the efficiency of reinsurance programs by combining multiple risks and/or interdependent triggers.
27 sigma 5/2016: Strategic insurance and reinsurance: the increasing trend of customised soluions, Swiss Re.
Table 3 Real growth of non-life reinsurance premiums
Price pressures are expected to moderate.
The average combined ratio is expected to be around 94-96%, and RoE at 7%, in 2017, assuming normal cat losses and declines in reserve releases.
The use of non-traditional or customized reinsurance has become more prominent.
Reinsurance buying has become increasingly centralized, leading to larger and more complex deals.
Customized reinsurance solutions can be more efficient, targeted and flexible than traditional capacity.

24 Swiss Re Global insurance review 2016 and outlook 2017/18
Life re/insurance: transition to a new reality
Global premiums grow, but advanced markets remain sluggishGlobal life insurance premiums are estimated to have risen by 5.4% in 2016 in real terms, up from 5% growth in 2015. In advanced markets, premium growth has slowed to 2% in 2016 from 3.4% last year. Life premiums in North America are estimated to have risen by 1.7% this year and 4.2% last year. Premiums in advanced EMEA rose by 1.6% (2015: +3.6%). Premiums in advanced Asia-Pacific have grown by 3% this year after a 2.2% gain in 2015. The emerging markets, in particular emerging Asia, were the main drivers for the global life sector. Emerging market premiums for the full-year 2016 are projected to have grown by 20.1%, up from a 13.2% increase in 2015.
Country 2014 2015 2016E 2017F 2018F
US –1.7% 4.3% 1.6% 1.7% 1.7%Canada 7.6% 3.5% 3.0% 3.6% 3.7%UK –11.9% 17.6% 2.2% 1.5% 2.0%Japan 6.8% 1.5% 2.6% 2.0% 1.3%Australia 26.5% –7.4% –5.7% 4.1% 4.1%France 8.4% 1.3% 1.4% 1.4% 2.6%Germany 2.4% –2.7% –2.3% 0.9% 1.3%Italy 29.5% 4.0% –2.1% 0.2% 1.1%Spain –2.5% 3.4% 23.9% 1.5% 0.9%Netherlands –4.6% –16.9% 2.9% 1.6% 1.6%Advanced markets 4.0% 3.4% 2.0% 2.1% 2.1%Emerging markets 7.8% 13.2% 20.1% 14.9% 10.9%World 4.7% 5.0% 5.4% 4.8% 4.2%
Note: this table provides growth rates for Life business alone (ie, excluding medex).
Source: Swiss Re Economic Research & Consulting.
Low interest rate environment continues to pose challengesThe ongoing low interest rate environment – including further falls in bond yields in the wake of the Brexit vote – continues to pose problems for life insurers. Low yields affect both sides of the balance sheet. However, net valuation effects often imply lower capital ratios for long-term business, unless assets and liabilities are perfectly matched.
The traditional savings-type insurance business, which is around 85% of premium income of L&H insurers, is particularly challenged.28 Historically low interest rates are likely to persist for a prolonged period and limit the industryʼs ability to offer attractive savings products. Moreover, the profitability of in-force business is often severely impaired. Insurers holding old books of business with high interest rate guarantees have to put aside substantial reserves to close the spread between guarantees and investment returns. To maintain a match with liabilities, they also must reinvest into lower-yielding fixed-income assets as these shorter duration assets mature.
Risk-based prudential regulations are being introduced across the globe (eg, Solvency II regulations for insurers in Europe came into force on 1 January 2016, see Box: Solvency II update). The details of the rules differ, but all aim to move towards an economic valuation of insurersʼ assets and liabilities in order to recognise the full cost of producing life insurance, including the cost of capital required to support the business. For example, in Germany and Belgium, additional reserves are requested for in-force business with high interest rate guarantees. In Hong Kong the
28 Savings-type insurance combines risk protection and wealth accumulation, for example fixed and variable annuities, universal life and variable universal life, endowment policies and most unit-linked business, as well as retirement and pension products.
Global life premiums grew by 5.4% in 2016, driven by strong performance in the emerging markets.
Table 4 In-force real premium income growth for life insurance
The ongoing low interest rate environment continues to pose problems for life insurers.
Managing legacy savings business with embedded guarantees is particularly challenging.
Regulators across the globe behave quite differently with respect to guarantees.

Swiss Re Global insurance review 2016 and outlook 2017/18 25
regulator still allows insurers to sell products with relatively generous guarantees, but the high guarantee will be reflected in higher capital charges in the coming risk-based capital regime.29 Other countries have imposed restrictions on new business, including limits on the size of guarantees.
Solvency II updateGiven the protracted design process for Solvency II, in particular the various measures introduced to reduce balance sheet volatility and smooth transition from the previous regime, it is unsurprising that most insurers seem to have adapted well to the new rules. According to the latest Solvency II Wire/Thomson survey, in the second quarter of 2016, 58% of insurers believed they were ready for Solvency II, little changed from the start of the year (61%).30 Those insurance groups that have voluntarily reported their Solvency II ratios comfortably meet the new capital requirements with little change from end-2015 solvency levels (see Figure 13). The first regulatory data reporting cycle also appears to have progressed as planned without any major incidents.31
AEG
ON
Age
as
Alli
anz
Avi
va
AX
A
Gen
eral
i
JRP
Lega
l & G
ener
al
Map
fre
NN
Gro
up
Prud
entia
l
PZU
St J
ames
’s P
lace
Stan
dard
Life
Topd
anm
ark
VIG
H1 2016 2015 Ave. H1 2016 Ave. 2015
120
140
160
180
200
220
240
260
280
Source: Individual company accounts, Swiss Re Economic Research & Consulting.
However, some insurers still face challenges. The proportion of surveyed firms that believed they were not ready for Solvency II rose to 16% from the pre-2016 sample average of 10%. This could in part be because full transparency about the new regulations is still pending. For example, changes and methods used for capital generation are yet to be sufficiently explained. While many insurers are actively using their internal models in different business decisions, supervisors are becoming increasingly skeptical about such models and are imposing overlays or other restrictions on their use for regulatory purposes. In addition, supervisory measures, such as those regarding the number of counterparties and eligible collateral could have unintended consequences for optimal risk management, including undermining some of the benefits of reinsurance.
29 Since the launch of the so-called “three-step” liberalisation in China in 2013, insurers have offered higher guaranteed yields to expand sales, in some cases guarantees up to 4.025%, against an ongoing 10-year bond yield at around 2.5%.
30 The survey sample consists of around 220 insurers, asset managers and providers of data based in Europe, and includes data collected up to the end of the second quarter of 2016. See Solvency II Wire Quarterly - 2016 2Q, 20 July 2016, http://www.solvencyiiwire.com/solvency-ii-wire-quarterly-2016-q2/1586696
31 Day 1 reporting was due 19 May 2016, by all undertakings, and the first quarterly filing for those solo undertakings falling within scope by 26 May 2016.
Solvency II came into force at the beginning of 2016; most insurers have adjusted smoothly to the new regime.
Figure 13 Group solvency ratios for selected European life/composite insurers (2015 and H2 2016)
However, a minority of insurers report they remain ill-prepared for the change.

26 Swiss Re Global insurance review 2016 and outlook 2017/18
Life re/insurance: transition to a new reality
Life insurersʼ reported RoE has drifted lower over the past year alongside weaker investment returns (see Figure 14 left-hand panel). Forward-looking indicators of profitability such as stock prices suggest little immediate turnaround. After generally outperforming their respective national stock market indices during 2012 to 2015, equity prices of major life insurers have grown more slowly of late (see Figure 14 right-hand panel). UK life insurersʼ stock valuations were hit by the Brexit vote. Some European insurers were also impacted, reflecting the potential region-wide impact.
Life insurers are taking steps to re-orientate their business models. In particular, they are seeking to adjust their product mix to strengthen their balance sheets and boost profitability by lowering guarantees, introducing more flexible forms of guarantees (“not fixed for life”), shifting the interest rate and other market risk to policyholders, and reducing profit sharing. Regulatory changes require adjustments as well. For instance, the German regulator has announced that the maximum rate insurers will be allowed to guarantee is to be reduced from 1.25% to 0.90% in 2017, which will affect only new business.
The rising difficulty in boosting profitability is reflected in the life insurersʼ share prices.
Figure 14 Return on equity of 28 global composite and life insurance companies (left), and life insurance sector stock price indices relative to total market indices (right)
40%
60%
80%
100%
120%
140%
160%
180%Asia
UK
Europe
US
2016
05.01.20152015
03.01.20142014
03.01.20132013
03.01.20122012
04.01.20112011
2010
2009
–10%
–5%
0%
5%
10%
15%
20%
25%
2016
2015
2014
2013
2012
2011
2010
200
9
200
8
Market cap weighted average2 Chinese companies10 US companies6 UK companies7 European Globals3 Canadian companies
40
60
80
100
120
140
160
180 Ratio indices (5 January 2009 = 100)Return on equity
Brexit vote:24.6.2016
200
9
2010
2011
2012
2013
2014
2015
2016
Asia UKEUUS
Left-hand panel: Based on IFRS/local GAAP data. Missing Q1/Q3 values are interpolated. Companies in the sample include: Aflac; Allianz; Assurant Inc; Aviva; AXA; China Life; CNP; Generali; Genworth Financial; Great-West Lifeco; Hartford; Legal & General; Lincoln National; Manulife; Metlife Group; Old Mutual; Ping An; Prudential (UK); Prudential (US); St. James Place ; StanCorp Financial Group; Standard Life; Storebrand ASA; Sun Life; Swiss Life; Torchmark; Unum Group; Zurich. Right-hand panel: US refers to Dow Jones US Life Insurance Index/Dow Jones US Total Stock Market Index; Europe refers to STOXX Europe Life Insurance Index/STOXX Europe Total Market; UK refers to FTSE 350 Life Insurance Index/FTSE 350 Index; Asia refers to BI Asia Pacific Life Insurance Valuation Peers/S&P Asia 50 Index.Source: Company reports, Bloomberg, Swiss Re Economic Research & Consulting.
Insurers are adjusting their product portfolios in a bid to boost profitability and reconfigure their balance sheets.

Swiss Re Global insurance review 2016 and outlook 2017/18 27
As well as revising terms and conditions, life insurers have shifted their focus from traditional savings to life protection business. For example, in the US the share of savings premiums in total in-force premiums declined from 82% in 2008 to 79% in 2015 as life insurers stopped offering certain types of savings products. Biometric products like term life or disability insurance are increasingly sold in advanced markets. New business sales in 2016 have underscored this trend but also that strong growth is difficult to achieve, despite existing protection gaps in many countries: In the US, sales of term insurance continued to grow modestly (2% in the first half
of 2016), while sales of individual and group disability products improved at a stronger 5%. In Canada, term sales were up 2% in the first half, following more solid growth of 7% in 2015, partly driven by re-pricing actions at some carriers.
The protection business in the UK is growing again after a long period of contraction. In the first half of 2016, protection sales rose by 3.8%, following three consecutive years of declining premiums. In Germany, new business of term sales grew by 2.1% in each of the first two quarters of the year, while sales of disability products grew by 3.8%. Long-term care insurance sales have improved also.
However, a change in product mix takes time to have material effect on insurersʼ overall risk profile and profits, especially for firms where the legacy portfolio still represents a substantial amount of liabilities. Meanwhile, technological innovations are driving down barriers to entry in core markets and intensifying competition, meaning that some of the adjustment has to fall on the asset side of insurersʼ balance sheets.
Investment portfolios remain predominantly focused on fixed-income instruments, not least because these typically provide the best match to insurersʼ long-term liabilities and regulatory capital requirements. Nonetheless, starting from a low base, life companies continue to move into non-traditional investments. These include relatively illiquid assets and/or assets with higher return potential such as private equity, infrastructure debt, and real estate equity. There are regional/country differences in asset allocation strategies: In the Americas, insurers have strong demand for loan asset classes such as
commercial mortgage loans and collateralised loan obligations. Mortgage loans and real estate represented 12% of US life insurersʼ assets in 2015, up from 10.6% in 2012. The share of investments in alternative assets (4.5%) was also higher in 2015 than in earlier years, although a little lower than in 2014 (4.8%).32
UK and northern European insurers see better opportunities in illiquid assets like infrastructure and real estate, while those in southern Europe are more likely to increase their allocation to equities. In Germany, there is increased interest in tactical asset allocations as a means to exploit short-term market volatility.33
Insurers in Asia Pacific are reportedly more focused on increasing their hedge fund allocations.34
At a time when acquiring new business has become harder and more expensive, in-force management is increasingly recognised as an effective tool to improve profitability. For example, persistency programs to decelerate lapse rates can be more cost-effective than programs to attract new customers. However, effective in-force management requires a holistic view of the business and ideally includes all functional areas from asset, liability, capital to product management. In this context, life insurers also show renewed interest in closed life book disposals to optimise their capital.
32 Investment strategies of US life insurers in a low interest rate environment, Milliman, May 201633 In a 2015 survey, over 60% of European insurers expected to increase allocations to real estate
and/or alternatives. See European Insurance: Unprecedented pressure and change, Standard Life, November 2015.
34 Optimism Grows as Expectations Decline, GSAM Insurance Survey, April 2016.
They have also shifted their focus from savings to life protection business.
A change in product mix takes time to have a material effect on insurersʼ overall risk profile and profits.
Asset portfolios remain predominantly focused on fixed-income instruments, but insurers are also increasing investments in non-traditional assets.
In-force management is increasingly recognized as an effective tool to improve profitability.

28 Swiss Re Global insurance review 2016 and outlook 2017/18
Life re/insurance: transition to a new reality
Closed book acquisitions set to accelerate?The closed life book acquisitions market has been relatively subdued recently. In 2016 so far, there have been no notable deal announcements by the US specialist consolidators, nor by alternative investors who were prominent buyers of blocks of savings business after the financial crisis. The total number of transactions globally over the past three years is significantly below its level in 2011–2013 (see Figure 15). This could be in part due to ongoing regulatory uncertainty, with deliberations about Solvency II in particular acting as a drag on deal-making. Worries about the economic outlook post-US election year, increased competition and relatively high valuations are some of the other factors behind the slowdown in acquisition activity.
However, the aggregate masks a recent pick-up in activity in select markets. A number of UK deals were announced over the past nine months. For example, AXA recently sold its UK and Isle of Man life insurance operations to LCCG and the Phoenix Group as part of a strategy of focusing on emerging markets like the Philippines and Brazil.35 Similarly, given the prospect of long-term interest rates remaining low and with Solvency II now finalised, continental European insurers are reportedly eyeing disposals of run-off portfolios as part of a proactive focus on in-force management.36 This follows the completion of a number of small-value deals in some European markets during 2015, including acquisitions by Frankfurter Leben Group, a newly-established specialist consolidator in the German closed life insurance market.37
Other
Cont Europe
UK
US
0
5
10
15
20
25
2016 (ytd)2015201420132012201120102009
OtherContinental EuropeUKUS
Source: Swiss Re Economic Research & Consulting (based on publicly available data).
35 Unlocking value in run-off: A Survey of Discontinued Insurance Business in Europe, PWC, September 2016
36 Global Insurance M&A News: Europe, Middle East, Africa update, KPMG, October 2015, https://home.kpmg.com/xx/en/home/insights/2015/10/global-insurance-ma-news-emea-oct-2015-fs.html
37 For example, in September 2015 Frankfurter Leben announced it would acquire the German branch of Baloise Life Ltd. Baloise has not written any new business via this subsidiary since 2012. See Baloise sells closed life insurance portfolio in Germany, Baloise, 17 September 2015, https://www.baloise.com/en/home/media/news/2015/baloise-sells-closed-life-insurance-portfolio-germany.html
In aggregate, closed life book acquisitions have slowed over the past few years …
… but there has been a recent pick-up in activity in Europe, especially in the UK.
Figure 15 Number of closed-book acquisitions by nationality of target firm, 2009-2016

Swiss Re Global insurance review 2016 and outlook 2017/18 29
The difficulties of servicing policyholders in multiple languages and close regulatory scrutiny of outsourcing partners continue to present challenges for sales of legacy portfolios in Europe. But market commentators remain upbeat about the overall outlook for consolidation and acquisition activity in the European run-off market. Moreover, Brexit could act as a catalyst for foreign insurers to dispose of UK insurance legacy business. The sustained depreciation of sterling since the Brexit vote means that GBP earnings, when repatriated, are less attractive for overseas institutions.
Elsewhere, the underlying drivers of demand for closed book deals in the US, including still-weak organic growth, challenges from low interest rates for longer, and new regulations raising capital requirements, remain in place. These conditions will likely lead to spin offs or sales of blocks of business in due course.
Primary life insurance outlook for 2017 and 2018Global life real premium income is forecast to rise by 4.8% and 4.2% in 2017 and 2018, respectively. Advanced market premiums are expected to grow by 2.1% in both years. In the emerging markets, they are forecast to grow by 14.9% in 2017 and by 10.9% in 2018. The major driver for the global life sector will be the emerging markets, where stabilising economic growth, growing populations, urbanisation and a rising middle class underpin the positive outlook for insurers and insurance penetration. Global insurers from the mature markets will continue to expand in high-growth markets, though the recent slowdown in emerging markets may dampen the pace of growth. At the same time, insurers from developing economies, especially emerging Asia, will increasingly enter advanced markets to obtain know-how and diversify geographically.
In addition to adjusting their product and investment portfolios, traditional life insurers need to upgrade their business models to exploit new technology and data science. Small specialised niche players are starting to pick off aspects of the life insurance value chain. Big tech giants such as Google and Amazon have comprehensive information about consumers and strong data analytics capabilities, and are eyeing opportunities in life & health insurance, although to date there have been only a few instances of market entry. In Asia, consumers indicate a preference for well-known non-insurance brands – such as Alibaba and WeChat in China – and may substitute away from traditional insurance carriers (see section on Consumer preferences with regards to critical illness cover in China in the emerging markets chapter on page 41). In response, some life insurers are partnering with fintech firms and/or are investing in start-ups to enhance their digital capabilities (see Box: Insurtech and new entrants ‒ an update).
Challenges to legacy book disposals persist, but the market environment for European deals remains supportive.
Prospects for the US closed book market also remain positive.
Insurers from advanced and emerging markets will continue to diversify.
Traditional life insurers will need to adapt their business models.

30 Swiss Re Global insurance review 2016 and outlook 2017/18
Life re/insurance: transition to a new reality
Insurtech and new entrants – an updateIn 2016, technology brands made some key announcements about their roles in the insurance industry. Rather than disrupt the life insurance industry, most insurtech start-ups seek to complement existing processes. In 2016, insurers invested in and experimented with robo-advisors, big data analytics and machine learning across the insurance value chain.
Acquisition Underwriting Claims Asset Management
Simplified product design
Richer profiling
Tapping into third-party data sources
Accelerated underwriting
Digitising paper data
Faster response times
Trend spotting Automated
investment advice
Source: Swiss Re Economic Research & Consulting.
Acquisition: Recognising that sales are still heavily driven by sales agents, artificial intelligence (AI) can be used to qualify leads and identify prospects who may want to buy, then pass that information on to sales people. Some start-ups are taking the acquisition process fully mobile, targeting customers with simple on-demand products online. For example, a company called Sure has begun selling life insurance that offers protection during flights.38
Underwriting: Underwriting models based on new data sources are relatively unproven in life insurance. However, start-ups are making progress with term life insurance using available, permissible data sources to improve the underwriting process. Insurers support those start-ups that typically register as "managing general agents", since they can sign up customers but are not regulated as insurers.39 For example Ladder, a start-up that has partnered with an insurer to provide term life policies, uses data such as prescription drug histories from third-party sources to assess health risks.40 Another start-up FitSense is using data analytics to assess and track individualsʼ risk profiles based on data from apps and wearable devices.41
38 B. Yerak, “Buying insurance may soon be as easy as a swipe on a smartphone”, Chicago Tribune, 11 July 2016, http://www.chicagotribune.com/business/
39 P. Rudegeair “Venture Capital Prowls into the Life-Insurance Business”, WSJ, 19 October 2016, http://www.wsj.com/articles/online-lending-investor-turns-to-life-insurance-1476889040
40 Ibid.41 “Itʼs all about the data! How wearables tech enables life and health insurers to better understand and
engage with customers,” Daily Fintech, 8 October 2015, https://dailyfintech.com/2015/10/08/ its-all-about-the-data-how-wearables-tech-enables-life-and-health-insurers-to-better-understand- and-engage-with-customers/
Rather than disrupt the life insurance industry, most insurtech start-ups seek to complement existing processes.
Figure 16 Schematic of how new entrants are enhancing the insurance value chain

Swiss Re Global insurance review 2016 and outlook 2017/18 31
Claims: Life insurers still use paper but can now access modern technology to read handwriting and speed-up the claims process. Insurers like New York Life and AXA are using start-ups to extract data from handwritten and typed forms at high levels of accuracy.42 Machine learning and humans can validate the results. Insurers can now go back in time to read data that has not been digitised for decades.
Asset management: Investment analysts can use AI software to identify trends. Life insurers like Manulife have started working with software start-ups that can analyse word choices from analyst reports and detect whether the language is positive or negative.43 And robo-advisors offer algorithm-based automated investment advice based on investor goals and risk tolerance. Some life insurers have acquired robo-advisors to be able to serve more customers more efficiently (eg, John Hancock acquired Guide, Northwest Mutual acquired LearnVest).44
Medical expense marketGlobal medical expense (medex) insurance premiums adjusted for inflation are estimated to have grown by 3.6% in 2016. Premiums in the advanced markets increased by 3.3%, down from 9% in 2015 (see Table 5). The slowdown is due to lower growth in the US after two years of strong increases, driven by the expansion of health coverage that came with the introduction of the Affordable Care Act (see Box: The Affordable Care Act (ACA) in the US – an update). Growth in the emerging markets has slowed as well, but remains robust at 10.7%. This is mostly due to rapid growth in China where medex insurance is supplementary to various state schemes covering out-patient costs, deductibles and co-payments. Global medex premiums are forecast to grow by 3.4% and 3.2% in 2017 and 2018, respectively. In advanced markets, growth is forecast to be 3.1% and 2.8%, respectively, and in emerging markets 12% and 11.2%.
Country 2014 2015 2016E 2017F 2018F
Advanced markets 4.3% 9.0% 3.3% 3.1% 2.8% US 5.6% 10.2% 3.3% 3.1% 2.9%Emerging markets 16.7% 13.4% 10.7% 12.0% 11.2% excl. China 11.7% 5.9% 5.8% 7.6% 6.8%World 4.8% 9.2% 3.6% 3.4% 3.2%
Source: Swiss Re Economic Research & Consulting.
42 A. Simpson, “Data Conversion Startup Captricity Gets White Mountain Insurance Backing”, Insurance Journal, 3 February 2016, http://www.insurancejournal.com/news/national/2016/02/03/397366.htm
43 “Manulife opens innovation lab in Singapore”, Finextra, 29 September 2016, https://www.finextra.com/pressarticle/66351/manulife-opens-innovation-lab-in-singapore
44 John Hancock Acquires Software Provider Guide Financial, Inc. As Part of Companywide Long-Term Innovation Plan, John Hancock, 26 May 2015, http://www.johnhancock.com/about/news_details.php?fn=may2615-text&yr=2015; “Northwestern Mutual acquires LearnVest, the financial planning startup,” Fortune, 25 March 2015, http://fortune.com/2015/03/25/northwestern-mutual-acquires-learnvest/
Medex insurance premiums slowed in 2016, after expanded health coverage in the US boosted growth in 2014-2015.
Table 5 Real premium income growth for medical expense insurance

32 Swiss Re Global insurance review 2016 and outlook 2017/18
Life re/insurance: transition to a new reality
The Affordable Care Act (ACA) in the US – an updateThe 2010 Patient Protection and Affordable Care Act (ACA) greatly expanded health insurance coverage in the US. Starting in 2014, more people gained access to the system through the creation of a marketplace of public health exchanges for individuals and small employers to purchase coverage online, and also the expansion of Medicaid.45 According to the Department of Health and Human Services, 20 million more people have gained health insurance cover because of the ACA.46
Many insurers - large and small - offering policies on the public health exchanges experienced losses in 2014 and 2015 due to still-limited experience in setting rates, higher-than-expected claims because of a larger share of older and riskier enrollees than originally anticipated, and adverse selection issues. The losses have been particularly problematic for small, undiversified insurers. Most of the government-funded non-profit Consumer Operated and Oriented Plans (CO-OPs) that were created to provide more choice to consumers and develop innovative delivery and payment methods, have failed.47 Meanwhile, a number of the largest health insurers have announced that they will scale back operations or withdraw completely from the exchanges.48
Insurersʼ challenges on the exchanges are leading to rate increases and less choice for consumers. The rate increase requests put in by insurers who plan to continue offering exchange policies in 2017 have been significantly higher than in prior years, in some cases by almost as much as 30%.49 Also, it is estimated that close to a fifth of all people enrolled on the exchanges will only have one insurer to choose in 2017.50 More expensive policies, scarcity of insurer choice and limited access to providers may lead to further worsening of the risk pool on the exchanges should more of the young and healthy be dissuaded from buying insurance.
The ACA and its challenges around affordability and controlling costs in an unstable market place have been topics of heated political debate recently, increasing uncertainties for health insurers. President-elect Donald Trump has advocated repeal and replacement of some aspects of the ACA, but no clear alternative has been laid out yet. Regardless of what specific policy path is implemented, there will be significant changes for insurers in the future.
45 Medicaid is the combined federal and state programs that provide coverage for the poor.46 Data are as of March 2016. Source HHS.com, http://www.hhs.gov/about/news/2016/03/03/
20-million-people-have-gained-health-insurance-coverage-because-affordable-care-act-new-estimates47 17 of the original 23 CO-OPs created by the ACA have closed operations under mounting financial stress
from poor pricing strategies and changes to government programs designed to provide a buffer for insurers who did not accurately price products offered on exchanges.
48 For example, UnitedHealth has announced that it will limit participation on exchanges to three states in 2017, from 34 in 2016. Humana has exited four states and Aetna announced that it will participate in four states in 2017, from 15 in 2016. Source: ʼYour carrierʼs leaving the exchange. What now?, healthinsurance.org, 24 August 2016, https://www.healthinsurance.org/blog/2016/08/24/your-carriers-leaving-the-exchange-what-now/
49 Analysis of 2017 Premium Changes and Insurer Participation in the Affordable Care Actʼs Health Insurance Marketplaces, The Henry J. Kaiser Family Foundation, July 2016
50 Preliminary Data on Insurer Exits and Entrants in 2017 Affordable Care Act Marketplaces, The Henry J. Kaiser Family Foundation, August 2016.
The ACA has expanded health insurance coverage to 20 million formerly uninsured people through public exchanges and Medicaid.
Some small insurers have failed and a number of large ones will scale back operations or withdraw from the exchanges in 2017.
Consumers who buy health insurance on the exchanges will face higher rates and less choices.
There will be significant changes for health insurers under the Trump presidency.

Swiss Re Global insurance review 2016 and outlook 2017/18 33
The life reinsurance marketFor the seven reinsurers among the Top 10 with available data,51 net premiums were roughly flat in nominal USD terms in the first half of 2016 relative to the same year-earlier period. Individual company performance within the Top 10 varied greatly. Some saw good persistency of in-force business and solid new business results across several lines, while other firms faced weak organic growth and large capital relief deals that were modified or cancelled. There was a high level of deal activity in the longevity space in the first half of 2015. This was not repeated in the first half of 2016 which negatively impacted the year-on-year comparison, as did the effect of currency fluctuations on a number of reinsurers.
Global premiums in traditional life reinsurance, consisting of mortality and morbidity, are estimated to have grown by 1.5% in real terms in 2016. In advanced markets, a 0.5% increase was driven by positive developments in Canada, the UK, Japan and Australia, while premiums in the US contracted as a result of lower cession rates and weakness in protection sales. In the emerging markets, premiums are estimated to have grown by 8.6%, driven largely by China, with other emerging markets seeing more modest growth. There have been significant fluctuations in the Chinese market in recent years, with large capital relief deals in the form of facultative reinsurance arrangements by some life insurers in 2014 leading to triple-digit growth, followed by a return to more normal levels of business in 2015 and more trend-like growth in 2016.
Country 2014 2015 2016E 2017F 2018F
Advanced markets 1.7% –0.4% 0.5% –0.2% 0.0%Emerging markets 138.9% –45.9% 8.6% 8.4% 8.8% excl. China 9.0% 5.8% 5.0% 4.9% 5.6% China 369.9% –66.5% 12.7% 12.0% 12.0%World 15.0% –9.5% 1.5% 0.9% 1.2%
Source: Swiss Re Economic Research & Consulting.
Life reinsurance outlook for 2017 and 2018World premiums in traditional life reinsurance are expected to increase only marginally over the next two years, driven by the emerging markets, especially China. Premiums in the advanced markets will be roughly flat, with modest growth in Australia, Canada, Japan and some Western European countries offsetting declines in the US and the UK. In the US, the long-term trend of declining cession rates and modest growth of protection business in primary insurance underpin the muted growth outlook. In advanced markets outside of the US and the UK where cession rates are usually much lower, traditional reinsurance will continue to grow by low, single-digit rates, in line with the direct protection business. In emerging markets, where life reinsurersʼ main value proposition is to support primary insurance in product development, underwriting and claims management, premiums are expected to increase by 8% to 9% annually in the next two years.
51 These seven companies (Munich Re, Swiss Re, RGA, SCOR, Hannover Re, Berkshire Hathaway and Partner Re) accounted for about 86% of the total life reinsurance market net premiums earned in 2015.
Premiums earned by top life reinsurers were roughly flat in the first half of this year.
Global traditional life reinsurance premiums are estimated to have grown by 1.5% in 2016.
Table 6 Real premium income growth for traditional life reinsurance
Premiums in traditional life reinsurance will grow only marginally over the next two years.

34 Swiss Re Global insurance review 2016 and outlook 2017/18
Life re/insurance: transition to a new reality
Outside of traditional business, demand for large transactions including block deals, capital relief solutions and longevity risk transfers is expected to remain strong and help drive growth in the coming years. This will help reinsurers in the UK and North America to continue to diversify away from traditional mortality business. In the US, regulatory changes – including increased scrutiny of the use of captive reinsurance and an expected move towards principles-based reserving – will impact business opportunities. Medical reinsurance also presents opportunities in select markets.
Life reinsurers are increasingly developing solutions to take longevity risk from primary firms with annuity business, and from private and public pension plans. There is a large amount of longevity risk on corporate balance sheets and in private and public pension plans. Both reinsurers and large life insurers have been active in providing longevity reinsurance and swap solutions. New players have entered the market and cross-border transactions are on the rise, with longevity risks in the UK and continental Europe being reinsured by US- and Canada-based companies. Most of the activity has been in the UK, though there have also been transactions with Australian, Canadian and French insurers. In 2015, about USD 50 billion of liabilities were transferred via longevity reinsurance and swaps. This follows a record USD 62 billion liabilities transferred in 2014. The market has slowed in 2016 (see Figure 17) due to lower-than-expected mortality improvements in some markets (eg, the UK) resulting in discrepancies in pricing of longevity risk, but the slowdown is expected to be temporary.52
Average amount of liabilities transferredNumber of deals (RHS)
0
1
2
3
4
5
6
7 USD billion
2016 YTD(through Oct.)
20152014201320122011201020092008
0
2
4
6
8
10
12
14
Number of deals (RHS)Average amount ofliabilities transferred
Source: Swiss Re Economic Research & Consulting, based on various public sources.
Regulatory reforms, low investment yields, mark-to-market accounting, pension underfunding and higher fees for carrying a pension deficit have led to growing demand for longevity risk transfer. Longevity reinsurance is expected to spread to other markets, including the Netherlands, Switzerland and the US. However, re/insurance capital will be insufficient to meet all the demand, and capital market solutions will be needed.
52 “Aon Hewitt tells pensions to delay longevity swaps,” Artemis, 27 October 2016, http://www.artemis.bm/blog/2016/10/27/aon-hewitt-tells-pensions-to-delay-longevity-swaps/
Large transactions will remain a growth area for life reinsurers.
There is an active market for longevity risk transfer.
Figure 17 Longevity reinsurance and swap transactions
Demand for longevity risk reinsurance will continue to grow.

Swiss Re Global insurance review 2016 and outlook 2017/18 35
Emerging markets: improved growth in non-life, strong performance in life
Non-life in 2016: mixed performance amid still-strong economic headwindsReal growth of non-life premiums in the emerging markets for the full-year 2016 is forecast at 5.3%, up from 4.9% in 2015. Emerging Asia continues to outperform this year but at a slower rate, with estimated real growth of 7.3% compared to 9% in 2015. Strong infrastructure investment has supported property insurance premiums in the region. Non-life premium growth in China has decelerated (7.3% in 2016 vs 10.0% in 2015) due to the slowing economy and competition induced by nationwide pricing liberalisation in non-mandatory motor business. In Southeast Asia, weak car sales have pressured motor insurance and a slowdown in trade has led to lower marine premiums.
In Latin America, non-life premiums are estimated to have barely grown in 2016 (+0.3%; 2015: +3.0%). The economic downturns in Brazil, Argentina, Venezuela and Peru have hurt business. In Brazil, sharp declines in property values and auto sales challenged property and motor insurance lines. In Peru, the soft market in marine and engineering lines intensified in 2016. In comparison, non-life premiums growth has been strong in Mexico thanks to the economic recovery there, and has remained positive in Colombia and Chile. Profitability in the non-life sector has deteriorated this year, with weaker underwriting results in most markets, and flat or lower investment earnings against the backdrop of prevailing low interest rates.
Premiums in CEE returned to growth in 2016 after two years of decline, driven by a marked improvement in motor. In Poland, premium growth has been positive after having stagnated for years, as prices for motor cover (which accounts for almost 60% of total non-life premiums) picked up by over 6.5% from the 2015 average. Premiums in Russia, the second largest non-life market in CEE, have stabilised (+2.6%) in 2016 after a sharp contraction of 12% in 2015. In the Czech Republic, Hungary and Slovakia, non-life premiums have also grown steadily. The improvement in motor pricing in CEE is welcome and supports underwriting performance, particularly after the collapse of leading motor insurers in Romania in 2015.
In the Middle East and North Africa (MENA, excluding Israel) growth of non-life premiums has accelerated to 9.3% in 2016 from 6.3% in 2015. In Turkey, premiums are estimated to have risen by 22% with strong momentum across all major lines including motor, credit & surety, engineering and liability. Saudi Arabia is also expected to have registered double-digit growth in 2016, thanks to higher rates in motor. The UAE is the only major market in the region that may report a decline in non-life premiums in 2016. That said, the introduction of compulsory medical covers in Dubai will likely boost premiums from hereon. Underwriting results have deteriorated in most markets in the Middle East due to price competition and limited product differentiation.
Non-life in emerging Asia has outperformed other regions in 2016.
Non-life premium growth stagnated in Latin America due to economic downturn in many countries.
Premiums in CEE returned to growth, driven by improvements in three key markets: Russia, Poland and Hungary.
In MENA, growth in non-life premiums accelerated in 2016.

36 Swiss Re Global insurance review 2016 and outlook 2017/18
Emerging markets: improved growth in non-life, strong performance in life
In Sub-Saharan Africa (SSA), available data and estimates for select markets indicate that premiums overall have barely grown in 2016 from 2015. In South Africa, the weak economic environment has lowered premium growth (+0.3%). In other resource-intensive countries, including Nigeria, economic recession and significantly weaker rates in oil and gas have adversely impacted overall non-life premium growth. In Kenya, engineering and marine premiums have declined markedly, while motor premiums have grown only slowly. Underwriting results have turned positive in Kenya, but still remain low compared to the past. Outstanding premium payments, though not increasing anymore, remain an issue as they still account for a quarter of premiums written in Kenya.
2018F
2017F
2016E
2015
2014
Advancedmarkets
Sub-SaharanAfrica
Centraland EasternEurope
LatinAmerica
Middle Eastand North Africa
EmergingAsia
2018F2017F2016E20152014
–10%
–5%
0%
5%
10%
15%
Source: Swiss Re Economic Research & Consulting.
Life and health insurance in 2016: growth amid regional disparitiesLife and health (L&H) premiums in the emerging markets are estimated to have risen by 20.1% in 2016 after a 13.2% gain in 2015. However, growth rates have varied across regions. In emerging Asia, premium growth accelerated to more than 25% from 17% in 2015, in Latin America the recovery has been uneven, and in CEE there have been scant signs of improvement.
L&H premiums in emerging Asia are estimated to have grown by 27% in 2016. The region will account for around 77% of emerging market life premiums in 2016, up from 73% in 2015 and 63% in 2012. Premiums in China are estimated to have increased by 34% in 2016 (2015: +22%), supported by strong sales of ordinary life products, while unit-linked and participating life policies were negatively hit by stock market volatility. China accounts for over half (57%) of all emerging market life premiums and contributed two-thirds of the emerging regionsʼ total premium growth this year. There has been divergent premium growth elsewhere in emerging Asia, with further improvement in India supported mainly by stronger group business, while in Indonesia an influx of agents boosted sales. On the flipside, falling bancassurance sales of single-premium savings products dragged on overall premium growth in Thailand. And in the Philippines, life premium growth slowed due to insurersʼ increasing focus on bottom-line profitability.
Non-life business slowed in SSA, particularly in commodity exporting countries.
Figure 18 Non-life real premium growth by region, 2014 to 2018F
Life premiums growth in the emerging markets accelerated robustly in 2016.
Emerging Asia remains the biggest contributor to L&H premiums.

Swiss Re Global insurance review 2016 and outlook 2017/18 37
2018F
2017F
2016E
2015
2014
–10%
–5%
0%
5%
10%
15%
20%
25%
30%
Advancedmarkets
Sub-SaharanAfrica
Centraland EasternEurope
LatinAmerica
Middle Eastand North Africa
EmergingAsia
2018F2017F2016E20152014
Source: Swiss Re Economic Research & Consulting.
Premium growth in Latin America eased slightly to 6.9% in 2016 from 8.3% a year ago, reflecting a slowdown in economic activity in key markets. In Brazil, the biggest market, premium growth has fallen sharply to 2.4% from 8% in 2015 due to the economic recession and a weak labour market. In Venezuela, premiums fell by 15% as the economic crisis caused higher lapse and surrender rates. Likewise, strong economic headwinds led to stagnant premium growth in Argentina. In comparison, Chile, Columbia and Peru reported steady premium growth in the range of 7-13%.
CEE has continued to underperform in 2016, with life insurance premiums growth contracting for a fourth year in a row. The decline came despite a strong rebound in Russia, with banks using their branch network to push sales of investment savings products. In Poland and the Czech Republic, life insurance premiums have seen double-digit declines, as the attractiveness of life products was trimmed by the closure of tax loopholes (Poland) and loss of tax deductibility (Czech Republic). Worryingly, in the Czech Republic not only have premiums from savings business declined, sales of life protection policies have fallen also. The same has happened in Hungary. A weak investment environment will likely continue to drag on premium growth in CEE in the near term.
Premiums in MENA are estimated to have grown by 4.2% in 2016, down from 7.5% in 2015 as a result of heightened geopolitical tensions and still-low oil prices. Lingering political uncertainty has dampened premium growth in Turkey while sustained low oil prices are taking a toll on life premium growth in Saudi Arabia. Growth in the UAE has slowed further from high double-digits in 2009 to around 4% in 2016.
In SSA, life premium growth is estimated to have slowed to 1.1% in 2016, mainly due to a further slowdown in South Africa, which accounts for 90% of SSA life premiums. Outside South Africa, premium growth has been more resilient given a base of very low penetration levels. The life sector has continued to grow solidly even in those markets hit by economic crisis (eg, Nigeria). In Kenya, growth strengthened slightly to 3.2%.
Figure 19 L&H real premium growth by region, 2014 to 2018F
Premium growth slowed to 6.9% in Latin America this year.
Premiums declined for the fourth consecutive year in CEE …
… while growth slowed in the MENA.
South Africa dragged on otherwise strong premium growth in SSA.

38 Swiss Re Global insurance review 2016 and outlook 2017/18
Emerging markets: improved growth in non-life, strong performance in life
Insurance outlook for 2017-2018: favourable, but with tangible downside risksTotal insurance premiums in emerging markets are projected to have grown by 13.6% in 2016, and to increase by close to 10% each year in 2017 and 2018. Non-life premium growth is expected to improve gradually, and life premium growth to stabilise and revert to trend. Downside risks remain, including financial market volatility and recent capital outflows from the emerging regions. These could translate into more cautious insurance buying behaviour by both households and corporates. At the same time, soft prices in non-life will likely cap gains. On the other hand, the increasing use of online and mobile technologies is helping to increase insurance penetration, particularly in lower-income emerging markets.
Overall non-life premium growth in emerging markets is expected to be around 6‒7% annually in the coming two years, reflecting stabilising economic conditions in most regions. In addition, non-life insurance will continue to benefit from urbanisation and rising home and car ownership. Concerns about environmental protection, food safety and property underinsurance are also expected to start filtering through into stronger demand for associated liability and natural catastrophe insurance products.
In emerging Asia, non-motor lines are expected to become an increasingly important growth driver given intensified competitive pressures in motor post de-tarrification (eg, in China and Malaysia). Regulatory initiatives including the promotion of natural catastrophe insurance in China, the launch of New Crop Insurance Scheme in India and the acceleration of infrastructure investment in Southeast Asia, will likely support non-life premium growth. In Latin America, non-life premiums are expected to stage a slow but steady recovery, led by the commercial segment in Brazil. Growth could surprise on the upside in Mexico as a 2016 Federal Income Law provides fiscal incentives for health insurance, and also in Columbia driven by specialty premiums generated from a 4G infrastructure development program. Meanwhile, business will likely remain difficult in Venezuela due to the lingering economic weakness. The rebound in CEE should continue into 2017 and 2018, barring any negative surprises from the economic and political arenas. Premium growth in MENA will stabilise at around 5% in coming years, supported by the introduction of more compulsory lines, and large infrastructure and construction projects. However, there remains uncertainties over future oil prices. In SSA, growth is expected to accelerate as the oil-importing countries see solid economic growth and as regulatory regimes improve. In contrast, premium growth in the oil-exporting countries is likely to fall short of previous year averages.
After a strong gain in 2016, life premium growth in the emerging markets is expected to ease back to trend of around 10% over the next two years. China will continue to dominate, with supportive government policies offsetting the effect of slower personal income growth on premium development. The government has set a target to grow total insurance (life and non-life) penetration to 5% by 2020 from around 3% in 2014. Policies including tax rebates and incentives are expected to boost demand. In the rest of emerging Asia, economic headwinds will cap premium growth in life, but at a still-high rate. Slower growth in emerging Asia may also result from insurersʼ increasing focus on protection products, which typically have lower average premiums than savings products.
The outlook remains favourable, but there are downside risks.
Non-life premium growth in the emerging markets is expected to pick up gradually in 2017-2018.
Growth will remain robust in Asia and improve in Latin America.
Emerging market life premium growth is expected to stabilise; China will continue to dominate.

Swiss Re Global insurance review 2016 and outlook 2017/18 39
Improvement in Latin America is anticipated, assuming a bottoming-out in key economies, including Brazil, Argentina and Venezuela. Life premiums in Latin America are forecast to remain steady in 2017 and improve to around 8% in 2018. The drag from Brazil is likely to have eased in the second half of 2016, and this will continue into 2017. Growth in Colombia, Chile and Peru will remain solid. In Mexico, premiums will derive support from the governmentʼs new Federal Income Law which provides fiscal incentives for health, dental and hospital expenses. In CEE, a recovery in premium growth is projected in the coming two years based on the assumption that economic growth in the region will rebound. In many CEE markets, insurers are increasingly focused on the large mortality protection gap for future business opportunities. This could, however, hold back premium growth given that protection products are smaller-ticket revenue earners, compared to savings products. In MENA, low penetration rates and increasing awareness should continue to boost demand, particularly in UAE and Saudi Arabia. In SSA, innovative distribution models, microinsurance and low penetration are set to support a modest recovery in 2017 and 2018, taking also into account weak growth momentum in South Africa. Microinsurance offers are expected to grow solidly across SSA, given the large share of population on very low incomes. In terms of premium volumes, however, this segment will remain relatively small.
Insurance regulations in emerging markets continue to become more closely aligned with international best practices. For instance, many markets are taking steps to implement risk-sensitive and economic-based solvency regulation regimes. However, there are also recent incidences where regulators are imposing tighter restrictions on reinsurance cessions (see below section on Recent Regulatory Developments). More encouragingly, insurance regulators in emerging markets have stepped up efforts to close insurance protection gaps. In China, the China Insurance Regulatory Commission (CIRC) introduced the Residential Earthquake Insurance System and unveiled a long-term care insurance pilot scheme. In Vietnam, the government plans to stipulate compulsory insurance cover for offshore fishing vessels and to introduce a voluntary pension plan. In Mexico, a new Federal Income Law provides fiscal incentives for health insurance, and the limit on tax deduction for contributions to certain long-term savings financial products has been lifted. Last, but not least, governments in the Middle East, including UAE, Saudi Arabia, Qatar and Oman, are enacting laws to establish or expand compulsory health coverage.
At the same time, consumer protection has been an ongoing regulatory theme in the emerging markets. In China, the CIRC issued a slew of regulations governing bancassurance, insurer shareholders and insurance intermediaries. In Malaysia, a customer portal was launched, providing policyholders with easy access and real time information on policy details, and in Vietnam, a new Penal Code has made insurance fraud a criminal act. Meanwhile in Nigeria, corporate governance rules have been enforced and the introduction of a more stringent Risk Based Capital framework is planned. Improving capitalisation is also a key focus in other countries in SSA, with increased minimal capital requirements coming into force in Kenya and in the 15 West African countries of the Conférence Interafricaine des Marchés dʼAssurances (CIMA).
Life premiums are projected to improve slowly in Latin America and SSA, and will return to growth in CEE.
Apart from implementing risk-based solvency regimes, some regulators are introducing measures that should help close existing protection gaps.
Also, consumer protection remains a top item on regulatorsʼ agendas.

40 Swiss Re Global insurance review 2016 and outlook 2017/18
Emerging markets: improved growth in non-life, strong performance in life
Special topics – emerging markets This section reviews four emerging market insurance-sector topical issues: (1) Chinaʼs Belt & Road initiative; (2) consumer preferences on critical illness insurance in China; (3) policy re-orientation in Latin America; and (4) recent regulatory developments.
1. Chinaʼs Belt & Road initiativeThe Chinese economy has expanded rapidly over the last 30 years with annual GDP growth averaging about 10%. However, growth has slowed in more recent years due to weaker demand globally. China remains vulnerable to external shocks given its reliance on investment and net exports, and this has prompted the government to try to rebalance the economy to a more domestic-consumption growth model. The government also wants to further integrate China into the regional and global economy.
An important milestone was the Belt and Road (B&R) proposal initially raised by President Xi Jinping in 2013. The plan includes two components: the Silk Road Economic Belt (the Belt) and a 21st Century Maritime Silk Road (the Road).53 In March 2015, the Visions and Actions on Jointly Building Silk Road Economic Belt and 21st-Century Maritime Silk Road was formally launched. The aim is to improve connectivity across China and with the rest of Eurasia through building a network of infrastructure facilities and expanding existing (and ancient) trade routes.
B&R is a long-term program to deepen collaboration among participating countries, and to drive sustainable growth. It is a very large-scale program that will have huge funding requirements. Support from central and local governments will be needed, but China has also indicated that a mix of traditional and innovative financing channels will be involved. While China-led multilateral financial institutions and policy banks are set to power the overall program, commercial loans, equity financing, insurance capital and a variety of private and social funding sources will also play an important role.
B&R is expected to trigger a new wave of construction activities and trade liberalisation, which in turn will present opportunities for Chinese enterprises and contractors, and also insurers. B&R projects already announced as of July 2016 have a total value of up to USD 1.2 trillion, and the insurance premium potential coming out of those projects is estimated to be USD 7 billion. It is estimated that USD 5.5 billion of those premiums could go to Chinese insurers. And, the B&R construction projects that may be forthcoming in the period August 2016 to 2030 could generate another estimated USD 27 billion in premiums, of which USD 16 billion could be for Chinese insurers. The main beneficiaries of these projects will be engineering, property and marine insurers. In addition, increased trade arising from B&R could yield another USD 1.5 billion in premiums for Chinese insurance firms by 2030, of which an estimated USD 600 million would be trade credit premiums. Thus in total, is it projected that B&R could boost commercial insurance premiums in China by USD 23 billion in the period 2015‒2030.54
Chinese firms taking part in B&R will face a new risk environment in those countries in which they invest. Chinese insurers also need to understand the risk landscape of the markets in which they provide risk management solutions to clients. The key ingredients of insurance solutions for projects in B&R markets – pricing, policy wording, contract commitment and claims services – should follow international best practices while taking into consideration local requirements.
53 The Belt will link China with Europe through Central and Western Asia. The Road will connect China with Southeast Asia, Africa and Europe.
54 See Chinaʼs Belt & Road Initiative, and the impact on commercial insurance, Swiss Re, 2016.
Special topics in this section.
Growth in China has been very strong, but the economy remains vulnerable to external shocks.
B&R is a strategic program to improve Chinaʼs integration with the global economy …
… and could run for many decades.
B&R will likely trigger a wave of construction and trade liberalisation, and also demand for insurance.
Chinese insurers will face a new risk environment in B&R countries.

Swiss Re Global insurance review 2016 and outlook 2017/18 41
2. Consumer preferences with respect to critical illness insurance in ChinaLow investment yields are challenging the attractiveness of traditional life savings products in many markets, and China is no exception. In response, life insurers have stepped up efforts to distribute higher-margin protection products, such as critical illness (CI) insurance products, which are among the best-selling in China. The market is very competitive, and an understanding of consumer preferences is indispensable for insurers to be able to differentiate their offerings. A recent Swiss Re study reveals strong heterogeneity in preferences for CI coverage among Chinese consumers.55
Among those 3000 Chinese consumers surveyed, 26% reported that they own CI insurance. However, ownership was significantly higher among the younger to middle-aged Chinese. Ownership was 40‒45% for those between 30‒50 years old, and only 9% for those aged 60‒80. The incentives to buy CI insurance most often cited were “peace of mind”, “to reduce dependency on family” and “to get the best treatment”. The main reasons why people do not buy are affordability and a perception of lack of value. Lack of confidence in insurers and the belief that government schemes pay in cases of a critical illness also reduces incentive to buy. Even so, 26% of the non-owners said they would be interested in getting more information on CI products.
An investigation of consumersʼ preferences for CI product features revealed that the illnesses covered, the premium level and the insurance brand were the most important considerations. Meanwhile, 11% of respondents stated that “full return of premium if no claim is made during the contract duration” is the most important feature. The way medical underwriting is processed is less critical but surprisingly, on average consumers prefer their health status to be assessed by a physician than via an application form with five questions. Specifically, the likelihood of choosing a product declines by 2.9 ppt if a questionnaire rather than a doctor is used for assessment. This implies the “free” assessment creates value to consumers.
This study also suggests that trust in supplier is important. Large Chinese insurers with well-known brands have a strong competitive advantage. According to the survey, the average Chinese consumer is more likely (by 7.3 ppt) to buy cover from a large Chinese insurer than from a foreign entity, and even more so (by 10.6 ppt) than from a non-insurance brand. However, preferences are very heterogeneous, and there was also a significant segment of consumers who said they would prefer non-insurance brands: a simulation of market share suggests that with same product offerings, non-traditional insurers could achieve a market share between 8 and 11% in China.
55 Critical illness insurance in China: Understanding customer preferences, Swiss Re, 2016.
Life insurers are focusing on selling higher-margin protection products.
Demand for CI insurance is strong, with people finding many reasons to buy it.
Covered diseases, premium levels and brand were found to be the most important product features.
Large Chinese insurers have strong competitive advantage when it comes to consumer preferences.

42 Swiss Re Global insurance review 2016 and outlook 2017/18
Emerging markets: improved growth in non-life, strong performance in life
3. Policy re-orientation in Latin America The political landscape in Latin America has changed dramatically in the past year. Across the region, statist or populist macroeconomic policies are being supplanted by centre-right governments, albeit at varying degrees and speeds. In Brazil, Argentina and Ecuador, the shift has been short and sharp; in Peru and Chile, comparatively smooth. And the transition has taken different forms. In Brazil, by way of impeachment, in Argentina and Peru through elections, and in Ecuador and Chile by force of circumstance. The common thread underlying the trend is economic downturn, which has exposed the enduring structural weakness of commodity dependence and underscored the need for policies to diversify economies and to foster endogenous growth. Anger at economic mismanagement and graft also played an important role.
The policy shifts in Argentina and Brazil have similar starting points and are following a similar path. In both cases fiscal permissiveness and excessive state intervention aggravated economic imbalances and distortions. These were manifested in overvalued exchange rates, double-digit inflation and gaping fiscal deficits. Against this backdrop, Argentine President Mauricio Macri assumed control in December 2015 with pledges to stabilise and liberalise the economy, beginning with a steep but orderly devaluation of the peso and the removal of exchange controls. The administration set a course for gradual fiscal consolidation over the medium term and launched institutional reforms to establish a credible inflation-targeting monetary policy framework. Similarly, in Brazil the administration of Michel Temer took over from Dilma Rousseff in August 2016 with a mandate to restore the "policy tripod" of central bank independence, fiscal discipline, and exchange rate flexibility that had underpinned economic success since 1999. The market response to these developments was overwhelmingly positive; Argentinaʼs return to the international capital market was several times oversubscribed, while Brazilian financial markets rallied on the news of Rousseffʼs impeachment.
In Peru and Chile, the shift was less dramatic but no less significant. In July 2016, the incoming government President Pedro Pablo Kuczynski reaffirmed Peruʼs centre-right policy setting, alleviating concerns that an alternative government would break with an economic model that has delivered high single-digit real GDP growth rates during the past two decades. In Chile, the centre-left government of President Michele Bachelet was forced to scale back controversial labour, social and political reforms amid dwindling investor confidence and pushback from business and Congress. She is likely to steer a more pragmatic course for the remainder of her term (until 2018). Meanwhile in Ecuador, the economic strain of falling oil prices and a strong US dollar in the context of a dollarised economy have forced the administration of Rafael Correa to undertake deep fiscal adjustments and introduce measures to attract foreign investment. The dollarisation regime is popular and therefore unlikely to be abandoned in the run-up to national elections in 2017.
Other countries in the region are either already on an orthodox policy setting (eg, Mexico and Colombia), or are doubling-down on dirigisme. For the former, the challenge is to stay the course. In Colombia for instance, comprehensive tax reform is needed to abide by fiscal responsibility laws and to ensure public debt sustainability, yet political calculations threaten its passage in congress. The notable member of the dirigisme camp is Venezuela. The Maduro administration has resisted reform even as the worsening economic and political crises have exposed the shortcomings of its economic management. Extreme political polarisation makes a policy reversal under the current situation unlikely. It also suggests that a change in direction, if and when it materialises, will be accompanied by significant political instability and will be followed by a long and hard-fought economic transition.
In Latin America, statist or populist macroeconomic policies are increasingly being supplanted by centre-right ones.
Pledges of fiscal consolidation and structural reform have helped Argentina and Brazil to regain investor confidence.
Similar shifts, though less dramatic, are also happening in Peru and Chile.
The other Latin American markets are either already on such a centre-right policy setting, or are doubling-down on dirigisme.

Swiss Re Global insurance review 2016 and outlook 2017/18 43
4. Recent regulatory developmentsInsurance regulators in emerging markets have been focusing on insurance liberalisation. In China, the CIRC expanded the commercial motor liberalisation to 18 additional locations while in India, the Insurance Regulatory Development Authority of India granted business approvals to 23 cross-border reinsurers. Malaysia has implemented a phased price liberalisation of motor and fire tariffs, and Thailand has undertaken a long list of actions: raising the voting shares of foreign shareholders, relaxing foreign shareholding limits in non-life insurers, and making plans to deregulate premiums, products and commissions. In Congo, the authority is expected to open up the insurance sector in 2017.
Prudential regulations in emerging markets continue to evolve towards risk-sensitive and economic-based capital regimes, similar to the European model of Solvency II, which took effect in 2016, though national discretion and differences in interpretation still exist. Meanwhile, Mexico and China implemented risk-based Solvency II-type capital regimes in 2016 while Brazil and South Africa are expected to implement similar regimes in 2017. Other markets like Thailand and Malaysia are looking to review their risk-based capital regime to better align them with economic balance sheets.
Emerging markets are also relaxing the access to their markets. Through higher foreign ownership limits, India and Thailand have made it easier for foreign re/insurers to participate in their local markets. On the other hand, some markets have imposed tighter controls on local retention. In Latin America, Argentina has recently increased restrictions on reinsurance cessions. In Africa, some regulators are restricting access of foreign reinsurers to certain lines of business or limiting cessions. In Asia, Indonesia has required insurers to retain/reinsure more business with domestic reinsurers. India likewise has urged local insurers to refrain from entering into common reinsurance agreements on a global basis with overseas parties.
The rise of nationalistic re/insurance regulations could be due to heightened concerns about capital outflows and deteriorating current account positions. The threat of US interest rate normalisation has resulted in market jitters and sporadic pressure on emerging market exchange rates. In addition, some regulators have taken steps to increase local retention in order to better protect local policyholders. However, these actions will likely reduce market competition and increase reinsurance costs, thus adding to higher insurance prices. Importantly, these barriers will also limit the choice of domestic insurers in risk management.
The next set of regulations to have an important impact on re/insurers will likely relate to digitalisation. Most emerging markets have yet to promulgate regulations governing re/insurersʼ use of digital technologies, including smart analytics, artificial intelligence and blockchain technology. The pace of regulation and existing regulatory gaps vary significantly, also among mature markets. Singapore, for example, has introduced a “sandbox” approach to allow more regulatory flexibility for Fintech companies to innovate new solutions. Indonesia is planning to follow up with similar “sandbox” scheme to encourage the establishment of Fintech. In Malaysia meanwhile, the motor Insurance Pool is stipulating that bus operators must install telematics devices. These are all positive developments, but there have yet to be consistent and facilitating regulations. In some cases, regulators have imposed burdensome cyber security requirements that include relatively short incident and breach notification requirements.
Liberalisation continues in emerging insurance markets.
Solvency regulations are moving towards risk-sensitive and economic-based principles …
… but some emerging markets have tightened controls on local retention requirements.
This will limit competition, increase the cost of reinsurance, and work against the interests of policyholders.
Upcoming regulations on innovation technologies and cyber security will likely have significant implications for insurance markets.

44 Swiss Re Global insurance review 2016 and outlook 2017/18
Emerging markets: improved growth in non-life, strong performance in life
Table 7 A glance back and a look ahead at insurance in emerging regions
Emerging region Performance 2016 Outlook 2017-2018
Emerging Asia Non-life Premium growth in China remained stable, supported by motor, agriculture and liability.
Growth in India accelerated, but profitability could be hit by the December 2015 floods in Chennai.
Premium growth in Southeast Asia was supported by infrastructure projects and stable expansion in the motor business.
Price pressures remain intense due to absence of major losses and de-tariffication (eg. in motor in China and Malaysia).
Fiscal investment in infrastructure and projects related to Chinaʼs B&R initiative will increase demand for non-life commercial insurance.
Life Ordinary life and health products led life insurance premiums to surge by around 30% in China.
Premiums continued to strengthen in India, with new group premiums showing a particularly strong upward momentum.
Premiums also grew strongly in most Southeast Asia markets including Indonesia, Malaysia and Vietnam. But sales of single-premium savings products through banks in Thailand fell.
A high base will affect premium growth in China in 2017. India will see improvement from improving consumer and
business sentiment. Volatility in equity and financial markets will continue to
dampen interest in investment-linked products, alongside increasing insurersʼ focus on protection products.
Latin America Non-life Premiums rose only 0.3% due to weaker economic activity, and underwriting results have trended lower amid flat investment yields.
Economic downturns are dragging on non-life business in Brazil, Argentina and Venezuela.
Premium growth in Mexico, Chile and Peru has remained moderate.
A modest recovery in premiums is expected in 2017, as Argentina, Brazil and Peru are expected to resume growth, while the contraction in Venezuela will likely stabilise.
In Brazil, the commercial segment is expected to lead a recovery, while personal lines will be held back by weakness in consumer sentiment.
Life Life premium growth stable at about 7% in 2016, with variations across markets.
Premiums contracted by an estimated 15% in Venezuela, but expanded in Mexico and Chile.
In Mexico, a new Solvency II-type law has been in place since 1 January 2016, and is expected to boost the demand for reinsurance.
Weakness in Venezuela is likely to persist, while recent policy reforms should help things improve in Argentina and Brazil.
Premiums in Mexico will benefit from fiscal incentives in health-related expenses and tax deductions for contributions to long-term savings products.
Central and Eastern Europe
Non-life Non-life premiums recovered to grow by an estimated 4.6% due to a more robust performance in Russia, Poland and Hungary.
Competition remains strong amid strong downward price pressures.
Growth is projected to remain stable at around 4% in 2017 and 2018. However, uncertainties remain given the challenging economic conditions and unstable geo-political landscape.
For global reinsurers, the introduction of a national reinsurance company in Russia will be a key challenge to contend with.
Life Premiums shrank for the fourth consecutive year in 2016 due to weak performance of Poland and the Czech Republic.
Premium growth rebounded strongly in Russia.
The weakness in the Czech Republic and Hungary is expected to persist in 2017, while Poland could stage a mild recovery.
Premiums in Russia are expected to return to unstainable growth of around 10% from 2017.
Middle East and North Africa
Non-life Growth accelerated further to 9.3% mainly reflecting a strong 23% growth in Turkey.
Growth also remained moderate in Saudi Arabia but was relatively weak other markets.
The introduction of more compulsory lines, large infrastructure and construction projects, and improving regulatory regimes should benefit premium growth.
Life Life premium growth slowed to 4.2% in 2016 from 7.5% in 2015.
The slowdown was mostly due to weaker performance in Saudi Arabia.
Low penetration rates and increasing awareness should continue to boost demand.
Rising incomes will lead to more demand for wealth protection and accumulation products.
Sub-Saharan Africa
Non-life Growth remained weak at 0.5%, mainly dragged by the deceleration in South Africa.
Lower premium rates and economic weakness in resource-intensive countries lowered regional growth.
Divergence of insurance growth between commodity-intensive and non-intensive markets will likely continue.
Improving regulatory frameworks will benefit insurance growth, though there are also concerns about rising protectionism.
Spending on infrastructure projects will support the non-life sector.
Life Premium growth slowed to 1.1% on the back of a weaker economic environment in South Africa
There was mostly solid growth in many other markets as insurance penetration is very low.
Growth is expected to pick up as disposable income and the middle class continue to grow.
Innovative mobile distribution and micro-insurance will continue to support growth.
Source: Swiss Re Economic Research & Consulting.

Published by:
Swiss ReEconomic Research & ConsultingP.O. Box 8022 ZurichSwitzerland
Telephone +41 43 285 2551Fax +41 43 282 0075Email [email protected]
Armonk Office:175 King StreetArmonk, NY 10504
Telephone +1 914 828 8000
Hong Kong Office:18 Harbour Road, WanchaiCentral Plaza, 61st FloorHong Kong, SAR
Telephone + 852 25 82 5644
Authors:Kurt KarlTelephone +41 43 285 3369
Thomas HolzheuTelephone +1 914 828 6502
Clarence WongTelephone +852 2582 5644
Editor:Paul RonkeTelephone +41 43 285 2660
Managing editor:Dr Kurt Karl, Head of Swiss ReEconomic Research & Consulting
The editorial deadline for this study was 14 October 2016.
The internet version may contain slightly updated information.
Graphic design and production:Corporate Real Estate & Logistics / Media Production, Zurich
© 2016Swiss ReAll rights reserved.
The entire content of this study is subject to copyright with all rights reserved. The information may be used for private or internal purposes, provided that any copyright or other proprietary notices are not removed. Electronic reuse of the data published in publication is prohibited. Reproduction in whole or in part or use for any public purpose is permitted only with the prior written approval of Swiss Re Economic Research & Consulting and if the source reference “Global insurance review 2016 and outlook for 2017/18" is indicated. Courtesy copies are appreciated.Although all the information used in this study was taken from reliable sources, Swiss Re does not accept any responsibility for the accuracy or comprehensiveness of the information given or forward looking statements made. The information provided and forward-looking statements made are for informational purposes only and in no way constitute or should be taken to reflect Swiss Reʼs position, in particular in relation to any ongoing or future dispute. In no event shall Swiss Re be liable for any loss or damage arising in connection with the use of this information and readers are cautioned not to place undue reliance on forward-looking statements. Swiss Re undertakes no obligation to publicly revise or update any forward-looking statements, whether as a result of new information, future events or otherwise.
Order no: 271_0916_en

© 2016 Swiss Re. All rights reserved.
Swiss Reinsurance Company Ltd Mythenquai 50/60 P.O. Box 8022 Zurich Switzerland
Telephone +41 43 285 2121 Fax +41 43 285 2999 www.swissre.com