global investment returns yearbook 2015 - credit …...credit suisse global investment returns...
TRANSCRIPT
February 2015
Research InstituteThought leadership from Credit Suisse Research
and the world’s foremost experts
Credit Suisse Global Investment Returns
Yearbook 2015

Contents 3 Introduction
5 Industries: Their rise and fall
17 Responsible investing: Does it pay to be bad?
29 Do equity discount rates mean revert?
35 Country profiles
36 Australia
37 Austria
38 Belgium
39 Canada
40 China
41 Denmark
42 Finland
43 France
44 Germany
45 Ireland
46 Italy
47 Japan
48 Netherlands
49 New Zealand
50 Norway
51 Portugal
52 Russia
53 South Africa
54 Spain
55 Sweden
56 Switzerland
57 United Kingdom
58 United States
59 World
60 World ex-USA
61 Europe
63 References
65 Authors
66 Imprint / Disclaimer
For more information on the findings of the Credit Suisse Global Investment Returns Yearbook 2015, please contact either the authors or:
Michael O’Sullivan, Chief Investment Officer UK & EMEA, Credit Suisse Private Banking & Wealth Management, michael.o’[email protected]
Richard Kersley, Head of Global Securities Products and Themes, Credit Suisse Investment Banking, [email protected]
To contact the authors or to order printed copies of the Yearbook or of the accompanying Sourcebook, see page 66.
CO
VE
RP
HO
TO:
ER
IKO
NA
/ IS
TOC
KP
HO
TO.C
OM
, P
HO
TO:
MA
NÜ
! /
PH
OTO
CA
SE
.CO
M
CREDIT SUISSE GLOBAL INVESTMENT RETURNS YEARBOOK 2015_2

Introduction2015 has begun with a series of apparent contradictions and dramatic rever-sals. In the developed world, both equity and bond markets are at record highs. The price of oil has collapsed and the Swiss franc has jettisoned its link with the euro. Global economic growth is tepid and disinflation has caused many central banks to further cut interest rates or, in the recent case of the European Central Bank, to take extraordinary action in the shape of its quantitative easing program. Against this volatile backdrop, we launch the 2015 Credit Suisse Global Investment Returns Yearbook and hope that the wealth of stock, bond and inflation data in the Yearbook will help to frame market developments in the light of long-term asset price trends.
The 2015 Yearbook contains data spanning 115 years of history across 26 markets and the companion publication, the Credit Suisse Global Investment Returns Sourcebook 2015 extends the scale of this resource further with detailed tables, graphs, listings, sources and references for every country. In the first two chapters of the Yearbook, Elroy Dimson, Paul Marsh and Mike Staunton from the London Business School analyze this rich dataset in order to examine an established and new way of investing.
In the first chapter, they focus on the importance of industry weightings for long-term investors. Today, in the US and UK markets, only the banks and min-ing industries have weightings close to their 1900 levels. Indeed, in 1900, the railway industry made up 50% of the UK market and nearly two thirds of the US market. They examine the returns from new and old industries, as well as the implications for investors of structuring portfolios along industry lines by considering questions such as whether industry diversification is more important than country diversification and whether to overweight the old economy or the new? Interestingly, they find that returns can be higher from investing in old rather than new industries.
The second Yearbook chapter examines responsible investing – a topic we developed in a 2012 Credit Suisse Research Institute report “Investing for Impact.” We believe that this is an important and growing area in the invest-ment management field and this chapter measures several approaches to investing along social, environmental and ethical lines. It also provides evidence that corporate engagement can pay, whether the focus is on environmental and social issues or on corporate governance.
Finally, in Chapter 3, David Holland and Bryant Matthews of the CS HOLT team complement the historic data in the Yearbook with a market-implied approach. They study how the market-implied cost of capital mean reverts over time and the extent to which this is in any way predictable. They note that, at the country level, China and Switzerland currently have the lowest market-implied discount rates, while Russia, Italy and Argentina have the highest.
We are proud to be associated with the work of Elroy Dimson, Paul Marsh, and Mike Staunton, whose book Triumph of the Optimists (Princeton University Press, 2002) has had a major influence on investment analysis. The Yearbook is one of a series of publications from the Credit Suisse Research Institute, which links the internal resources of our extensive research teams with world class external research.
Giles Keating Stefano NatellaHead of Research and Deputy Head of Global Equity Research,Global CIO, Credit Suisse Private Credit Suisse Investment BankingBanking and Wealth Management
CREDIT SUISSE GLOBAL INVESTMENT RETURNS YEARBOOK 2015_3

PH
OTO
: TO
MM
YE
LLIS
/ IS
TOC
KP
HO
TO.C
OM
CREDIT SUISSE GLOBAL INVESTMENT RETURNS YEARBOOK 2015_5
Understanding the factors that drive stock returns has long been the quest of professional investors. Greater knowledge has led to an increase in in-vesting based on factor exposures, sometimes known as smart beta. This has moved far beyond the traditional emphasis on industry and country factors or even on factors such as size, value and momentum. Hsu (2014) reports that one quantita-tive investor is now using an 81-factor model.
Despite factor proliferation, industries remain one of the original and most important factors. They are a key organizing concept. Investment organizations continually review industrial classifi-cations and, where necessary, recommend revi-sions. Companies often seek advantage by “win-dow dressing” their industry affiliation. Investment research is mostly structured along industry lines.
When fund managers build, alter, or report on portfolios, they refer to industry weightings. Each year, there is a wide dispersion of returns across industries, so that getting these weightings right – or wrong – has consequences. Industry member-ship is the most common method for grouping stocks for portfolio risk management, relative valuation and peer-group valuation. And investors wrestle with whether to focus primarily on indus-
tries or countries in asset allocation, when taking active positions, and when seeking to diversify.
In research terms, however, industries are the Cinderella of factor investing. The two most com-prehensive and influential books on factor invest-ing, Antti Ilmanen’s (2011) Expected Returns and Andrew Ang’s (2014) Asset Management, have almost nothing to say about industries. This article contributes toward redressing this imbalance.
The great transformation
In 1900 – the start date of our global returns database – virtually no one had driven a car, made a phone call, used electric lighting, seen a movie or heard recorded music; no one had flown in an aircraft, listened to the radio, watched TV, used a computer, sent an email or used a smartphone. There were no x-rays, body scans, DNA tests or transplants, and no one had taken an antibiotic. Many would die young because of this.
Mankind has enjoyed a wave of transformative innovation dating from the Industrial Revolution, continuing through the golden age of invention of the late 19th century, and extending into today’s information revolution. This has given rise to entire
Industries: Their rise and fall This article focuses on the importance of industry weightings for long-term investors. We show how industries have risen and fallen as technology has advanced. Successive waves of new industries and companies have trans-formed the world, yet they have sometimes proved disappointing invest-ments. We seek to explain how the decline of old industries, together with some investment disappointments from new ones, have somehow generated good overall returns. Finally, we examine some implications for investors. Is industry rotation worthwhile? Should investors pay attention to building portfo-lios that are well diversified across industries? Is industry diversification now more important than country diversification?
Elroy Dimson, Paul Marsh and Mike Staunton, London Business School
CREDIT SUISSE GLOBAL INVESTMENT RETURNS YEARBOOK 2015 _6
new industries – electricity and power generation, automobiles, aerospace, airlines, telecommunica-tions, oil and gas, pharmaceuticals and biotech-nology, computers, information technology, media and entertainment. Meanwhile, makers of horse-drawn carriages and wagons, canal boats, steam locomotives, candles, and matches have seen their industries decline. There have been profound changes in what is produced, how it is made, and in the way in which people live and work.
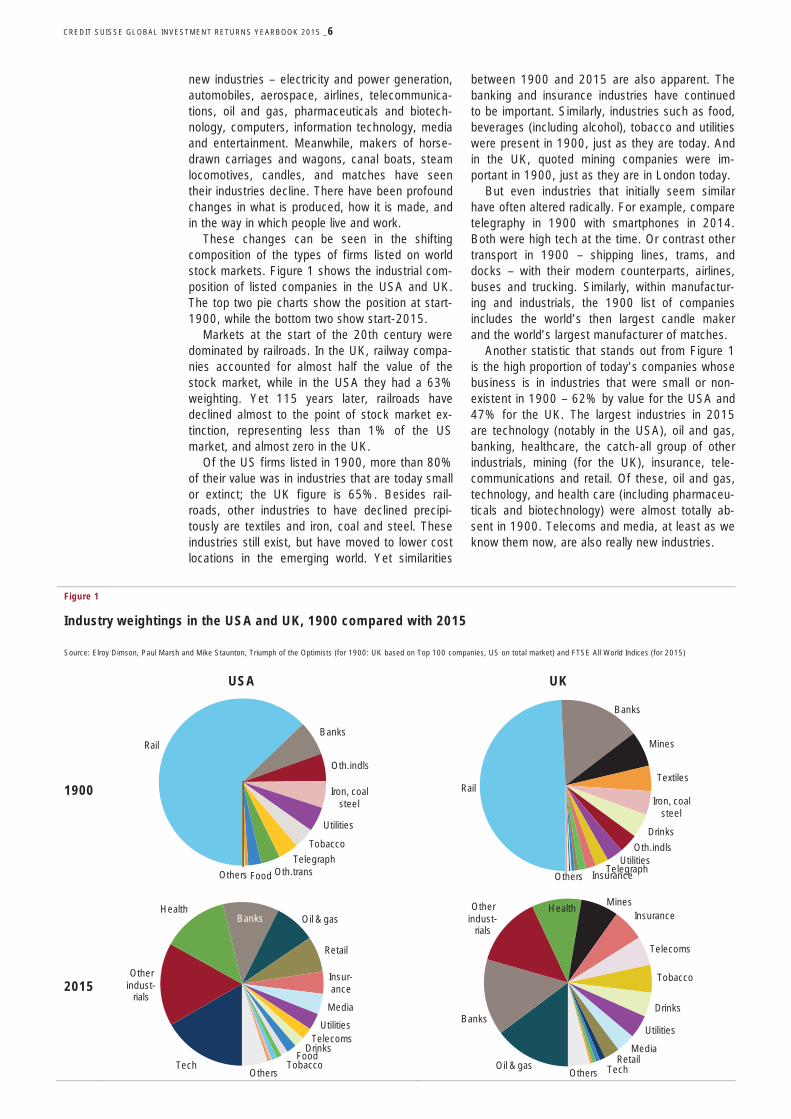
These changes can be seen in the shifting composition of the types of firms listed on world stock markets. Figure 1 shows the industrial com-position of listed companies in the USA and UK. The top two pie charts show the position at start-1900, while the bottom two show start-2015.
Markets at the start of the 20th century were dominated by railroads. In the UK, railway compa-nies accounted for almost half the value of the stock market, while in the USA they had a 63% weighting. Yet 115 years later, railroads have declined almost to the point of stock market ex-tinction, representing less than 1% of the US market, and almost zero in the UK.
Of the US firms listed in 1900, more than 80% of their value was in industries that are today small or extinct; the UK figure is 65%. Besides rail-roads, other industries to have declined precipi-tously are textiles and iron, coal and steel. These industries still exist, but have moved to lower cost locations in the emerging world. Yet similarities
between 1900 and 2015 are also apparent. The banking and insurance industries have continued to be important. Similarly, industries such as food, beverages (including alcohol), tobacco and utilities were present in 1900, just as they are today. And in the UK, quoted mining companies were im-portant in 1900, just as they are in London today.
But even industries that initially seem similar have often altered radically. For example, compare telegraphy in 1900 with smartphones in 2014. Both were high tech at the time. Or contrast other transport in 1900 – shipping lines, trams, and docks – with their modern counterparts, airlines, buses and trucking. Similarly, within manufactur-ing and industrials, the 1900 list of companies includes the world’s then largest candle maker and the world’s largest manufacturer of matches.
Another statistic that stands out from Figure 1 is the high proportion of today’s companies whose business is in industries that were small or non-existent in 1900 – 62% by value for the USA and 47% for the UK. The largest industries in 2015 are technology (notably in the USA), oil and gas, banking, healthcare, the catch-all group of other industrials, mining (for the UK), insurance, tele-communications and retail. Of these, oil and gas, technology, and health care (including pharmaceu-ticals and biotechnology) were almost totally ab-sent in 1900. Telecoms and media, at least as we know them now, are also really new industries.
Figure 1
Industry weightings in the USA and UK, 1900 compared with 2015
Source: Elroy Dimson, Paul Marsh and Mike Staunton, Triumph of the Optimists (for 1900: UK based on Top 100 companies, US on total market) and FTSE All World Indices (for 2015)
USA UK
1900
2015
RailBanks
Oth.indls
Iron, coalsteel
Utilities
Tobacco
TelegraphOth.transFoodOthers
Rail
Banks
Mines
Textiles
Iron, coalsteel
Drinks
Oth.indlsUtilities
TelegraphInsuranceOthers
Tech
Otherindust-
rials
HealthBanks Oil & gas
Retail
Insur-ance
Media
UtilitiesTelecoms
DrinksFood
TobaccoOthers
Oil & gas
Banks
Otherindust-
rials
HealthMines
Insurance
Telecoms
Tobacco
Drinks
Utilities
MediaRetail
TechOthers
CREDIT SUISSE GLOBAL INVESTMENT RETURNS YEARBOOK 2015_7
Our analysis relates purely to the quoted seg-ment. Some industries existed throughout the period, but were not always listed. For example, there were many retailers in 1900, but apart from the major department stores, these were often small local outlets, rather than national retail chains like Walmart or Tesco. Similarly, in 1900, a higher proportion of manufacturing firms were then family owned and not stock-market listed.
In the UK and other countries, nationalization has caused entire industries – railroads, utilities, telecoms, steel, airlines, airports – to be de-listed and often later re-privatized. Our analysis includes the value of, for example, listed railroads, while omitting highways that remain largely in national or state ownership. Despite these caveats, the com-parisons above mostly reflect the industrial evolu-tion that has taken place over the last century, rather than just changes in ownership.
Long-run industry performance
It is instructive to look at long-run industry perfor-mance. For the USA, we use Ken French’s indus-try data (Fama and French, 1997) for 1926–2014. There are 49 industries, 40 of which start in 1926. From 1900 to 1925, we use the 57 Cowles (1938) industries, 20 of which start in 1900. Our focus is on industries not sectors. These terms are often used interchangeably. However, we use “sector” to refer to a large seg-ment of the economy, while an “industry” is a more detailed grouping of businesses. For exam-ple, the banking industry is part of the financial sector. Except where we state otherwise, this article is based on the more detailed industry groups.
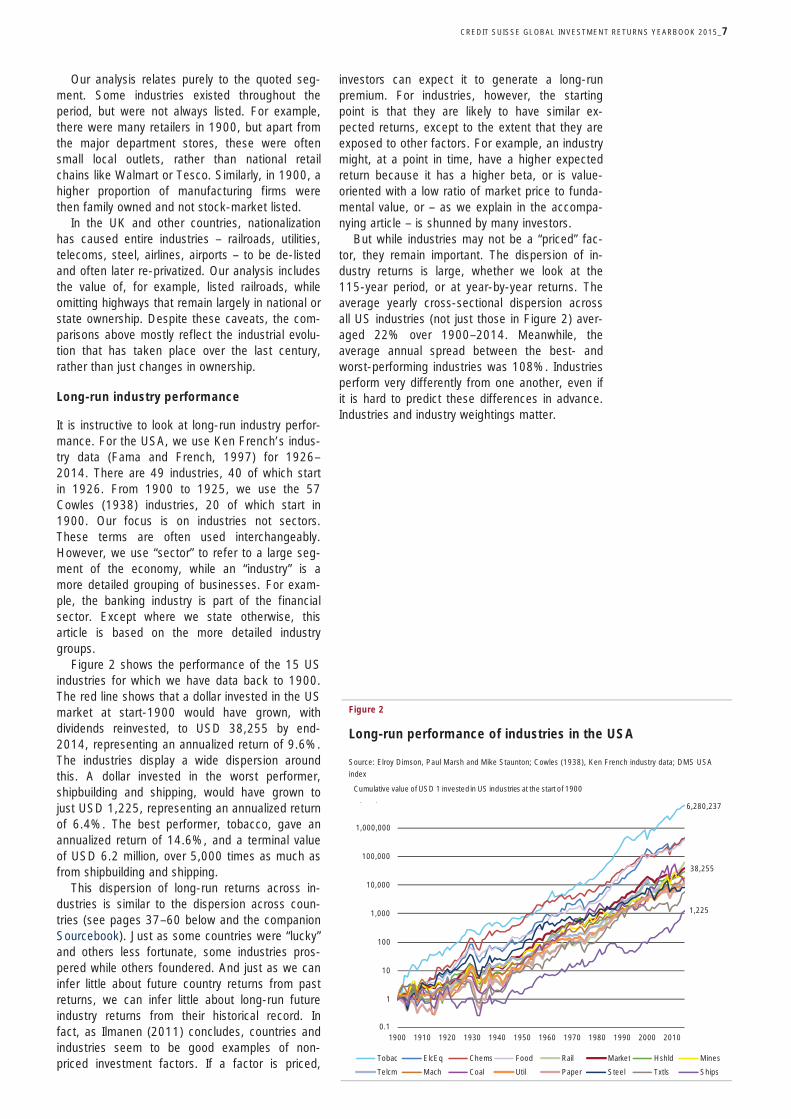
Figure 2 shows the performance of the 15 US industries for which we have data back to 1900. The red line shows that a dollar invested in the US market at start-1900 would have grown, with dividends reinvested, to USD 38,255 by end-2014, representing an annualized return of 9.6%. The industries display a wide dispersion around this. A dollar invested in the worst performer, shipbuilding and shipping, would have grown to just USD 1,225, representing an annualized return of 6.4%. The best performer, tobacco, gave an annualized return of 14.6%, and a terminal value of USD 6.2 million, over 5,000 times as much as from shipbuilding and shipping.
This dispersion of long-run returns across in-dustries is similar to the dispersion across coun-tries (see pages 37–60 below and the companion Sourcebook). Just as some countries were “lucky” and others less fortunate, some industries pros-pered while others foundered. And just as we can infer little about future country returns from past returns, we can infer little about long-run future industry returns from their historical record. In fact, as Ilmanen (2011) concludes, countries and industries seem to be good examples of non-priced investment factors. If a factor is priced,
investors can expect it to generate a long-run premium. For industries, however, the starting point is that they are likely to have similar ex-pected returns, except to the extent that they are exposed to other factors. For example, an industry might, at a point in time, have a higher expected return because it has a higher beta, or is value-oriented with a low ratio of market price to funda-mental value, or – as we explain in the accompa-nying article – is shunned by many investors.
But while industries may not be a “priced” fac-tor, they remain important. The dispersion of in-dustry returns is large, whether we look at the 115-year period, or at year-by-year returns. The average yearly cross-sectional dispersion across all US industries (not just those in Figure 2) aver-aged 22% over 1900–2014. Meanwhile, the average annual spread between the best- and worst-performing industries was 108%. Industries perform very differently from one another, even if it is hard to predict these differences in advance. Industries and industry weightings matter.
Figure 2
Long-run performance of industries in the USA
Source: Elroy Dimson, Paul Marsh and Mike Staunton; Cowles (1938), Ken French industry data; DMS USA
index
6,280,237
38,255
1,225
0
1
10
100
1,000
10,000
100,000
1,000,000
10,000,000
1900 1910 1920 1930 1940 1950 1960 1970 1980 1990 2000 2010
Tobac ElcEq Chems Food Rail Market Hshld Mines
Telcm Mach Coal Util Paper Steel Txtls Ships
Cumulative value of USD 1 invested in US industries at the start of 1900
0.1
CREDIT SUISSE GLOBAL INVESTMENT RETURNS YEARBOOK 2015 _8
Figure 2 suffers from hindsight bias. By focus-ing on a full 115-year history, our sample contains only those industries that existed in 1900 and which survived. With hindsight, we know that many of the survivors declined in importance. Of the 15 industries in Figure 2, ten underperformed the market. Not surprisingly, these included coal, steel, textiles and shipbuilding. Since 1900, these industries declined in developed countries, but grew in importance in developing countries.
Since it excludes industries that emerged after 1900, Figure 2 provides only a partial perspective. But if we were to focus instead on the perfor-mance of industries that are substantial today, we would introduce success bias. Whether we start with industries as they existed in 1900, or with those that are important today, it is hard to avoid the intrusion of hindsight. It is implicit in most analysis of long-run industry performance.
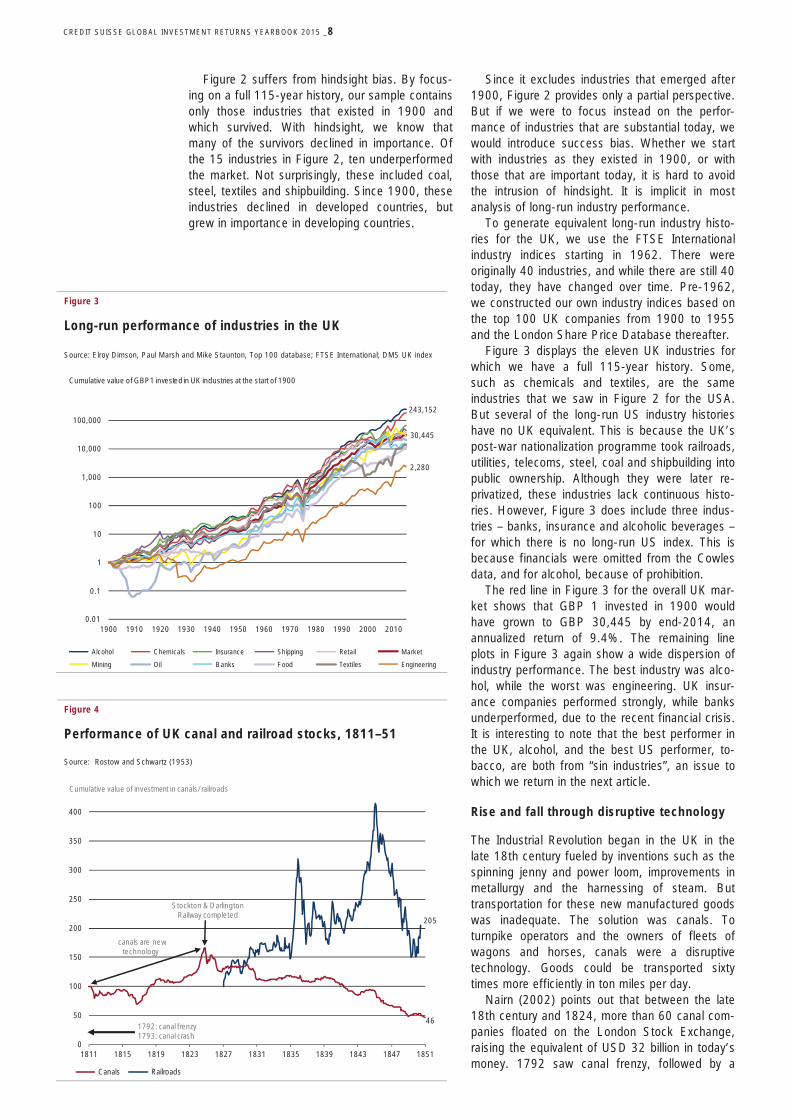
To generate equivalent long-run industry histo-ries for the UK, we use the FTSE International industry indices starting in 1962. There were originally 40 industries, and while there are still 40 today, they have changed over time. Pre-1962, we constructed our own industry indices based on the top 100 UK companies from 1900 to 1955 and the London Share Price Database thereafter.
Figure 3 displays the eleven UK industries for which we have a full 115-year history. Some, such as chemicals and textiles, are the same industries that we saw in Figure 2 for the USA. But several of the long-run US industry histories have no UK equivalent. This is because the UK’s post-war nationalization programme took railroads, utilities, telecoms, steel, coal and shipbuilding into public ownership. Although they were later re-privatized, these industries lack continuous histo-ries. However, Figure 3 does include three indus-tries – banks, insurance and alcoholic beverages – for which there is no long-run US index. This is because financials were omitted from the Cowles data, and for alcohol, because of prohibition.
The red line in Figure 3 for the overall UK mar-ket shows that GBP 1 invested in 1900 would have grown to GBP 30,445 by end-2014, an annualized return of 9.4%. The remaining line plots in Figure 3 again show a wide dispersion of industry performance. The best industry was alco-hol, while the worst was engineering. UK insur-ance companies performed strongly, while banks underperformed, due to the recent financial crisis. It is interesting to note that the best performer in the UK, alcohol, and the best US performer, to-bacco, are both from “sin industries”, an issue to which we return in the next article.
Rise and fall through disruptive technology
The Industrial Revolution began in the UK in the late 18th century fueled by inventions such as the spinning jenny and power loom, improvements in metallurgy and the harnessing of steam. But transportation for these new manufactured goods was inadequate. The solution was canals. To turnpike operators and the owners of fleets of wagons and horses, canals were a disruptive technology. Goods could be transported sixty times more efficiently in ton miles per day.
Nairn (2002) points out that between the late 18th century and 1824, more than 60 canal com-panies floated on the London Stock Exchange, raising the equivalent of USD 32 billion in today’s money. 1792 saw canal frenzy, followed by a
Figure 3
Long-run performance of industries in the UK
Source: Elroy Dimson, Paul Marsh and Mike Staunton, Top 100 database; FTSE International; DMS UK index
Figure 4
Performance of UK canal and railroad stocks, 1811–51
Source: Rostow and Schwartz (1953)
243,152
30,445
2,280
0
0
1
10
100
1,000
10,000
100,000
1,000,000
1900 1910 1920 1930 1940 1950 1960 1970 1980 1990 2000 2010
Alcohol Chemicals Insurance Shipping Retail Market
Mining Oil Banks Food Textiles Engineering
Cumulative value of GBP1 invested in UK industries at the start of 1900
0.1
0.01
46
205
0
50
100
150
200
250
300
350
400
1811 1815 1819 1823 1827 1831 1835 1839 1843 1847 1851
Canals Railroads
Cumulative value of investment in canals/railroads
1792: canal frenzy1793: canal crash
Stockton & Darlington Railway completed
canals are new technology
CREDIT SUISSE GLOBAL INVESTMENT RETURNS YEARBOOK 2015_9
crash the next year. There are no indices to show the magnitude of these events, but Figure 4 shows an index of canal stock prices (the red line plot) from a later period, compiled by Rostow and Schwartz (1953). From 1816 to 1824 canal stock prices rose by 140%.
But in 1825, the Stockton and Darlington Rail-way was completed. Over the next quarter centu-ry, the stock prices of canals fell by over 70%. Although Rostow and Schwartz’s index excludes dividends, it seems likely that, over the 40 years spanned by Figure 4, investors’ total returns were low. Canals, the disruptive technology, had in turn been disrupted by railroads. Once rail freight be-came established, it was some 60 times more efficient than canals in ton miles per day.
Railroad mania took hold in Britain, peaking in 1846, when 272 new lines were approved. The blue line plot in Figure 4 shows the accompanying stock market frenzy. Railroad stock prices more than doubled in 1835, only to fall back again almost to their prior level. They more than doubled again by 1845, then fell two thirds by 1849. Many writers have described this as a bubble, but crucial infrastructure was built and, over the quarter cen-tury spanned by Figure 4, investors earned a reasonable return – an annualized capital gain of 3% plus dividends. However, it was a rocky ride.
In his book, Engines that Move Markets, Alasdair Nairn (2002) analyzes investment in successive new technologies, starting with canals and railroads, continuing through telegraph, elec-tric light, crude oil, automobiles, wireless, radio and TV, computers, PCs, and ending with the internet. He finds that most new technologies were initially greeted with skepticism and derision, and faced a struggle for acceptance. He provides numerous amusing quotations, such as “What could be more palpably absurd than the prospect of locomotives travelling twice as fast as stage-coaches?” (Quarterly Review, 1825).
Once conquered, skepticism tends to be fol-lowed by over-enthusiasm, with new technologies often leading to stock market “bubbles,” which Nairn defines as periods when investors seem to suspend rational valuation, which is typically fol-lowed by a calmer, more rational assessment. The firms that made money from the new technology over an extended period tended to have monopoly protection, effective barriers and a sustainable advantage.
Nairn concludes that stock market investors were not always the biggest beneficiaries of new technology. The latter tended to be the “insiders,” i.e. the innovators, founders and providers of venture funding, along with consumers and socie-ty as a whole. In the 2014 Yearbook, we offer a similar explanation of how emerging-market growth may benefit local people more than stock-market investors.
New industries or old?
New industries can deliver disappointing returns if stock market prices are initially too optimistic about future growth. Declining industries can disappoint if investors fail to realize the speed and extent of their demise. But if this is the historical pattern, how have stock markets generated good long-run returns? Perhaps this has arisen from the “in-between” industries or “the tried and the test-ed” (Siegel (2005)).
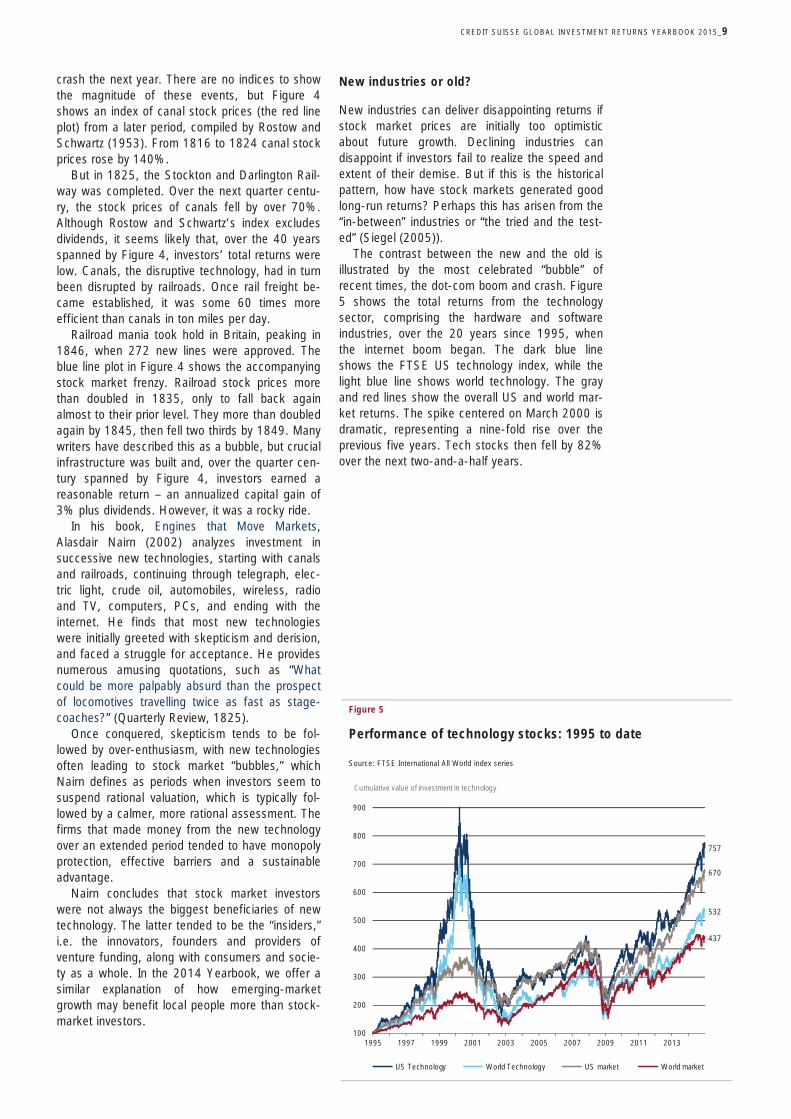
The contrast between the new and the old is illustrated by the most celebrated “bubble” of recent times, the dot-com boom and crash. Figure 5 shows the total returns from the technology sector, comprising the hardware and software industries, over the 20 years since 1995, when the internet boom began. The dark blue line shows the FTSE US technology index, while the light blue line shows world technology. The gray and red lines show the overall US and world mar-ket returns. The spike centered on March 2000 is dramatic, representing a nine-fold rise over the previous five years. Tech stocks then fell by 82% over the next two-and-a-half years.
Figure 5
Performance of technology stocks: 1995 to date
Source: FTSE International All World index series
757
532
670
437
100
200
300
400
500
600
700
800
900
1995 1997 1999 2001 2003 2005 2007 2009 2011 2013
US Technology World Technology US market World market
Cumulative value of investment in technology
CREDIT SUISSE GLOBAL INVESTMENT RETURNS YEARBOOK 2015 _10
But technology has not been a poor investment over this period. An investor in technology stocks over the last 20 years would have beaten the market, with an annualized return of 10.5% ver-sus 9.9% for US stocks as a whole. Holders of the technology sector today would be losing mon-ey only if they had been unlucky enough to have bought between January and September 2000. Despite the bubble, the technology sector has, for most investors, generated good returns.
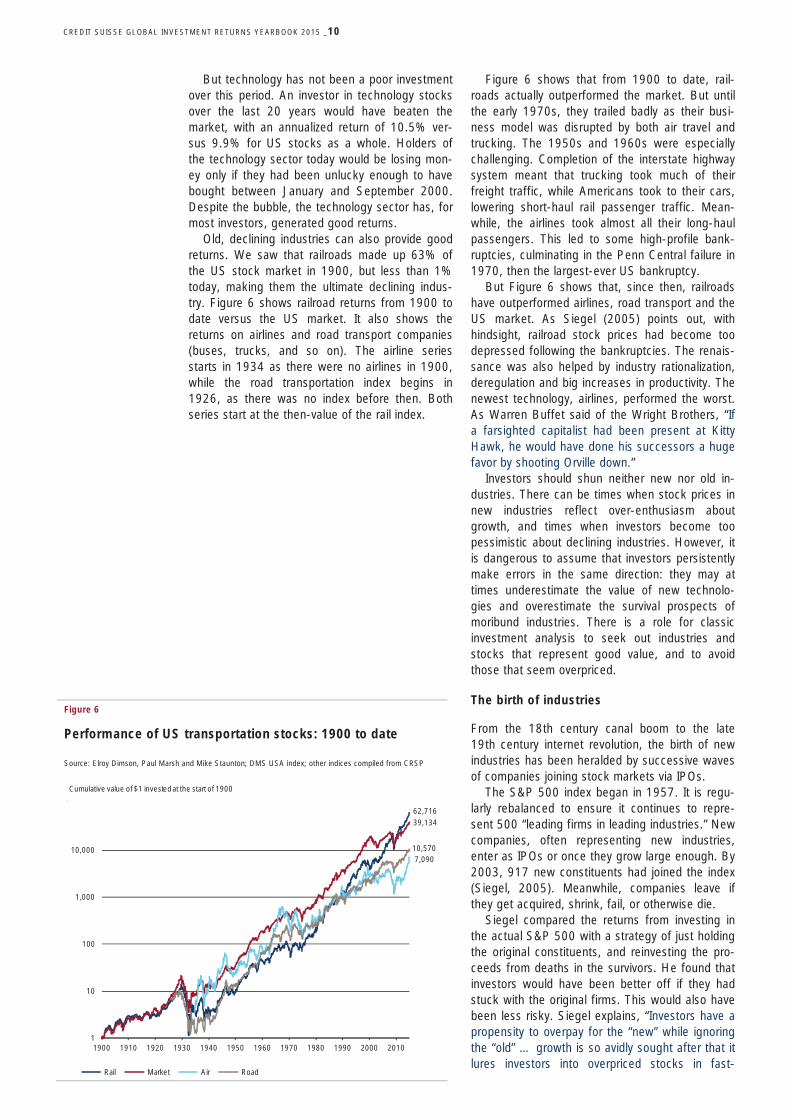
Old, declining industries can also provide good returns. We saw that railroads made up 63% of the US stock market in 1900, but less than 1% today, making them the ultimate declining indus-try. Figure 6 shows railroad returns from 1900 to date versus the US market. It also shows the returns on airlines and road transport companies (buses, trucks, and so on). The airline series starts in 1934 as there were no airlines in 1900, while the road transportation index begins in 1926, as there was no index before then. Both series start at the then-value of the rail index.
Figure 6 shows that from 1900 to date, rail-roads actually outperformed the market. But until the early 1970s, they trailed badly as their busi-ness model was disrupted by both air travel and trucking. The 1950s and 1960s were especially challenging. Completion of the interstate highway system meant that trucking took much of their freight traffic, while Americans took to their cars, lowering short-haul rail passenger traffic. Mean-while, the airlines took almost all their long-haul passengers. This led to some high-profile bank-ruptcies, culminating in the Penn Central failure in 1970, then the largest-ever US bankruptcy.
But Figure 6 shows that, since then, railroads have outperformed airlines, road transport and the US market. As Siegel (2005) points out, with hindsight, railroad stock prices had become too depressed following the bankruptcies. The renais-sance was also helped by industry rationalization, deregulation and big increases in productivity. The newest technology, airlines, performed the worst. As Warren Buffet said of the Wright Brothers, “If a farsighted capitalist had been present at Kitty Hawk, he would have done his successors a huge favor by shooting Orville down.”
Investors should shun neither new nor old in-dustries. There can be times when stock prices in new industries reflect over-enthusiasm about growth, and times when investors become too pessimistic about declining industries. However, it is dangerous to assume that investors persistently make errors in the same direction: they may at times underestimate the value of new technolo-gies and overestimate the survival prospects of moribund industries. There is a role for classic investment analysis to seek out industries and stocks that represent good value, and to avoid those that seem overpriced.
The birth of industries
From the 18th century canal boom to the late 19th century internet revolution, the birth of new industries has been heralded by successive waves of companies joining stock markets via IPOs.
The S&P 500 index began in 1957. It is regu-larly rebalanced to ensure it continues to repre-sent 500 “leading firms in leading industries.” New companies, often representing new industries, enter as IPOs or once they grow large enough. By 2003, 917 new constituents had joined the index (Siegel, 2005). Meanwhile, companies leave if they get acquired, shrink, fail, or otherwise die.
Siegel compared the returns from investing in the actual S&P 500 with a strategy of just holding the original constituents, and reinvesting the pro-ceeds from deaths in the survivors. He found that investors would have been better off if they had stuck with the original firms. This would also have been less risky. Siegel explains, “Investors have a propensity to overpay for the “new” while ignoring the “old” … growth is so avidly sought after that it lures investors into overpriced stocks in fast-
Figure 6
Performance of US transportation stocks: 1900 to date
Source: Elroy Dimson, Paul Marsh and Mike Staunton; DMS USA index; other indices compiled from CRSP
62,71639,134
7,09010,570
1
10
100
1,000
10,000
100,000
1900 1910 1920 1930 1940 1950 1960 1970 1980 1990 2000 2010
Rail Market Air Road
Cumulative value of $1 invested at the start of 1900
CREDIT SUISSE GLOBAL INVESTMENT RETURNS YEARBOOK 2015_11
changing and competitive industries, where the few big winners cannot compensate for the myriad of losers.”
Siegel’s findings are consistent with the large body of evidence on IPOs. Ritter (2014) analyzes 7,793 US IPOs from 1980 to 2012. Investors who bought at the issue price made an average first day return of 17.9%. However, investors then experienced an average market-adjusted loss of 18.6% over the next three years.
The UK findings are similar. Dimson and Marsh (2015) analyze 3,507 IPOs from 2000 to 2014. The market-value weighted average first day re-turn for investors who bought at the issue price was 8.5%. Over the next two years, the average loss, adjusted for market movements, was 9.4%. Gregory, Guermat and Al-Shawawreh (2010) show that post-IPO underperformance lasts even longer. For 2,499 UK IPOs from 1975 to 2004, they find an average underperformance of 31.6% over the five years post-IPO.
Loughran and Ritter (1995) argue that IPOs are systematically overpriced. “For IPOs the prior rapid growth of many of the young companies makes it easy to justify high valuations by inves-tors who want to believe they have identified the next Microsoft.” But why don’t investors learn, and enforce lower IPO prices? After all, the poor long-run performance of IPOs has been well publicized over the last 30 years. Loughran and Ritter sug-gest a behavioral explanation, “investors are bet-ting on longshots … [and] seem to be systemati-cally misestimating the probability of finding a big winner. It is the triumph of hope over experience.”
IPOs are typically growth stocks in growth in-dustries, and their performance thus conforms to the extensive evidence that, over the long run, growth stocks have underperformed both the market and value stocks. This evidence is re-viewed in the accompanying Sourcebook. There is still controversy over whether the value premium arises from behavioral factors, or is a reward for risk. The main behavioral argument is that inves-tors are too much in love with, and overpay for growth. This is the Loughran and Ritter position.
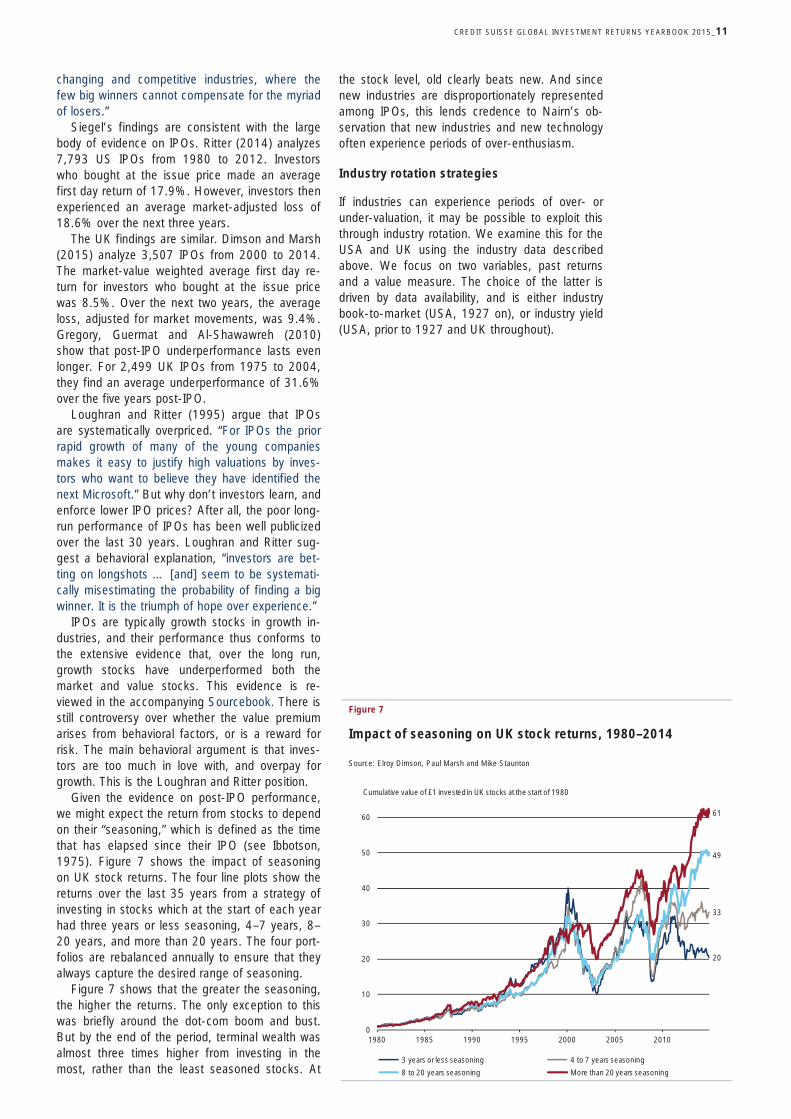
Given the evidence on post-IPO performance, we might expect the return from stocks to depend on their “seasoning,” which is defined as the time that has elapsed since their IPO (see Ibbotson, 1975). Figure 7 shows the impact of seasoning on UK stock returns. The four line plots show the returns over the last 35 years from a strategy of investing in stocks which at the start of each year had three years or less seasoning, 4–7 years, 8–20 years, and more than 20 years. The four port-folios are rebalanced annually to ensure that they always capture the desired range of seasoning.
Figure 7 shows that the greater the seasoning, the higher the returns. The only exception to this was briefly around the dot-com boom and bust. But by the end of the period, terminal wealth was almost three times higher from investing in the most, rather than the least seasoned stocks. At
the stock level, old clearly beats new. And since new industries are disproportionately represented among IPOs, this lends credence to Nairn’s ob-servation that new industries and new technology often experience periods of over-enthusiasm.
Industry rotation strategies
If industries can experience periods of over- or under-valuation, it may be possible to exploit this through industry rotation. We examine this for the USA and UK using the industry data described above. We focus on two variables, past returns and a value measure. The choice of the latter is driven by data availability, and is either industry book-to-market (USA, 1927 on), or industry yield (USA, prior to 1927 and UK throughout).
Figure 7
Impact of seasoning on UK stock returns, 1980–2014
Source: Elroy Dimson, Paul Marsh and Mike Staunton
20
33
49
61
0
10
20
30
40
50
60
1980 1985 1990 1995 2000 2005 2010
3 years or less seasoning 4 to 7 years seasoning
8 to 20 years seasoning More than 20 years seasoning
Cumulative value of £1 invested in UK stocks at the start of 1980
CREDIT SUISSE GLOBAL INVESTMENT RETURNS YEARBOOK 2015 _12
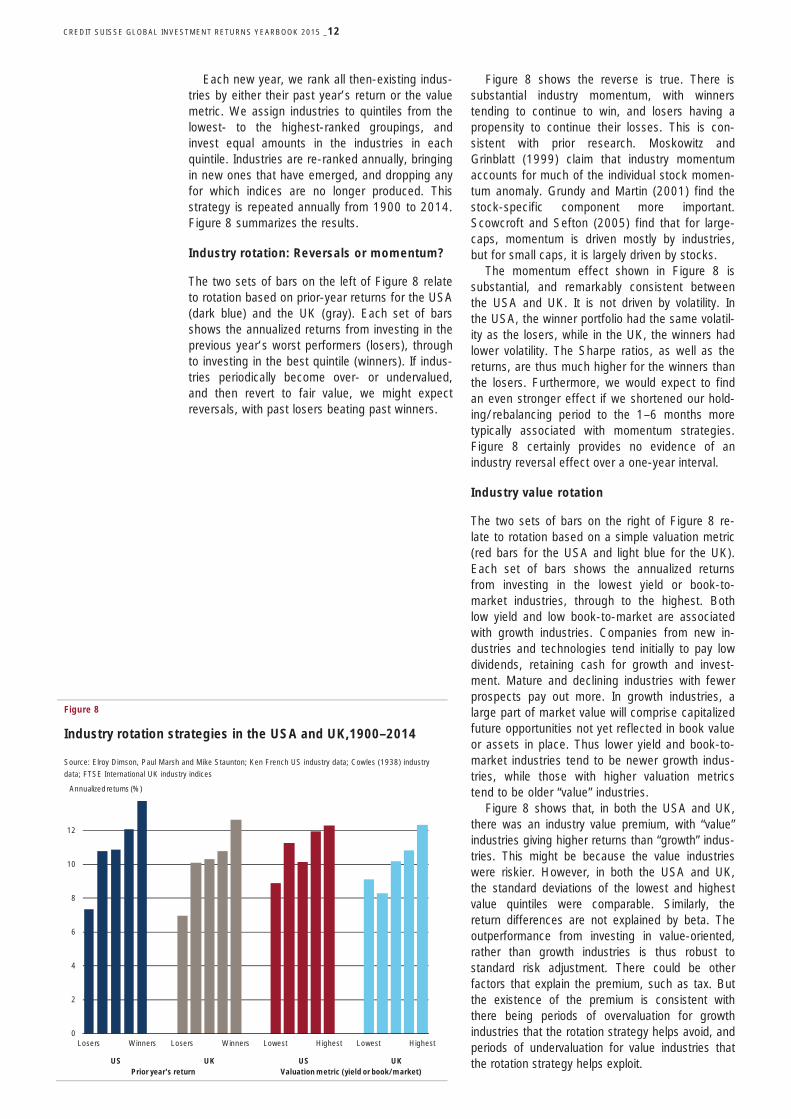
Each new year, we rank all then-existing indus-tries by either their past year’s return or the value metric. We assign industries to quintiles from the lowest- to the highest-ranked groupings, and invest equal amounts in the industries in each quintile. Industries are re-ranked annually, bringing in new ones that have emerged, and dropping any for which indices are no longer produced. This strategy is repeated annually from 1900 to 2014. Figure 8 summarizes the results.
Industry rotation: Reversals or momentum?
The two sets of bars on the left of Figure 8 relate to rotation based on prior-year returns for the USA (dark blue) and the UK (gray). Each set of bars shows the annualized returns from investing in the previous year’s worst performers (losers), through to investing in the best quintile (winners). If indus-tries periodically become over- or undervalued, and then revert to fair value, we might expect reversals, with past losers beating past winners.
Figure 8 shows the reverse is true. There is substantial industry momentum, with winners tending to continue to win, and losers having a propensity to continue their losses. This is con-sistent with prior research. Moskowitz and Grinblatt (1999) claim that industry momentum accounts for much of the individual stock momen-tum anomaly. Grundy and Martin (2001) find the stock-specific component more important. Scowcroft and Sefton (2005) find that for large-caps, momentum is driven mostly by industries, but for small caps, it is largely driven by stocks.
The momentum effect shown in Figure 8 is substantial, and remarkably consistent between the USA and UK. It is not driven by volatility. In the USA, the winner portfolio had the same volatil-ity as the losers, while in the UK, the winners had lower volatility. The Sharpe ratios, as well as the returns, are thus much higher for the winners than the losers. Furthermore, we would expect to find an even stronger effect if we shortened our hold-ing/rebalancing period to the 1–6 months more typically associated with momentum strategies. Figure 8 certainly provides no evidence of an industry reversal effect over a one-year interval.
Industry value rotation
The two sets of bars on the right of Figure 8 re-late to rotation based on a simple valuation metric (red bars for the USA and light blue for the UK). Each set of bars shows the annualized returns from investing in the lowest yield or book-to-market industries, through to the highest. Both low yield and low book-to-market are associated with growth industries. Companies from new in-dustries and technologies tend initially to pay low dividends, retaining cash for growth and invest-ment. Mature and declining industries with fewer prospects pay out more. In growth industries, a large part of market value will comprise capitalized future opportunities not yet reflected in book value or assets in place. Thus lower yield and book-to-market industries tend to be newer growth indus-tries, while those with higher valuation metrics tend to be older “value” industries.
Figure 8 shows that, in both the USA and UK, there was an industry value premium, with “value” industries giving higher returns than “growth” indus-tries. This might be because the value industries were riskier. However, in both the USA and UK, the standard deviations of the lowest and highest value quintiles were comparable. Similarly, the return differences are not explained by beta. The outperformance from investing in value-oriented, rather than growth industries is thus robust to standard risk adjustment. There could be other factors that explain the premium, such as tax. But the existence of the premium is consistent with there being periods of overvaluation for growth industries that the rotation strategy helps avoid, and periods of undervaluation for value industries that the rotation strategy helps exploit.
Figure 8
Industry rotation strategies in the USA and UK,1900–2014
Source: Elroy Dimson, Paul Marsh and Mike Staunton; Ken French US industry data; Cowles (1938) industry
data; FTSE International UK industry indices
0
2
4
6
8
10
12
Losers Winners Losers Winners Lowest Highest Lowest Highest
Annualized returns (%)
US UK US UKPrior year's return Valuation metric (yield or book/market)
CREDIT SUISSE GLOBAL INVESTMENT RETURNS YEARBOOK 2015_13
Industries today
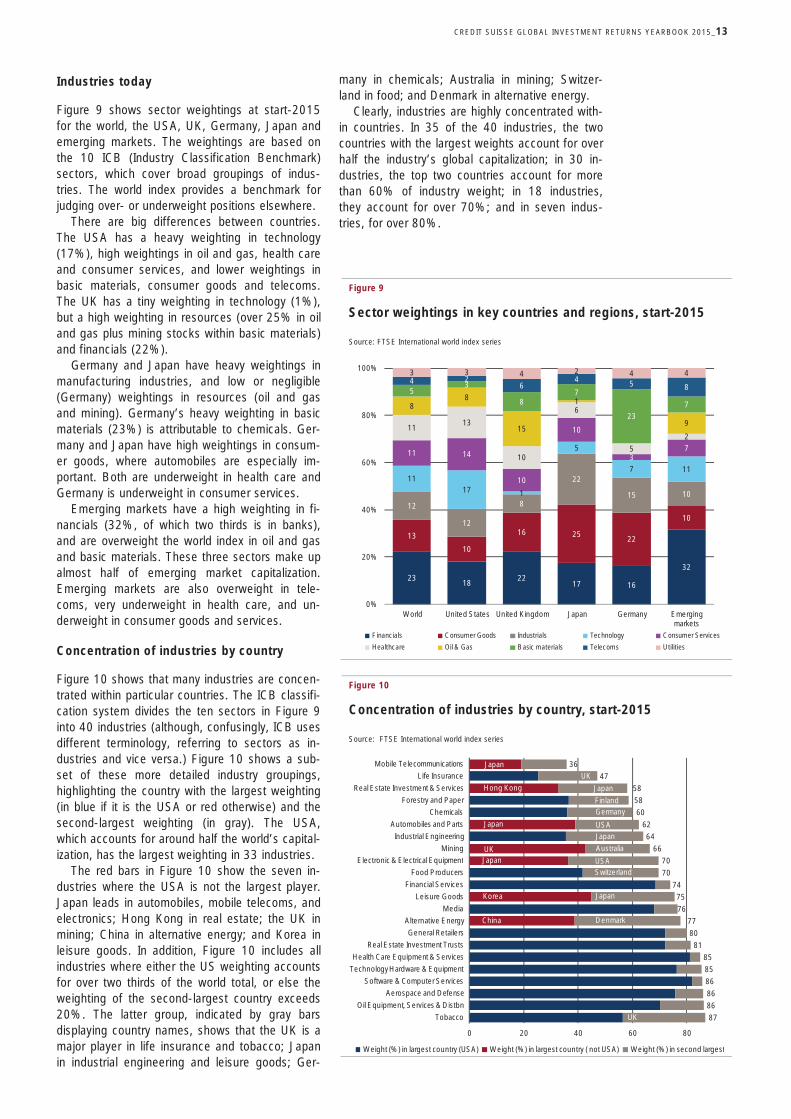
Figure 9 shows sector weightings at start-2015 for the world, the USA, UK, Germany, Japan and emerging markets. The weightings are based on the 10 ICB (Industry Classification Benchmark) sectors, which cover broad groupings of indus-tries. The world index provides a benchmark for judging over- or underweight positions elsewhere.
There are big differences between countries. The USA has a heavy weighting in technology (17%), high weightings in oil and gas, health care and consumer services, and lower weightings in basic materials, consumer goods and telecoms. The UK has a tiny weighting in technology (1%), but a high weighting in resources (over 25% in oil and gas plus mining stocks within basic materials) and financials (22%).
Germany and Japan have heavy weightings in manufacturing industries, and low or negligible (Germany) weightings in resources (oil and gas and mining). Germany’s heavy weighting in basic materials (23%) is attributable to chemicals. Ger-many and Japan have high weightings in consum-er goods, where automobiles are especially im-portant. Both are underweight in health care and Germany is underweight in consumer services.
Emerging markets have a high weighting in fi-nancials (32%, of which two thirds is in banks), and are overweight the world index in oil and gas and basic materials. These three sectors make up almost half of emerging market capitalization. Emerging markets are also overweight in tele-coms, very underweight in health care, and un-derweight in consumer goods and services.
Concentration of industries by country
Figure 10 shows that many industries are concen-trated within particular countries. The ICB classifi-cation system divides the ten sectors in Figure 9 into 40 industries (although, confusingly, ICB uses different terminology, referring to sectors as in-dustries and vice versa.) Figure 10 shows a sub-set of these more detailed industry groupings, highlighting the country with the largest weighting (in blue if it is the USA or red otherwise) and the second-largest weighting (in gray). The USA, which accounts for around half the world’s capital-ization, has the largest weighting in 33 industries.
The red bars in Figure 10 show the seven in-dustries where the USA is not the largest player. Japan leads in automobiles, mobile telecoms, and electronics; Hong Kong in real estate; the UK in mining; China in alternative energy; and Korea in leisure goods. In addition, Figure 10 includes all industries where either the US weighting accounts for over two thirds of the world total, or else the weighting of the second-largest country exceeds 20%. The latter group, indicated by gray bars displaying country names, shows that the UK is a major player in life insurance and tobacco; Japan in industrial engineering and leisure goods; Ger-
many in chemicals; Australia in mining; Switzer-land in food; and Denmark in alternative energy.
Clearly, industries are highly concentrated with-in countries. In 35 of the 40 industries, the two countries with the largest weights account for over half the industry’s global capitalization; in 30 in-dustries, the top two countries account for more than 60% of industry weight; in 18 industries, they account for over 70%; and in seven indus-tries, for over 80%.
Figure 9
Sector weightings in key countries and regions, start-2015
Source: FTSE International world index series
Figure 10
Concentration of industries by country, start-2015
Source: FTSE International world index series
2318
2217 16
32
13
10
16 2522
10
12
12
8
22
15 10
1117 1
5
7 11
11 14
10
10
37
1113
10
6
5
2
88
15
1
9
53
87
237
4 26
4 5 8
3 3 4 2 4 4
0%
20%
40%
60%
80%
100%
World United States United Kingdom Japan Germany Emerging markets
Financials Consumer Goods Industrials Technology Consumer Services
Healthcare Oil & Gas Basic materials Telecoms Utilities
87
86
86
86
85
85
81
80
77
76
75
74
70
70
66
64
62
60
58
58
47
36
0 20 40 60 80
Tobacco
Oil Equipment, Services & Distbn
Aerospace and Defense
Software & Computer Services
Technology Hardware & Equipment
Health Care Equipment & Services
Real Estate Investment Trusts
General Retailers
Alternative Energy
Media
Leisure Goods
Financial Services
Food Producers
Electronic & Electrical Equipment
Mining
Industrial Engineering
Automobiles and Parts
Chemicals
Forestry and Paper
Real Estate Investment & Services
Life Insurance
Mobile Telecommunications
Weight (%) in largest country (USA) Weight (%) in largest country ( not USA) Weight (%) in second largest
Japan
Hong Kong
Japan
Japan
China
Korea
UK
UK
Finland
Japan
Germany
USA
Australia
USASwitzerland
Denmark
Japan
UK
Japan
CREDIT SUISSE GLOBAL INVESTMENT RETURNS YEARBOOK 2015 _14
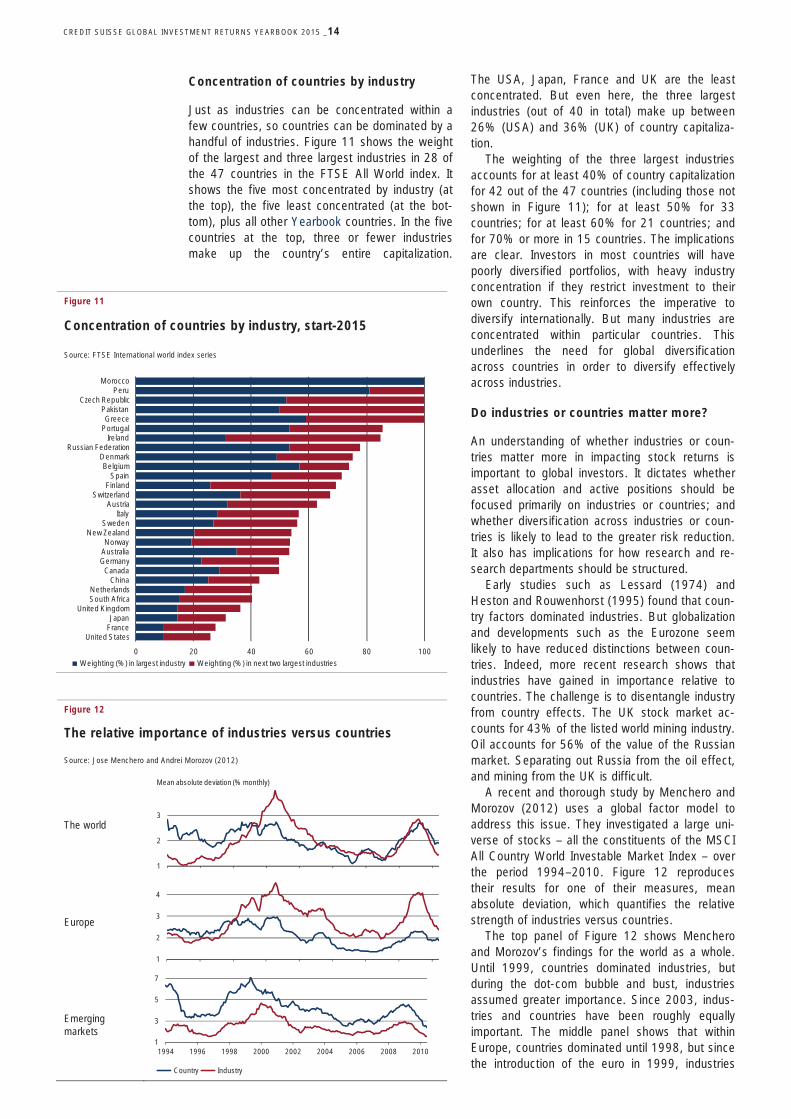
Concentration of countries by industry
Just as industries can be concentrated within a few countries, so countries can be dominated by a handful of industries. Figure 11 shows the weight of the largest and three largest industries in 28 of the 47 countries in the FTSE All World index. It shows the five most concentrated by industry (at the top), the five least concentrated (at the bot-tom), plus all other Yearbook countries. In the five countries at the top, three or fewer industries make up the country’s entire capitalization.
The USA, Japan, France and UK are the least concentrated. But even here, the three largest industries (out of 40 in total) make up between 26% (USA) and 36% (UK) of country capitaliza-tion.
The weighting of the three largest industries accounts for at least 40% of country capitalization for 42 out of the 47 countries (including those not shown in Figure 11); for at least 50% for 33 countries; for at least 60% for 21 countries; and for 70% or more in 15 countries. The implications are clear. Investors in most countries will have poorly diversified portfolios, with heavy industry concentration if they restrict investment to their own country. This reinforces the imperative to diversify internationally. But many industries are concentrated within particular countries. This underlines the need for global diversification across countries in order to diversify effectively across industries.
Do industries or countries matter more?
An understanding of whether industries or coun-tries matter more in impacting stock returns is important to global investors. It dictates whether asset allocation and active positions should be focused primarily on industries or countries; and whether diversification across industries or coun-tries is likely to lead to the greater risk reduction. It also has implications for how research and re-search departments should be structured.
Early studies such as Lessard (1974) and Heston and Rouwenhorst (1995) found that coun-try factors dominated industries. But globalization and developments such as the Eurozone seem likely to have reduced distinctions between coun-tries. Indeed, more recent research shows that industries have gained in importance relative to countries. The challenge is to disentangle industry from country effects. The UK stock market ac-counts for 43% of the listed world mining industry. Oil accounts for 56% of the value of the Russian market. Separating out Russia from the oil effect, and mining from the UK is difficult.
A recent and thorough study by Menchero and Morozov (2012) uses a global factor model to address this issue. They investigated a large uni-verse of stocks – all the constituents of the MSCI All Country World Investable Market Index – over the period 1994–2010. Figure 12 reproduces their results for one of their measures, mean absolute deviation, which quantifies the relative strength of industries versus countries.
The top panel of Figure 12 shows Menchero and Morozov’s findings for the world as a whole. Until 1999, countries dominated industries, but during the dot-com bubble and bust, industries assumed greater importance. Since 2003, indus-tries and countries have been roughly equally important. The middle panel shows that within Europe, countries dominated until 1998, but since the introduction of the euro in 1999, industries
Figure 11
Concentration of countries by industry, start-2015
Source: FTSE International world index series
Figure 12
The relative importance of industries versus countries
Source: Jose Menchero and Andrei Morozov (2012)
The world
Europe
Emerging markets
0 20 40 60 80 100
United StatesFranceJapan
United KingdomSouth AfricaNetherlands
ChinaCanada
GermanyAustraliaNorway
New ZealandSweden
ItalyAustria
SwitzerlandFinland
SpainBelgium
DenmarkRussian Federation
IrelandPortugalGreece
PakistanCzech Republic
PeruMorocco
Weighting (%) in largest industry Weighting (%) in next two largest industries
Japan
UK
1
2
3
Mean absolute deviation (% monthly)
1
2
3
4
1
3
5
7
1994 1996 1998 2000 2002 2004 2006 2008 2010
Country Industry

CREDIT SUISSE GLOBAL INVESTMENT RETURNS YEARBOOK 2015_15
have been more important. The bottom panel shows that for emerging markets, countries have dominated industries throughout, although the difference between them has declined.
Concluding remarks
Industries are a key investment factor. Many countries’ stock markets are highly concentrated within a few industries, while many industries are concentrated within a few countries. To exploit diversification opportunities to the full, investors need to diversify across a wide spread of indus-tries and countries. Both matter, although there is evidence that globalization has led to a decline in the relative importance of countries, with indus-tries assuming greater importance.
Industries have risen and fallen over the years as technology has advanced. It is interesting to see which have done best and worst, but this tells us little about the future. The industrial landscape will change during the 21st century perhaps even more radically than in the past. As Charles Duell, commissioner of the US Patent and Trademark office said in 1902, “In my opinion, all previous advances in the various lines of invention will ap-pear totally insignificant when compared with those which the present century will witness.” Investors must focus on the future.
What we can say with confidence is that there will continue to be a wide variation between the returns on different industries. It will remain hard to predict the likely winners and losers, but indus-tries and their weightings will continue to matter.
Should investors focus on new industries and shun the old? Or should they be contrarian? We have seen that both new and old industries can reward as well as disappoint. It all depends on whether stock prices correctly embed expecta-tions. New industries are typically born on a wave of IPO activity, and we have seen that investors should be especially cautious about the valuations of IPOs and unseasoned stocks.
One way of leaning against any tendency to overvalue the new and undervalue the old is to follow an industry value rotation strategy. This has historically generated a premium. This is con-sistent with there being periods of overvaluation for growth industries which this strategy helps avoid; and periods of undervaluation for value industries which the strategy helps exploit.
But momentum appears to be an even more ef-fective rotation strategy. Buying last years’ best-performing industries while shorting the quintile of worst performers would, since 1900, have gener-ated an annualized winner-minus-loser premium of 6.1% in the USA and 5.3% in the UK. Before costs, US investors would have grown 870 times richer from buying winning industries rather than losers.
If these rotation strategies were to continue working, which industries appear most and least attractive at the start of 2015? In the USA, utili-
ties, insurance, transport and healthcare are fa-vored, while leisure, software, electrical equipment and beverages look least attractive. In the UK, utilities, tobacco, pharmaceuticals and life assur-ance rank highest, while the laggards are technol-ogy hardware, aerospace, industrial engineering and electronic and electrical equipment.
This is just an illustration. It is emphatically not a recommendation. Historically, the rotation strat-egies, even when combined, have failed in around one year in three. In the case of momentum, the failures can be especially painful at market turning points. But for the patient, long-run investor who can weather such episodes, the past success of these strategies may provide food for thought.

PH
OTO
: TA
NU
SH
A /
FO
TOLI
A.C
OM
CREDIT SUISSE GLOBAL INVESTMENT RETURNS YEARBOOK 2015_17
Some investors take a laissez faire approach, in-vesting where returns seem most promising, and ignoring social, environmental and ethical issues. Others take an approach that they regard as more “responsible.” There are three reasons for choosing to be a responsible investor. First, the owners of businesses share in responsibility for the firms’ actions. Second, they can induce them to improve corporate behavior. And third, long-run returns may be enhanced by ensuring that companies have high standards of behavior.
The owners’ responsibility includes events like BP’s rig explosion (Deepwater Horizon), Union Carbide’s gas leak (Bhopal), Lonmin’s labor rela-tions (Marikana), Exxon’s oil spill (Exxon Valdez), Tokyo Electric Power’s meltdown (Fukushima), Massey Energy’s mine explosion (Upper Big Branch), and the Savar Building collapse (Rana Plaza). It also embraces dishonesty and malfea-sance. For example, there are a number of docu-mented cases with such well-known companies as Lockheed (bribery), Siemens (corruption), Enron (false accounting), Walmart (child labor), and Mattel (lead paint).
The laissez faire view is losing ground. The world’s largest asset owners now devote extensive
resources to social and environmental issues and corporate governance, and to engaging with investee companies on these issues.
The extent of engagement is reported to be at an all-time high. The UN-supported Principles for Re-sponsible Investment lists 1,349 signatories with assets of over USD 45 trillion, around half the assets of the global institutional investor market (Shubb, 2014). The Global Sustainable Investment Alliance estimates that worldwide some USD 14 trillion of professionally managed portfolios incorporate envi-ronmental, social and governance concerns into their decisions.
Corporations and their executives also wish to be seen as responsible, with a commitment to delivering broader benefits, not just financial rewards. Under the UN Global Compact, more than 12,000 business organizations in 145 countries have committed to responsible and sustainable corporate practices.
Why be good?
The motivations for taking a responsible approach to investing include complicity, influence and uni-versal ownership. The notion of complicity under-pins the screening processes followed by the
Responsible investing: Does it pay to be bad?Investors are increasingly concerned about social, environmental and ethical issues, and asset managers are under growing pressure to demonstrate re-sponsible investment behavior. This can take the form of “exit” via ethical screening, or “voice” through engagement and intervention. We show in this article that “sin” can pay, not least because those choosing to exit “sinful” stocks can cause them to offer higher returns to those less troubled by ethi-cal considerations. However, the expected financial impact of modest exclu-sions is generally small. We also provide evidence that corporate engage-ment can pay, whether the focus is on environmental and social issues or on corporate governance.
Elroy Dimson, Paul Marsh and Mike Staunton, London Business School
CREDIT SUISSE GLOBAL INVESTMENT RETURNS YEARBOOK 2015 _18
Norwegian Government Pension Fund Global; see Nystuen, Follesdal and Mestad (2011). For the Norwegians, “owning shares or bonds in a com-pany that can be expected to commit gross uneth-ical actions may be regarded as complicity in these actions” (Graver, 2003). Some faith-based investors veto investing in certain companies (e.g. alcohol) on the grounds that such businesses are offensive to their values.
Influence, or “leverage” in the terminology pre-ferred by Richardson (2013), seeks to persuade companies to behave differently. The leverage that asset owners have may enable them to persuade the executives of businesses that they own – or perhaps their regulators, judiciary or other influ-encers – to improve their behavior. The improve-ment may be motivated by social justice and/or the interests of stakeholders.
The third motivation relates to the fact that the very largest asset owners are increasingly “univer-sal owners,” a term proposed by Monks and Mi-now (1995). They are now so large that they essentially own every company in the market. Furthermore, many of them have investment hori-zons that extend into the distant future. Universal owners cannot escape costly, company-specific factors: if one investee company benefits at the expense of creating additional costs for another, there may be no net gain to an asset owner with shares in both. Logically, universal owners should focus on increasing the size of the cake – the aggregate value of all corporations – rather than being too concerned about how the cake is sliced up between companies.
An example of this broader focus is labor prac-tices. Some investee companies may lower pro-duction costs by employing children, or by sourc-ing from companies that employ children, but they are unlikely to pay the costs of poor child health or under-education. The universal owner may recog-nize that child labor in one firm reduces the profit-ability of other firms who do not employ children, and that impaired education may impede broader economic progress. From a long-term perspective, the owner can therefore benefit financially by engaging with companies and regulatory authori-ties. This is the business case, but there is, of course, also an ethical case. Similar arguments may be put forward in relation to corruption, nu-clear proliferation, climate change and other so-cietal issues.
There is a small number of universal owners, if that term is taken literally, such as the Norwegian Government Pension Fund Global, the California Public Employees' Retirement System (CalPERS), the California State Teachers' Retirement System (CalSTRS), New York City Employees’ Retirement System (NYCERS), the Universities Superannua-tion Scheme (USS) and the BT Pension Scheme. There are also many investment managers, nota-bly of globally diversified passive funds, who inter-act with investee companies in the interests of large numbers of investors with more modest wealth.
The universal ownership approach shares some of the methods associated with complicity and influence. However, it is based on the notion that financial rewards can accrue from taking a broad view of responsible corporate behavior; see Dimson, Kreutzer, Lake, Sjo and Starks (2013). While this may be true of the very largest inves-tors, especially sovereign funds, for most institu-tions there is a risk that an investor practicing responsible investment to the greatest possible extent could forego immediate investment returns in violation of fiduciary obligations. The gains from pursuing a universal ownership approach may be too unquantifiable or too costly in immediate fi-nancial terms. Whether this is the case is an em-pirical issue, which we address below.
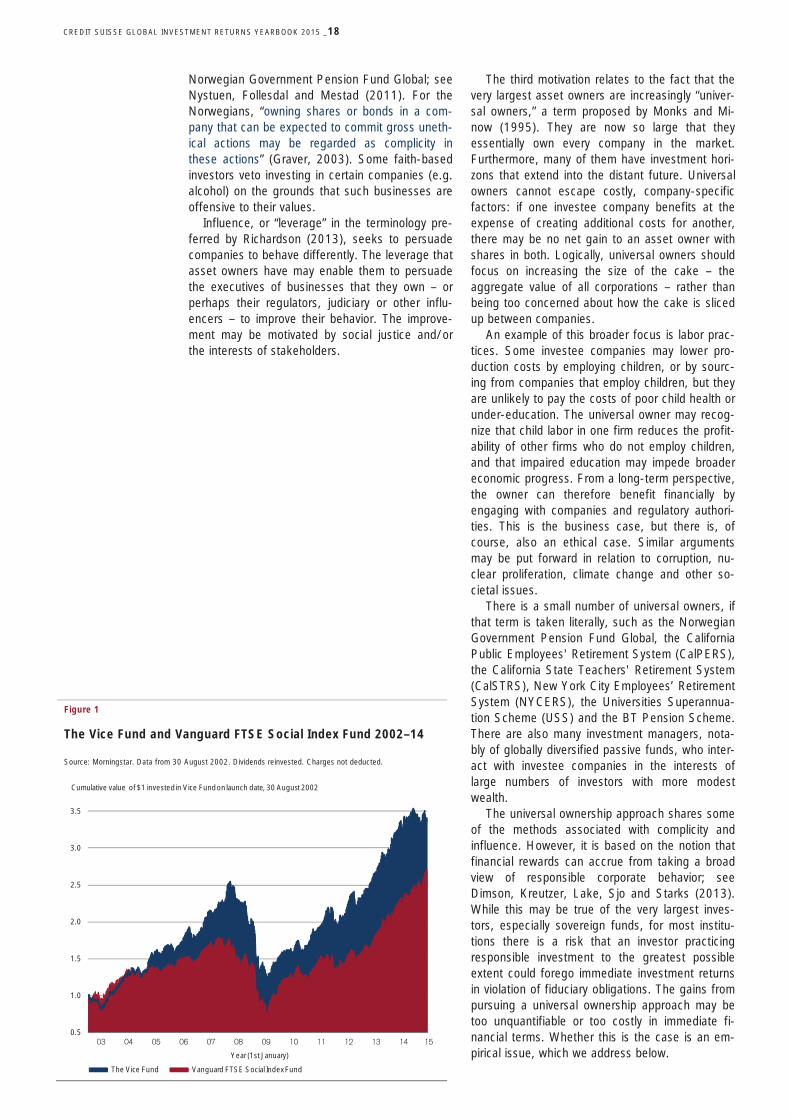
Figure 1
The Vice Fund and Vanguard FTSE Social Index Fund 2002–14
Source: Morningstar. Data from 30 August 2002. Dividends reinvested. Charges not deducted.
0.5
1.0
1.5
2.0
2.5
3.0
3.5
The Vice Fund Vanguard FTSE Social Index Fund
Cumulative value of $1 invested in Vice Fund on launch date, 30 August 2002
Year (1st January)
CREDIT SUISSE GLOBAL INVESTMENT RETURNS YEARBOOK 2015_19
Exit and voice
The political scientist and economist Albert Hirschman describes the two responses open to members of an organization when they perceive that it is demonstrating a decrease in benefit to its members. On the one hand, they can “exit” – that is, they can withdraw from the relationship. On the other hand, they can “voice” – in other words, they can speak out in an attempt to improve the rela-tionship through communication of the complaint, grievance or need for change.
Admati and Pfleiderer (2009) refer to exit as the Wall Street Walk’. It may simply be a screen-ing out or selling decision. But for an active own-er, exit may be a more political action intended to apply pressure on the company or industry in question. If it is a coordinated activity, exit involves concerted disinvestment intended to persuade a business, industry, or nation to change its policy or regime.
Exit and the wages of sin
Figure 1 plots the cumulative returns, including reinvested dividends, on two US mutual funds launched in the early 2000s. The relative winner was the Vice Fund, whose excellent investment performance (USD 10,000 growing from incep-tion to USD 33,655 at start-2015) earned it a top rating from Lipper and Morningstar. On the other hand, the Vanguard FTSE Social Index Fund, which had lower investment growth over the same interval (USD 10,000 growing to USD 26,788), was the relative loser. During this period, the S&P500 had performance midway between these two funds.
The Vice Fund invests in businesses that are considered by many to be socially irresponsible. Recently renamed the Barrier Fund, it has assets of USD 290 million invested in “industries with significant barriers to entry, including tobacco, alcoholic beverage, gaming and de-fense/aerospace industries.” The Social Index Fund tracks an index screened by social, human rights, and environmental criteria. Constituents have superior environmental policies, strong hir-ing/promotion records for minorities and women, and a safe workplace. There are no companies involved in tobacco, alcohol, adult entertainment, firearms, gambling, nuclear power, and unfair labor practices. It has assets under management of USD 1.5 billion, over five times that of the Vice Fund.
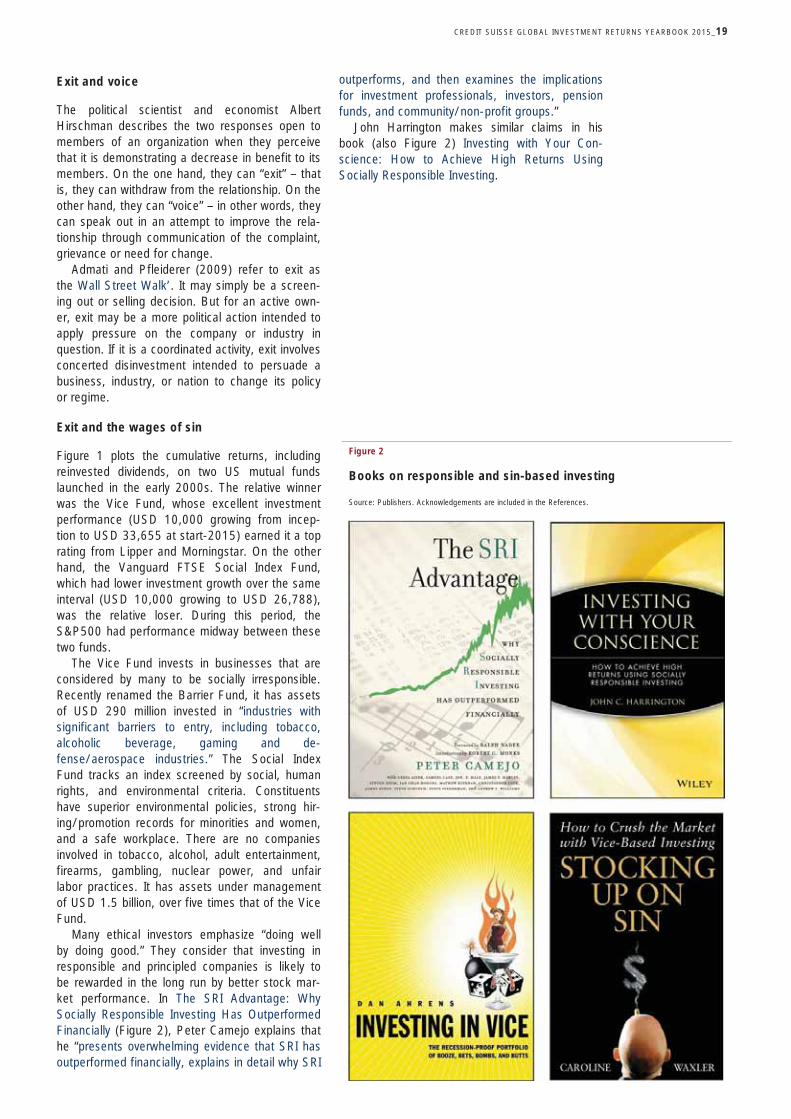
Many ethical investors emphasize “doing well by doing good.” They consider that investing in responsible and principled companies is likely to be rewarded in the long run by better stock mar-ket performance. In The SRI Advantage: Why Socially Responsible Investing Has Outperformed Financially (Figure 2), Peter Camejo explains that he “presents overwhelming evidence that SRI has outperformed financially, explains in detail why SRI
outperforms, and then examines the implications for investment professionals, investors, pension funds, and community/non-profit groups.”
John Harrington makes similar claims in his book (also Figure 2) Investing with Your Con-science: How to Achieve High Returns Using Socially Responsible Investing.
Figure 2
Books on responsible and sin-based investing
Source: Publishers. Acknowledgements are included in the References.
CREDIT SUISSE GLOBAL INVESTMENT RETURNS YEARBOOK 2015 _20
In reality, however, much of the evidence that we review suggests that, as illustrated by the Vice Fund, "sin" pays. Investments in unethical stocks, industries and countries have tended to outper-form. For those for whom principles have a price, it is important to know the likely impact screening may have on both performance and diversification. Also, ironically, responsible investors should rec-ognize that they may be partly responsible for the higher returns from sin.
The standard argument is that irresponsible businesses can be disciplined by the threat of divestment of the firm’s shares. The assumption is that downward pressure on the share price will make the company less valuable, pushing up its cost of capital to the detriment of its ability to raise finance, and possibly raising the likelihood of a takeover bid. Lower stock prices will also punish executives where it hurts – through their pay – according to this point of view.
As Dan Ahrens explains in his book, Investing in Vice: The Recession Proof Portfolio of Booze, Bets, Bombs and Butts (Figure 2), it can be prof-itable to invest in stocks that ethical investors abhor. The rationale for "vice investing" is that these companies have a steady demand for their goods and services regardless of economic condi-tions, they operate globally ("vice" is a worldwide phenomenon), they tend to be high-margin busi-nesses, and they are in industries with high entry barriers. Yet, if a large enough proportion of in-vestors avoids "vice" businesses, their share prices will be depressed. Appealingly to Dan Ahrens, if companies have a lower stock price, they offer a buying opportunity to investors who are relatively untroubled by ethical considerations. Caroline Waxler has a similar interpretation in Stocking Up on Sin: How to Crush the Market with Vice-Based Investing (also Figure 2).
The paradox, then, is that depressed share prices for what some regard as noxious and nasty businesses may demonstrate that responsible and ethical investors are having an impact on the value of a company whose activities conflict with social norms. If so, the shares will ultimately sell at a lower price relative to fundamentals. For example, they may trade at a lower price/earnings or lower price/dividend ratio. Buying them would then offer a superior expected financial return which, for some investors, compensates for the emotional “cost” of exposure to offensive companies.
Exit from companies and industries
A number of companies have been excluded by investors where there is a record of contributing to severe environmental damage, serious violations of societal norms, or systematic human rights abuses. Even for investors who tolerate aerospace and defense, there can be exclusions of busi-nesses involved, sometimes indirectly, in nuclear-arms manufacture, antipersonnel landmines and cluster munitions. Several large funds follow the recommendations of the Norwegian Council on Ethics.
It can be hard to find universally shared evalua-tions. Despite high ratings from Kinder, Lyden-berg, Domini & Co (KLD), Walmart was divested by Norway’s sovereign fund because of its unac-ceptable labor practices. Despite its credentials as a purveyor of Fair Trade coffee, Starbucks has become a boycott target because of its UK tax avoidance practices. Despite its inclusion in the Dow Jones Sustainability World Index and FTSE4Good Index, Medtronic has been excoriated in the USA for its tax-inversion scheme. Amazon, a company praised for environmental initiatives, is accused in Europe and the USA of anticompetitive tax arrangements. The sin of theft has now been extended to being perceived to be robbing the state of the tax that societies believe companies ought to pay.
For a long-term perspective, we can gain a
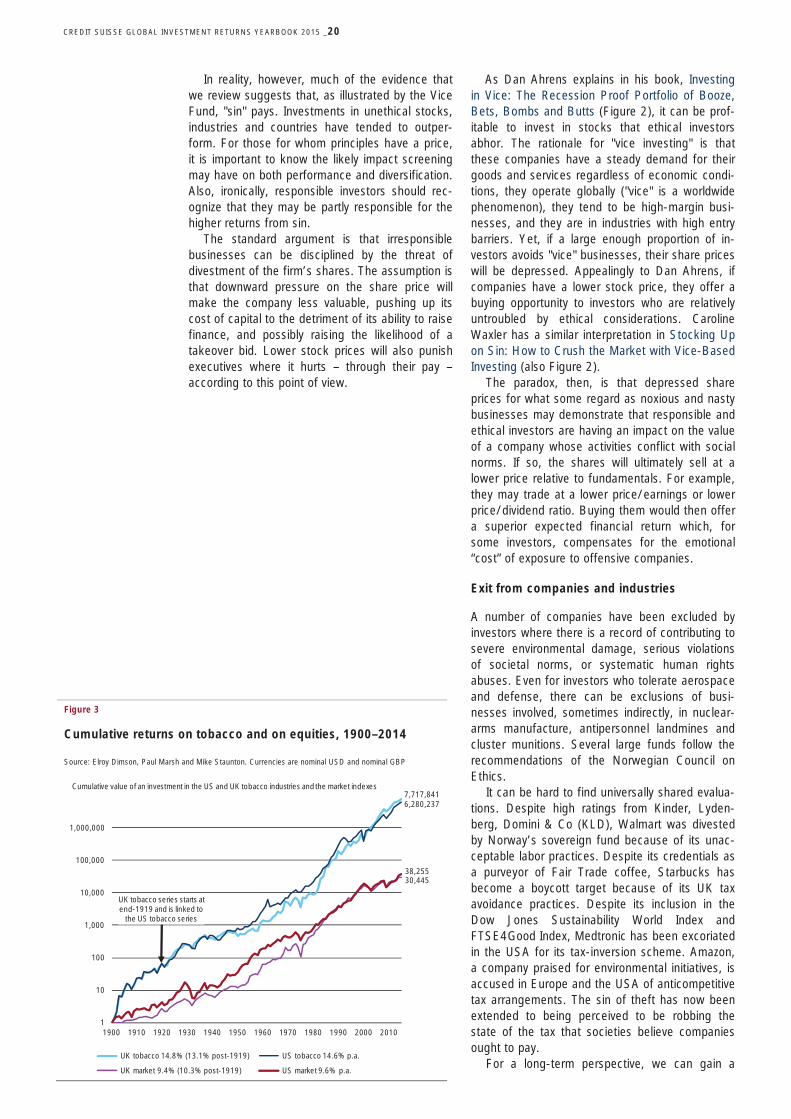
Figure 3
Cumulative returns on tobacco and on equities, 1900–2014
Source: Elroy Dimson, Paul Marsh and Mike Staunton. Currencies are nominal USD and nominal GBP
7,717,8416,280,237
30,44538,255
1
10
100
1,000
10,000
100,000
1,000,000
10,000,000
1900 1910 1920 1930 1940 1950 1960 1970 1980 1990 2000 2010
UK tobacco 14.8% (13.1% post-1919) US tobacco 14.6% p.a.
UK market 9.4% (10.3% post-1919) US market 9.6% p.a.
Cumulative value of an investment in the US and UK tobacco industries and the market indexes
UK tobacco series starts at end-1919 and is linked to
the US tobacco series

CREDIT SUISSE GLOBAL INVESTMENT RETURNS YEARBOOK 2015_21
deeper insight by looking at the impact of elimi-nating businesses that violate established norms. In their paper, The Price of Sin, Harrison Hong and Marcin Kacperczyk examine "sin stocks" traded in the USA over the period 1926–2006; they also look at the European experience over the period 1985–2006. They define sin stocks as companies that are involved in the “triumvirate of sin” (alcohol, tobacco and gambling) and, in some additional tests, weaponry. The authors show that institutional investors tend to avoid sin stocks, which typically sell at a lower price in relation to fundamentals. They report larger expected returns for these shares.
Tobacco companies are particularly informative. For the first half of the 20th century, tobacco was not widely regarded as harmful. But by the mid-1950s, there was a confluence of four diverse strands of evidence – epidemiology, animal exper-iments, cellular pathology and carcinogens in tobacco smoke – and the causal association be-tween smoking, particularly cigarette smoking, and lung cancer was established. By then, at least some investors were shunning the tobacco busi-ness.
Hong and Kacperczyk date the transition of to-bacco companies from neutral to “sinful” status as occurring in the USA during 1947–1965. Over this interval, they observe an underperformance of 3% per year. After 1965, when the health impact of tobacco became well known, US tobacco com-panies outperformed comparable firms by more than +3% per year over the period 1965–2006. Moreover, even though US tobacco companies faced a barrage of litigation during this period, they outperformed their international peers.
We use our own industry indices – taken from the accompanying article – to estimate the outper-formance of tobacco stocks over a complete 115-year period. As Figure 3 shows, tobacco compa-nies beat the overall equity market by an annual-ized 4.5% in the US and by 2.6% in the UK (over the slightly shorter 85-year period of 1920–2014). Over the entire 81 years of the Hong-Kacperczyk study, US sin stocks provided an annualized excess return, relative to non-sin stocks of 3%–4% per year. During 1985–2006, international sin stocks outperformed by around 2½% per year.
In another study entitled Sin Stock Returns, Fabozzi, Ma and Oliphant examine a larger num-ber of sin stocks, drawn from multiple markets from 1970–2007. The authors used a carefully enunciated definition of sinful activity, and includ-ed only the 267 stocks that were deemed suffi-ciently liquid to be investible. Figure 4 sets out their findings. Each stock has a unique start- and end-date in the sample, so the authors compute the excess return for each stock relative to the return on the capitalization-weighted index for the market over the interval for which it trades. They find a high level of performance from investing internationally in sin stocks. Averaged within sin
categories, the mean excess return varies from a low of 5.3% (alcohol), through 9.6% (biotech), 10.0% (adult services), 14.7% (tobacco) and 24.6% (weapons), to a high of 26.4% (gaming).
Their average performance varies by country, but is systematically high. In only two cases is the excess return negative (Taiwan –2%; Portugal –1%). The excess return is statistically significant in all but three markets. Both papers find that their measures of performance are barely impacted by the choice of performance measurement criterion.
Apart from the capacity limits of equal-weighted strategies, there are other impediments to profiting from sin stocks. First, there are not many “pure play” sin stocks: out of thousands in the US investment universe, Hong and Kacper-czyk identify only 193 examples in the 81 years they study, only 56 of them alive by 2006. Sec-ond, a sin-stock portfolio is undiversified. Third, vice investing is unconventional (no competitors have emerged for the Vice Fund). Fourth, there are no examples of a sin-stock Exchange Traded Fund (FocusShares launched one based on the ISE’s SINdex, but it failed to attract investors). We have discussed exit from individual companies and industries. In addition, there can be an even broader approach to exit. We consider next the idea of boycotting an entire market.
Figure 4
Annual returns on sin stocks in 21 countries, 1970–2007
Source: Fabozzi, Ma and Oliphant (2008). For Taiwan and Portugal the excess return was negative
27
27
27
23
21
21
21
20
19
19
17
14
13
13
13
13
10
10
10
8
7
United States
Sweden
Singapore
Italy
Switzerland
Australia
Korea
Norway
Canada
France
Finland
Netherlands
Hong Kong
United Kingdom
Spain
Denmark
Portugal
Belgium
Japan
Germany
Taiwan
Market return Excess return relative to the market xx.x Total return
CREDIT SUISSE GLOBAL INVESTMENT RETURNS YEARBOOK 2015 _22
Exit from countries
Various countries have at some time, recently or decades ago, been subject to divestment pres-sures and investment boycotts. They include Bur-ma/Myanmar (EU sanctions), Cuba (Helms-Burton Act), Iran (Sanctions Enabling Act), Israel (BDS movement), Russian Federation (EU sanc-tions) and South Africa (Anti-Apartheid Move-ment). There are about 150 countries with stock exchanges, but about half of them are omitted by all the major index providers. Most global indices omit frontier markets, but some investors may also select benchmarks that omit secondary emerging markets or even primary emerging markets, while some investors simply decide for themselves which markets are acceptable. Our point is this: for almost all investors, individual national markets are screened out of their portfolios.
We examine the impact of screening out coun-tries based on their degree of corruption. Coun-tries are evaluated using the Worldwide Govern-ance Indicators compiled by Kaufmann, Kraay and Mastruzzi (2010) and supported by the World Bank. The indicators comprise annual scores on six broad dimensions of governance in 215 coun-tries from 1996 to date. While we have singled out the corruption indicator, it is highly correlated with the five other measures. The main score is a percentile ranking across all nations that runs from zero to 100.
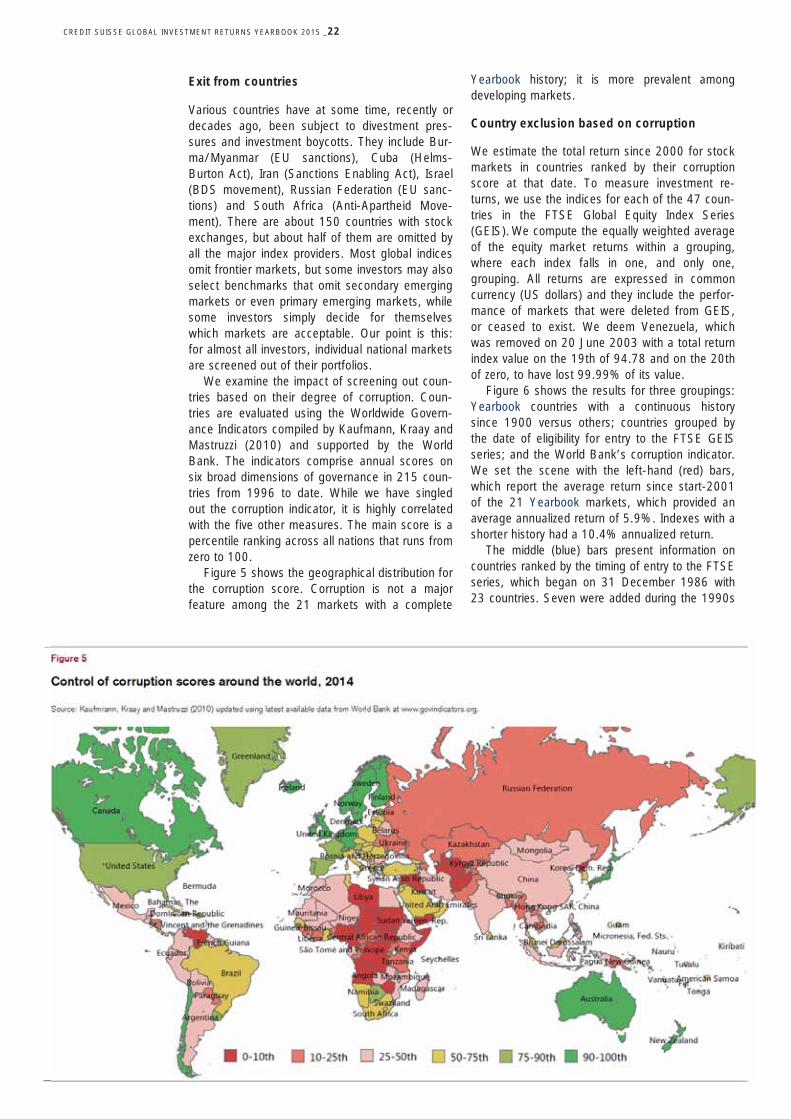
Figure 5 shows the geographical distribution for the corruption score. Corruption is not a major feature among the 21 markets with a complete
Yearbook history; it is more prevalent among developing markets.
Country exclusion based on corruption
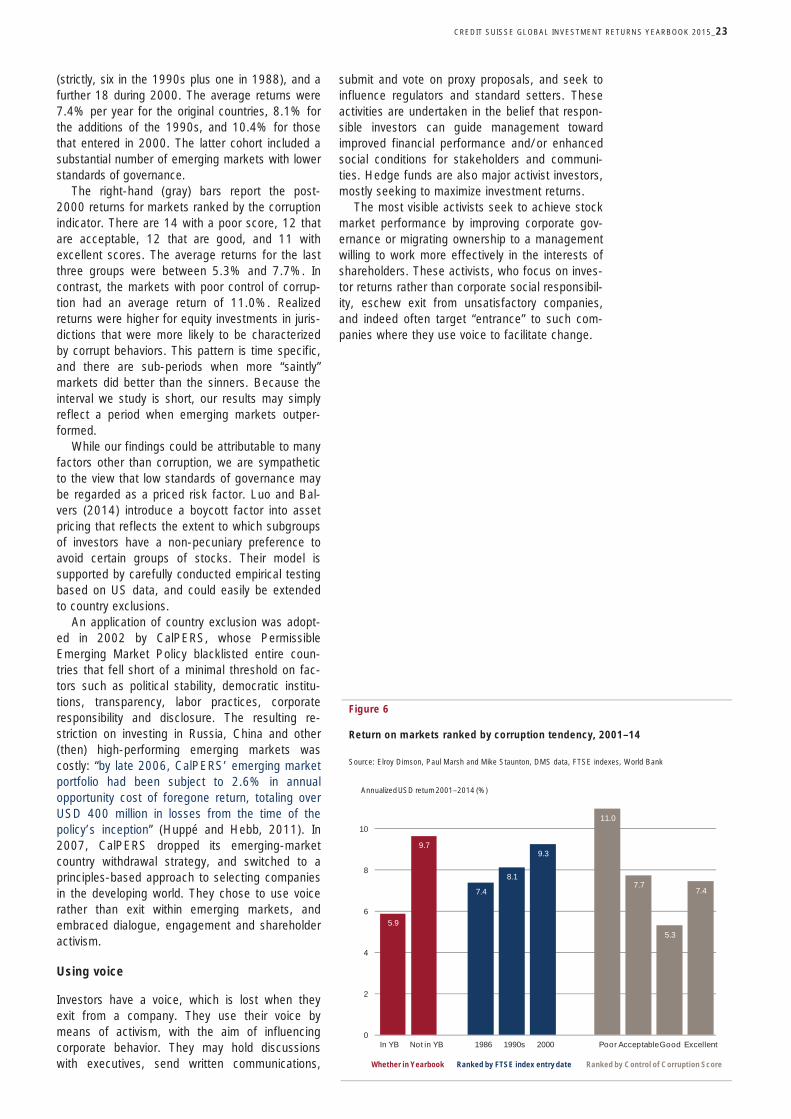
We estimate the total return since 2000 for stock markets in countries ranked by their corruption score at that date. To measure investment re-turns, we use the indices for each of the 47 coun-tries in the FTSE Global Equity Index Series (GEIS). We compute the equally weighted average of the equity market returns within a grouping, where each index falls in one, and only one, grouping. All returns are expressed in common currency (US dollars) and they include the perfor-mance of markets that were deleted from GEIS, or ceased to exist. We deem Venezuela, which was removed on 20 June 2003 with a total return index value on the 19th of 94.78 and on the 20th of zero, to have lost 99.99% of its value.
Figure 6 shows the results for three groupings: Yearbook countries with a continuous history since 1900 versus others; countries grouped by the date of eligibility for entry to the FTSE GEIS series; and the World Bank’s corruption indicator. We set the scene with the left-hand (red) bars, which report the average return since start-2001 of the 21 Yearbook markets, which provided an average annualized return of 5.9%. Indexes with a shorter history had a 10.4% annualized return.
The middle (blue) bars present information on countries ranked by the timing of entry to the FTSE series, which began on 31 December 1986 with 23 countries. Seven were added during the 1990s
Figure 5
Control of corruption scores around the world, 2014
Source: Kaufmrann, Kraay and Mastruzzi (2010) updated using latest available data from World Bank at www.govindicators.org.
CREDIT SUISSE GLOBAL INVESTMENT RETURNS YEARBOOK 2015_23
(strictly, six in the 1990s plus one in 1988), and a further 18 during 2000. The average returns were 7.4% per year for the original countries, 8.1% for the additions of the 1990s, and 10.4% for those that entered in 2000. The latter cohort included a substantial number of emerging markets with lower standards of governance.
The right-hand (gray) bars report the post-2000 returns for markets ranked by the corruption indicator. There are 14 with a poor score, 12 that are acceptable, 12 that are good, and 11 with excellent scores. The average returns for the last three groups were between 5.3% and 7.7%. In contrast, the markets with poor control of corrup-tion had an average return of 11.0%. Realized returns were higher for equity investments in juris-dictions that were more likely to be characterized by corrupt behaviors. This pattern is time specific, and there are sub-periods when more “saintly” markets did better than the sinners. Because the interval we study is short, our results may simply reflect a period when emerging markets outper-formed.
While our findings could be attributable to many factors other than corruption, we are sympathetic to the view that low standards of governance may be regarded as a priced risk factor. Luo and Bal-vers (2014) introduce a boycott factor into asset pricing that reflects the extent to which subgroups of investors have a non-pecuniary preference to avoid certain groups of stocks. Their model is supported by carefully conducted empirical testing based on US data, and could easily be extended to country exclusions.
An application of country exclusion was adopt-ed in 2002 by CalPERS, whose Permissible Emerging Market Policy blacklisted entire coun-tries that fell short of a minimal threshold on fac-tors such as political stability, democratic institu-tions, transparency, labor practices, corporate responsibility and disclosure. The resulting re-striction on investing in Russia, China and other (then) high-performing emerging markets was costly: “by late 2006, CalPERS’ emerging market portfolio had been subject to 2.6% in annual opportunity cost of foregone return, totaling over USD 400 million in losses from the time of the policy’s inception” (Huppé and Hebb, 2011). In 2007, CalPERS dropped its emerging-market country withdrawal strategy, and switched to a principles-based approach to selecting companies in the developing world. They chose to use voice rather than exit within emerging markets, and embraced dialogue, engagement and shareholder activism.
Using voice
Investors have a voice, which is lost when they exit from a company. They use their voice by means of activism, with the aim of influencing corporate behavior. They may hold discussions with executives, send written communications,
submit and vote on proxy proposals, and seek to influence regulators and standard setters. These activities are undertaken in the belief that respon-sible investors can guide management toward improved financial performance and/or enhanced social conditions for stakeholders and communi-ties. Hedge funds are also major activist investors, mostly seeking to maximize investment returns.
The most visible activists seek to achieve stock market performance by improving corporate gov-ernance or migrating ownership to a management willing to work more effectively in the interests of shareholders. These activists, who focus on inves-tor returns rather than corporate social responsibil-ity, eschew exit from unsatisfactory companies, and indeed often target “entrance” to such com-panies where they use voice to facilitate change.
Figure 6
Return on markets ranked by corruption tendency, 2001–14
Source: Elroy Dimson, Paul Marsh and Mike Staunton, DMS data, FTSE indexes, World Bank
7.4
8.1
9.3
11.0
7.7
5.3
7.4
5.9
9.7
0
2
4
6
8
10
In YB Not in YB 1986 1990s 2000 Poor AcceptableGood Excellent
Annualized USD return 2001–2014 (%)
Whether in Yearbook Ranked by FTSE index entry date Ranked by Control of Corruption Score
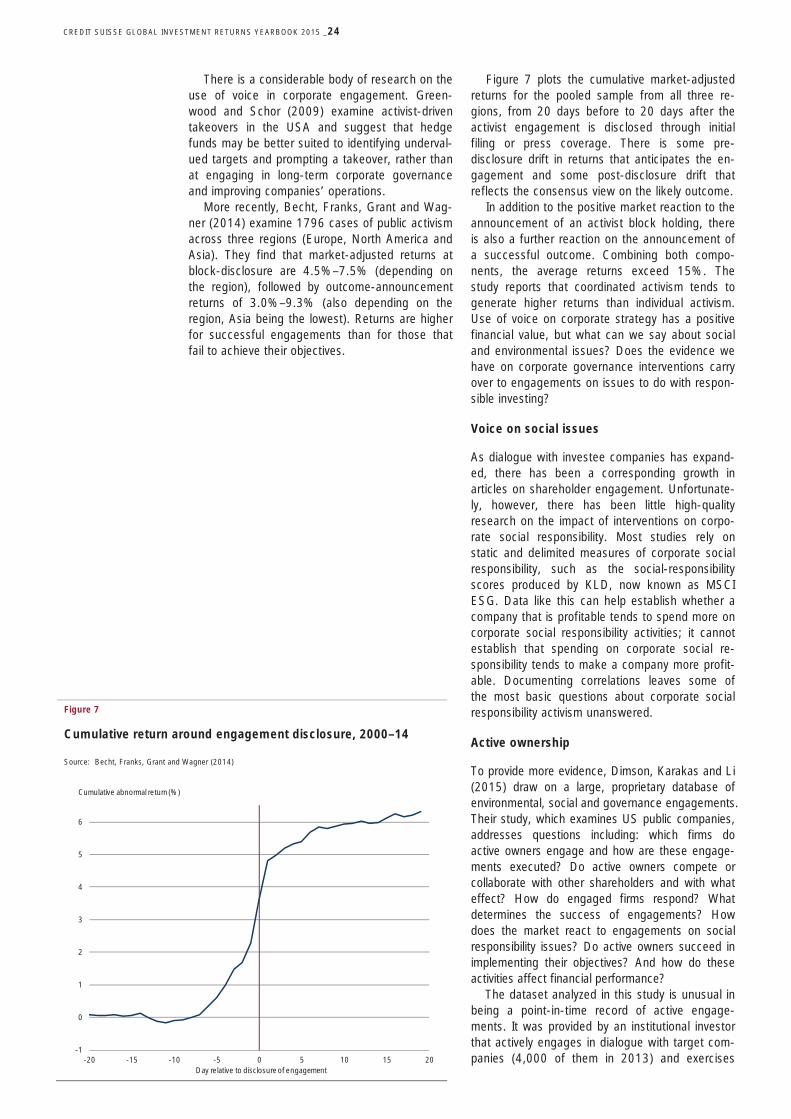
CREDIT SUISSE GLOBAL INVESTMENT RETURNS YEARBOOK 2015 _24
There is a considerable body of research on the use of voice in corporate engagement. Green-wood and Schor (2009) examine activist-driven takeovers in the USA and suggest that hedge funds may be better suited to identifying underval-ued targets and prompting a takeover, rather than at engaging in long-term corporate governance and improving companies’ operations.
More recently, Becht, Franks, Grant and Wag-ner (2014) examine 1796 cases of public activism across three regions (Europe, North America and Asia). They find that market-adjusted returns at block-disclosure are 4.5%–7.5% (depending on the region), followed by outcome-announcement returns of 3.0%–9.3% (also depending on the region, Asia being the lowest). Returns are higher for successful engagements than for those that fail to achieve their objectives.
Figure 7 plots the cumulative market-adjusted returns for the pooled sample from all three re-gions, from 20 days before to 20 days after the activist engagement is disclosed through initial filing or press coverage. There is some pre-disclosure drift in returns that anticipates the en-gagement and some post-disclosure drift that reflects the consensus view on the likely outcome.
In addition to the positive market reaction to the announcement of an activist block holding, there is also a further reaction on the announcement of a successful outcome. Combining both compo-nents, the average returns exceed 15%. The study reports that coordinated activism tends to generate higher returns than individual activism. Use of voice on corporate strategy has a positive financial value, but what can we say about social and environmental issues? Does the evidence we have on corporate governance interventions carry over to engagements on issues to do with respon-sible investing?
Voice on social issues
As dialogue with investee companies has expand-ed, there has been a corresponding growth in articles on shareholder engagement. Unfortunate-ly, however, there has been little high-quality research on the impact of interventions on corpo-rate social responsibility. Most studies rely on static and delimited measures of corporate social responsibility, such as the social-responsibility scores produced by KLD, now known as MSCI ESG. Data like this can help establish whether a company that is profitable tends to spend more on corporate social responsibility activities; it cannot establish that spending on corporate social re-sponsibility tends to make a company more profit-able. Documenting correlations leaves some of the most basic questions about corporate social responsibility activism unanswered.
Active ownership
To provide more evidence, Dimson, Karakas and Li (2015) draw on a large, proprietary database of environmental, social and governance engagements. Their study, which examines US public companies, addresses questions including: which firms do active owners engage and how are these engage-ments executed? Do active owners compete or collaborate with other shareholders and with what effect? How do engaged firms respond? What determines the success of engagements? How does the market react to engagements on social responsibility issues? Do active owners succeed in implementing their objectives? And how do these activities affect financial performance?
The dataset analyzed in this study is unusual in being a point-in-time record of active engage-ments. It was provided by an institutional investor that actively engages in dialogue with target com-panies (4,000 of them in 2013) and exercises
Figure 7
Cumulative return around engagement disclosure, 2000–14
Source: Becht, Franks, Grant and Wagner (2014)
-1
0
1
2
3
4
5
6
-20 -15 -10 -5 0 5 10 15 20
Cumulative abnormal return (%)
Day relative to disclosure of engagement
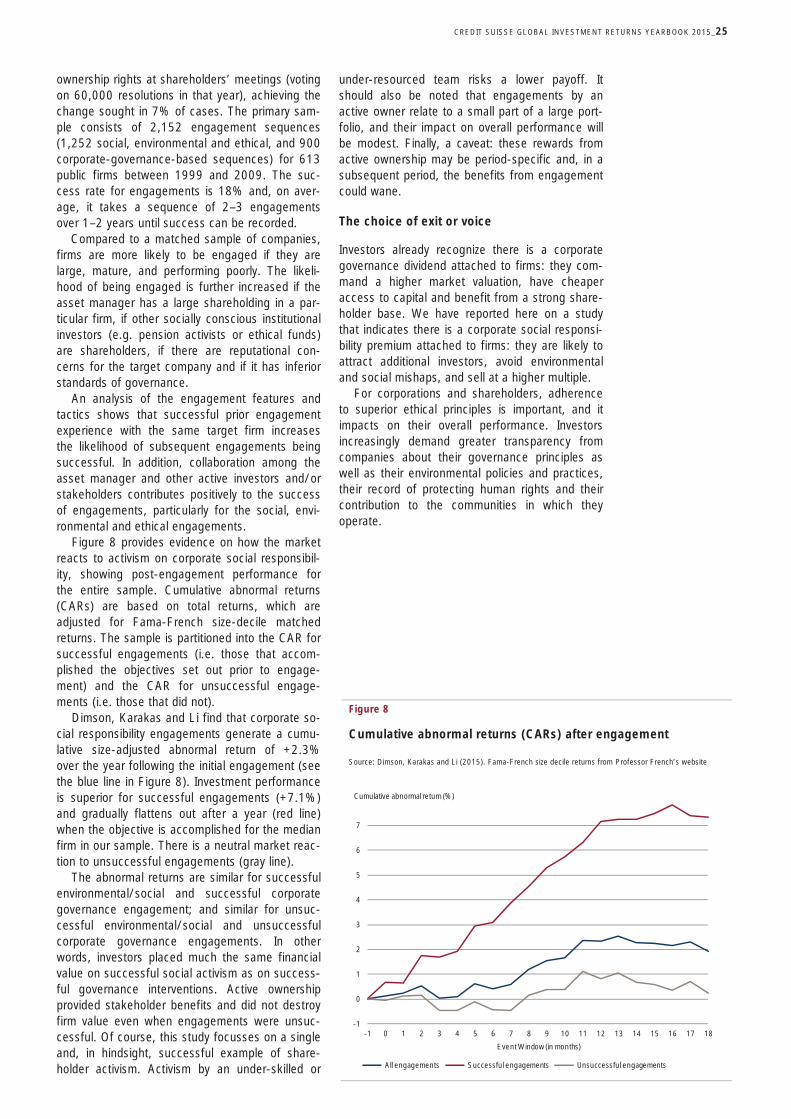
CREDIT SUISSE GLOBAL INVESTMENT RETURNS YEARBOOK 2015_25
ownership rights at shareholders’ meetings (voting on 60,000 resolutions in that year), achieving the change sought in 7% of cases. The primary sam-ple consists of 2,152 engagement sequences (1,252 social, environmental and ethical, and 900 corporate-governance-based sequences) for 613 public firms between 1999 and 2009. The suc-cess rate for engagements is 18% and, on aver-age, it takes a sequence of 2–3 engagements over 1–2 years until success can be recorded.
Compared to a matched sample of companies, firms are more likely to be engaged if they are large, mature, and performing poorly. The likeli-hood of being engaged is further increased if the asset manager has a large shareholding in a par-ticular firm, if other socially conscious institutional investors (e.g. pension activists or ethical funds) are shareholders, if there are reputational con-cerns for the target company and if it has inferior standards of governance.
An analysis of the engagement features and tactics shows that successful prior engagement experience with the same target firm increases the likelihood of subsequent engagements being successful. In addition, collaboration among the asset manager and other active investors and/or stakeholders contributes positively to the success of engagements, particularly for the social, envi-ronmental and ethical engagements.
Figure 8 provides evidence on how the market reacts to activism on corporate social responsibil-ity, showing post-engagement performance for the entire sample. Cumulative abnormal returns (CARs) are based on total returns, which are adjusted for Fama-French size-decile matched returns. The sample is partitioned into the CAR for successful engagements (i.e. those that accom-plished the objectives set out prior to engage-ment) and the CAR for unsuccessful engage-ments (i.e. those that did not).
Dimson, Karakas and Li find that corporate so-cial responsibility engagements generate a cumu-lative size-adjusted abnormal return of +2.3% over the year following the initial engagement (see the blue line in Figure 8). Investment performance is superior for successful engagements (+7.1%) and gradually flattens out after a year (red line) when the objective is accomplished for the median firm in our sample. There is a neutral market reac-tion to unsuccessful engagements (gray line).
The abnormal returns are similar for successful environmental/social and successful corporate governance engagement; and similar for unsuc-cessful environmental/social and unsuccessful corporate governance engagements. In other words, investors placed much the same financial value on successful social activism as on success-ful governance interventions. Active ownership provided stakeholder benefits and did not destroy firm value even when engagements were unsuc-cessful. Of course, this study focusses on a single and, in hindsight, successful example of share-holder activism. Activism by an under-skilled or
under-resourced team risks a lower payoff. It should also be noted that engagements by an active owner relate to a small part of a large port-folio, and their impact on overall performance will be modest. Finally, a caveat: these rewards from active ownership may be period-specific and, in a subsequent period, the benefits from engagement could wane.
The choice of exit or voice
Investors already recognize there is a corporate governance dividend attached to firms: they com-mand a higher market valuation, have cheaper access to capital and benefit from a strong share-holder base. We have reported here on a study that indicates there is a corporate social responsi-bility premium attached to firms: they are likely to attract additional investors, avoid environmental and social mishaps, and sell at a higher multiple.
For corporations and shareholders, adherence to superior ethical principles is important, and it impacts on their overall performance. Investors increasingly demand greater transparency from companies about their governance principles as well as their environmental policies and practices, their record of protecting human rights and their contribution to the communities in which they operate.
Figure 8
Cumulative abnormal returns (CARs) after engagement
Source: Dimson, Karakas and Li (2015). Fama-French size decile returns from Professor French’s website
-1
0
1
2
3
4
5
6
7
-1 0 1 2 3 4 5 6 7 8 9 10 11 12 13 14 15 16 17 18
Event Window (in months)
All engagements Successful engagements Unsuccessful engagements
Cumulative abnormal return (%)

CREDIT SUISSE GLOBAL INVESTMENT RETURNS YEARBOOK 2015 _26
Consistent with responsible companies trading at a premium price, companies that violate social norms sell for lower stock prices, and there have consequently been favorable investment returns from sin stocks. As long as those investor prefer-ences persist, one should expect higher total returns from sin stocks. If the “sin” discount stays constant, the expected capital gain is the same for sin and non-sin stocks: the excess returns to sin stocks should then come in the form of higher dividends over time. Contrary to conventional wisdom, this gives “sin” investors an incentive to have longer investment horizons.
Investors therefore face a challenge: should they exit from objectionable stocks, or should they use voice to make target companies more ac-ceptable? The decision will often depend on how strongly they feel about loyalty – retaining their stake in the company – and about the scope for changing the company for the better. It will also depend on the potential return loss from omitting objectionable stocks as well as the loss of diversi-fication. For large institutions, an added consid-eration may be the cost of exiting a very large position.
Andrew Ang (2014) estimates the impact of exclusions on forward-looking estimates of risk and return. He analyses the FTSE All World index portfolio which, in 2012, comprised 39 industries and 2871 stocks. He estimates industry risk and correlation (for the technically minded, using Le-doit-Wolf estimation) and expected returns (using Black-Litterman forecasts). Using a risk-free interest rate of 2%, he then computes optimal portfolio composition with various industry exclu-sions, and reports the risk of a minimum-volatility portfolio and the maximum reward-to-risk ratio (the Sharpe Ratio) for each screened portfolio.
Figure 9 reports his results. The first row shows the minimum risk and maximum Sharpe Ratio when all industries are deemed investible. The next three rows shows the impact of exclu-sions, which raise the risk of the minimum volatility portfolio from 12.05% to 12.10%; and reduce the maximum Sharpe Ratio from 0.4853 to 0.4852. In terms of expected risk and return, the penalty for screening is small.
We have shown in the companion article of this Yearbook that industries can have discernible factor exposures, and this raises the possibility that sin stocks are nevertheless likely to behave differently from their more attractive counterparts. The realized return from exiting may therefore turn out to be a financial disappointment or an invest-ment success.
Following a rather different methodology, Humphrey and Tan (2014) simulate portfolios that mimic the characteristics of socially responsible mutual funds by using stock-level data and avoiding the confounding impact of cost-drag on perfor-mance. They find no indication that screening has a material impact on portfolio risk or return. On aver-age, investors neither experience harm nor benefit from investing in a portfolio of socially responsible securities.
Screening out securities from a portfolio must always reduce the benefits of diversification. Why, then, does omission of up to three groups of companies have a tiny impact on expected future performance? The explanation is that, in Ang’s analysis, the marginal loss of diversification from exposure to 36 rather than 39 industries is small, and expected returns in his analysis are related solely to the beta of each industry relative to the market index (i.e. there is no expected premium from sin industries).
In the Humphrey and Tan work, the impact of pure-play sin stocks (and of pure-play responsible companies) is weakened because they are domi-nated by the overwhelming value of core holdings that defy classification as sinful or saintly. Stierli (2014), in his Credit Suisse research, shows that a stringent application of screening criteria reduces the worldwide investment universe by over 65% and, in this case, the impact could be bigger.
Figure 9
The forward-looking impact of exclusions on the World index
Source: Ang (2014, p.109). Non-BDT denotes non-bank, non-defense, non-tobacco.

CREDIT SUISSE GLOBAL INVESTMENT RETURNS YEARBOOK 2015_27
Positive screening
We have seen that companies which achieve a high standard of corporate social responsibility have generated superior stock market perfor-mance. There is a school of thought that tilting an investor’s portfolio toward responsible companies may be rewarded with a positive contribution to investment performance. This tilting strategy is sometimes referred to as positive screening.
A dilemma is that we do not always have clear evidence on how corporate social responsibility influences stock prices. When a company’s be-havior improves, the perceived risk of the stock may fall, in which case investors will require a lower rate of return. To deliver a lower return in the future, the stock price must rise. So as the company becomes more “responsible,” its share price should go up, and once it is a more desirable company, its equities should subsequently deliver a lower return than less responsible alternative investments. Positive screening, which involves selecting companies with standards of behavior that are established as high, may therefore be associated with lower investment returns.
The widely-cited study by Gompers, Ishii and Metrick (2003) provides a case study of this effect. The authors reported that the governance index they compiled was positively correlated with stock market performance during the course of the 1990s: the better governed the company, the more its shares appreciated. Their results encouraged many institutions to emphasize good governance as a criterion for selecting stocks for investment.
Subsequent research by Bebchuk, Cohen and Wang (2013) found that the superior return from well-governed companies could be ascribed to gradual learning during the 1990s by market participants about the benefits of good govern-ance. The stock prices of better-governed com-panies drifted up, to the extent that during the following decade (2000–08) the governance premium in US stock returns disappeared.
Borgers, Derwall, Koedijk and Ter Horst (2013) demonstrate that there was an analogous period of learning about the importance of being sensitive to the interests of corporate stakeholders. During 1992–2004, companies with positive strategies from a corporate-responsibility perspective outper-formed, but subsequently (2005–09) they failed to generate superior returns.
The implication is that buying shares in respon-sibly managed companies cannot be seen as a strategy that will necessarily be rewarded in the financial markets. Financially, a better course of action may be for investors to engage with the firms whose shares they own or wish to buy. This may facilitate more substantial changes for the better than can be accomplished through positive screen-ing or through exit.
How should that be implemented? To maximize the probability of success as an activist, asset own-ers might consider the “washing machine” strategy
advocated by Gollier and Pouget (2014). They argue that a large investor can generate continuing outperformance by buying non-responsible compa-nies and turning them into more responsible busi-nesses. After they have been cleaned up, the shares may then be sold at a price that reflects the accomplishments of the activist.
Conclusion
Investors have a choice between responding to unacceptable corporate behavior by means of exit or voice. Exit involves excluding the shares of companies, industries or countries with unattrac-tive attributes. Voice involves engaging with the company or pursuing other methods for amending the behavior of the firm. Exit can give rise to per-formance deviations (positive or negative) relative to unconstrained benchmarks. Large-scale di-vestment, such as avoiding entire markets, can have a particularly marked impact.
As well as being socially responsible, engaging with investee companies has been shown to be profitable in a number of cases. We find that responsible investment strategies are more likely to pay off when action is coordinated with like-minded activists. To be successful, responsible investing requires a major commitment in asset management resources, which can be costly. While it is not for everyone, a strategy of rotating attention to successive engagement opportunities (the “washing machine” model) offers an interest-ing direction for responsible asset owners.

PH
OTO
: D
OLG
AC
HO
V /
ISTO
CK
OH
OTO
.CO
M

CREDIT SUISSE GLOBAL INVESTMENT RETURNS YEARBOOK 2015_29
“The future ain’t what it used to be” – Yogi Berra HOLT is a division of Credit Suisse that for over 30 years has been offering institutional clients a unique perspective on equity valuation and risk. The HOLT discount rate represents a real, mar-ket-implied cost of capital for listed equities, ad-justed for regional and sector risk, as well as company size and leverage. Because it links to-day’s equity prices with forward estimates of cash flow, it is a market-implied measure. When inves-tor risk appetite is high (low), the discount rate decreases (increases). Since the bankruptcy of Lehman Brothers in September 2008, when the discount rate skyrocketed, it has been a signal closely followed by many fund managers. A 100 basis-point increase in the discount rate typically amounts to a drop in equity valuation of 20%–25%! Understanding the behavior of the discount rate can be highly beneficial and potentially lucra-tive.
A recent history of the US discount rate
After discount rates shot up during the 2008 credit crisis, we received numerous calls for our view on the appropriate discount rate to use in valuing cor-porations. Would discount rates revert back to pre-crisis levels, or would a new, higher level persist? How long would it take to “normalize”? To answer these questions requires an understanding of the discount rate’s dynamic behavior.
The weighted-average real discount rate time series for US industrial and service companies since 1976 is plotted in Figure 1. The median is 5.6% with 25th and 75th percentile values of 4.6% and 6.8%, respectively. Today’s discount rate is 4.2%, which indicates the US stock market is relatively expensive (nearly at the 10th percentile of historical observations).
Do equity discount rates mean revert? Mean reversion is a natural phenomenon that provides contrarian investors with a powerful rationale for making and justifying their investment choices. Well-behaved macro signals are highly prized but elusive. Investors often ask us if changes in the cost of capital for equity markets can be predicted, and if the likelihood and magnitude of those changes can be quantified. They would like to know if there is an equilibrium or mean-reverting level for the cost of capital and, if so, how quickly does it revert?
David A. Holland, Bryant Matthews and Pratyasha Rath, Credit Suisse HOLT Valuation & Analytics
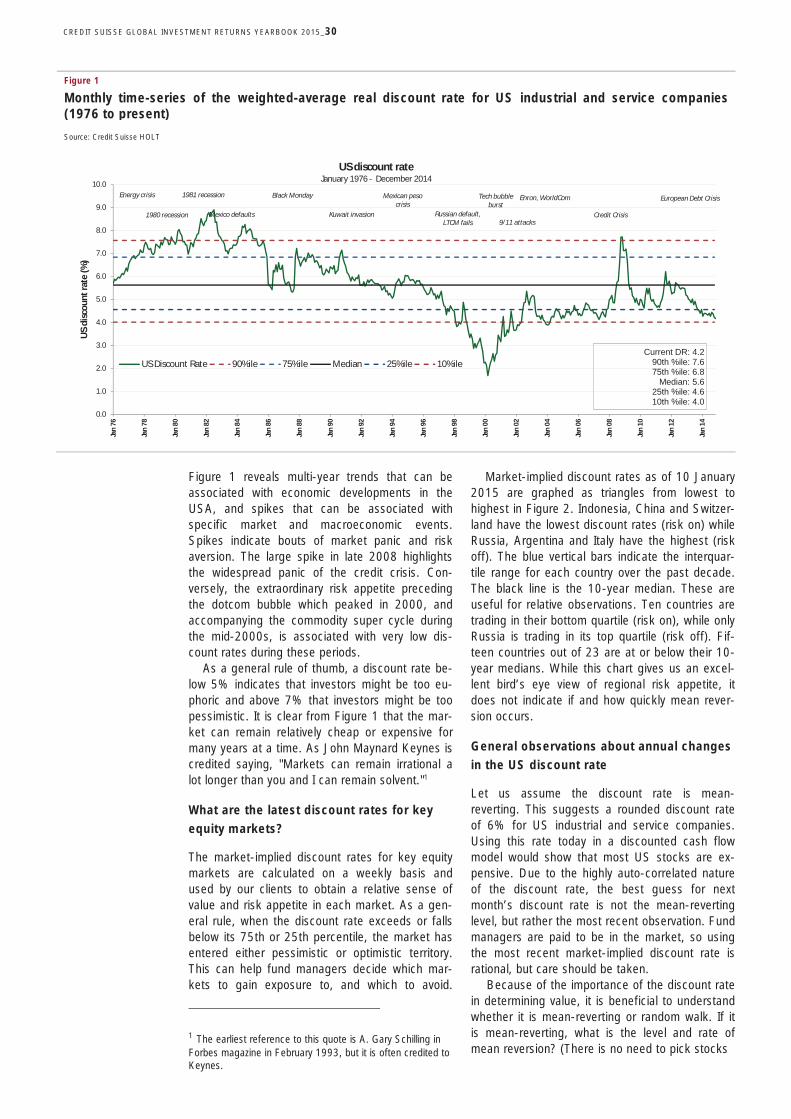
CREDIT SUISSE GLOBAL INVESTMENT RETURNS YEARBOOK 2015_30
Figure 1 reveals multi-year trends that can be associated with economic developments in the USA, and spikes that can be associated with specific market and macroeconomic events. Spikes indicate bouts of market panic and risk aversion. The large spike in late 2008 highlights the widespread panic of the credit crisis. Con-versely, the extraordinary risk appetite preceding the dotcom bubble which peaked in 2000, and accompanying the commodity super cycle during the mid-2000s, is associated with very low dis-count rates during these periods.
As a general rule of thumb, a discount rate be-low 5% indicates that investors might be too eu-phoric and above 7% that investors might be too pessimistic. It is clear from Figure 1 that the mar-ket can remain relatively cheap or expensive for many years at a time. As John Maynard Keynes is credited saying, "Markets can remain irrational a lot longer than you and I can remain solvent."1
What are the latest discount rates for key equity markets?
The market-implied discount rates for key equity markets are calculated on a weekly basis and used by our clients to obtain a relative sense of value and risk appetite in each market. As a gen-eral rule, when the discount rate exceeds or falls below its 75th or 25th percentile, the market has entered either pessimistic or optimistic territory. This can help fund managers decide which mar-kets to gain exposure to, and which to avoid.
1 The earliest reference to this quote is A. Gary Schilling in Forbes magazine in February 1993, but it is often credited to Keynes.
Market-implied discount rates as of 10 January
2015 are graphed as triangles from lowest to highest in Figure 2. Indonesia, China and Switzer-land have the lowest discount rates (risk on) while Russia, Argentina and Italy have the highest (risk off). The blue vertical bars indicate the interquar-tile range for each country over the past decade. The black line is the 10-year median. These are useful for relative observations. Ten countries are trading in their bottom quartile (risk on), while only Russia is trading in its top quartile (risk off). Fif-teen countries out of 23 are at or below their 10-year medians. While this chart gives us an excel-lent bird’s eye view of regional risk appetite, it does not indicate if and how quickly mean rever-sion occurs.
General observations about annual changes in the US discount rate
Let us assume the discount rate is mean-reverting. This suggests a rounded discount rate of 6% for US industrial and service companies. Using this rate today in a discounted cash flow model would show that most US stocks are ex-pensive. Due to the highly auto-correlated nature of the discount rate, the best guess for next month’s discount rate is not the mean-reverting level, but rather the most recent observation. Fund managers are paid to be in the market, so using the most recent market-implied discount rate is rational, but care should be taken.
Because of the importance of the discount rate in determining value, it is beneficial to understand whether it is mean-reverting or random walk. If it is mean-reverting, what is the level and rate of mean reversion? (There is no need to pick stocks
Figure 1
Monthly time-series of the weighted-average real discount rate for US industrial and service companies (1976 to present)
Source: Credit Suisse HOLT
0.0
1.0
2.0
3.0
4.0
5.0
6.0
7.0
8.0
9.0
10.0
Jan
76
Jan
78
Jan
80
Jan
82
Jan
84
Jan
86
Jan
88
Jan
90
Jan
92
Jan
94
Jan
96
Jan
98
Jan
00
Jan
02
Jan
04
Jan
06
Jan
08
Jan
10
Jan
12
Jan
14
US
disc
ount
rate
(%)
US discount rateJanuary 1976 - December 2014
US Discount Rate 90%ile 75%ile Median 25%ile 10%ileCurrent DR: 4.2
90th %ile: 7.675th %ile: 6.8
Median: 5.625th %ile: 4.610th %ile: 4.0
European Debt Crisis
Credit Crisis9/11 attacks
Tech bubble burst
Russian default,LTCM fails
Kuwait invasion
Black Monday1981 recession
Mexico defaults1980 recession
Mexican peso crisis
Enron, WorldComEnergy crisis
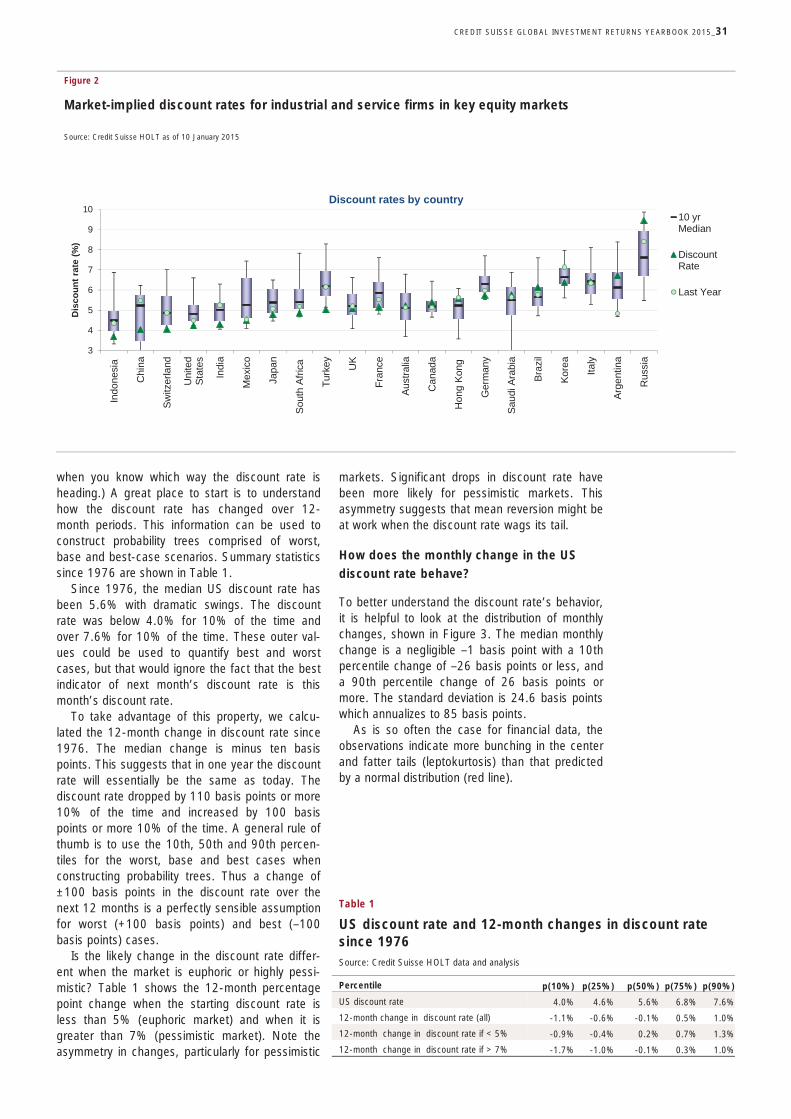
CREDIT SUISSE GLOBAL INVESTMENT RETURNS YEARBOOK 2015_31
when you know which way the discount rate is heading.) A great place to start is to understand how the discount rate has changed over 12-month periods. This information can be used to construct probability trees comprised of worst, base and best-case scenarios. Summary statistics since 1976 are shown in Table 1.
Since 1976, the median US discount rate has been 5.6% with dramatic swings. The discount rate was below 4.0% for 10% of the time and over 7.6% for 10% of the time. These outer val-ues could be used to quantify best and worst cases, but that would ignore the fact that the best indicator of next month’s discount rate is this month’s discount rate.
To take advantage of this property, we calcu-lated the 12-month change in discount rate since 1976. The median change is minus ten basis points. This suggests that in one year the discount rate will essentially be the same as today. The discount rate dropped by 110 basis points or more 10% of the time and increased by 100 basis points or more 10% of the time. A general rule of thumb is to use the 10th, 50th and 90th percen-tiles for the worst, base and best cases when constructing probability trees. Thus a change of ±100 basis points in the discount rate over the next 12 months is a perfectly sensible assumption for worst (+100 basis points) and best (–100 basis points) cases.
Is the likely change in the discount rate differ-ent when the market is euphoric or highly pessi-mistic? Table 1 shows the 12-month percentage point change when the starting discount rate is less than 5% (euphoric market) and when it is greater than 7% (pessimistic market). Note the asymmetry in changes, particularly for pessimistic
markets. Significant drops in discount rate have been more likely for pessimistic markets. This asymmetry suggests that mean reversion might be at work when the discount rate wags its tail.
How does the monthly change in the US discount rate behave?
To better understand the discount rate’s behavior, it is helpful to look at the distribution of monthly changes, shown in Figure 3. The median monthly change is a negligible –1 basis point with a 10th percentile change of –26 basis points or less, and a 90th percentile change of 26 basis points or more. The standard deviation is 24.6 basis points which annualizes to 85 basis points.
As is so often the case for financial data, the observations indicate more bunching in the center and fatter tails (leptokurtosis) than that predicted by a normal distribution (red line).
Figure 2
Market-implied discount rates for industrial and service firms in key equity markets
Source: Credit Suisse HOLT as of 10 January 2015
Table 1
US discount rate and 12-month changes in discount rate since 1976 Source: Credit Suisse HOLT data and analysis
Percentile p(10%) p(25%) p(50%) p(75%) p(90%)
US discount rate 4.0% 4.6% 5.6% 6.8% 7.6%
12-month change in discount rate (all) -1.1% -0.6% -0.1% 0.5% 1.0%
12-month change in discount rate if < 5% -0.9% -0.4% 0.2% 0.7% 1.3%
12-month change in discount rate if > 7% -1.7% -1.0% -0.1% 0.3% 1.0%
3
4
5
6
7
8
9
10
Indo
nesi
a
Chi
na
Switz
erla
nd
Uni
ted
Stat
es
Indi
a
Mex
ico
Japa
n
Sou
th A
frica
Turk
ey UK
Fran
ce
Aus
tralia
Can
ada
Hon
g Ko
ng
Ger
man
y
Sau
di A
rabi
a
Braz
il
Kore
a
Italy
Arg
entin
a
Rus
sia
Dis
coun
t rat
e (%
)
Discount rates by country10 yrMedian
DiscountRate
Last Year
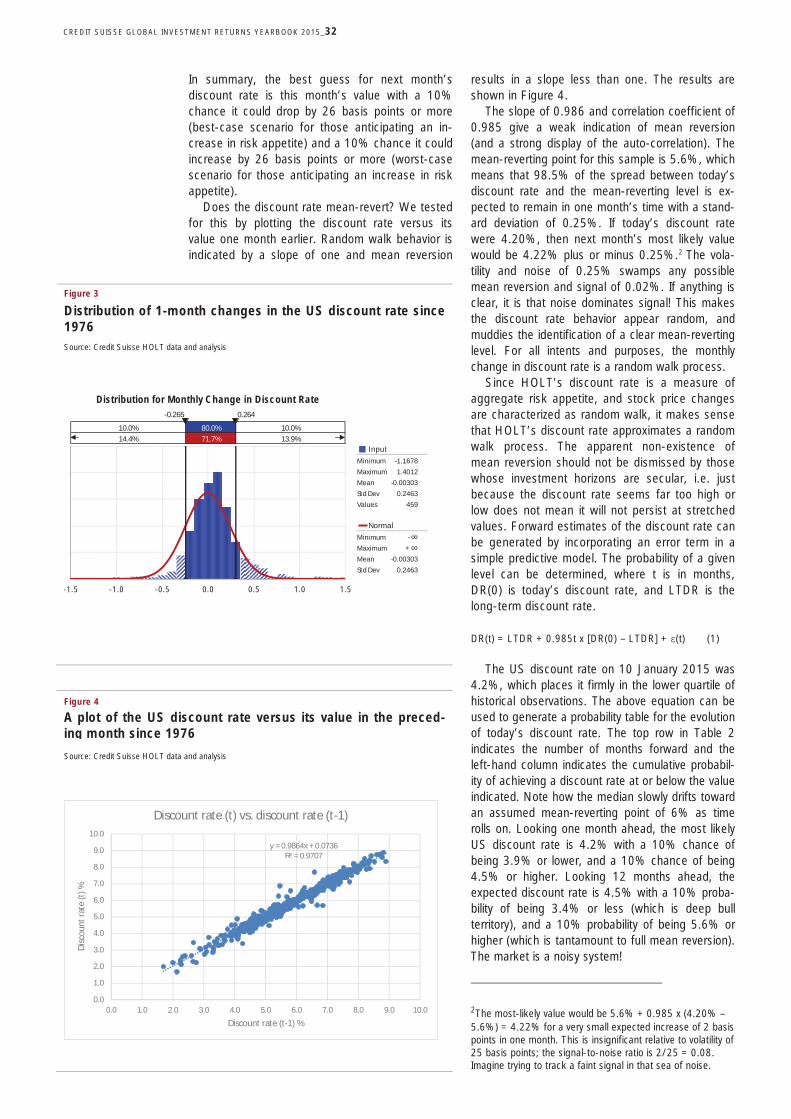
CREDIT SUISSE GLOBAL INVESTMENT RETURNS YEARBOOK 2015_32
In summary, the best guess for next month’s discount rate is this month’s value with a 10% chance it could drop by 26 basis points or more (best-case scenario for those anticipating an in-crease in risk appetite) and a 10% chance it could increase by 26 basis points or more (worst-case scenario for those anticipating an increase in risk appetite).
Does the discount rate mean-revert? We tested for this by plotting the discount rate versus its value one month earlier. Random walk behavior is indicated by a slope of one and mean reversion
results in a slope less than one. The results are shown in Figure 4.
The slope of 0.986 and correlation coefficient of 0.985 give a weak indication of mean reversion (and a strong display of the auto-correlation). The mean-reverting point for this sample is 5.6%, which means that 98.5% of the spread between today’s discount rate and the mean-reverting level is ex-pected to remain in one month’s time with a stand-ard deviation of 0.25%. If today’s discount rate were 4.20%, then next month’s most likely value would be 4.22% plus or minus 0.25%.2 The vola-tility and noise of 0.25% swamps any possible mean reversion and signal of 0.02%. If anything is clear, it is that noise dominates signal! This makes the discount rate behavior appear random, and muddies the identification of a clear mean-reverting level. For all intents and purposes, the monthly change in discount rate is a random walk process.
Since HOLT’s discount rate is a measure of aggregate risk appetite, and stock price changes are characterized as random walk, it makes sense that HOLT’s discount rate approximates a random walk process. The apparent non-existence of mean reversion should not be dismissed by those whose investment horizons are secular, i.e. just because the discount rate seems far too high or low does not mean it will not persist at stretched values. Forward estimates of the discount rate can be generated by incorporating an error term in a simple predictive model. The probability of a given level can be determined, where t is in months, DR(0) is today’s discount rate, and LTDR is the long-term discount rate. DR(t) = LTDR + 0.985t x [DR(0) – LTDR] + (t) (1)
The US discount rate on 10 January 2015 was 4.2%, which places it firmly in the lower quartile of historical observations. The above equation can be used to generate a probability table for the evolution of today’s discount rate. The top row in Table 2 indicates the number of months forward and the left-hand column indicates the cumulative probabil-ity of achieving a discount rate at or below the value indicated. Note how the median slowly drifts toward an assumed mean-reverting point of 6% as time rolls on. Looking one month ahead, the most likely US discount rate is 4.2% with a 10% chance of being 3.9% or lower, and a 10% chance of being 4.5% or higher. Looking 12 months ahead, the expected discount rate is 4.5% with a 10% proba-bility of being 3.4% or less (which is deep bull territory), and a 10% probability of being 5.6% or higher (which is tantamount to full mean reversion). The market is a noisy system!
2The most-likely value would be 5.6% + 0.985 x (4.20% – 5.6%) = 4.22% for a very small expected increase of 2 basis points in one month. This is insignificant relative to volatility of 25 basis points; the signal-to-noise ratio is 2/25 = 0.08. Imagine trying to track a faint signal in that sea of noise.
Figure 4
A plot of the US discount rate versus its value in the preced-ing month since 1976
Source: Credit Suisse HOLT data and analysis
Figure 3
Distribution of 1-month changes in the US discount rate since 1976 Source: Credit Suisse HOLT data and analysis
y = 0.9864x + 0.0736R² = 0.9707
0.0
1.0
2.0
3.0
4.0
5.0
6.0
7.0
8.0
9.0
10.0
0.0 1.0 2.0 3.0 4.0 5.0 6.0 7.0 8.0 9.0 10.0
Disc
ount
rate
(t) %
Discount rate (t-1) %
Discount rate (t) vs. discount rate (t-1)
-0.265 0.264
80.0%71.7%
InputMinimum -1.1678Maximum 1.4012Mean -0.00303Std Dev 0.2463Values 459
NormalMinimum -Maximum +Mean -0.00303Std Dev 0.2463
Distribution for Monthly Change in Discount Rate
10.0%14.4%
10.0%13.9%
-1.5 -1.0 -0.5 0.0 0.5 1.0 1.5
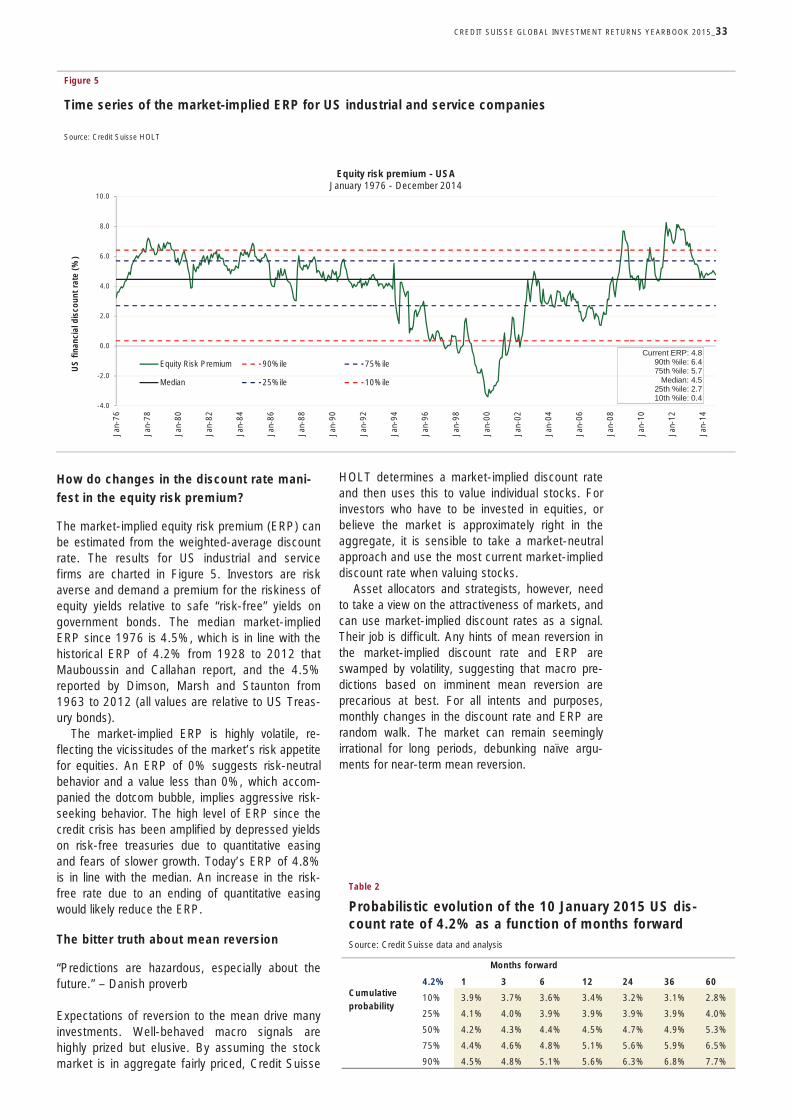
CREDIT SUISSE GLOBAL INVESTMENT RETURNS YEARBOOK 2015_33
How do changes in the discount rate mani-fest in the equity risk premium?
The market-implied equity risk premium (ERP) can be estimated from the weighted-average discount rate. The results for US industrial and service firms are charted in Figure 5. Investors are risk averse and demand a premium for the riskiness of equity yields relative to safe “risk-free” yields on government bonds. The median market-implied ERP since 1976 is 4.5%, which is in line with the historical ERP of 4.2% from 1928 to 2012 that Mauboussin and Callahan report, and the 4.5% reported by Dimson, Marsh and Staunton from 1963 to 2012 (all values are relative to US Treas-ury bonds).
The market-implied ERP is highly volatile, re-flecting the vicissitudes of the market’s risk appetite for equities. An ERP of 0% suggests risk-neutral behavior and a value less than 0%, which accom-panied the dotcom bubble, implies aggressive risk-seeking behavior. The high level of ERP since the credit crisis has been amplified by depressed yields on risk-free treasuries due to quantitative easing and fears of slower growth. Today’s ERP of 4.8% is in line with the median. An increase in the risk-free rate due to an ending of quantitative easing would likely reduce the ERP.
The bitter truth about mean reversion
“Predictions are hazardous, especially about the future.” – Danish proverb
Expectations of reversion to the mean drive many investments. Well-behaved macro signals are highly prized but elusive. By assuming the stock market is in aggregate fairly priced, Credit Suisse
HOLT determines a market-implied discount rate and then uses this to value individual stocks. For investors who have to be invested in equities, or believe the market is approximately right in the aggregate, it is sensible to take a market-neutral approach and use the most current market-implied discount rate when valuing stocks.
Asset allocators and strategists, however, need to take a view on the attractiveness of markets, and can use market-implied discount rates as a signal. Their job is difficult. Any hints of mean reversion in the market-implied discount rate and ERP are swamped by volatility, suggesting that macro pre-dictions based on imminent mean reversion are precarious at best. For all intents and purposes, monthly changes in the discount rate and ERP are random walk. The market can remain seemingly irrational for long periods, debunking naïve argu-ments for near-term mean reversion.
Figure 5
Time series of the market-implied ERP for US industrial and service companies
Source: Credit Suisse HOLT
Table 2
Probabilistic evolution of the 10 January 2015 US dis-count rate of 4.2% as a function of months forward Source: Credit Suisse data and analysis
Months forward
Cumulative probability
4.2% 1 3 6 12 24 36 60
10% 3.9% 3.7% 3.6% 3.4% 3.2% 3.1% 2.8%
25% 4.1% 4.0% 3.9% 3.9% 3.9% 3.9% 4.0%
50% 4.2% 4.3% 4.4% 4.5% 4.7% 4.9% 5.3%
75% 4.4% 4.6% 4.8% 5.1% 5.6% 5.9% 6.5%
90% 4.5% 4.8% 5.1% 5.6% 6.3% 6.8% 7.7%
-4.0
-2.0
0.0
2.0
4.0
6.0
8.0
10.0
Jan-
76
Jan-
78
Jan-
80
Jan-
82
Jan-
84
Jan-
86
Jan-
88
Jan-
90
Jan-
92
Jan-
94
Jan-
96
Jan-
98
Jan-
00
Jan-
02
Jan-
04
Jan-
06
Jan-
08
Jan-
10
Jan-
12
Jan-
14
US
fin
anci
al d
isco
unt
rate
(%
)
Equity risk premium - USAJanuary 1976 - December 2014
Equity Risk Premium 90%ile 75%ile
Median 25%ile 10%ile
Current ERP: 4.890th %ile: 6.475th %ile: 5.7
Median: 4.525th %ile: 2.710th %ile: 0.4

PH
OTO
: FE
RLI
STO
CK
PH
OTO
/ IS
TOC
KP
HO
TO.C
OM
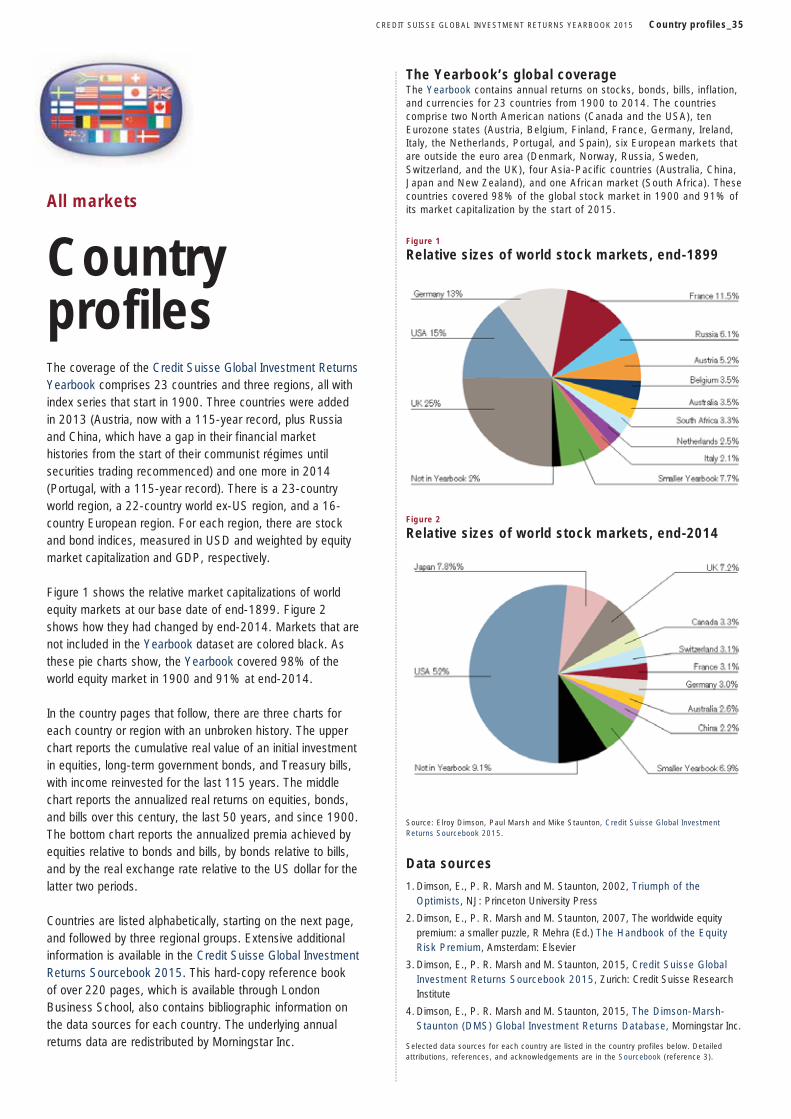
CREDIT SUISSE GLOBAL INVESTMENT RETURNS YEARBOOK 2015 Country profiles_35
All markets
Country profiles The coverage of the Credit Suisse Global Investment Returns Yearbook comprises 23 countries and three regions, all with index series that start in 1900. Three countries were added in 2013 (Austria, now with a 115-year record, plus Russia and China, which have a gap in their financial market histories from the start of their communist régimes until securities trading recommenced) and one more in 2014 (Portugal, with a 115-year record). There is a 23-country world region, a 22-country world ex-US region, and a 16-country European region. For each region, there are stock and bond indices, measured in USD and weighted by equity market capitalization and GDP, respectively.
Figure 1 shows the relative market capitalizations of world equity markets at our base date of end-1899. Figure 2 shows how they had changed by end-2014. Markets that are not included in the Yearbook dataset are colored black. As these pie charts show, the Yearbook covered 98% of the world equity market in 1900 and 91% at end-2014.
In the country pages that follow, there are three charts for each country or region with an unbroken history. The upper chart reports the cumulative real value of an initial investment in equities, long-term government bonds, and Treasury bills, with income reinvested for the last 115 years. The middle chart reports the annualized real returns on equities, bonds, and bills over this century, the last 50 years, and since 1900. The bottom chart reports the annualized premia achieved by equities relative to bonds and bills, by bonds relative to bills, and by the real exchange rate relative to the US dollar for the latter two periods.
Countries are listed alphabetically, starting on the next page, and followed by three regional groups. Extensive additional information is available in the Credit Suisse Global Investment Returns Sourcebook 2015. This hard-copy reference book of over 220 pages, which is available through London Business School, also contains bibliographic information on the data sources for each country. The underlying annual returns data are redistributed by Morningstar Inc.
The Yearbook’s global coverage The Yearbook contains annual returns on stocks, bonds, bills, inflation, and currencies for 23 countries from 1900 to 2014. The countries comprise two North American nations (Canada and the USA), ten Eurozone states (Austria, Belgium, Finland, France, Germany, Ireland, Italy, the Netherlands, Portugal, and Spain), six European markets that are outside the euro area (Denmark, Norway, Russia, Sweden, Switzerland, and the UK), four Asia-Pacific countries (Australia, China, Japan and New Zealand), and one African market (South Africa). These countries covered 98% of the global stock market in 1900 and 91% of its market capitalization by the start of 2015.
Figure 1
Relative sizes of world stock markets, end-1899
Figure 2
Relative sizes of world stock markets, end-2014
Source: Elroy Dimson, Paul Marsh and Mike Staunton, Credit Suisse Global Investment Returns Sourcebook 2015.
Data sources
1. Dimson, E., P. R. Marsh and M. Staunton, 2002, Triumph of the Optimists, NJ: Princeton University Press
2. Dimson, E., P. R. Marsh and M. Staunton, 2007, The worldwide equity premium: a smaller puzzle, R Mehra (Ed.) The Handbook of the Equity Risk Premium, Amsterdam: Elsevier
3. Dimson, E., P. R. Marsh and M. Staunton, 2015, Credit Suisse Global Investment Returns Sourcebook 2015, Zurich: Credit Suisse Research Institute
4. Dimson, E., P. R. Marsh and M. Staunton, 2015, The Dimson-Marsh-Staunton (DMS) Global Investment Returns Database, Morningstar Inc.
Selected data sources for each country are listed in the country profiles below. Detailed attributions, references, and acknowledgements are in the Sourcebook (reference 3).
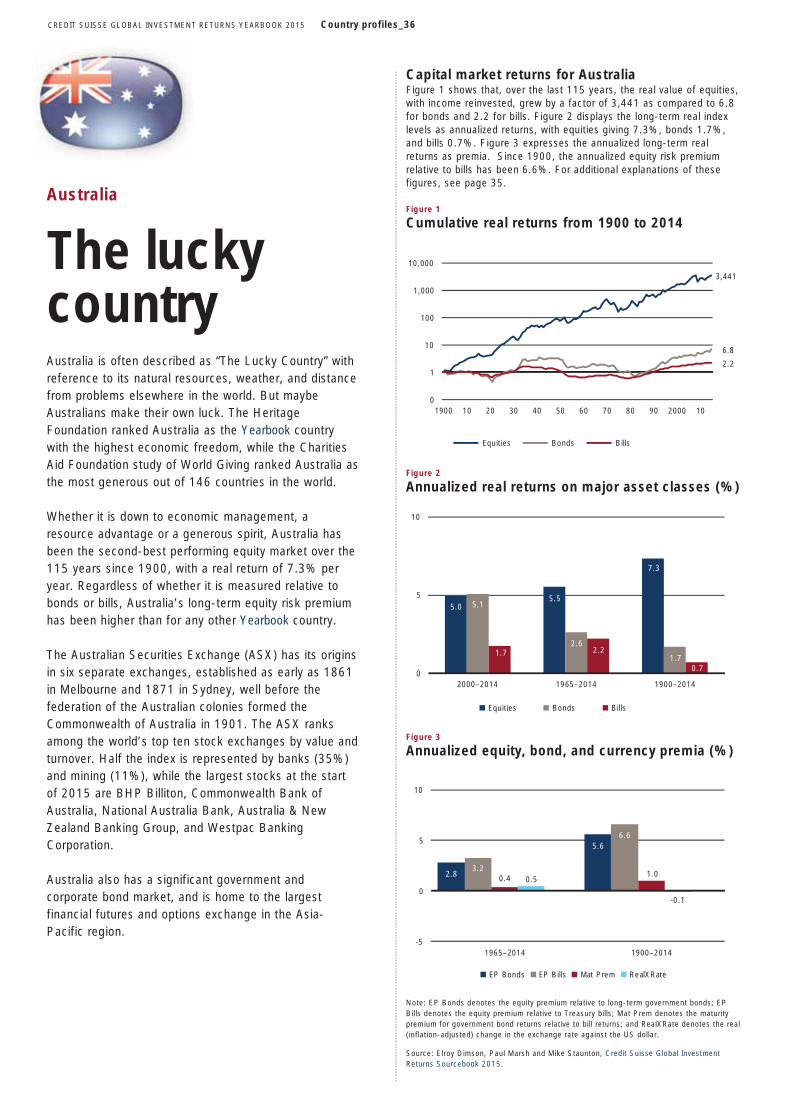
CREDIT SUISSE GLOBAL INVESTMENT RETURNS YEARBOOK 2015 Country profiles_36
Australia
The lucky country Australia is often described as “The Lucky Country” with reference to its natural resources, weather, and distance from problems elsewhere in the world. But maybe Australians make their own luck. The Heritage Foundation ranked Australia as the Yearbook country with the highest economic freedom, while the Charities Aid Foundation study of World Giving ranked Australia as the most generous out of 146 countries in the world.
Whether it is down to economic management, a resource advantage or a generous spirit, Australia has been the second-best performing equity market over the 115 years since 1900, with a real return of 7.3% per year. Regardless of whether it is measured relative to bonds or bills, Australia’s long-term equity risk premium has been higher than for any other Yearbook country.
The Australian Securities Exchange (ASX) has its origins in six separate exchanges, established as early as 1861 in Melbourne and 1871 in Sydney, well before the federation of the Australian colonies formed the Commonwealth of Australia in 1901. The ASX ranks among the world’s top ten stock exchanges by value and turnover. Half the index is represented by banks (35%) and mining (11%), while the largest stocks at the start of 2015 are BHP Billiton, Commonwealth Bank of Australia, National Australia Bank, Australia & New Zealand Banking Group, and Westpac Banking Corporation.
Australia also has a significant government and corporate bond market, and is home to the largest financial futures and options exchange in the Asia-Pacific region.
Capital market returns for Australia Figure 1 shows that, over the last 115 years, the real value of equities, with income reinvested, grew by a factor of 3,441 as compared to 6.8 for bonds and 2.2 for bills. Figure 2 displays the long-term real index levels as annualized returns, with equities giving 7.3%, bonds 1.7%, and bills 0.7%. Figure 3 expresses the annualized long-term real returns as premia. Since 1900, the annualized equity risk premium relative to bills has been 6.6%. For additional explanations of these figures, see page 35.
Figure 1
Cumulative real returns from 1900 to 2014
Figure 2
Annualized real returns on major asset classes (%)
Figure 3
Annualized equity, bond, and currency premia (%)
Note: EP Bonds denotes the equity premium relative to long-term government bonds; EP Bills denotes the equity premium relative to Treasury bills; Mat Prem denotes the maturity premium for government bond returns relative to bill returns; and RealXRate denotes the real (inflation-adjusted) change in the exchange rate against the US dollar.
Source: Elroy Dimson, Paul Marsh and Mike Staunton, Credit Suisse Global Investment Returns Sourcebook 2015.
3,441
6.8
2.2
0
1
10
100
1,000
10,000
1900 10 20 30 40 50 60 70 80 90 2000 10
Equities Bonds Bills
5.05.5
7.3
5.1
2.6
1.71.7 2.2
0.70
5
10
2000–2014 1965–2014 1900–2014
Equities Bonds Bills
2.8
5.6
3.2
6.6
0.4 1.00.5
-0.1
-5
0
5
10
1965–2014 1900–2014
EP Bonds EP Bills Mat Prem RealXRate

CREDIT SUISSE GLOBAL INVESTMENT RETURNS YEARBOOK 2015 Country profiles_37
Austria
Lost empire
The Austrian Empire was re-formed in the 19th century into Austria-Hungary, which, by 1900, was the second-largest country in Europe. It comprised modern-day Austria, Bosnia-Herzegovina, Croatia, Czech Republic, Hungary, Slovakia, Slovenia; large parts of Romania and Serbia; and small parts of Italy, Montenegro, Poland, and Ukraine. At the end of World War I and the break-up of the Habsburg Empire, the first Austrian republic was established.
Although Austria did not pay reparations after World War I, the country suffered hyperinflation during 1921–22 similar to that of Germany. In 1938, Austria was annexed by Germany and ceased to exist as an independent country until after World War II. In 1955, Austria became an independent sovereign state again, and was admitted as a member of the European Union in 1995, and a member of the Eurozone in 1999. Today, Austria is prosperous, enjoying high per capita GDP.
Bonds were traded on the Wiener Börse from 1771 and shares from 1818 onward. Trading was interrupted by the world wars and, after the stock exchange reopened in 1948, share trading was sluggish, and there was not a single IPO in the 1960s or 1970s. From the mid-1980s, building on Austria’s gateway to Eastern Europe, the Exchange’s activity expanded. Still, over the last 115 years, real stock market returns (0.6% per year) have been lower for Austria than for any other country with a record from 1900 to date.
Financials represents half (47%) of the Austrian equity market. At the start of 2015, the largest Austrian company is Erste Group Bank (25% of the market), followed by OMV, Voestalpine, Andritz, and Immofinanz.
Capital market returns for Austria Figure 1 shows that, over the last 115 years, the real value of equities, with income reinvested, grew by a factor of 1.9 as compared to 0.0117 for bonds and 0.0001 for bills. Figure 2 displays the long-term real index levels as annualized returns, with equities giving 0.6%, bonds –3.8%, and bills –8.1%. Figure 3 expresses the annualized long-term real returns as premia. Since 1900, the annualized equity risk premium relative to bills has been 5.5%. The premia series exclude 1921–22. For additional explanations of these figures, see page 35.
Figure 1
Cumulative real returns from 1900 to 2014
Figure 2
Annualized real returns on major asset classes (%)
Figure 3
Annualized equity, bond, and currency premia (%)
Note: EP Bonds denotes the equity premium relative to long-term government bonds; EP Bills denotes the equity premium relative to Treasury bills; Mat Prem denotes the maturity premium for government bond returns relative to bill returns; and RealXRate denotes the real (inflation-adjusted) change in the exchange rate against the US dollar.
Source: Elroy Dimson, Paul Marsh and Mike Staunton, Credit Suisse Global Investment Returns Sourcebook 2015.
1.9
0.0117
0.00010.0000
0.0001
0.0010
0.0100
0.1000
1.0000
10.0000
1900 10 20 30 40 50 60 70 80 90 2000 10
Equities Bonds Bills
3.52.8 0.6
7.0
4.7
-3.8
0.0 1.9
-8.1
-10
-5
0
5
10
2000–2014 1965–2014 1900–2014
Equities Bonds Bills
-1.8
2.50.9
5.5
2.7 2.91.0
-0.9
-5
0
5
10
1965–2014 1900–2014
EP Bonds EP Bills Mat Prem RealXRate
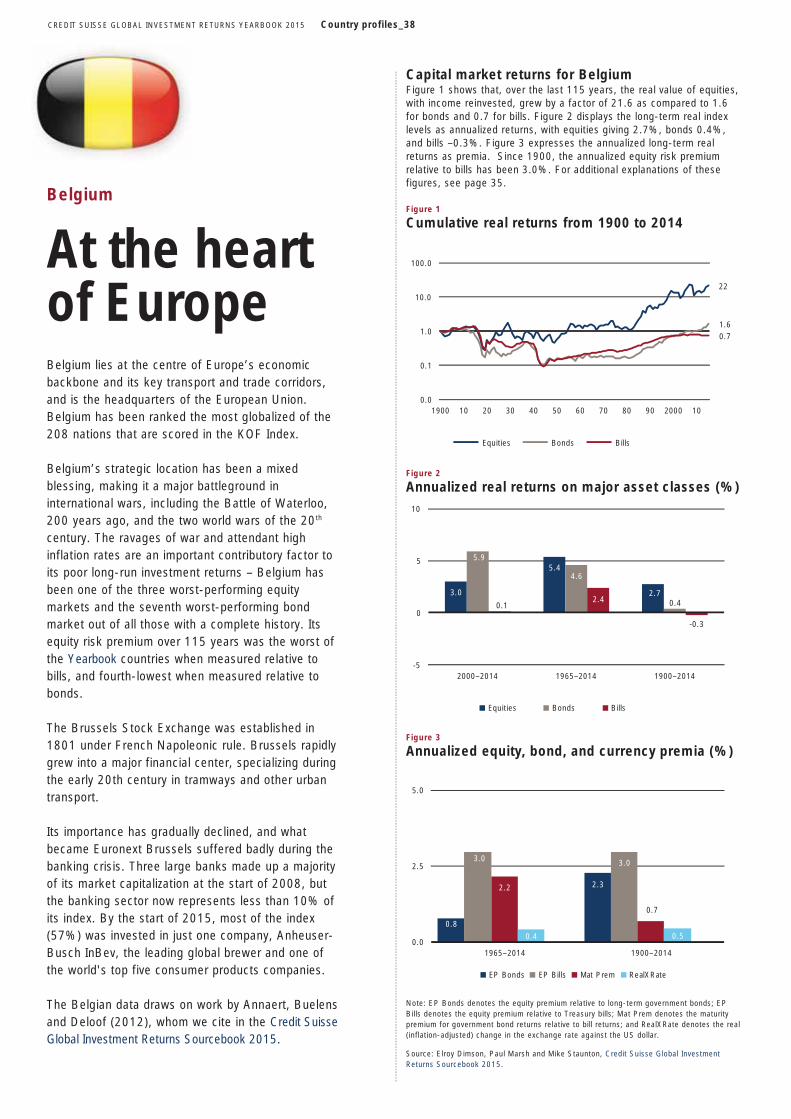
CREDIT SUISSE GLOBAL INVESTMENT RETURNS YEARBOOK 2015 Country profiles_38
Belgium
At the heart of Europe Belgium lies at the centre of Europe’s economic backbone and its key transport and trade corridors, and is the headquarters of the European Union. Belgium has been ranked the most globalized of the 208 nations that are scored in the KOF Index.
Belgium’s strategic location has been a mixed blessing, making it a major battleground in international wars, including the Battle of Waterloo, 200 years ago, and the two world wars of the 20th century. The ravages of war and attendant high inflation rates are an important contributory factor to its poor long-run investment returns – Belgium has been one of the three worst-performing equity markets and the seventh worst-performing bond market out of all those with a complete history. Its equity risk premium over 115 years was the worst of the Yearbook countries when measured relative to bills, and fourth-lowest when measured relative to bonds.
The Brussels Stock Exchange was established in 1801 under French Napoleonic rule. Brussels rapidly grew into a major financial center, specializing during the early 20th century in tramways and other urban transport.
Its importance has gradually declined, and what became Euronext Brussels suffered badly during the banking crisis. Three large banks made up a majority of its market capitalization at the start of 2008, but the banking sector now represents less than 10% of its index. By the start of 2015, most of the index (57%) was invested in just one company, Anheuser-Busch InBev, the leading global brewer and one of the world's top five consumer products companies.
The Belgian data draws on work by Annaert, Buelens and Deloof (2012), whom we cite in the Credit Suisse Global Investment Returns Sourcebook 2015.
Capital market returns for Belgium Figure 1 shows that, over the last 115 years, the real value of equities, with income reinvested, grew by a factor of 21.6 as compared to 1.6 for bonds and 0.7 for bills. Figure 2 displays the long-term real index levels as annualized returns, with equities giving 2.7%, bonds 0.4%, and bills –0.3%. Figure 3 expresses the annualized long-term real returns as premia. Since 1900, the annualized equity risk premium relative to bills has been 3.0%. For additional explanations of these figures, see page 35.
Figure 1
Cumulative real returns from 1900 to 2014
Figure 2
Annualized real returns on major asset classes (%)
Figure 3
Annualized equity, bond, and currency premia (%)
Note: EP Bonds denotes the equity premium relative to long-term government bonds; EP Bills denotes the equity premium relative to Treasury bills; Mat Prem denotes the maturity premium for government bond returns relative to bill returns; and RealXRate denotes the real (inflation-adjusted) change in the exchange rate against the US dollar.
Source: Elroy Dimson, Paul Marsh and Mike Staunton, Credit Suisse Global Investment Returns Sourcebook 2015.
22
1.60.7
0.0
0.1
1.0
10.0
100.0
1900 10 20 30 40 50 60 70 80 90 2000 10
Equities Bonds Bills
3.0
5.4
2.7
5.9
4.6
0.40.12.4
-0.3
-5
0
5
10
2000–2014 1965–2014 1900–2014
Equities Bonds Bills
0.8
2.3
3.0 3.0
2.2
0.7
0.4 0.50.0
2.5
5.0
1965–2014 1900–2014
EP Bonds EP Bills Mat Prem RealXRate
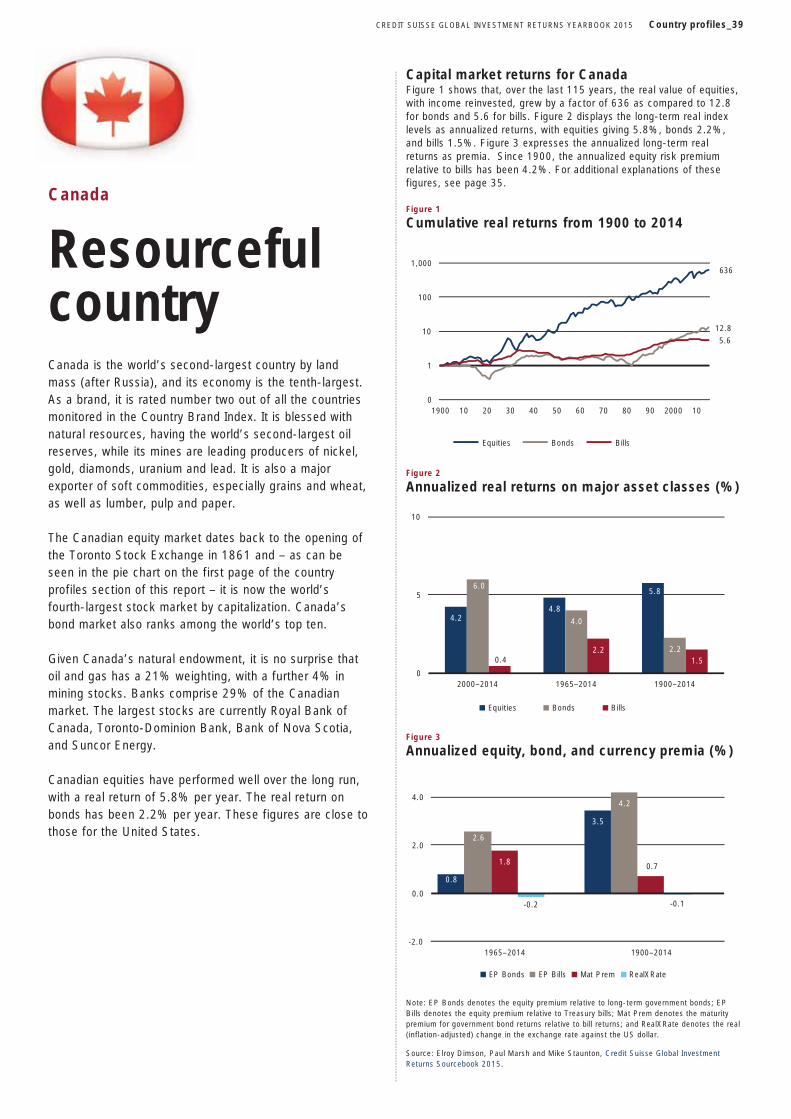
CREDIT SUISSE GLOBAL INVESTMENT RETURNS YEARBOOK 2015 Country profiles_39
Canada
Resourceful country Canada is the world’s second-largest country by land mass (after Russia), and its economy is the tenth-largest. As a brand, it is rated number two out of all the countries monitored in the Country Brand Index. It is blessed with natural resources, having the world’s second-largest oil reserves, while its mines are leading producers of nickel, gold, diamonds, uranium and lead. It is also a major exporter of soft commodities, especially grains and wheat, as well as lumber, pulp and paper.
The Canadian equity market dates back to the opening of the Toronto Stock Exchange in 1861 and – as can be seen in the pie chart on the first page of the country profiles section of this report – it is now the world’s fourth-largest stock market by capitalization. Canada’s bond market also ranks among the world’s top ten.
Given Canada’s natural endowment, it is no surprise that oil and gas has a 21% weighting, with a further 4% in mining stocks. Banks comprise 29% of the Canadian market. The largest stocks are currently Royal Bank of Canada, Toronto-Dominion Bank, Bank of Nova Scotia, and Suncor Energy.
Canadian equities have performed well over the long run, with a real return of 5.8% per year. The real return on bonds has been 2.2% per year. These figures are close to those for the United States.
Capital market returns for Canada Figure 1 shows that, over the last 115 years, the real value of equities, with income reinvested, grew by a factor of 636 as compared to 12.8 for bonds and 5.6 for bills. Figure 2 displays the long-term real index levels as annualized returns, with equities giving 5.8%, bonds 2.2%, and bills 1.5%. Figure 3 expresses the annualized long-term real returns as premia. Since 1900, the annualized equity risk premium relative to bills has been 4.2%. For additional explanations of these figures, see page 35.
Figure 1
Cumulative real returns from 1900 to 2014
Figure 2
Annualized real returns on major asset classes (%)
Figure 3
Annualized equity, bond, and currency premia (%)
Note: EP Bonds denotes the equity premium relative to long-term government bonds; EP Bills denotes the equity premium relative to Treasury bills; Mat Prem denotes the maturity premium for government bond returns relative to bill returns; and RealXRate denotes the real (inflation-adjusted) change in the exchange rate against the US dollar.
Source: Elroy Dimson, Paul Marsh and Mike Staunton, Credit Suisse Global Investment Returns Sourcebook 2015.
636
12.8
5.6
0
1
10
100
1,000
1900 10 20 30 40 50 60 70 80 90 2000 10
Equities Bonds Bills
4.24.8
5.86.0
4.0
2.20.4
2.21.5
0
5
10
2000–2014 1965–2014 1900–2014
Equities Bonds Bills
0.8
3.5
2.6
4.2
1.8 0.7
-0.2 -0.1
-2.0
0.0
2.0
4.0
1965–2014 1900–2014
EP Bonds EP Bills Mat Prem RealXRate
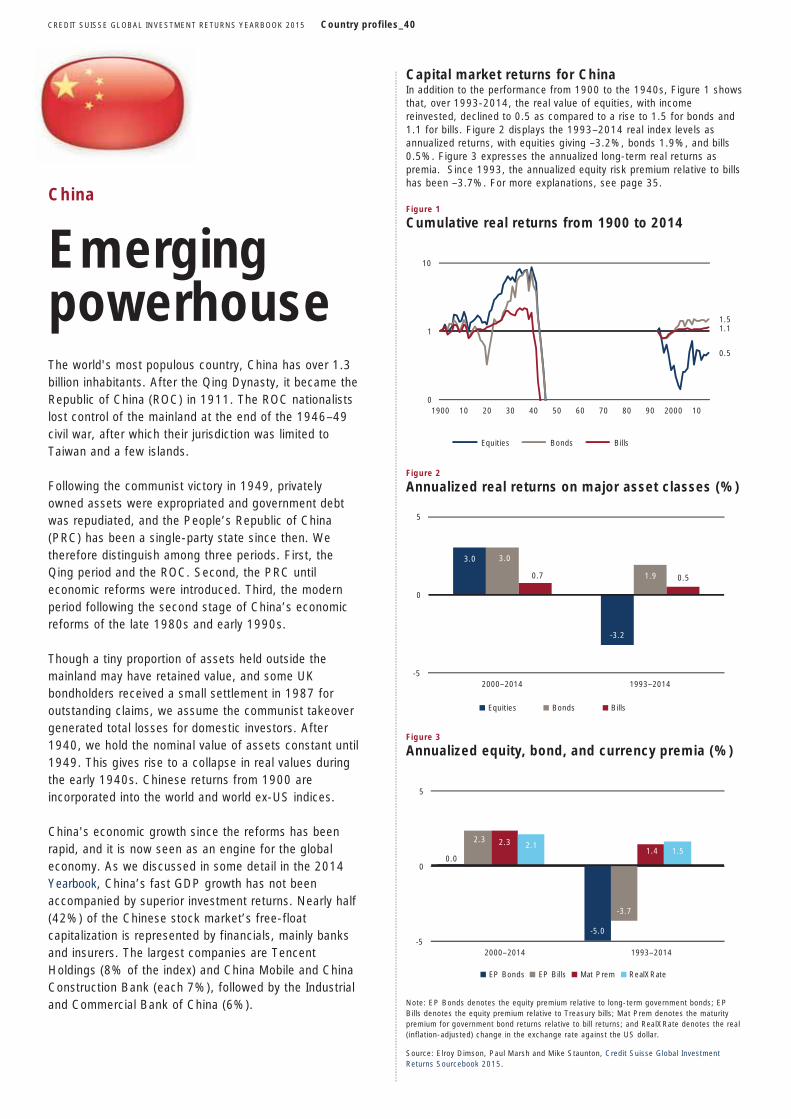
CREDIT SUISSE GLOBAL INVESTMENT RETURNS YEARBOOK 2015 Country profiles_40
China
Emerging powerhouse The world's most populous country, China has over 1.3 billion inhabitants. After the Qing Dynasty, it became the Republic of China (ROC) in 1911. The ROC nationalists lost control of the mainland at the end of the 1946–49 civil war, after which their jurisdiction was limited to Taiwan and a few islands.
Following the communist victory in 1949, privately owned assets were expropriated and government debt was repudiated, and the People’s Republic of China (PRC) has been a single-party state since then. We therefore distinguish among three periods. First, the Qing period and the ROC. Second, the PRC until economic reforms were introduced. Third, the modern period following the second stage of China’s economic reforms of the late 1980s and early 1990s.
Though a tiny proportion of assets held outside the mainland may have retained value, and some UK bondholders received a small settlement in 1987 for outstanding claims, we assume the communist takeover generated total losses for domestic investors. After 1940, we hold the nominal value of assets constant until 1949. This gives rise to a collapse in real values during the early 1940s. Chinese returns from 1900 are incorporated into the world and world ex-US indices.
China's economic growth since the reforms has been rapid, and it is now seen as an engine for the global economy. As we discussed in some detail in the 2014 Yearbook, China’s fast GDP growth has not been accompanied by superior investment returns. Nearly half (42%) of the Chinese stock market’s free-float capitalization is represented by financials, mainly banks and insurers. The largest companies are Tencent Holdings (8% of the index) and China Mobile and China Construction Bank (each 7%), followed by the Industrial and Commercial Bank of China (6%).
Capital market returns for China In addition to the performance from 1900 to the 1940s, Figure 1 shows that, over 1993-2014, the real value of equities, with income reinvested, declined to 0.5 as compared to a rise to 1.5 for bonds and 1.1 for bills. Figure 2 displays the 1993–2014 real index levels as annualized returns, with equities giving –3.2%, bonds 1.9%, and bills 0.5%. Figure 3 expresses the annualized long-term real returns as premia. Since 1993, the annualized equity risk premium relative to bills has been –3.7%. For more explanations, see page 35.
Figure 1
Cumulative real returns from 1900 to 2014
Figure 2
Annualized real returns on major asset classes (%)
Figure 3
Annualized equity, bond, and currency premia (%)
Note: EP Bonds denotes the equity premium relative to long-term government bonds; EP Bills denotes the equity premium relative to Treasury bills; Mat Prem denotes the maturity premium for government bond returns relative to bill returns; and RealXRate denotes the real (inflation-adjusted) change in the exchange rate against the US dollar.
Source: Elroy Dimson, Paul Marsh and Mike Staunton, Credit Suisse Global Investment Returns Sourcebook 2015.
0.5
1.51.1
0
1
10
1900 10 20 30 40 50 60 70 80 90 2000 10
Equities Bonds Bills
3.0
-3.2
3.0
1.90.7 0.5
-5
0
5
2000–2014 1993–2014
Equities Bonds Bills
0.0
-5.0
2.3
-3.7
2.31.4
2.11.5
-5
0
5
2000–2014 1993–2014
EP Bonds EP Bills Mat Prem RealXRate
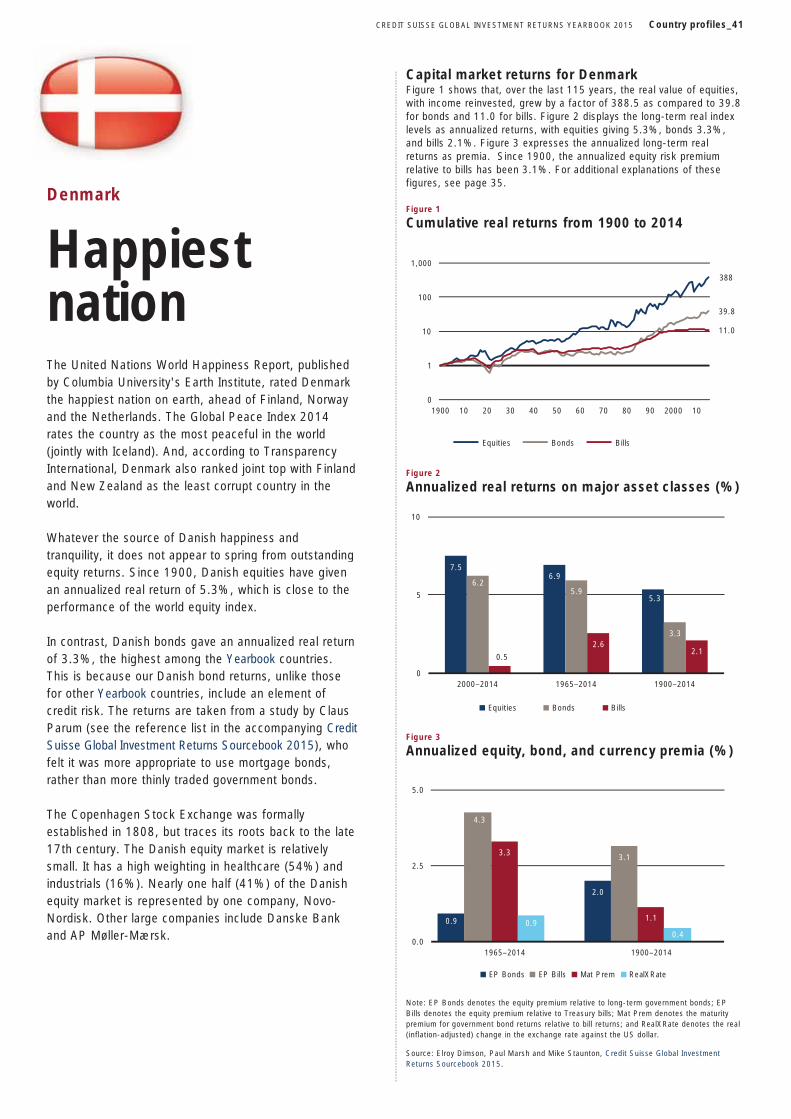
CREDIT SUISSE GLOBAL INVESTMENT RETURNS YEARBOOK 2015 Country profiles_41
Denmark
Happiest nation The United Nations World Happiness Report, published by Columbia University's Earth Institute, rated Denmark the happiest nation on earth, ahead of Finland, Norway and the Netherlands. The Global Peace Index 2014 rates the country as the most peaceful in the world (jointly with Iceland). And, according to Transparency International, Denmark also ranked joint top with Finland and New Zealand as the least corrupt country in the world.
Whatever the source of Danish happiness and tranquility, it does not appear to spring from outstanding equity returns. Since 1900, Danish equities have given an annualized real return of 5.3%, which is close to the performance of the world equity index.
In contrast, Danish bonds gave an annualized real return of 3.3%, the highest among the Yearbook countries. This is because our Danish bond returns, unlike those for other Yearbook countries, include an element of credit risk. The returns are taken from a study by Claus Parum (see the reference list in the accompanying Credit Suisse Global Investment Returns Sourcebook 2015), who felt it was more appropriate to use mortgage bonds, rather than more thinly traded government bonds.
The Copenhagen Stock Exchange was formally established in 1808, but traces its roots back to the late 17th century. The Danish equity market is relatively small. It has a high weighting in healthcare (54%) and industrials (16%). Nearly one half (41%) of the Danish equity market is represented by one company, Novo-Nordisk. Other large companies include Danske Bank and AP Møller-Mærsk.
Capital market returns for Denmark Figure 1 shows that, over the last 115 years, the real value of equities, with income reinvested, grew by a factor of 388.5 as compared to 39.8 for bonds and 11.0 for bills. Figure 2 displays the long-term real index levels as annualized returns, with equities giving 5.3%, bonds 3.3%, and bills 2.1%. Figure 3 expresses the annualized long-term real returns as premia. Since 1900, the annualized equity risk premium relative to bills has been 3.1%. For additional explanations of these figures, see page 35.
Figure 1
Cumulative real returns from 1900 to 2014
Figure 2
Annualized real returns on major asset classes (%)
Figure 3
Annualized equity, bond, and currency premia (%)
Note: EP Bonds denotes the equity premium relative to long-term government bonds; EP Bills denotes the equity premium relative to Treasury bills; Mat Prem denotes the maturity premium for government bond returns relative to bill returns; and RealXRate denotes the real (inflation-adjusted) change in the exchange rate against the US dollar.
Source: Elroy Dimson, Paul Marsh and Mike Staunton, Credit Suisse Global Investment Returns Sourcebook 2015.
388
39.8
11.0
0
1
10
100
1,000
1900 10 20 30 40 50 60 70 80 90 2000 10
Equities Bonds Bills
7.56.9
5.3
6.25.9
3.3
0.5
2.62.1
0
5
10
2000–2014 1965–2014 1900–2014
Equities Bonds Bills
0.9
2.0
4.3
3.13.3
1.10.9
0.40.0
2.5
5.0
1965–2014 1900–2014
EP Bonds EP Bills Mat Prem RealXRate
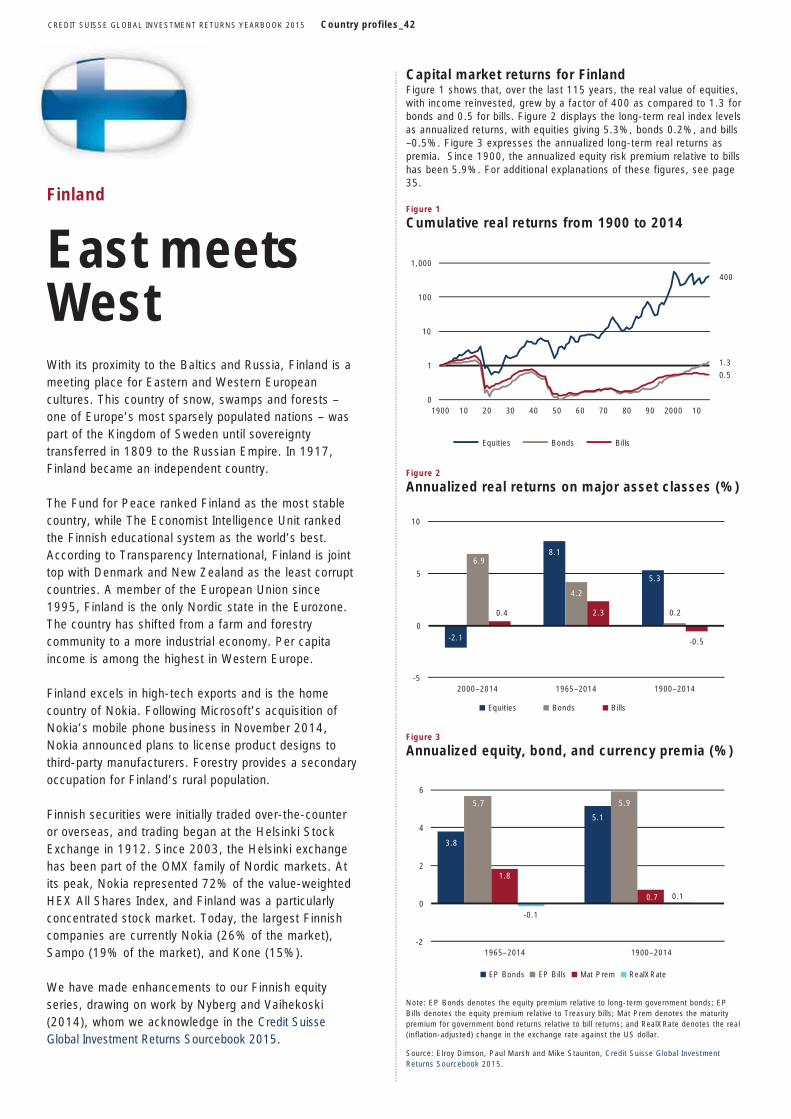
CREDIT SUISSE GLOBAL INVESTMENT RETURNS YEARBOOK 2015 Country profiles_42
Finland
East meets West With its proximity to the Baltics and Russia, Finland is a meeting place for Eastern and Western European cultures. This country of snow, swamps and forests – one of Europe’s most sparsely populated nations – was part of the Kingdom of Sweden until sovereignty transferred in 1809 to the Russian Empire. In 1917, Finland became an independent country.
The Fund for Peace ranked Finland as the most stable country, while The Economist Intelligence Unit ranked the Finnish educational system as the world’s best. According to Transparency International, Finland is joint top with Denmark and New Zealand as the least corrupt countries. A member of the European Union since 1995, Finland is the only Nordic state in the Eurozone. The country has shifted from a farm and forestry community to a more industrial economy. Per capita income is among the highest in Western Europe.
Finland excels in high-tech exports and is the home country of Nokia. Following Microsoft’s acquisition of Nokia’s mobile phone business in November 2014, Nokia announced plans to license product designs to third-party manufacturers. Forestry provides a secondary occupation for Finland’s rural population.
Finnish securities were initially traded over-the-counter or overseas, and trading began at the Helsinki Stock Exchange in 1912. Since 2003, the Helsinki exchange has been part of the OMX family of Nordic markets. At its peak, Nokia represented 72% of the value-weighted HEX All Shares Index, and Finland was a particularly concentrated stock market. Today, the largest Finnish companies are currently Nokia (26% of the market), Sampo (19% of the market), and Kone (15%).
We have made enhancements to our Finnish equity series, drawing on work by Nyberg and Vaihekoski (2014), whom we acknowledge in the Credit Suisse Global Investment Returns Sourcebook 2015.
Capital market returns for Finland Figure 1 shows that, over the last 115 years, the real value of equities, with income reinvested, grew by a factor of 400 as compared to 1.3 for bonds and 0.5 for bills. Figure 2 displays the long-term real index levels as annualized returns, with equities giving 5.3%, bonds 0.2%, and bills –0.5%. Figure 3 expresses the annualized long-term real returns as premia. Since 1900, the annualized equity risk premium relative to bills has been 5.9%. For additional explanations of these figures, see page 35.
Figure 1
Cumulative real returns from 1900 to 2014
Figure 2
Annualized real returns on major asset classes (%)
Figure 3
Annualized equity, bond, and currency premia (%)
Note: EP Bonds denotes the equity premium relative to long-term government bonds; EP Bills denotes the equity premium relative to Treasury bills; Mat Prem denotes the maturity premium for government bond returns relative to bill returns; and RealXRate denotes the real (inflation-adjusted) change in the exchange rate against the US dollar.
Source: Elroy Dimson, Paul Marsh and Mike Staunton, Credit Suisse Global Investment Returns Sourcebook 2015.
400
1.3
0.5
0
1
10
100
1,000
1900 10 20 30 40 50 60 70 80 90 2000 10
Equities Bonds Bills
-2.1
8.1
5.3
6.9
4.2
0.20.4 2.3
-0.5
-5
0
5
10
2000–2014 1965–2014 1900–2014
Equities Bonds Bills
3.8
5.1
5.7 5.9
1.8
0.7
-0.1
0.1
-2
0
2
4
6
1965–2014 1900–2014
EP Bonds EP Bills Mat Prem RealXRate
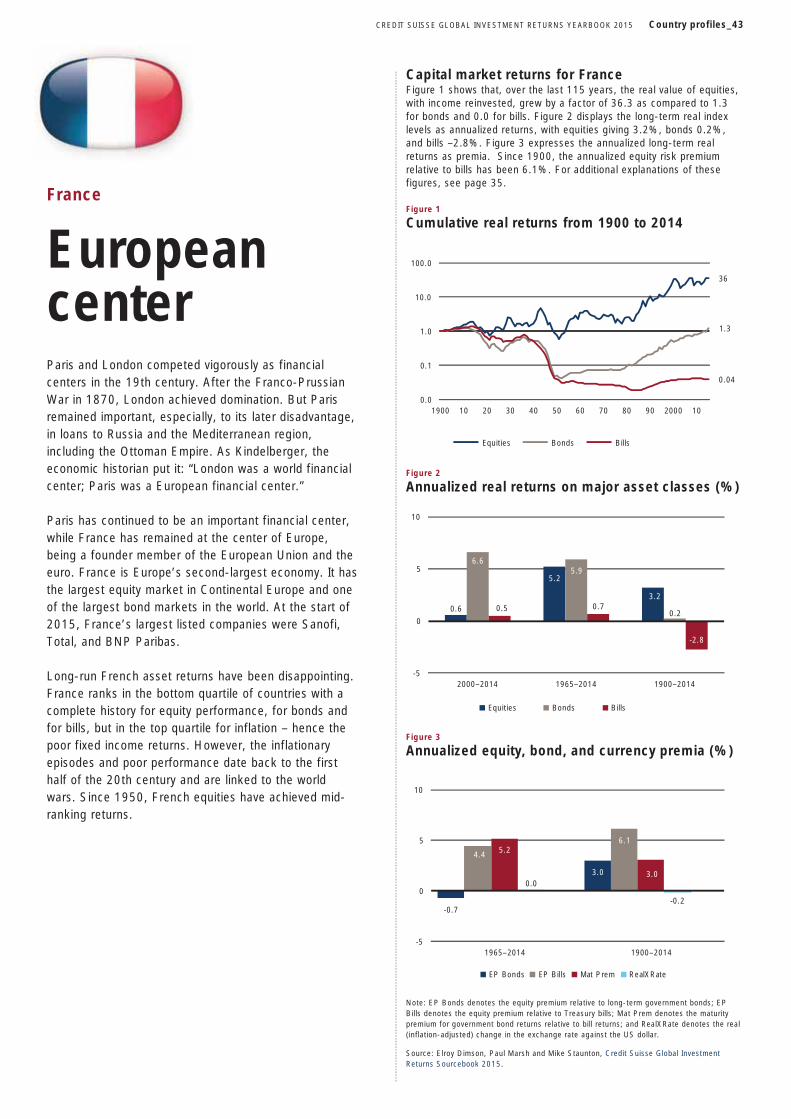
CREDIT SUISSE GLOBAL INVESTMENT RETURNS YEARBOOK 2015 Country profiles_43
France
European center
Paris and London competed vigorously as financial centers in the 19th century. After the Franco-Prussian War in 1870, London achieved domination. But Paris remained important, especially, to its later disadvantage, in loans to Russia and the Mediterranean region, including the Ottoman Empire. As Kindelberger, the economic historian put it: “London was a world financial center; Paris was a European financial center.”
Paris has continued to be an important financial center, while France has remained at the center of Europe, being a founder member of the European Union and the euro. France is Europe’s second-largest economy. It has the largest equity market in Continental Europe and one of the largest bond markets in the world. At the start of 2015, France’s largest listed companies were Sanofi, Total, and BNP Paribas.
Long-run French asset returns have been disappointing. France ranks in the bottom quartile of countries with a complete history for equity performance, for bonds and for bills, but in the top quartile for inflation – hence the poor fixed income returns. However, the inflationary episodes and poor performance date back to the first half of the 20th century and are linked to the world wars. Since 1950, French equities have achieved mid-ranking returns.
Capital market returns for France Figure 1 shows that, over the last 115 years, the real value of equities, with income reinvested, grew by a factor of 36.3 as compared to 1.3 for bonds and 0.0 for bills. Figure 2 displays the long-term real index levels as annualized returns, with equities giving 3.2%, bonds 0.2%, and bills –2.8%. Figure 3 expresses the annualized long-term real returns as premia. Since 1900, the annualized equity risk premium relative to bills has been 6.1%. For additional explanations of these figures, see page 35.
Figure 1
Cumulative real returns from 1900 to 2014
Figure 2
Annualized real returns on major asset classes (%)
Figure 3
Annualized equity, bond, and currency premia (%)
Note: EP Bonds denotes the equity premium relative to long-term government bonds; EP Bills denotes the equity premium relative to Treasury bills; Mat Prem denotes the maturity premium for government bond returns relative to bill returns; and RealXRate denotes the real (inflation-adjusted) change in the exchange rate against the US dollar.
Source: Elroy Dimson, Paul Marsh and Mike Staunton, Credit Suisse Global Investment Returns Sourcebook 2015.
36
1.3
0.04
0.0
0.1
1.0
10.0
100.0
1900 10 20 30 40 50 60 70 80 90 2000 10
Equities Bonds Bills
0.6
5.2
3.2
6.65.9
0.20.5 0.7
-2.8
-5
0
5
10
2000–2014 1965–2014 1900–2014
Equities Bonds Bills
-0.7
3.0
4.4
6.15.2
3.00.0
-0.2
-5
0
5
10
1965–2014 1900–2014
EP Bonds EP Bills Mat Prem RealXRate
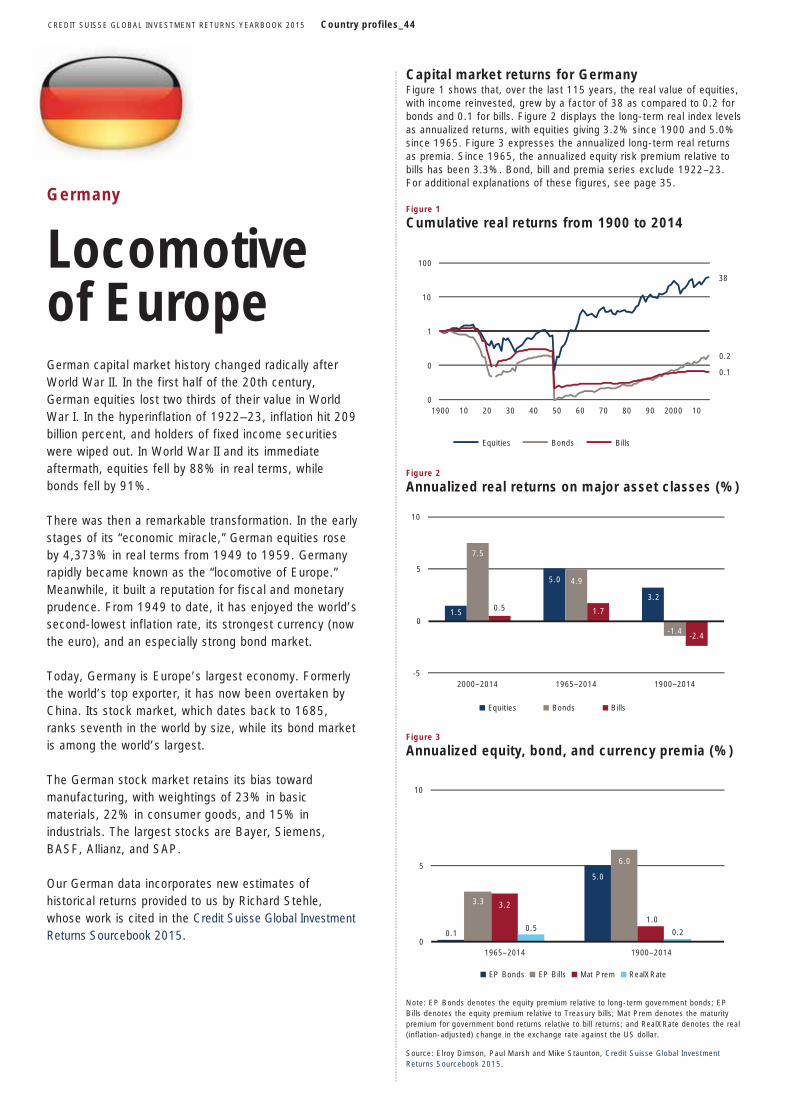
CREDIT SUISSE GLOBAL INVESTMENT RETURNS YEARBOOK 2015 Country profiles_44
Germany
Locomotive of Europe
German capital market history changed radically after World War II. In the first half of the 20th century, German equities lost two thirds of their value in World War I. In the hyperinflation of 1922–23, inflation hit 209 billion percent, and holders of fixed income securities were wiped out. In World War II and its immediate aftermath, equities fell by 88% in real terms, while bonds fell by 91%.
There was then a remarkable transformation. In the early stages of its “economic miracle,” German equities rose by 4,373% in real terms from 1949 to 1959. Germany rapidly became known as the “locomotive of Europe.” Meanwhile, it built a reputation for fiscal and monetary prudence. From 1949 to date, it has enjoyed the world’s second-lowest inflation rate, its strongest currency (now the euro), and an especially strong bond market.
Today, Germany is Europe’s largest economy. Formerly the world’s top exporter, it has now been overtaken by China. Its stock market, which dates back to 1685, ranks seventh in the world by size, while its bond market is among the world’s largest.
The German stock market retains its bias toward manufacturing, with weightings of 23% in basic materials, 22% in consumer goods, and 15% in industrials. The largest stocks are Bayer, Siemens, BASF, Allianz, and SAP.
Our German data incorporates new estimates of historical returns provided to us by Richard Stehle, whose work is cited in the Credit Suisse Global Investment Returns Sourcebook 2015.
Capital market returns for Germany Figure 1 shows that, over the last 115 years, the real value of equities, with income reinvested, grew by a factor of 38 as compared to 0.2 for bonds and 0.1 for bills. Figure 2 displays the long-term real index levels as annualized returns, with equities giving 3.2% since 1900 and 5.0% since 1965. Figure 3 expresses the annualized long-term real returns as premia. Since 1965, the annualized equity risk premium relative to bills has been 3.3%. Bond, bill and premia series exclude 1922–23. For additional explanations of these figures, see page 35.
Figure 1
Cumulative real returns from 1900 to 2014
Figure 2
Annualized real returns on major asset classes (%)
Figure 3
Annualized equity, bond, and currency premia (%)
Note: EP Bonds denotes the equity premium relative to long-term government bonds; EP Bills denotes the equity premium relative to Treasury bills; Mat Prem denotes the maturity premium for government bond returns relative to bill returns; and RealXRate denotes the real (inflation-adjusted) change in the exchange rate against the US dollar.
Source: Elroy Dimson, Paul Marsh and Mike Staunton, Credit Suisse Global Investment Returns Sourcebook 2015.
38
0.2
0.1
0
0
1
10
100
1900 10 20 30 40 50 60 70 80 90 2000 10
Equities Bonds Bills
1.5
5.0
3.2
7.5
4.9
-1.4
0.5 1.7
-2.4
-5
0
5
10
2000–2014 1965–2014 1900–2014
Equities Bonds Bills
0.1
5.0
3.3
6.0
3.2
1.00.5 0.2
0
5
10
1965–2014 1900–2014
EP Bonds EP Bills Mat Prem RealXRate
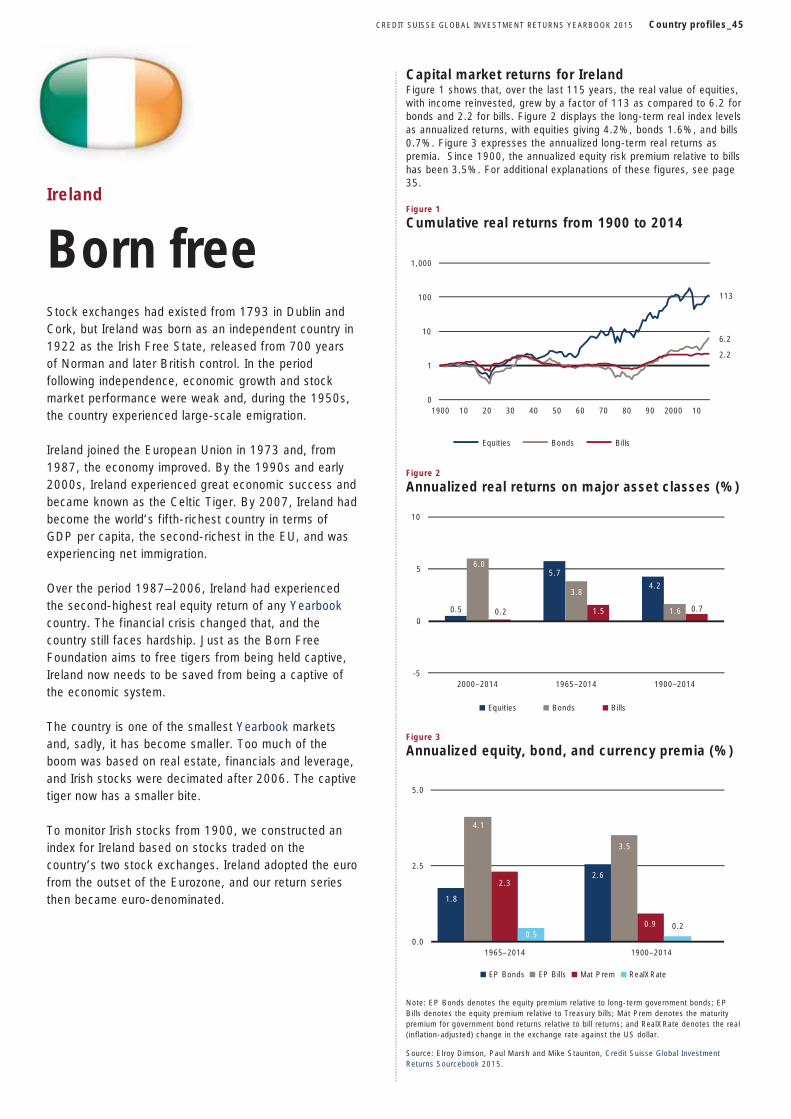
CREDIT SUISSE GLOBAL INVESTMENT RETURNS YEARBOOK 2015 Country profiles_45
Ireland
Born free
Stock exchanges had existed from 1793 in Dublin and Cork, but Ireland was born as an independent country in 1922 as the Irish Free State, released from 700 years of Norman and later British control. In the period following independence, economic growth and stock market performance were weak and, during the 1950s, the country experienced large-scale emigration.
Ireland joined the European Union in 1973 and, from 1987, the economy improved. By the 1990s and early 2000s, Ireland experienced great economic success and became known as the Celtic Tiger. By 2007, Ireland had become the world’s fifth-richest country in terms of GDP per capita, the second-richest in the EU, and was experiencing net immigration.
Over the period 1987–2006, Ireland had experienced the second-highest real equity return of any Yearbook country. The financial crisis changed that, and the country still faces hardship. Just as the Born Free Foundation aims to free tigers from being held captive, Ireland now needs to be saved from being a captive of the economic system.
The country is one of the smallest Yearbook markets and, sadly, it has become smaller. Too much of the boom was based on real estate, financials and leverage, and Irish stocks were decimated after 2006. The captivetiger now has a smaller bite.
To monitor Irish stocks from 1900, we constructed an index for Ireland based on stocks traded on the country’s two stock exchanges. Ireland adopted the euro from the outset of the Eurozone, and our return series then became euro-denominated.
Capital market returns for Ireland Figure 1 shows that, over the last 115 years, the real value of equities, with income reinvested, grew by a factor of 113 as compared to 6.2 for bonds and 2.2 for bills. Figure 2 displays the long-term real index levels as annualized returns, with equities giving 4.2%, bonds 1.6%, and bills 0.7%. Figure 3 expresses the annualized long-term real returns as premia. Since 1900, the annualized equity risk premium relative to bills has been 3.5%. For additional explanations of these figures, see page 35.
Figure 1
Cumulative real returns from 1900 to 2014
Figure 2
Annualized real returns on major asset classes (%)
Figure 3
Annualized equity, bond, and currency premia (%)
Note: EP Bonds denotes the equity premium relative to long-term government bonds; EP Bills denotes the equity premium relative to Treasury bills; Mat Prem denotes the maturity premium for government bond returns relative to bill returns; and RealXRate denotes the real (inflation-adjusted) change in the exchange rate against the US dollar.
Source: Elroy Dimson, Paul Marsh and Mike Staunton, Credit Suisse Global Investment Returns Sourcebook 2015.
113
6.2
2.2
0
1
10
100
1,000
1900 10 20 30 40 50 60 70 80 90 2000 10
Equities Bonds Bills
0.5
5.7
4.2
6.0
3.8
1.60.2 1.5 0.7
-5
0
5
10
2000–2014 1965–2014 1900–2014
Equities Bonds Bills
1.8
2.6
4.1
3.5
2.3
0.90.5
0.2
0.0
2.5
5.0
1965–2014 1900–2014
EP Bonds EP Bills Mat Prem RealXRate
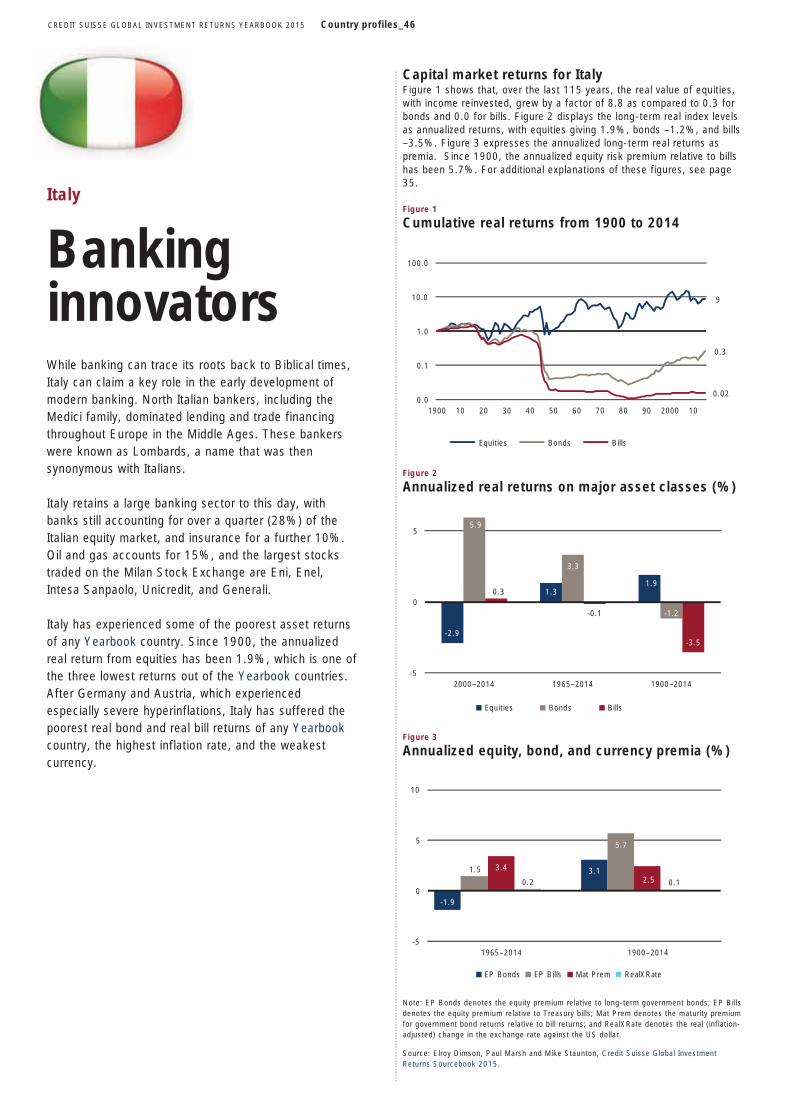
CREDIT SUISSE GLOBAL INVESTMENT RETURNS YEARBOOK 2015 Country profiles_46
Italy
Banking innovators
While banking can trace its roots back to Biblical times, Italy can claim a key role in the early development of modern banking. North Italian bankers, including the Medici family, dominated lending and trade financing throughout Europe in the Middle Ages. These bankers were known as Lombards, a name that was then synonymous with Italians.
Italy retains a large banking sector to this day, with banks still accounting for over a quarter (28%) of the Italian equity market, and insurance for a further 10%. Oil and gas accounts for 15%, and the largest stocks traded on the Milan Stock Exchange are Eni, Enel, Intesa Sanpaolo, Unicredit, and Generali.
Italy has experienced some of the poorest asset returns of any Yearbook country. Since 1900, the annualized real return from equities has been 1.9%, which is one of the three lowest returns out of the Yearbook countries. After Germany and Austria, which experienced especially severe hyperinflations, Italy has suffered the poorest real bond and real bill returns of any Yearbook country, the highest inflation rate, and the weakest currency.
Capital market returns for Italy Figure 1 shows that, over the last 115 years, the real value of equities, with income reinvested, grew by a factor of 8.8 as compared to 0.3 for bonds and 0.0 for bills. Figure 2 displays the long-term real index levels as annualized returns, with equities giving 1.9%, bonds –1.2%, and bills –3.5%. Figure 3 expresses the annualized long-term real returns as premia. Since 1900, the annualized equity risk premium relative to bills has been 5.7%. For additional explanations of these figures, see page 35.
Figure 1
Cumulative real returns from 1900 to 2014
Figure 2
Annualized real returns on major asset classes (%)
Figure 3
Annualized equity, bond, and currency premia (%)
Note: EP Bonds denotes the equity premium relative to long-term government bonds; EP Bills denotes the equity premium relative to Treasury bills; Mat Prem denotes the maturity premium for government bond returns relative to bill returns; and RealXRate denotes the real (inflation-adjusted) change in the exchange rate against the US dollar.
Source: Elroy Dimson, Paul Marsh and Mike Staunton, Credit Suisse Global Investment Returns Sourcebook 2015.
9
0.3
0.020.0
0.1
1.0
10.0
100.0
1900 10 20 30 40 50 60 70 80 90 2000 10
Equities Bonds Bills
-2.9
1.31.9
5.9
3.3
-1.2
0.3
-0.1
-3.5
-5
0
5
2000–2014 1965–2014 1900–2014
Equities Bonds Bills
-1.9
3.11.5
5.7
3.4
2.50.2 0.1
-5
0
5
10
1965–2014 1900–2014
EP Bonds EP Bills Mat Prem RealXRate
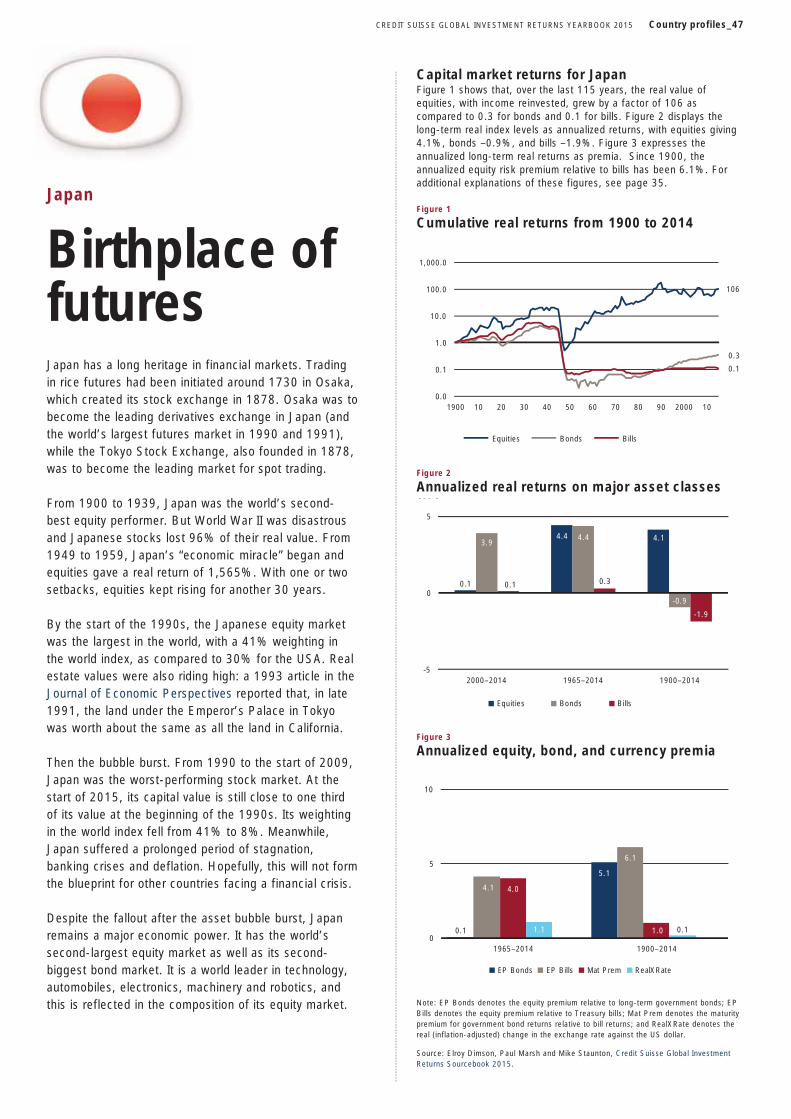
CREDIT SUISSE GLOBAL INVESTMENT RETURNS YEARBOOK 2015 Country profiles_47
Japan
Birthplace of futures Japan has a long heritage in financial markets. Trading in rice futures had been initiated around 1730 in Osaka, which created its stock exchange in 1878. Osaka was to become the leading derivatives exchange in Japan (and the world’s largest futures market in 1990 and 1991), while the Tokyo Stock Exchange, also founded in 1878, was to become the leading market for spot trading.
From 1900 to 1939, Japan was the world’s second-best equity performer. But World War II was disastrous and Japanese stocks lost 96% of their real value. From 1949 to 1959, Japan’s “economic miracle” began and equities gave a real return of 1,565%. With one or two setbacks, equities kept rising for another 30 years.
By the start of the 1990s, the Japanese equity market was the largest in the world, with a 41% weighting in the world index, as compared to 30% for the USA. Real estate values were also riding high: a 1993 article in the Journal of Economic Perspectives reported that, in late 1991, the land under the Emperor’s Palace in Tokyo was worth about the same as all the land in California.
Then the bubble burst. From 1990 to the start of 2009, Japan was the worst-performing stock market. At the start of 2015, its capital value is still close to one third of its value at the beginning of the 1990s. Its weighting in the world index fell from 41% to 8%. Meanwhile, Japan suffered a prolonged period of stagnation, banking crises and deflation. Hopefully, this will not form the blueprint for other countries facing a financial crisis.
Despite the fallout after the asset bubble burst, Japan remains a major economic power. It has the world’s second-largest equity market as well as its second-biggest bond market. It is a world leader in technology, automobiles, electronics, machinery and robotics, and this is reflected in the composition of its equity market.
Capital market returns for Japan Figure 1 shows that, over the last 115 years, the real value of equities, with income reinvested, grew by a factor of 106 as compared to 0.3 for bonds and 0.1 for bills. Figure 2 displays the long-term real index levels as annualized returns, with equities giving 4.1%, bonds –0.9%, and bills –1.9%. Figure 3 expresses the annualized long-term real returns as premia. Since 1900, the annualized equity risk premium relative to bills has been 6.1%. For additional explanations of these figures, see page 35.
Figure 1
Cumulative real returns from 1900 to 2014
Figure 2
Annualized real returns on major asset classes (%)
Figure 3
Annualized equity, bond, and currency premia ( )
Note: EP Bonds denotes the equity premium relative to long-term government bonds; EP Bills denotes the equity premium relative to Treasury bills; Mat Prem denotes the maturity premium for government bond returns relative to bill returns; and RealXRate denotes the real (inflation-adjusted) change in the exchange rate against the US dollar.
Source: Elroy Dimson, Paul Marsh and Mike Staunton, Credit Suisse Global Investment Returns Sourcebook 2015.
106
0.3
0.1
0.0
0.1
1.0
10.0
100.0
1,000.0
1900 10 20 30 40 50 60 70 80 90 2000 10
Equities Bonds Bills
0.1
4.4 4.13.9
4.4
-0.9
0.1 0.3
-1.9
-5
0
5
2000–2014 1965–2014 1900–2014
Equities Bonds Bills
0.1
5.1
4.1
6.1
4.0
1.01.1 0.10
5
10
1965–2014 1900–2014
EP Bonds EP Bills Mat Prem RealXRate
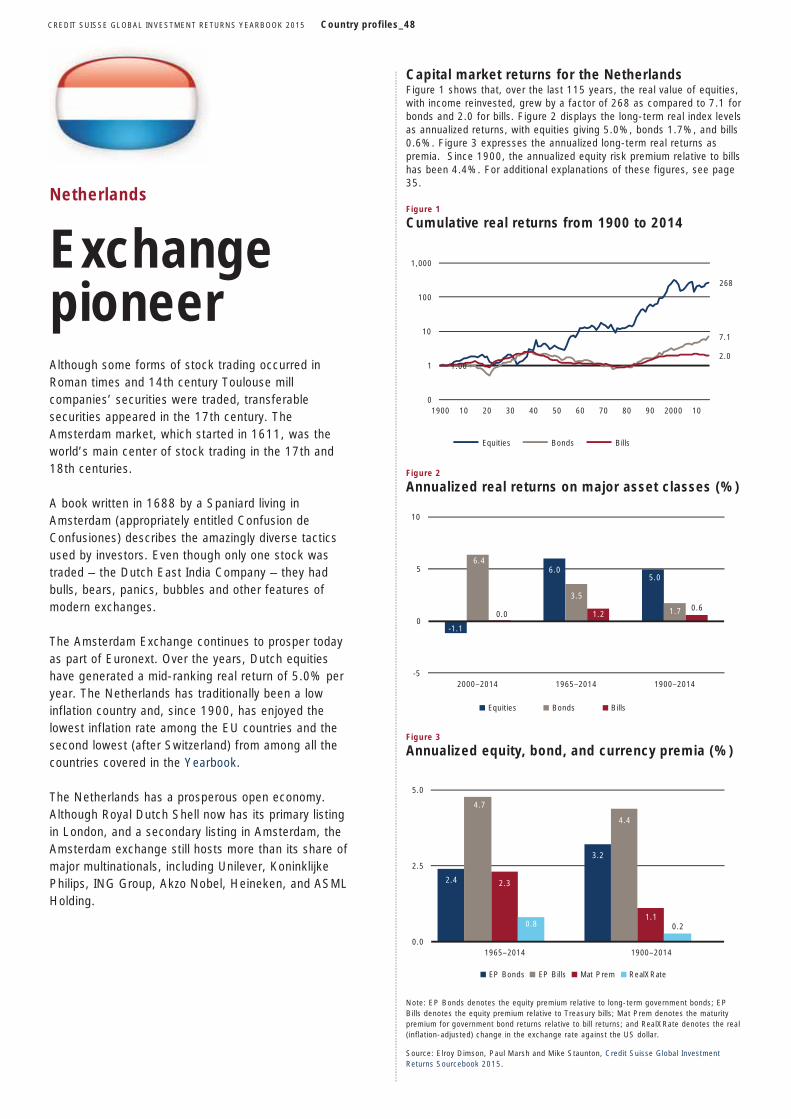
CREDIT SUISSE GLOBAL INVESTMENT RETURNS YEARBOOK 2015 Country profiles_48
Netherlands
Exchange pioneer
Although some forms of stock trading occurred in Roman times and 14th century Toulouse mill companies’ securities were traded, transferable securities appeared in the 17th century. The Amsterdam market, which started in 1611, was the world’s main center of stock trading in the 17th and 18th centuries.
A book written in 1688 by a Spaniard living in Amsterdam (appropriately entitled Confusion de Confusiones) describes the amazingly diverse tactics used by investors. Even though only one stock was traded – the Dutch East India Company – they had bulls, bears, panics, bubbles and other features of modern exchanges.
The Amsterdam Exchange continues to prosper today as part of Euronext. Over the years, Dutch equities have generated a mid-ranking real return of 5.0% per year. The Netherlands has traditionally been a low inflation country and, since 1900, has enjoyed the lowest inflation rate among the EU countries and the second lowest (after Switzerland) from among all the countries covered in the Yearbook.
The Netherlands has a prosperous open economy. Although Royal Dutch Shell now has its primary listing in London, and a secondary listing in Amsterdam, the Amsterdam exchange still hosts more than its share of major multinationals, including Unilever, Koninklijke Philips, ING Group, Akzo Nobel, Heineken, and ASML Holding.
Capital market returns for the Netherlands Figure 1 shows that, over the last 115 years, the real value of equities, with income reinvested, grew by a factor of 268 as compared to 7.1 for bonds and 2.0 for bills. Figure 2 displays the long-term real index levels as annualized returns, with equities giving 5.0%, bonds 1.7%, and bills 0.6%. Figure 3 expresses the annualized long-term real returns as premia. Since 1900, the annualized equity risk premium relative to bills has been 4.4%. For additional explanations of these figures, see page 35.
Figure 1
Cumulative real returns from 1900 to 2014
Figure 2
Annualized real returns on major asset classes (%)
Figure 3
Annualized equity, bond, and currency premia (%)
Note: EP Bonds denotes the equity premium relative to long-term government bonds; EP Bills denotes the equity premium relative to Treasury bills; Mat Prem denotes the maturity premium for government bond returns relative to bill returns; and RealXRate denotes the real (inflation-adjusted) change in the exchange rate against the US dollar.
Source: Elroy Dimson, Paul Marsh and Mike Staunton, Credit Suisse Global Investment Returns Sourcebook 2015.
268
1.00
7.1
2.0
0
1
10
100
1,000
1900 10 20 30 40 50 60 70 80 90 2000 10
Equities Bonds Bills
-1.1
6.05.0
6.4
3.5
1.70.0 1.20.6
-5
0
5
10
2000–2014 1965–2014 1900–2014
Equities Bonds Bills
2.4
3.2
4.7
4.4
2.3
1.10.8 0.2
0.0
2.5
5.0
1965–2014 1900–2014
EP Bonds EP Bills Mat Prem RealXRate
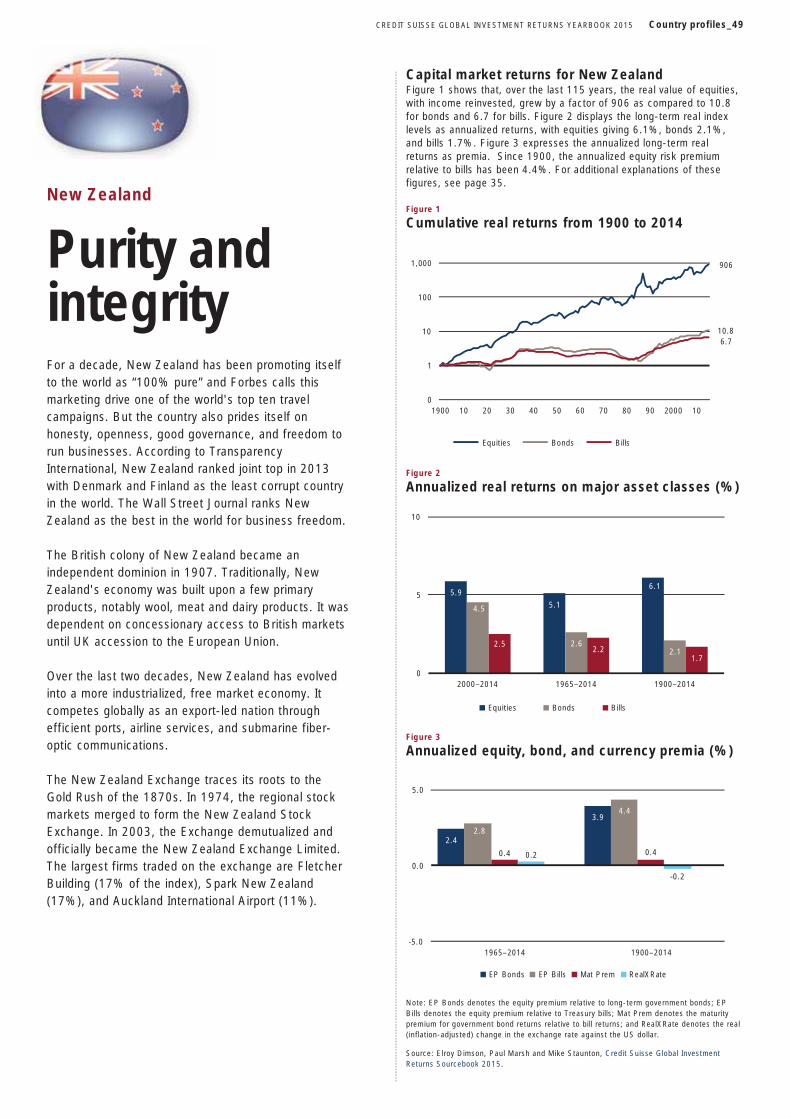
CREDIT SUISSE GLOBAL INVESTMENT RETURNS YEARBOOK 2015 Country profiles_49
New Zealand
Purity and integrity
For a decade, New Zealand has been promoting itself to the world as “100% pure” and Forbes calls this marketing drive one of the world's top ten travel campaigns. But the country also prides itself on honesty, openness, good governance, and freedom to run businesses. According to Transparency International, New Zealand ranked joint top in 2013 with Denmark and Finland as the least corrupt country in the world. The Wall Street Journal ranks New Zealand as the best in the world for business freedom.
The British colony of New Zealand became an independent dominion in 1907. Traditionally, New Zealand's economy was built upon a few primary products, notably wool, meat and dairy products. It was dependent on concessionary access to British markets until UK accession to the European Union.
Over the last two decades, New Zealand has evolved into a more industrialized, free market economy. It competes globally as an export-led nation through efficient ports, airline services, and submarine fiber-optic communications.
The New Zealand Exchange traces its roots to the Gold Rush of the 1870s. In 1974, the regional stock markets merged to form the New Zealand Stock Exchange. In 2003, the Exchange demutualized and officially became the New Zealand Exchange Limited. The largest firms traded on the exchange are Fletcher Building (17% of the index), Spark New Zealand (17%), and Auckland International Airport (11%).
Capital market returns for New Zealand Figure 1 shows that, over the last 115 years, the real value of equities, with income reinvested, grew by a factor of 906 as compared to 10.8 for bonds and 6.7 for bills. Figure 2 displays the long-term real index levels as annualized returns, with equities giving 6.1%, bonds 2.1%, and bills 1.7%. Figure 3 expresses the annualized long-term real returns as premia. Since 1900, the annualized equity risk premium relative to bills has been 4.4%. For additional explanations of these figures, see page 35.
Figure 1
Cumulative real returns from 1900 to 2014
Figure 2
Annualized real returns on major asset classes (%)
Figure 3
Annualized equity, bond, and currency premia (%)
Note: EP Bonds denotes the equity premium relative to long-term government bonds; EP Bills denotes the equity premium relative to Treasury bills; Mat Prem denotes the maturity premium for government bond returns relative to bill returns; and RealXRate denotes the real (inflation-adjusted) change in the exchange rate against the US dollar.
Source: Elroy Dimson, Paul Marsh and Mike Staunton, Credit Suisse Global Investment Returns Sourcebook 2015.
906
10.86.7
0
1
10
100
1,000
1900 10 20 30 40 50 60 70 80 90 2000 10
Equities Bonds Bills
5.9
5.1
6.1
4.5
2.62.1
2.52.2
1.7
0
5
10
2000–2014 1965–2014 1900–2014
Equities Bonds Bills
2.4
3.9
2.8
4.4
0.4 0.40.2
-0.2
-5.0
0.0
5.0
1965–2014 1900–2014
EP Bonds EP Bills Mat Prem RealXRate
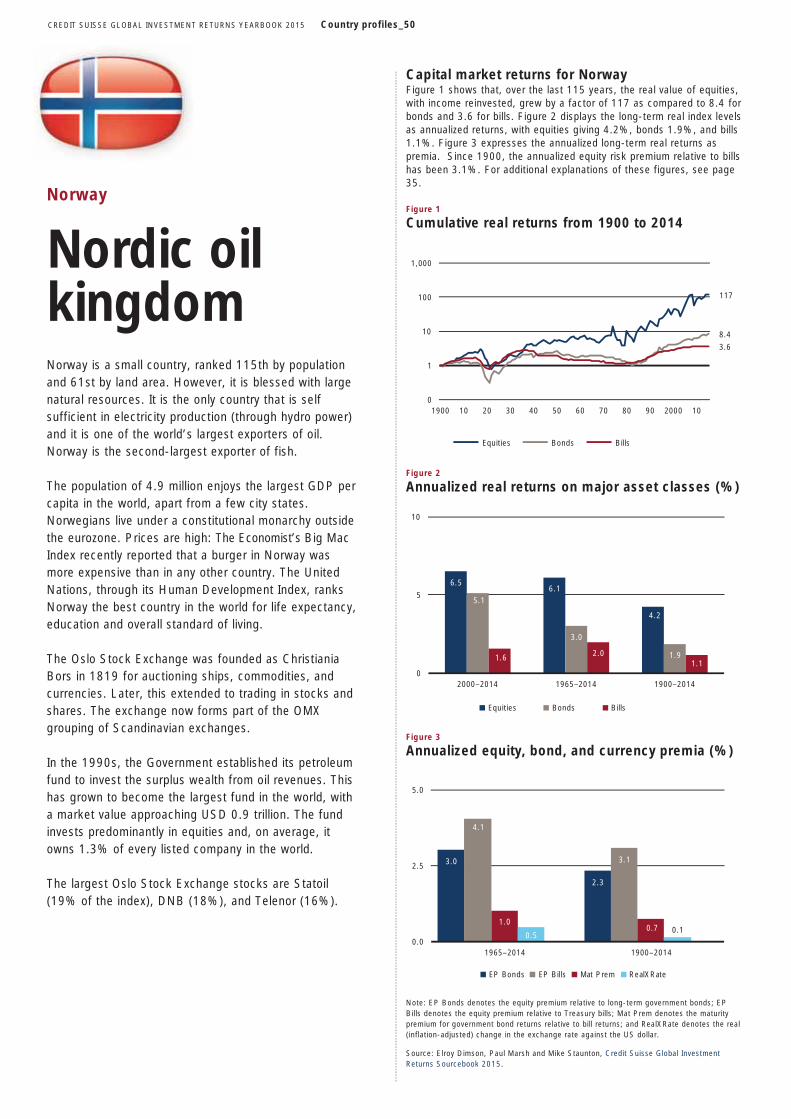
CREDIT SUISSE GLOBAL INVESTMENT RETURNS YEARBOOK 2015 Country profiles_50
Norway
Nordic oil kingdom
Norway is a small country, ranked 115th by population and 61st by land area. However, it is blessed with large natural resources. It is the only country that is self sufficient in electricity production (through hydro power) and it is one of the world’s largest exporters of oil. Norway is the second-largest exporter of fish.
The population of 4.9 million enjoys the largest GDP per capita in the world, apart from a few city states. Norwegians live under a constitutional monarchy outside the eurozone. Prices are high: The Economist’s Big Mac Index recently reported that a burger in Norway was more expensive than in any other country. The United Nations, through its Human Development Index, ranks Norway the best country in the world for life expectancy, education and overall standard of living.
The Oslo Stock Exchange was founded as Christiania Bors in 1819 for auctioning ships, commodities, and currencies. Later, this extended to trading in stocks and shares. The exchange now forms part of the OMX grouping of Scandinavian exchanges.
In the 1990s, the Government established its petroleum fund to invest the surplus wealth from oil revenues. This has grown to become the largest fund in the world, with a market value approaching USD 0.9 trillion. The fund invests predominantly in equities and, on average, it owns 1.3% of every listed company in the world.
The largest Oslo Stock Exchange stocks are Statoil (19% of the index), DNB (18%), and Telenor (16%).
Capital market returns for Norway Figure 1 shows that, over the last 115 years, the real value of equities, with income reinvested, grew by a factor of 117 as compared to 8.4 for bonds and 3.6 for bills. Figure 2 displays the long-term real index levels as annualized returns, with equities giving 4.2%, bonds 1.9%, and bills 1.1%. Figure 3 expresses the annualized long-term real returns as premia. Since 1900, the annualized equity risk premium relative to bills has been 3.1%. For additional explanations of these figures, see page 35.
Figure 1
Cumulative real returns from 1900 to 2014
Figure 2
Annualized real returns on major asset classes (%)
Figure 3
Annualized equity, bond, and currency premia (%)
Note: EP Bonds denotes the equity premium relative to long-term government bonds; EP Bills denotes the equity premium relative to Treasury bills; Mat Prem denotes the maturity premium for government bond returns relative to bill returns; and RealXRate denotes the real (inflation-adjusted) change in the exchange rate against the US dollar.
Source: Elroy Dimson, Paul Marsh and Mike Staunton, Credit Suisse Global Investment Returns Sourcebook 2015.
117
8.4
3.6
0
1
10
100
1,000
1900 10 20 30 40 50 60 70 80 90 2000 10
Equities Bonds Bills
6.56.1
4.2
5.1
3.0
1.91.6 2.01.1
0
5
10
2000–2014 1965–2014 1900–2014
Equities Bonds Bills
3.0
2.3
4.1
3.1
1.00.7
0.50.1
0.0
2.5
5.0
1965–2014 1900–2014
EP Bonds EP Bills Mat Prem RealXRate
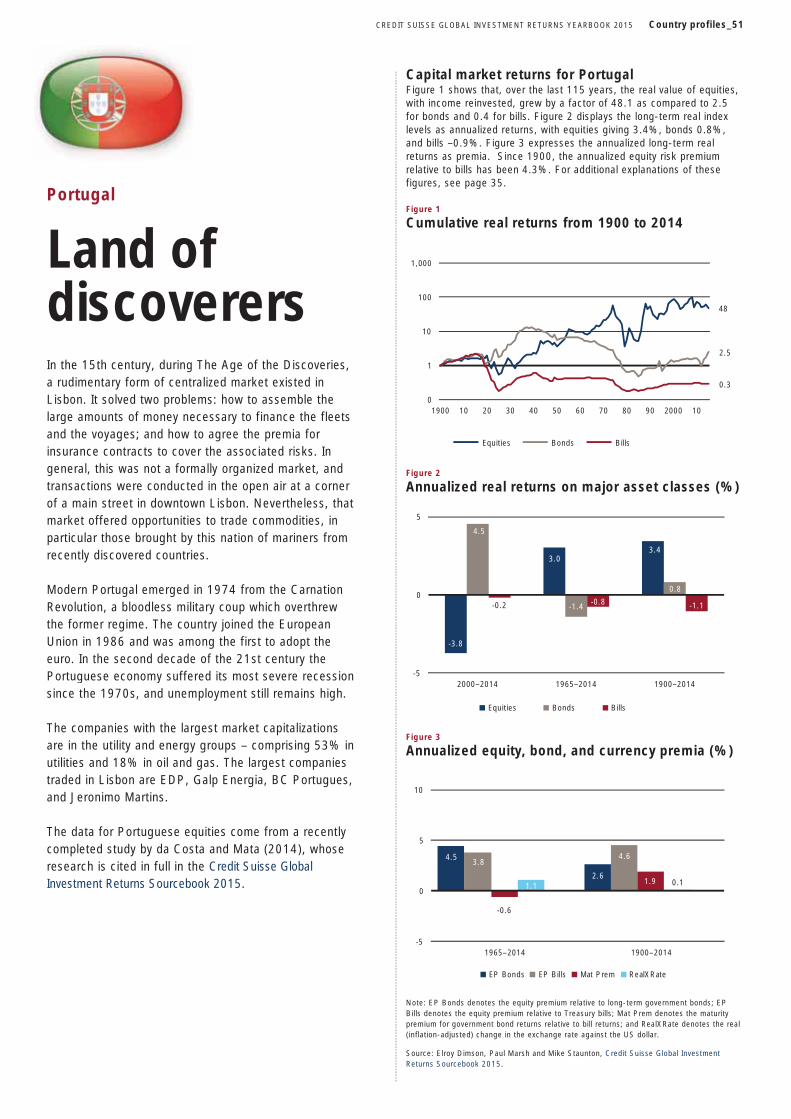
CREDIT SUISSE GLOBAL INVESTMENT RETURNS YEARBOOK 2015 Country profiles_51
Portugal
Land of discoverers
In the 15th century, during The Age of the Discoveries, a rudimentary form of centralized market existed in Lisbon. It solved two problems: how to assemble the large amounts of money necessary to finance the fleets and the voyages; and how to agree the premia for insurance contracts to cover the associated risks. In general, this was not a formally organized market, and transactions were conducted in the open air at a corner of a main street in downtown Lisbon. Nevertheless, that market offered opportunities to trade commodities, in particular those brought by this nation of mariners from recently discovered countries.
Modern Portugal emerged in 1974 from the Carnation Revolution, a bloodless military coup which overthrew the former regime. The country joined the European Union in 1986 and was among the first to adopt the euro. In the second decade of the 21st century the Portuguese economy suffered its most severe recession since the 1970s, and unemployment still remains high.
The companies with the largest market capitalizations are in the utility and energy groups – comprising 53% in utilities and 18% in oil and gas. The largest companies traded in Lisbon are EDP, Galp Energia, BC Portugues, and Jeronimo Martins.
The data for Portuguese equities come from a recently completed study by da Costa and Mata (2014), whose research is cited in full in the Credit Suisse Global Investment Returns Sourcebook 2015.
Capital market returns for Portugal Figure 1 shows that, over the last 115 years, the real value of equities, with income reinvested, grew by a factor of 48.1 as compared to 2.5 for bonds and 0.4 for bills. Figure 2 displays the long-term real index levels as annualized returns, with equities giving 3.4%, bonds 0.8%, and bills –0.9%. Figure 3 expresses the annualized long-term real returns as premia. Since 1900, the annualized equity risk premium relative to bills has been 4.3%. For additional explanations of these figures, see page 35.
Figure 1
Cumulative real returns from 1900 to 2014
Figure 2
Annualized real returns on major asset classes (%)
Figure 3
Annualized equity, bond, and currency premia (%)
Note: EP Bonds denotes the equity premium relative to long-term government bonds; EP Bills denotes the equity premium relative to Treasury bills; Mat Prem denotes the maturity premium for government bond returns relative to bill returns; and RealXRate denotes the real (inflation-adjusted) change in the exchange rate against the US dollar.
Source: Elroy Dimson, Paul Marsh and Mike Staunton, Credit Suisse Global Investment Returns Sourcebook 2015.
48
2.5
0.3
0
1
10
100
1,000
1900 10 20 30 40 50 60 70 80 90 2000 10
Equities Bonds Bills
-3.8
3.03.4
4.5
-1.4
0.8
-0.2 -0.8 -1.1
-5
0
5
2000–2014 1965–2014 1900–2014
Equities Bonds Bills
4.5
2.6
3.84.6
-0.6
1.91.1 0.1
-5
0
5
10
1965–2014 1900–2014
EP Bonds EP Bills Mat Prem RealXRate
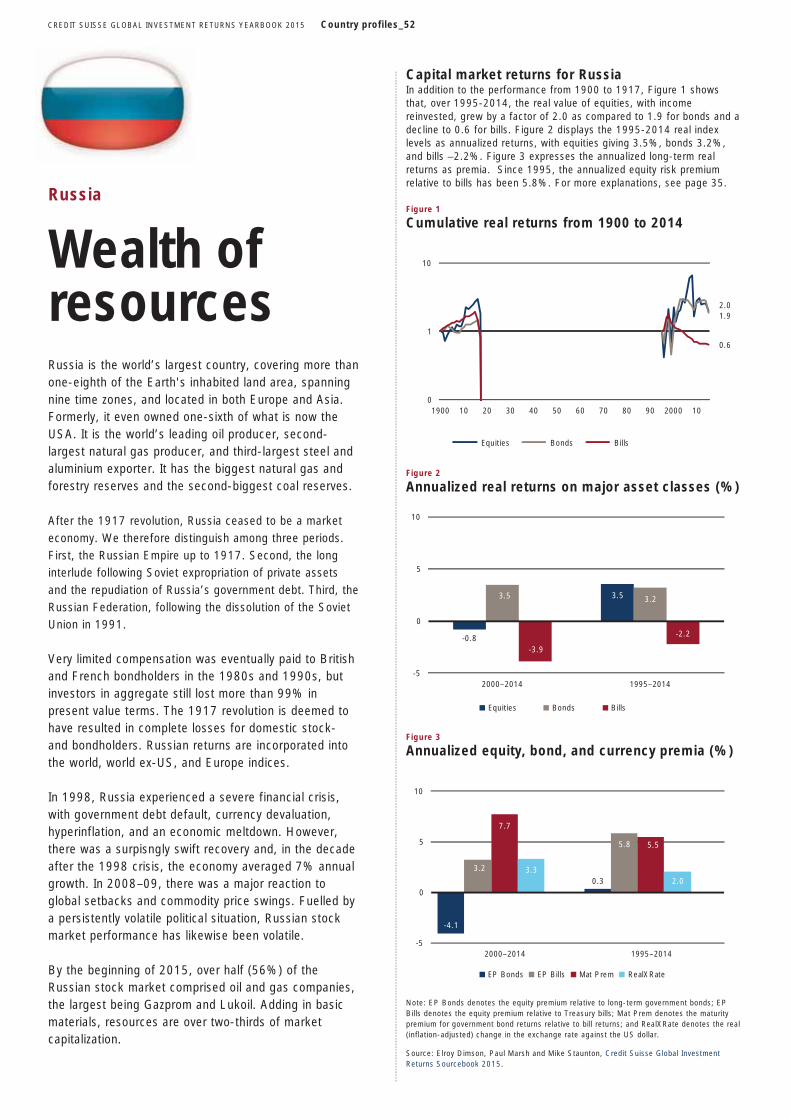
CREDIT SUISSE GLOBAL INVESTMENT RETURNS YEARBOOK 2015 Country profiles_52
Russia
Wealth of resources Russia is the world’s largest country, covering more than one-eighth of the Earth's inhabited land area, spanning nine time zones, and located in both Europe and Asia. Formerly, it even owned one-sixth of what is now the USA. It is the world’s leading oil producer, second-largest natural gas producer, and third-largest steel and aluminium exporter. It has the biggest natural gas and forestry reserves and the second-biggest coal reserves.
After the 1917 revolution, Russia ceased to be a market economy. We therefore distinguish among three periods. First, the Russian Empire up to 1917. Second, the long interlude following Soviet expropriation of private assets and the repudiation of Russia’s government debt. Third, the Russian Federation, following the dissolution of the Soviet Union in 1991.
Very limited compensation was eventually paid to British and French bondholders in the 1980s and 1990s, but investors in aggregate still lost more than 99% in present value terms. The 1917 revolution is deemed to have resulted in complete losses for domestic stock- and bondholders. Russian returns are incorporated into the world, world ex-US, and Europe indices.
In 1998, Russia experienced a severe financial crisis, with government debt default, currency devaluation, hyperinflation, and an economic meltdown. However, there was a surpisngly swift recovery and, in the decade after the 1998 crisis, the economy averaged 7% annual growth. In 2008–09, there was a major reaction to global setbacks and commodity price swings. Fuelled by a persistently volatile political situation, Russian stock market performance has likewise been volatile.
By the beginning of 2015, over half (56%) of the Russian stock market comprised oil and gas companies, the largest being Gazprom and Lukoil. Adding in basic materials, resources are over two-thirds of market capitalization.
Capital market returns for Russia In addition to the performance from 1900 to 1917, Figure 1 shows that, over 1995-2014, the real value of equities, with income reinvested, grew by a factor of 2.0 as compared to 1.9 for bonds and a decline to 0.6 for bills. Figure 2 displays the 1995-2014 real index levels as annualized returns, with equities giving 3.5%, bonds 3.2%, and bills –2.2%. Figure 3 expresses the annualized long-term real returns as premia. Since 1995, the annualized equity risk premium relative to bills has been 5.8%. For more explanations, see page 35.
Figure 1
Cumulative real returns from 1900 to 2014
Figure 2
Annualized real returns on major asset classes (%)
Figure 3
Annualized equity, bond, and currency premia (%)
Note: EP Bonds denotes the equity premium relative to long-term government bonds; EP Bills denotes the equity premium relative to Treasury bills; Mat Prem denotes the maturity premium for government bond returns relative to bill returns; and RealXRate denotes the real (inflation-adjusted) change in the exchange rate against the US dollar.
Source: Elroy Dimson, Paul Marsh and Mike Staunton, Credit Suisse Global Investment Returns Sourcebook 2015.
2.01.9
0.6
0
1
10
1900 10 20 30 40 50 60 70 80 90 2000 10
Equities Bonds Bills
-0.8
3.53.5 3.2
-3.9
-2.2
-5
0
5
10
2000–2014 1995–2014
Equities Bonds Bills
-4.1
0.3
3.2
5.8
7.7
5.5
3.32.0
-5
0
5
10
2000–2014 1995–2014
EP Bonds EP Bills Mat Prem RealXRate
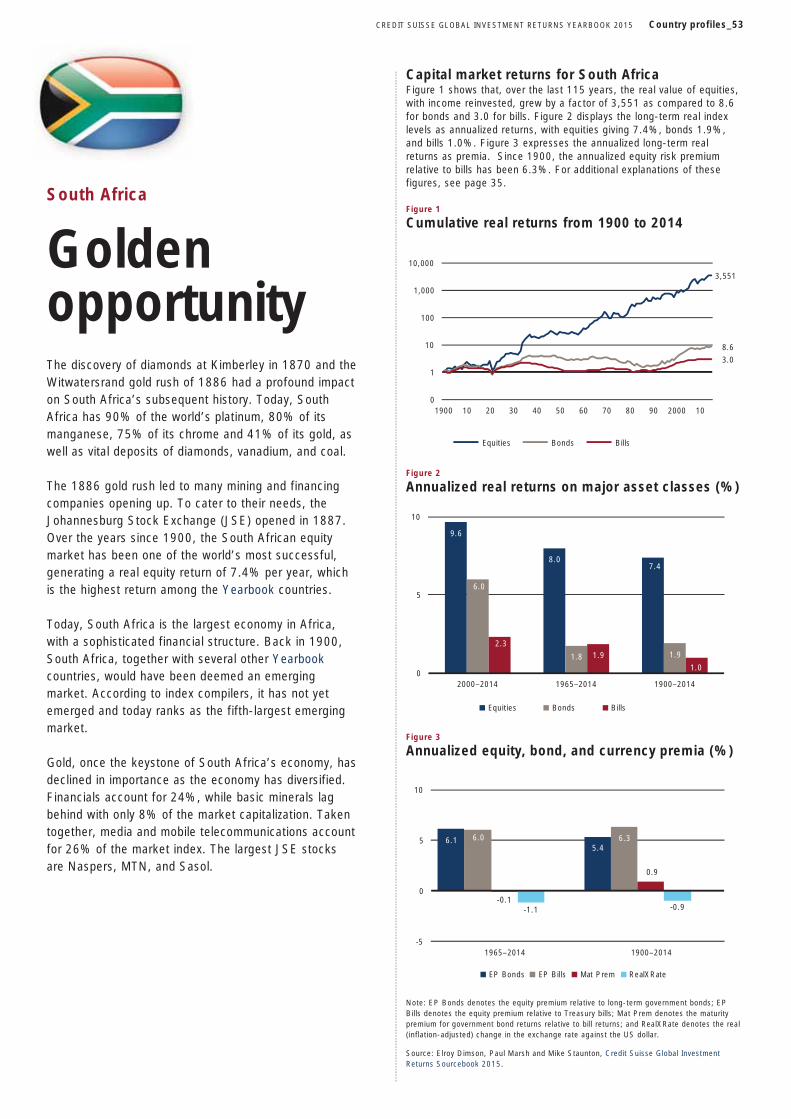
CREDIT SUISSE GLOBAL INVESTMENT RETURNS YEARBOOK 2015 Country profiles_53
South Africa
Golden opportunity
The discovery of diamonds at Kimberley in 1870 and the Witwatersrand gold rush of 1886 had a profound impact on South Africa’s subsequent history. Today, South Africa has 90% of the world’s platinum, 80% of its manganese, 75% of its chrome and 41% of its gold, as well as vital deposits of diamonds, vanadium, and coal.
The 1886 gold rush led to many mining and financing companies opening up. To cater to their needs, the Johannesburg Stock Exchange (JSE) opened in 1887. Over the years since 1900, the South African equity market has been one of the world’s most successful, generating a real equity return of 7.4% per year, which is the highest return among the Yearbook countries.
Today, South Africa is the largest economy in Africa, with a sophisticated financial structure. Back in 1900, South Africa, together with several other Yearbook countries, would have been deemed an emerging market. According to index compilers, it has not yet emerged and today ranks as the fifth-largest emerging market.
Gold, once the keystone of South Africa’s economy, has declined in importance as the economy has diversified. Financials account for 24%, while basic minerals lag behind with only 8% of the market capitalization. Taken together, media and mobile telecommunications account for 26% of the market index. The largest JSE stocks are Naspers, MTN, and Sasol.
Capital market returns for South Africa Figure 1 shows that, over the last 115 years, the real value of equities, with income reinvested, grew by a factor of 3,551 as compared to 8.6 for bonds and 3.0 for bills. Figure 2 displays the long-term real index levels as annualized returns, with equities giving 7.4%, bonds 1.9%, and bills 1.0%. Figure 3 expresses the annualized long-term real returns as premia. Since 1900, the annualized equity risk premium relative to bills has been 6.3%. For additional explanations of these figures, see page 35.
Figure 1
Cumulative real returns from 1900 to 2014
Figure 2
Annualized real returns on major asset classes (%)
Figure 3
Annualized equity, bond, and currency premia (%)
Note: EP Bonds denotes the equity premium relative to long-term government bonds; EP Bills denotes the equity premium relative to Treasury bills; Mat Prem denotes the maturity premium for government bond returns relative to bill returns; and RealXRate denotes the real (inflation-adjusted) change in the exchange rate against the US dollar.
Source: Elroy Dimson, Paul Marsh and Mike Staunton, Credit Suisse Global Investment Returns Sourcebook 2015.
3,551
8.6
3.0
0
1
10
100
1,000
10,000
1900 10 20 30 40 50 60 70 80 90 2000 10
Equities Bonds Bills
9.6
8.07.4
6.0
1.8 1.92.3
1.9
1.00
5
10
2000–2014 1965–2014 1900–2014
Equities Bonds Bills
6.15.4
6.0 6.3
-0.1
0.9
-1.1 -0.9
-5
0
5
10
1965–2014 1900–2014
EP Bonds EP Bills Mat Prem RealXRate
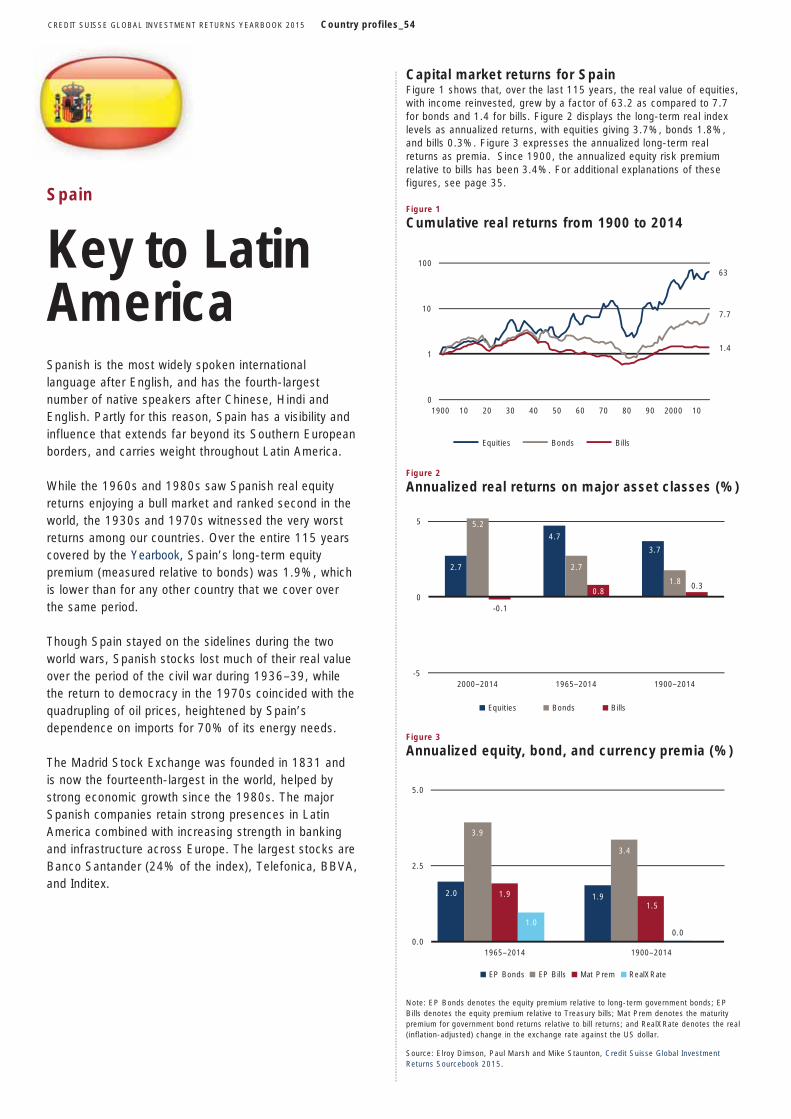
CREDIT SUISSE GLOBAL INVESTMENT RETURNS YEARBOOK 2015 Country profiles_54
Spain
Key to Latin America
Spanish is the most widely spoken international language after English, and has the fourth-largest number of native speakers after Chinese, Hindi and English. Partly for this reason, Spain has a visibility and influence that extends far beyond its Southern European borders, and carries weight throughout Latin America.
While the 1960s and 1980s saw Spanish real equity returns enjoying a bull market and ranked second in the world, the 1930s and 1970s witnessed the very worst returns among our countries. Over the entire 115 years covered by the Yearbook, Spain’s long-term equity premium (measured relative to bonds) was 1.9%, which is lower than for any other country that we cover over the same period.
Though Spain stayed on the sidelines during the two world wars, Spanish stocks lost much of their real value over the period of the civil war during 1936–39, while the return to democracy in the 1970s coincided with the quadrupling of oil prices, heightened by Spain’s dependence on imports for 70% of its energy needs.
The Madrid Stock Exchange was founded in 1831 and is now the fourteenth-largest in the world, helped by strong economic growth since the 1980s. The major Spanish companies retain strong presences in Latin America combined with increasing strength in banking and infrastructure across Europe. The largest stocks are Banco Santander (24% of the index), Telefonica, BBVA, and Inditex.
Capital market returns for Spain Figure 1 shows that, over the last 115 years, the real value of equities, with income reinvested, grew by a factor of 63.2 as compared to 7.7 for bonds and 1.4 for bills. Figure 2 displays the long-term real index levels as annualized returns, with equities giving 3.7%, bonds 1.8%, and bills 0.3%. Figure 3 expresses the annualized long-term real returns as premia. Since 1900, the annualized equity risk premium relative to bills has been 3.4%. For additional explanations of these figures, see page 35.
Figure 1
Cumulative real returns from 1900 to 2014
Figure 2
Annualized real returns on major asset classes (%)
Figure 3
Annualized equity, bond, and currency premia (%)
Note: EP Bonds denotes the equity premium relative to long-term government bonds; EP Bills denotes the equity premium relative to Treasury bills; Mat Prem denotes the maturity premium for government bond returns relative to bill returns; and RealXRate denotes the real (inflation-adjusted) change in the exchange rate against the US dollar.
Source: Elroy Dimson, Paul Marsh and Mike Staunton, Credit Suisse Global Investment Returns Sourcebook 2015.
63
7.7
1.4
0
1
10
100
1900 10 20 30 40 50 60 70 80 90 2000 10
Equities Bonds Bills
2.7
4.7
3.7
5.2
2.7
1.8
-0.1
0.80.3
-5
0
5
2000–2014 1965–2014 1900–2014
Equities Bonds Bills
2.0 1.9
3.9
3.4
1.91.5
1.00.0
0.0
2.5
5.0
1965–2014 1900–2014
EP Bonds EP Bills Mat Prem RealXRate
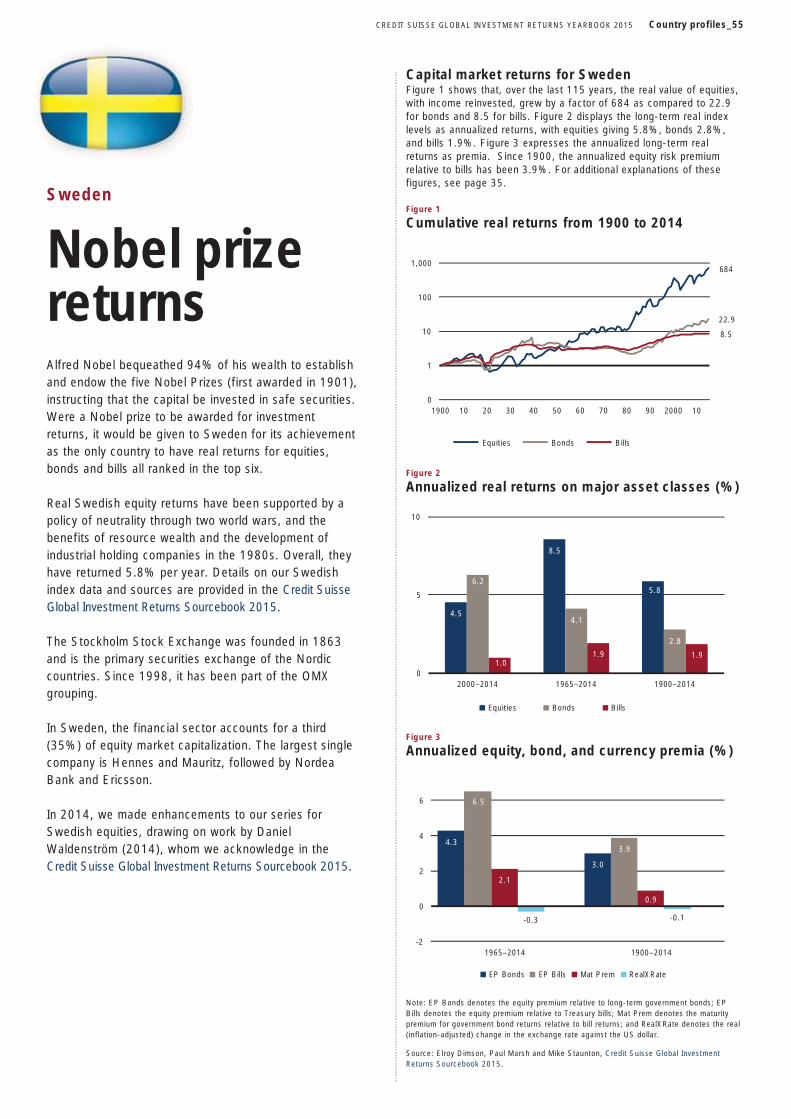
CREDIT SUISSE GLOBAL INVESTMENT RETURNS YEARBOOK 2015 Country profiles_55
Sweden
Nobel prize returns
Alfred Nobel bequeathed 94% of his wealth to establish and endow the five Nobel Prizes (first awarded in 1901), instructing that the capital be invested in safe securities. Were a Nobel prize to be awarded for investment returns, it would be given to Sweden for its achievement as the only country to have real returns for equities, bonds and bills all ranked in the top six.
Real Swedish equity returns have been supported by a policy of neutrality through two world wars, and the benefits of resource wealth and the development of industrial holding companies in the 1980s. Overall, they have returned 5.8% per year. Details on our Swedish index data and sources are provided in the Credit Suisse Global Investment Returns Sourcebook 2015.
The Stockholm Stock Exchange was founded in 1863 and is the primary securities exchange of the Nordic countries. Since 1998, it has been part of the OMX grouping.
In Sweden, the financial sector accounts for a third (35%) of equity market capitalization. The largest single company is Hennes and Mauritz, followed by Nordea Bank and Ericsson.
In 2014, we made enhancements to our series for Swedish equities, drawing on work by Daniel Waldenström (2014), whom we acknowledge in the Credit Suisse Global Investment Returns Sourcebook 2015.
Capital market returns for Sweden Figure 1 shows that, over the last 115 years, the real value of equities, with income reinvested, grew by a factor of 684 as compared to 22.9 for bonds and 8.5 for bills. Figure 2 displays the long-term real index levels as annualized returns, with equities giving 5.8%, bonds 2.8%, and bills 1.9%. Figure 3 expresses the annualized long-term real returns as premia. Since 1900, the annualized equity risk premium relative to bills has been 3.9%. For additional explanations of these figures, see page 35.
Figure 1
Cumulative real returns from 1900 to 2014
Figure 2
Annualized real returns on major asset classes (%)
Figure 3
Annualized equity, bond, and currency premia (%)
Note: EP Bonds denotes the equity premium relative to long-term government bonds; EP Bills denotes the equity premium relative to Treasury bills; Mat Prem denotes the maturity premium for government bond returns relative to bill returns; and RealXRate denotes the real (inflation-adjusted) change in the exchange rate against the US dollar.
Source: Elroy Dimson, Paul Marsh and Mike Staunton, Credit Suisse Global Investment Returns Sourcebook 2015.
684
22.9
8.5
0
1
10
100
1,000
1900 10 20 30 40 50 60 70 80 90 2000 10
Equities Bonds Bills
4.5
8.5
5.86.2
4.1
2.8
1.01.9 1.9
0
5
10
2000–2014 1965–2014 1900–2014
Equities Bonds Bills
4.3
3.0
6.5
3.9
2.1
0.9
-0.3 -0.1
-2
0
2
4
6
1965–2014 1900–2014
EP Bonds EP Bills Mat Prem RealXRate
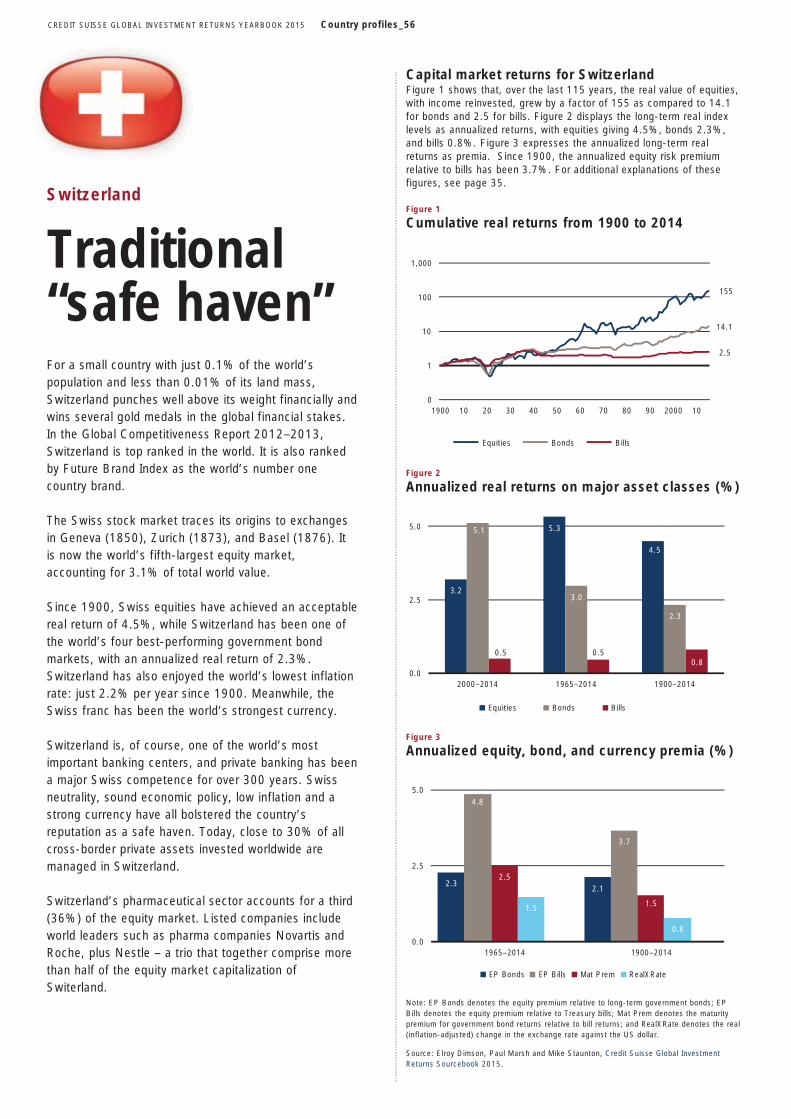
CREDIT SUISSE GLOBAL INVESTMENT RETURNS YEARBOOK 2015 Country profiles_56
Switzerland
Traditional “safe haven”
For a small country with just 0.1% of the world’s population and less than 0.01% of its land mass, Switzerland punches well above its weight financially and wins several gold medals in the global financial stakes. In the Global Competitiveness Report 2012–2013, Switzerland is top ranked in the world. It is also ranked by Future Brand Index as the world’s number one country brand.
The Swiss stock market traces its origins to exchanges in Geneva (1850), Zurich (1873), and Basel (1876). It is now the world’s fifth-largest equity market, accounting for 3.1% of total world value.
Since 1900, Swiss equities have achieved an acceptable real return of 4.5%, while Switzerland has been one of the world’s four best-performing government bond markets, with an annualized real return of 2.3%. Switzerland has also enjoyed the world’s lowest inflation rate: just 2.2% per year since 1900. Meanwhile, the Swiss franc has been the world’s strongest currency.
Switzerland is, of course, one of the world’s most important banking centers, and private banking has been a major Swiss competence for over 300 years. Swiss neutrality, sound economic policy, low inflation and a strong currency have all bolstered the country’s reputation as a safe haven. Today, close to 30% of all cross-border private assets invested worldwide are managed in Switzerland.
Switzerland’s pharmaceutical sector accounts for a third (36%) of the equity market. Listed companies include world leaders such as pharma companies Novartis and Roche, plus Nestle – a trio that together comprise more than half of the equity market capitalization of Switerland.
Capital market returns for Switzerland Figure 1 shows that, over the last 115 years, the real value of equities, with income reinvested, grew by a factor of 155 as compared to 14.1 for bonds and 2.5 for bills. Figure 2 displays the long-term real index levels as annualized returns, with equities giving 4.5%, bonds 2.3%, and bills 0.8%. Figure 3 expresses the annualized long-term real returns as premia. Since 1900, the annualized equity risk premium relative to bills has been 3.7%. For additional explanations of these figures, see page 35.
Figure 1
Cumulative real returns from 1900 to 2014
Figure 2
Annualized real returns on major asset classes (%)
Figure 3
Annualized equity, bond, and currency premia (%)
Note: EP Bonds denotes the equity premium relative to long-term government bonds; EP Bills denotes the equity premium relative to Treasury bills; Mat Prem denotes the maturity premium for government bond returns relative to bill returns; and RealXRate denotes the real (inflation-adjusted) change in the exchange rate against the US dollar.
Source: Elroy Dimson, Paul Marsh and Mike Staunton, Credit Suisse Global Investment Returns Sourcebook 2015.
155
14.1
2.5
0
1
10
100
1,000
1900 10 20 30 40 50 60 70 80 90 2000 10
Equities Bonds Bills
3.2
5.3
4.5
5.1
3.0
2.3
0.5 0.50.8
0.0
2.5
5.0
2000–2014 1965–2014 1900–2014
Equities Bonds Bills
2.32.1
4.8
3.7
2.5
1.51.5
0.8
0.0
2.5
5.0
1965–2014 1900–2014
EP Bonds EP Bills Mat Prem RealXRate
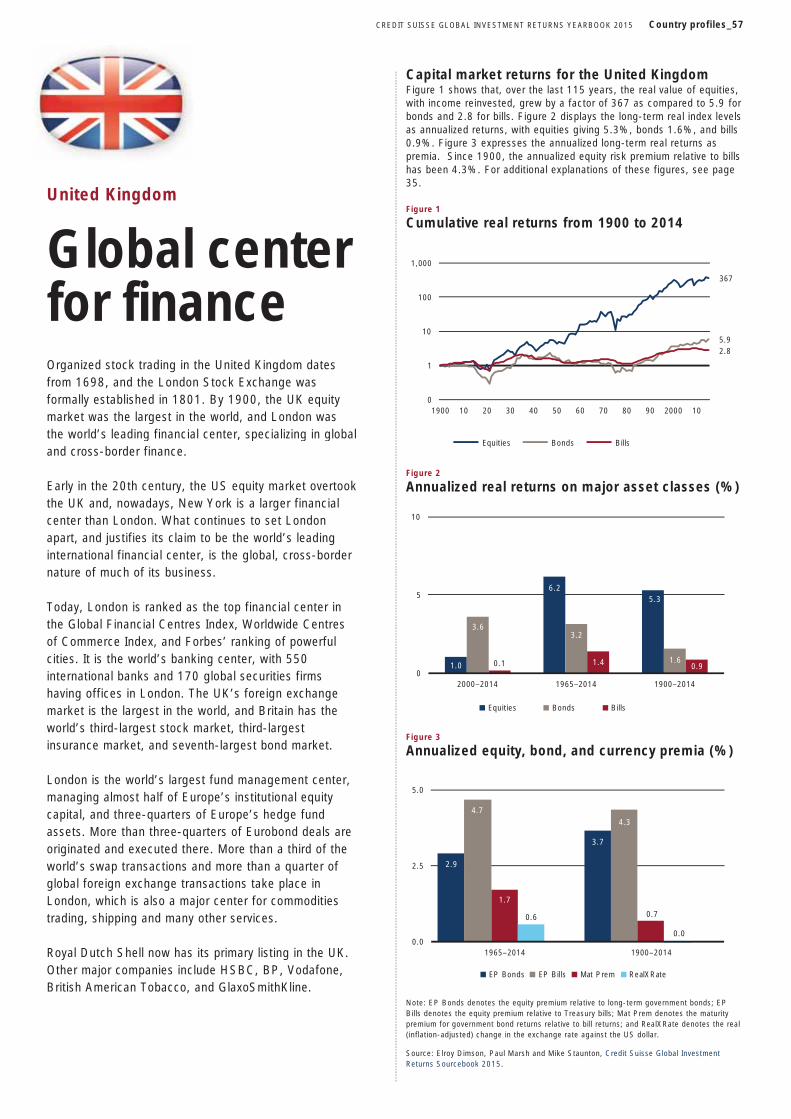
CREDIT SUISSE GLOBAL INVESTMENT RETURNS YEARBOOK 2015 Country profiles_57
United Kingdom
Global centerfor finance Organized stock trading in the United Kingdom dates from 1698, and the London Stock Exchange was formally established in 1801. By 1900, the UK equity market was the largest in the world, and London was the world’s leading financial center, specializing in global and cross-border finance.
Early in the 20th century, the US equity market overtook the UK and, nowadays, New York is a larger financial center than London. What continues to set London apart, and justifies its claim to be the world’s leading international financial center, is the global, cross-border nature of much of its business.
Today, London is ranked as the top financial center in the Global Financial Centres Index, Worldwide Centres of Commerce Index, and Forbes’ ranking of powerful cities. It is the world’s banking center, with 550 international banks and 170 global securities firms having offices in London. The UK’s foreign exchange market is the largest in the world, and Britain has the world’s third-largest stock market, third-largest insurance market, and seventh-largest bond market.
London is the world’s largest fund management center, managing almost half of Europe’s institutional equity capital, and three-quarters of Europe’s hedge fund assets. More than three-quarters of Eurobond deals are originated and executed there. More than a third of the world’s swap transactions and more than a quarter of global foreign exchange transactions take place in London, which is also a major center for commodities trading, shipping and many other services.
Royal Dutch Shell now has its primary listing in the UK. Other major companies include HSBC, BP, Vodafone, British American Tobacco, and GlaxoSmithKline.
Capital market returns for the United Kingdom Figure 1 shows that, over the last 115 years, the real value of equities, with income reinvested, grew by a factor of 367 as compared to 5.9 for bonds and 2.8 for bills. Figure 2 displays the long-term real index levels as annualized returns, with equities giving 5.3%, bonds 1.6%, and bills 0.9%. Figure 3 expresses the annualized long-term real returns as premia. Since 1900, the annualized equity risk premium relative to bills has been 4.3%. For additional explanations of these figures, see page 35.
Figure 1
Cumulative real returns from 1900 to 2014
Figure 2
Annualized real returns on major asset classes (%)
Figure 3
Annualized equity, bond, and currency premia (%)
Note: EP Bonds denotes the equity premium relative to long-term government bonds; EP Bills denotes the equity premium relative to Treasury bills; Mat Prem denotes the maturity premium for government bond returns relative to bill returns; and RealXRate denotes the real (inflation-adjusted) change in the exchange rate against the US dollar.
Source: Elroy Dimson, Paul Marsh and Mike Staunton, Credit Suisse Global Investment Returns Sourcebook 2015.
367
5.92.8
0
1
10
100
1,000
1900 10 20 30 40 50 60 70 80 90 2000 10
Equities Bonds Bills
1.0
6.25.3
3.63.2
1.60.1 1.4 0.90
5
10
2000–2014 1965–2014 1900–2014
Equities Bonds Bills
2.9
3.7
4.74.3
1.7
0.70.6
0.0
2.5
5.0
1965–2014 1900–2014
EP Bonds EP Bills Mat Prem RealXRate
0.0
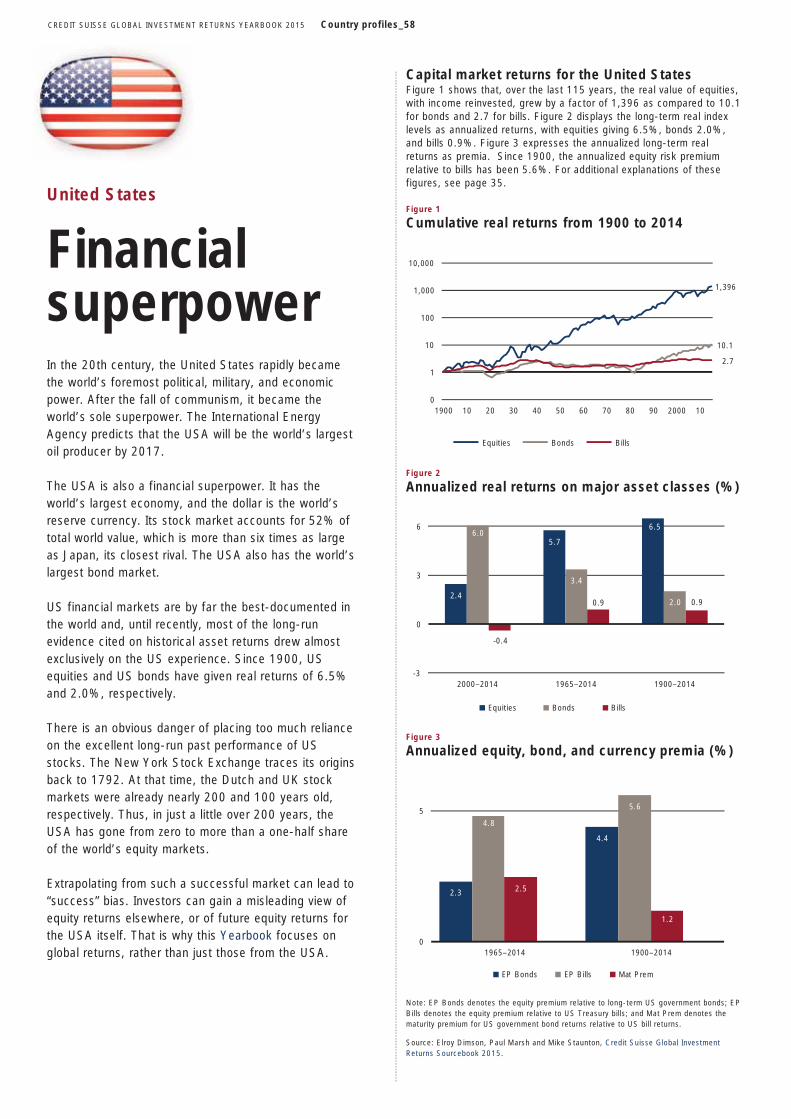
CREDIT SUISSE GLOBAL INVESTMENT RETURNS YEARBOOK 2015 Country profiles_58
United States
Financial superpower
In the 20th century, the United States rapidly became the world’s foremost political, military, and economic power. After the fall of communism, it became the world’s sole superpower. The International Energy Agency predicts that the USA will be the world’s largest oil producer by 2017.
The USA is also a financial superpower. It has the world’s largest economy, and the dollar is the world’s reserve currency. Its stock market accounts for 52% of total world value, which is more than six times as large as Japan, its closest rival. The USA also has the world’s largest bond market.
US financial markets are by far the best-documented in the world and, until recently, most of the long-run evidence cited on historical asset returns drew almost exclusively on the US experience. Since 1900, US equities and US bonds have given real returns of 6.5% and 2.0%, respectively.
There is an obvious danger of placing too much reliance on the excellent long-run past performance of US stocks. The New York Stock Exchange traces its origins back to 1792. At that time, the Dutch and UK stock markets were already nearly 200 and 100 years old, respectively. Thus, in just a little over 200 years, the USA has gone from zero to more than a one-half share of the world’s equity markets.
Extrapolating from such a successful market can lead to “success” bias. Investors can gain a misleading view of equity returns elsewhere, or of future equity returns for the USA itself. That is why this Yearbook focuses on global returns, rather than just those from the USA.
Capital market returns for the United States Figure 1 shows that, over the last 115 years, the real value of equities, with income reinvested, grew by a factor of 1,396 as compared to 10.1 for bonds and 2.7 for bills. Figure 2 displays the long-term real index levels as annualized returns, with equities giving 6.5%, bonds 2.0%, and bills 0.9%. Figure 3 expresses the annualized long-term real returns as premia. Since 1900, the annualized equity risk premium relative to bills has been 5.6%. For additional explanations of these figures, see page 35.
Figure 1
Cumulative real returns from 1900 to 2014
Figure 2
Annualized real returns on major asset classes (%)
Figure 3
Annualized equity, bond, and currency premia (%)
Note: EP Bonds denotes the equity premium relative to long-term US government bonds; EP Bills denotes the equity premium relative to US Treasury bills; and Mat Prem denotes the maturity premium for US government bond returns relative to US bill returns.
Source: Elroy Dimson, Paul Marsh and Mike Staunton, Credit Suisse Global Investment Returns Sourcebook 2015.
1,396
10.1
2.7
0
1
10
100
1,000
10,000
1900 10 20 30 40 50 60 70 80 90 2000 10
Equities Bonds Bills
2.4
5.7
6.56.0
3.4
2.0
-0.4
0.9 0.9
-3
0
3
6
2000–2014 1965–2014 1900–2014
Equities Bonds Bills
2.3
4.4
4.8
5.6
2.5
1.2
0
5
1965–2014 1900–2014
EP Bonds EP Bills Mat Prem
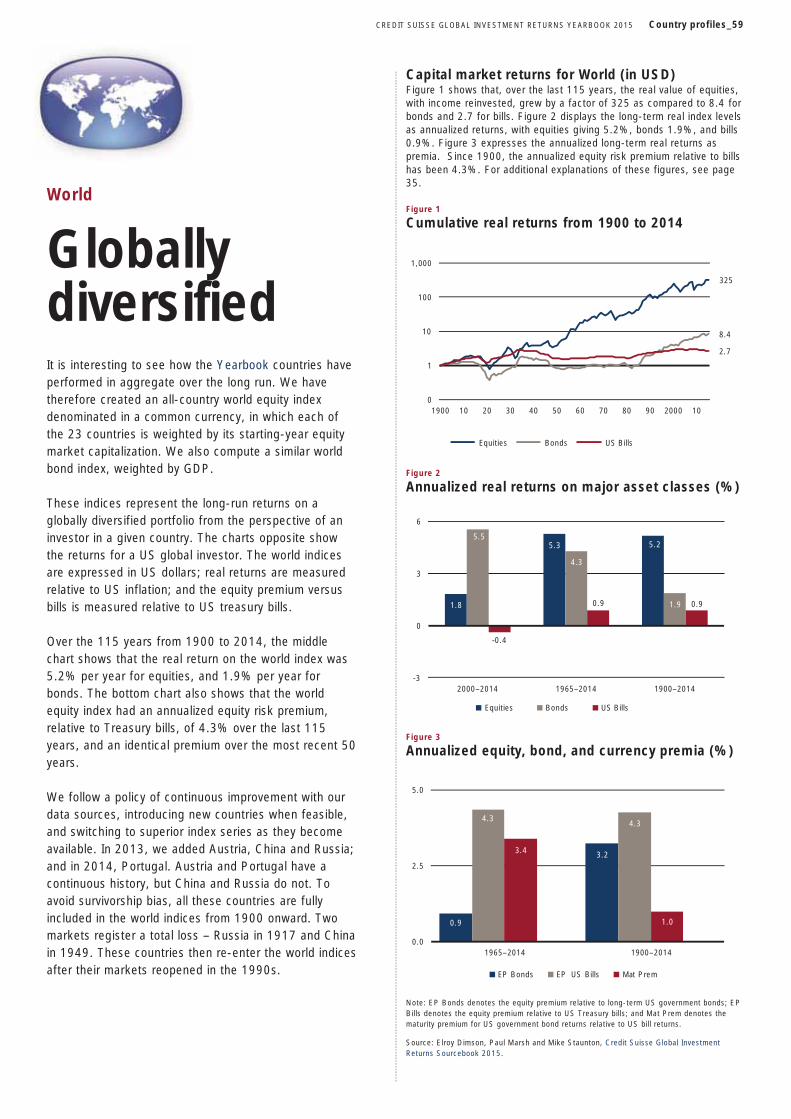
CREDIT SUISSE GLOBAL INVESTMENT RETURNS YEARBOOK 2015 Country profiles_59
World
Globally diversified
It is interesting to see how the Yearbook countries have performed in aggregate over the long run. We have therefore created an all-country world equity index denominated in a common currency, in which each of the 23 countries is weighted by its starting-year equity market capitalization. We also compute a similar world bond index, weighted by GDP.
These indices represent the long-run returns on a globally diversified portfolio from the perspective of an investor in a given country. The charts opposite show the returns for a US global investor. The world indices are expressed in US dollars; real returns are measured relative to US inflation; and the equity premium versus bills is measured relative to US treasury bills.
Over the 115 years from 1900 to 2014, the middle chart shows that the real return on the world index was 5.2% per year for equities, and 1.9% per year for bonds. The bottom chart also shows that the world equity index had an annualized equity risk premium, relative to Treasury bills, of 4.3% over the last 115 years, and an identical premium over the most recent 50 years.
We follow a policy of continuous improvement with our data sources, introducing new countries when feasible, and switching to superior index series as they become available. In 2013, we added Austria, China and Russia;and in 2014, Portugal. Austria and Portugal have a continuous history, but China and Russia do not. To avoid survivorship bias, all these countries are fully included in the world indices from 1900 onward. Two markets register a total loss – Russia in 1917 and China in 1949. These countries then re-enter the world indicesafter their markets reopened in the 1990s.
Capital market returns for World (in USD) Figure 1 shows that, over the last 115 years, the real value of equities, with income reinvested, grew by a factor of 325 as compared to 8.4 for bonds and 2.7 for bills. Figure 2 displays the long-term real index levels as annualized returns, with equities giving 5.2%, bonds 1.9%, and bills 0.9%. Figure 3 expresses the annualized long-term real returns as premia. Since 1900, the annualized equity risk premium relative to bills has been 4.3%. For additional explanations of these figures, see page 35.
Figure 1
Cumulative real returns from 1900 to 2014
Figure 2
Annualized real returns on major asset classes (%)
Figure 3
Annualized equity, bond, and currency premia (%)
Note: EP Bonds denotes the equity premium relative to long-term US government bonds; EP Bills denotes the equity premium relative to US Treasury bills; and Mat Prem denotes the maturity premium for US government bond returns relative to US bill returns.
Source: Elroy Dimson, Paul Marsh and Mike Staunton, Credit Suisse Global Investment Returns Sourcebook 2015.
325
8.4
2.7
0
1
10
100
1,000
1900 10 20 30 40 50 60 70 80 90 2000 10
Equities Bonds US Bills
1.8
5.3 5.25.5
4.3
1.9
-0.4
0.9 0.9
-3
0
3
6
2000–2014 1965–2014 1900–2014
Equities Bonds US Bills
0.9
3.2
4.34.3
3.4
1.0
0.0
2.5
5.0
1965–2014 1900–2014
EP Bonds EP US Bills Mat Prem
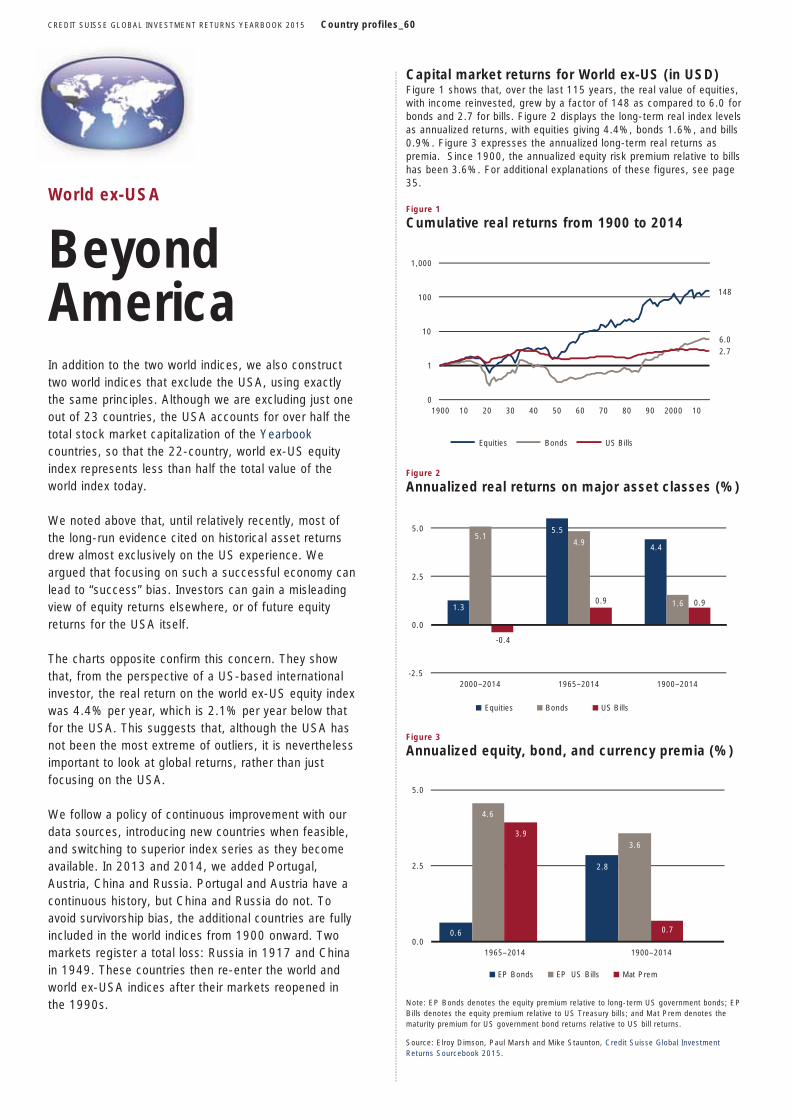
CREDIT SUISSE GLOBAL INVESTMENT RETURNS YEARBOOK 2015 Country profiles_60
Capital market returns for World ex-US (in USD) Figure 1 shows that, over the last 115 years, the real value of equities, with income reinvested, grew by a factor of 148 as compared to 6.0 for bonds and 2.7 for bills. Figure 2 displays the long-term real index levels as annualized returns, with equities giving 4.4%, bonds 1.6%, and bills 0.9%. Figure 3 expresses the annualized long-term real returns as premia. Since 1900, the annualized equity risk premium relative to bills has been 3.6%. For additional explanations of these figures, see page 35.
Figure 1
Cumulative real returns from 1900 to 2014
Figure 2
Annualized real returns on major asset classes (%)
Figure 3
Annualized equity, bond, and currency premia (%)
Note: EP Bonds denotes the equity premium relative to long-term US government bonds; EP Bills denotes the equity premium relative to US Treasury bills; and Mat Prem denotes the maturity premium for US government bond returns relative to US bill returns.
Source: Elroy Dimson, Paul Marsh and Mike Staunton, Credit Suisse Global Investment Returns Sourcebook 2015.
148
6.02.7
0
1
10
100
1,000
1900 10 20 30 40 50 60 70 80 90 2000 10
Equities Bonds US Bills
1.3
5.5
4.45.1
4.9
1.6
-0.4
0.9 0.9
-2.5
0.0
2.5
5.0
2000–2014 1965–2014 1900–2014
Equities Bonds US Bills
0.6
2.8
4.6
3.63.9
0.70.0
2.5
5.0
1965–2014 1900–2014
EP Bonds EP US Bills Mat Prem
World ex-USA
Beyond America
In addition to the two world indices, we also construct two world indices that exclude the USA, using exactly the same principles. Although we are excluding just one out of 23 countries, the USA accounts for over half the total stock market capitalization of the Yearbook countries, so that the 22-country, world ex-US equity index represents less than half the total value of the world index today.
We noted above that, until relatively recently, most of the long-run evidence cited on historical asset returns drew almost exclusively on the US experience. We argued that focusing on such a successful economy can lead to “success” bias. Investors can gain a misleading view of equity returns elsewhere, or of future equity returns for the USA itself.
The charts opposite confirm this concern. They show that, from the perspective of a US-based international investor, the real return on the world ex-US equity index was 4.4% per year, which is 2.1% per year below that for the USA. This suggests that, although the USA has not been the most extreme of outliers, it is nevertheless important to look at global returns, rather than just focusing on the USA.
We follow a policy of continuous improvement with our data sources, introducing new countries when feasible, and switching to superior index series as they become available. In 2013 and 2014, we added Portugal, Austria, China and Russia. Portugal and Austria have a continuous history, but China and Russia do not. To avoid survivorship bias, the additional countries are fully included in the world indices from 1900 onward. Two markets register a total loss: Russia in 1917 and China in 1949. These countries then re-enter the world and world ex-USA indices after their markets reopened in the 1990s.
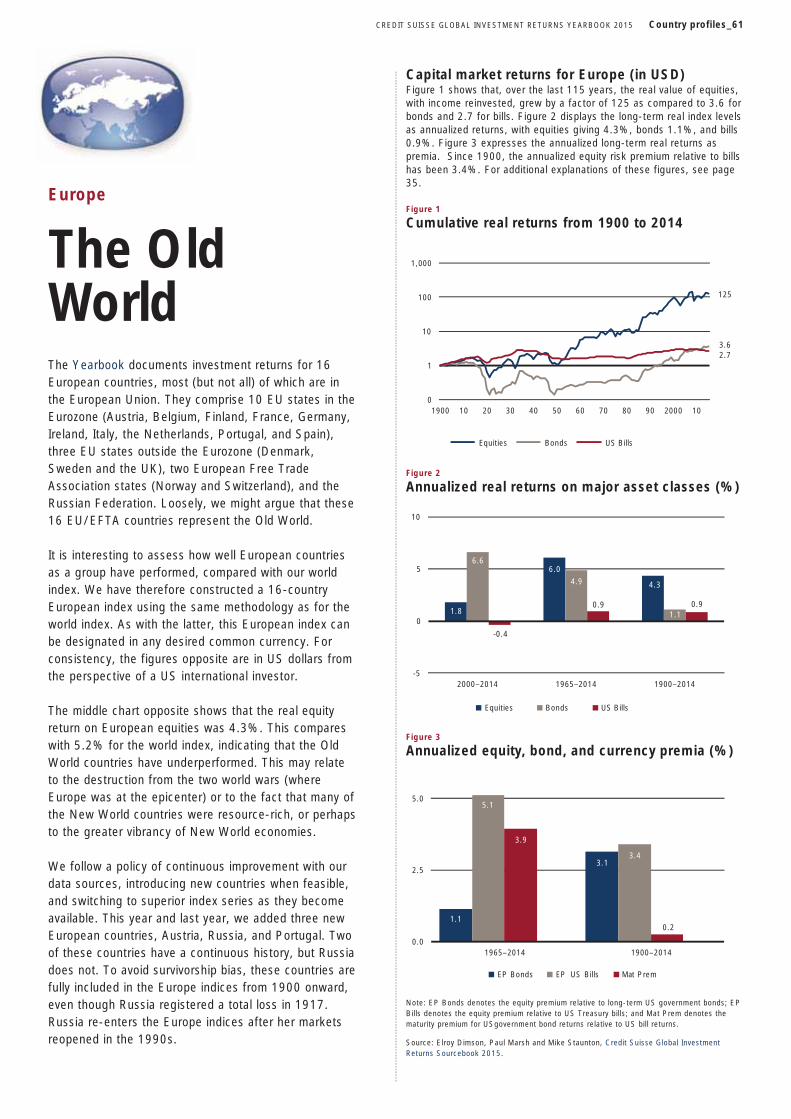
CREDIT SUISSE GLOBAL INVESTMENT RETURNS YEARBOOK 2015 Country profiles_61
Europe
The Old World
The Yearbook documents investment returns for 16 European countries, most (but not all) of which are in the European Union. They comprise 10 EU states in the Eurozone (Austria, Belgium, Finland, France, Germany, Ireland, Italy, the Netherlands, Portugal, and Spain), three EU states outside the Eurozone (Denmark, Sweden and the UK), two European Free Trade Association states (Norway and Switzerland), and the Russian Federation. Loosely, we might argue that these 16 EU/EFTA countries represent the Old World.
It is interesting to assess how well European countries as a group have performed, compared with our world index. We have therefore constructed a 16-country European index using the same methodology as for the world index. As with the latter, this European index can be designated in any desired common currency. For consistency, the figures opposite are in US dollars from the perspective of a US international investor.
The middle chart opposite shows that the real equity return on European equities was 4.3%. This compares with 5.2% for the world index, indicating that the Old World countries have underperformed. This may relate to the destruction from the two world wars (where Europe was at the epicenter) or to the fact that many of the New World countries were resource-rich, or perhaps to the greater vibrancy of New World economies.
We follow a policy of continuous improvement with our data sources, introducing new countries when feasible, and switching to superior index series as they become available. This year and last year, we added three new European countries, Austria, Russia, and Portugal. Two of these countries have a continuous history, but Russia does not. To avoid survivorship bias, these countries are fully included in the Europe indices from 1900 onward, even though Russia registered a total loss in 1917. Russia re-enters the Europe indices after her markets reopened in the 1990s.
Capital market returns for Europe (in USD) Figure 1 shows that, over the last 115 years, the real value of equities, with income reinvested, grew by a factor of 125 as compared to 3.6 for bonds and 2.7 for bills. Figure 2 displays the long-term real index levels as annualized returns, with equities giving 4.3%, bonds 1.1%, and bills 0.9%. Figure 3 expresses the annualized long-term real returns as premia. Since 1900, the annualized equity risk premium relative to bills has been 3.4%. For additional explanations of these figures, see page 35.
Figure 1
Cumulative real returns from 1900 to 2014
Figure 2
Annualized real returns on major asset classes (%)
Figure 3
Annualized equity, bond, and currency premia (%)
Note: EP Bonds denotes the equity premium relative to long-term US government bonds; EP Bills denotes the equity premium relative to US Treasury bills; and Mat Prem denotes the maturity premium for USgovernment bond returns relative to US bill returns.
Source: Elroy Dimson, Paul Marsh and Mike Staunton, Credit Suisse Global Investment Returns Sourcebook 2015.
125
3.62.7
0
1
10
100
1,000
1900 10 20 30 40 50 60 70 80 90 2000 10
Equities Bonds US Bills
1.8
6.0
4.3
6.6
4.9
1.1
-0.4
0.9 0.9
-5
0
5
10
2000–2014 1965–2014 1900–2014
Equities Bonds US Bills
1.1
3.1
5.1
3.4
3.9
0.2
0.0
2.5
5.0
1965–2014 1900–2014
EP Bonds EP US Bills Mat Prem

PH
OTO
: D
EY
AN
GE
OR
GIE
V /
DR
EA
MS
TIM
E.C
OM

CREDIT SUISSE GLOBAL INVESTMENT RETURNS YEARBOOK 2015_63
References Admati, Anat, and Paul Pfleiderer, 2009, The "Wall Street Walk" and shareholder activism: exit as a form of voice, Review of Financial Studies 22, 2445–2485.
Ahrens, Dan, 2004, Investing in Vice: The Recession Proof Portfolio of Booze, Bets, Bombs and Butts, NY, New York: St Martin’s Press.*
Ang, Andrew, 2014, Asset Management: A Systematic Approach to Factor Investing. Oxford: Oxford University Press.
Bebchuk, Lucian, Alma Cohen and Charles Wang, 2013, Learning and the disappearing association between governance and returns, Journal of Financial Economics 108, 323–348.
Becht, Marco, Julian Franks, Jeremy Grant and Hannes Wagner, 2014, The returns to hedge fund activism: an international study, ECGI Finance Working Paper N° 402/2014.
Borgers, Arian, Jeroen Derwall, Kees Koedijk and Jenke ter Horst, 2013, Stakeholder relations and stock returns: on errors in investors' expectations and learning, Journal of Empirical Finance 22, 159–175.
Camejo, Peter, 2003, The SRI Advantage: Why Socially Responsible Investing Has Outperformed Financially, Gabriola Island, BC: New Society Publishers.*
Cowles, Alfred, and Associates, 1938, Common Stock Indexes, first edition, Bloomington, Indiana: Principia Press, Inc.
Dimson, Elroy, Xi Li and Oguzhan Karakas, 2015, Active ownership, Review of Financial Studies, Forthcoming.
Dimson, Elroy, Idar Kreutzer, Rob Lake, Hege Sjo and Laura Starks, 2013, Responsible Investment and the Norwegian Government Pension Fund Global, Oslo: Norwegian Ministry of Finance.
Dimson, Elroy, and Paul Marsh, 2015, Numis Smaller Companies Index Annual Review, 2015, London: Numis Securities.
Dimson, Elroy, Paul Marsh and Mike Staunton, 2002. Triumph of the Optimists: 101 Years of Global Investment Returns, Princeton, NJ: Princeton University Press.
Fabozzi, Frank, KC Ma and Becky Oliphant, 2008, Sin stock returns, Journal of Portfolio Management Fall, 82 – 94.
Fama, Eugene and Kenneth French, 1997, Industry costs of equity, Journal of Financial Economics 43, 153–93.
Gollier, Christian, and Sébastien Pouget, 2014, The “washing machine”: investment strategies and corporate behavior with socially responsible investors, Working Paper No 14–457, Toulouse School of Economics.
Gompers, Paul, Joy Ishii and Andrew Metrick, 2003, Corporate governance and equity prices, Quarterly Journal of Economics 118, 107–155.
Graver, Hans Peter (Chairman), 2003. The Report from the Graver Committee, Oslo: Norwegian Ministry of Finance.
Greenwood, Robin, and Michael Schor, 2009, Investor activism and takeovers, Journal of Financial Economics 92, 362–375.
Gregory, Alan, Cherif Guermat and Fawaz Al Shawawreh, 2010, UK IPOs: Long run returns, behavioural timing and pseudo timing, Journal of Business Finance and Accounting 37, 612–47.
Grundy, Bruce, and Spencer Martin, 2001, Understanding the nature of the risks and the source of rewards to momentum investing, Review of Financial Studies 14, 29–78.
Harrington, John, 1992, Investing with Your Conscience: How to Achieve High Returns Using Socially Responsible Investing, Hoboken, NJ: John Wiley & Sons.*
Heston, Steven, and Geert Rouwenhorst, 1994, Does industrial structure explain the benefits of international diversification? Journal of Financial Economics 36, 3–27.
Hirschman, Albert, 1970. Exit, Voice, and Loyalty: Responses to Decline in Firms, Organizations, and States, Cambridge, MA: Harvard University Press.
Holland, David, and Matthews Bryant. Market-implied Returns: Past and Present, Credit Suisse Global Investment Returns Yearbook 2011, January 2011, pages 25–29.
Hong, Harrison, and Marcin Kacperczyk, 2009, The price of sin: the effects of social norms on markets, Journal of Financial Economics 93, 15–36.
Humphrey, Jacquelyn, and David Tan, 2014, Does it really hurt to be responsible?, Journal of Business Ethics 122 (3), 375–386.
Huppé, Gabriel, and Tessa Hebb, 2011, The virtue of CalPERS` Emerging Equity Markets Principles, Journal of Sustainable Investment and Finance 1(1), 62–76.
Ibbotson, Roger, 1975, Price performance of common stock new issues, Journal of Financial Economics 2, 235–72.
Ilmanen, Antti, Expected Returns: An Investor’s Guide to Harvesting Market Rewards, Chichester: John Wiley & Sons.
Kaufmann, Daniel, Aart Kraay and Massimo Mastruzzi, 2010. The Worldwide Governance Indicators: Methodology and Analytical Issues, World Bank Policy Research Working Paper No. 5430.

CREDIT SUISSE GLOBAL INVESTMENT RETURNS YEARBOOK 2015_64
Lessard, Don, 1974, World, national and industry factors in equity returns, Journal of Finance 29, 379–91.
Loughran, Timothy and Jay Ritter, 1995, The new issues puzzle, Journal of Finance 50, 23–51.
Luo, Hao (Arthur), and Ronald Balvers, 2014, Social screens and systematic boycott risk, Working paper, McMaster University.
Menchero, Jose, and Andrei Morozov, 2012, The relative strength of industries versus countries in global equity markets, Journal of Investment Management 10, 75–87.
Monks, Robert, and Nell Minow, 1995 (fifth edition, 2011). Watching the Watchers: Corporate Governance in the 21st Century, Chichester: John Wiley & Sons.
Moskowitz, Tobias, and Mark Grinblatt, 1999, Do industries explain momentum, Journal of Finance 54, 1249–90.
Nairn, Alasdair, 2002, Engines that Move Markets: Technology Investing from Railroads to the Internet and Beyond, New York, NY: John Wiley & Sons, Inc.
Nystuen, Gro, Andreas Follesdal and Ola Mestad (Eds.), 2011, Human Rights, Corporate Complicity and Disinvestment, New York, NY: Cambridge University Press.
Richardson, Benjamin, 2013. Socially responsible investing for sustainability: overcoming its incomplete and conflicting rationales, Transnational Environmental Law 2(2), 311–338.
Ritter, Jay, 2014, Initial public offerings: Updated statistics on long-run performance, October 7, Jay Ritter’s data website.
Rostow, Walt, and Anna Schwartz, 1953, The Growth and Fluctuation of the British Economy, 1780–1850 (2 vols), Oxford: Oxford University Press.
Scowcroft, Alan, and James Sefton, 2005, Understanding momentum, Financial Analysts Journal 61, 64–82.
Shubb, Gary, 2014, Global Asset Management 2014: Steering the Course to Growth, Boston, MA: Boston Consulting Group.
Siegel, Jeremy, 2005, The Future for Investors: Why the Tried and the True Triumph over the Bold and the New, New York, NY: Crown Publishing Group.
Stierli, Markus, 2014, Sustainable Investments, Research Alert, Zurich: Credit Suisse.
Waxler, Caroline, 2004, Stocking Up on Sin: How to Crush the Market with Vice-Based Investing, Hoboken, NJ: John Wiley & Sons.*
________________________________________
* The dust jackets for these four books, depicted in Figure 2 of the second article above, are reproduced by kind permission of the publishers.

CREDIT SUISSE GLOBAL INVESTMENT RETURNS YEARBOOK 2015_65
About the authors Elroy Dimson is Chairman of the Centre for Endowment Asset Management at Cambridge Judge Business School, Emeritus Professor of Finance at London Business School, Chairman of the Strategy Council for the Norwegian Government Pension Fund, and Chairman of FTSE’s Advisory Board and Policy Committee. He previously served London Business School in a variety of senior positions. With Paul Marsh and Mike Staunton, he wrote Triumph of the Optimists, and he has published in Journal of Finance, Journal of Financial Economics, Review of Financial Studies, Journal of Business, Journal of Portfolio Management, Financial Analysts Journal, and other journals. His PhD in Finance is from London Business School.
Paul Marsh is Emeritus Professor of Finance at London Business School. Within London Business School he has been Chair of the Finance area, Deputy Principal, Faculty Dean, an elected Governor and Dean of the Finance Programmes, including the Masters in Finance. He has advised on several public enquiries; was previously Chairman of Aberforth Smaller Companies Trust, and a non-executive director of M&G Group and Majedie Investments; and has acted as a consultant to a wide range of financial institutions and companies. Dr Marsh has published articles in Journal of Business, Journal of Finance, Journal of Financial Economics, Journal of Portfolio Management, Harvard Business Review, and other journals. With Elroy Dimson, he co-designed the FTSE 100-Share Index and the Numis Smaller Companies Index, produced since 1987 at London Business School. His PhD in Finance is from London Business School.
Mike Staunton is Director of the London Share Price Database, a research resource of London Business School, where he produces the London Business School Risk Measurement Service. He has taught at universities in the United Kingdom, Hong Kong and Switzerland. Dr Staunton is co-author with Mary Jackson of Advanced Modelling in Finance Using Excel and VBA, published by Wiley and writes a regular column for Wilmott magazine. He has had articles published in Journal of Banking & Finance, Financial Analysts Journal, Journal of the Operations Research Society, and Quantitative Finance. With Elroy Dimson and Paul Marsh, he co-authored the influential investment book Triumph of the Optimists, published by Princeton University Press, which underpins this Yearbook and the accompanying Credit Suisse Global Investment Returns Sourcebook 2015. His PhD in Finance is from London Business School.
David Holland is a Senior Advisor to Credit Suisse. He was previously co-Head of HOLT Valuation & Analytics, the research and development arm of HOLT. He was responsible for improvements to the HOLT CFROI® framework, the development of custom solutions and investment products, and the generation of HOLT content. Mr Holland joined CSFB in May 2002 from Fractal Value Advisors, a corporate advisory business he owned in South Africa. He has worked with the world’s leading fund managers designing investment decision processes, advised corporations and private equity firms on strategy and valuation, and regularly writes about equity valuation issues. He co-authored the book Beyond Earnings: A User’s Guide to Excess Return Models and the HOLT CFROI® Framework published by Wiley Finance. Mr Holland holds degrees in Chemical Engineering from the University of Illinois (BS) and Stanford University (MS), and an MBA from the University of Cape Town.
Bryant Matthews is the Director of Research at Credit Suisse HOLT Division. He joined Credit Suisse in January 2002 when the firm acquired HOLT Value Associates LP. He has acted as consultant for various banks and professional bodies in the field of finance, and designed numerous valuation frameworks for Institutional Investors. Research conducted by Mr Matthews and his team has resulted in many significant insights into understanding the link between corporate performance and stock price. Areas of recent investigation include empirical research on corporate fade dynamics, estimating discount rates through a market-derived approach, and the development of risk models useful in understanding how risk evolves over time. Mr Matthews is an MBA graduate of Northwestern Kellogg Graduate School of Management.
Pratyasha Rath is a Vice President at Credit Suisse HOLT Division. In her current role of Global Macro Specialist, she is responsible for developing strategic macro investment insights and country/sector allocation ideas for clients. She joined Credit Suisse in 2007 as part of the Research team responsible for continuous improvement of the HOLT framework. Research conducted by Pratyasha has resulted in an improved assessment of risk for government-owned financial firms and real estate firms within HOLT. She has been instrumental in developing and marketing the risk analytics and macro offering at HOLT. Pratyasha holds a BA in Economics from the University of Delhi, India and an MS Finance from Illinois Institute of Technology.

PUBLISHERCREDIT SUISSE AGResearch InstituteParadeplatz 8CH-8070 ZurichSwitzerland
PRODUCTION MANAGEMENTINVESTMENT STRATEGY & RESEARCHINVESTMENT PUBLISHINGMarkus Kleeb (Head)Ross HewittKatharina Schlatter
AUTHORSElroy Dimson, London Business School, [email protected] Marsh, London Business School, [email protected] Staunton, London Business School, [email protected] of pages 29–33David A. Holland, Credit Suisse, [email protected] A. Matthews, Credit Suisse, [email protected] Pratyasha Rath, Credit Suisse, [email protected]
Editorial deadline30 January 2015
Additional copiesAdditional copies of this publication can be ordered via the Credit Suisse publication shop www.credit-suisse.com/publications or via your customer advisor.Copies of the Credit Suisse Global Investment Returns Sourcebook 2015 can be ordered via your customer advisor (Credit Suisse clients only). Non-clients please see below for ordering information.
ISBN 978-3-9524302-2-4
To receive a copy of the Yearbook or Sourcebook (non-clients): This Yearbook is distributed to Credit Suisse clients by the publisher, and to non-clients by London Business School. The accompanying volume, which contains detailed tables, charts, listings, background, sources, and bibliographic data, is called the Credit Suisse Global Investment Returns Sourcebook 2015. The Sourcebook includes detailed tables, charts, listings, background, sources, and bibliographic data. Format: A4 color, perfect bound, 224 pages, 30 chapters, 152 charts, 85 tables, 145 references. ISBN 978-3-9524302-3-1. Please address requests to Patricia Rowham, London Business School, Regents Park, London NW1 4SA, United Kingdom, tel +44 20 7000 7000, fax +44 20 7000 7001, e-mail [email protected]. E-mail is preferred.
To gain access to the underlying data: The Dimson-Marsh-Staunton dataset is distributed by Morningstar Inc. Please ask for the DMS data module. Further guidelines on subscribing to the data are available at www.tinyurl.com/DMSdata
To quote from this publication: To obtain permission, contact the authors with details of the required extracts, data, charts, tables or exhibits. In addition to citing this publication, documents that incorporate reproduced or derived materials must include a reference to Elroy Dimson, Paul Marsh and Mike Staunton, Triumph of the Optimists: 101 Years of Global Investment Returns, Princeton University Press, 2002. Apart from the article on pages 29-33, each chart and table must carry the acknowledgement Copyright © 2015 Elroy Dimson, Paul Marsh and Mike Staunton. If granted permission, a copy of published materials must be sent to the authors at London Business School, Regents Park, London NW1 4SA, United Kingdom.
Copyright © 2015 Elroy Dimson, Paul Marsh and Mike Staunton (excluding pages 29-33). All rights reserved. No part of this document may be reproduced or used in any form, including graphic, electronic, photocopying, recording or information storage and retrieval systems, without prior written permission from the copyright holders.
General disclaimer / Important informationThis document was produced by and the opinions expressed are those of Credit Suisse as of the date of writing and are subject to change. It has been prepared solely for information purposes and for the use of the recipient. It does not constitute an offer or an invitation by or on behalf of Credit Suisse to any person to buy or sell any security. Nothing in this material constitutes investment, legal, accounting or tax advice, or a representation that any investment or strategy is suitable or appropriate to your individual circumstances, or otherwise constitutes a personal recommendation to you. The price and value of investments mentioned and any income that might accrue may fluctuate and may fall or rise. Any reference to past performance is not a guide to the future.The information and analysis contained in this publication have been compiled or arrived at from sources believed to be reliable but Credit Suisse does not make any representation as to their accuracy or completeness and does not accept liability for any loss arising from the use hereof. A Credit Suisse Group company may have acted upon the information and analysis contained in this publication before being made available to clients of Credit Suisse. Investments in emerging markets are speculative and considerably more volatile than investments in established markets. Some of the main risks are political risks, economic risks, credit risks, currency risks and market risks. Investments in foreign currencies are subject to exchange rate fluctuations. Before entering into any transaction, you should consider the suitability of the transaction to your particular circumstances and independently review (with your professional advisers as necessary) the specific financial risks as well as legal, regulatory, credit, tax and accounting consequences. This document is issued and distributed in the United States by Credit Suisse Securities (USA) LLC, a U.S. registered broker-dealer; in Canada by Credit Suisse Securities (Canada), Inc.; and in Brazil by Banco de Investimentos Credit Suisse (Brasil) S.A.This document is distributed in Switzerland by Credit Suisse AG, a Swiss bank. Credit Suisse is authorized and regulated by the Swiss Financial Market Supervisory Authority (FINMA). This document is issued and distributed in Europe (except Switzerland) by Credit Suisse (UK) Limited and Credit Suisse Securities (Europe) Limited. Credit Suisse Securities (Europe) Limited and Credit Suisse (UK) Limited, both authorized by the Prudential Regulation Authority and regulated by the Financial Conduct Authority and the Prudential Regulation Authority, are associated but independent legal entities within Credit Suisse. The protections made available by the Financial Conduct Authority and/or the Prudential Regulation Authority for retail clients do not apply to investments or services provided by a person outside the UK, nor will the Financial Services Compensation Scheme be available if the issuer of the investment fails to meet its obligations. This document is distributed in Guernsey by Credit Suisse (Channel Islands) Limited, an independent legal entity registered in Guernsey under 15197, with its registered address at Helvetia Court, Les Echelons, South Esplanade, St Peter Port, Guernsey. Credit Suisse (Channel Islands) Limited is wholly owned by Credit Suisse AG and is regulated by the Guernsey Financial Services Commission. Copies of the latest audited accounts are available on request. This document is distributed in Jersey by Credit Suisse (Channel Islands) Limited, Jersey Branch, which is regulated by the Jersey Financial Services Commission. The business address of Credit Suisse (Channel Islands) Limited, Jersey Branch, in Jersey is: TradeWind House, 22 Esplanade, St Helier, Jersey JE2 3QA. This document has been issued in Asia-Pacific by whichever of the following is the appropriately authorised entity of the relevant jurisdiction: in Hong Kong by Credit Suisse (Hong Kong) Limited, a corporation licensed with the Hong Kong Securities and Futures Commission or Credit Suisse Hong Kong branch, an Authorized Institution regulated by the Hong Kong Monetary Authority and a Registered Institution regulated by the Securities and Futures Ordinance (Chapter 571 of the Laws of Hong Kong); in Japan by Credit Suisse Securities (Japan) Limited; this document has been prepared and issued for distribution in Singapore to institutional investors, accredited investors and expert investors (each as defined under the Financial Advisers Regulations) only, and is also distributed by Credit Suisse AG, Singapore Branch to overseas investors (as defined under the Financial Advisers Regulations). Credit Suisse AG, Singapore Branch may distribute reports produced by its foreign entities or affiliates pursuant to an arrangement under Regulation 32C of the Financial Advisers Regulations. Singapore recipients should contact Credit Suisse AG, Singapore Branch at +65-6212-2000 for matters arising from, or in connection with, this report. By virtue of your status as an institutional investor, accredited investor, expert investor or overseas investor, Credit Suisse AG, Singapore Branch is exempted from complying with certain compliance requirements under the Financial Advisers Act, Chapter 110 of Singapore (the “FAA”), the Financial Advisers Regulations and the relevant Notices and Guidelines issued thereunder, in respect of any financial advisory service which Credit Suisse AG, Singapore branch may provide to you. ; elsewhere in Asia/Pacific by whichever of the following is the appropriately authorized entity in the relevant jurisdiction: Credit Suisse Equities (Australia) Limited, Credit Suisse Securities (Thailand) Limited, Credit Suisse Securities (Malaysia) Sdn Bhd, Credit Suisse AG, Singapore Branch, and elsewhere in the world by the relevant authorized affiliate of the above.This document may not be reproduced either in whole, or in part, without the written permission of the authors and Credit Suisse. Copyright © Elroy Dimson, Paul Marsh and Mike Staunton. Copyright 2015 Credit Suisse Group AG and/or its affiliates. All rights reserved.
Imprint
CREDIT SUISSE GLOBAL INVESTMENT RETURNS YEARBOOK 2015_66

Also published by the Research Institute
The shale revolutionDecember 2012
Family businesses:Sustaining performanceSeptember 2012
Global Wealth Report 2012October 2012
Emerging Consumer Survey 2013 January 2013
Credit Suisse Global Investment Returns Yearbook 2013February 2013
Latin America: The long roadFebruary 2014
SugarConsumption at a crossroadsSeptember 2013
Global WealthReport 2013October 2013
Emerging Consumer Survey 2014 February 2014
Credit Suisse Global Investment Returns Yearbook 2014February 2014
The CS Gender 3000:Women in Senior ManagementSeptember 2014
Global WealthReport 2014October 2014
Emerging Consumer Survey 2015 January 2015
Emerging capital markets: The road to 2030July 2014
The Success of Small CountriesJuly 2014
CREDIT SUISSE GLOBAL INVESTMENT RETURNS YEARBOOK 2015_67

RC
E 1
5460
14
ISB
N 9
78-3
-952
4302
-2-4
0
2/20
15
CREDIT SUISSE AGResearch InstituteParadeplatz 8CH-8070 ZurichSwitzerland
[email protected]/researchinstitute
neutralPrinted Matter
No. 01-14-637273 – www.myclimate.org© myclimate – The Climate Protection Partnership
PERFORMANCE