global issues in comparing vaccination strategies dr lara wolfson vaccine assessment &...
Post on 20-Dec-2015
218 views
TRANSCRIPT
Global Issues in Comparing Vaccination Strategies
Dr Lara Wolfson
Vaccine Assessment & Monitoring
Department of Immunization, Vaccines & Biologicals

Vaccination Strategies: WHO• Overview of work at WHO
• Examples of current work
• Unmet needs

Measuring Mortality and Morbidity1. Estimates of current disease
burden for vaccine-preventable diseases
2. Forecasts of future disease burden & cost-effectiveness under different vaccination scenarios
3. Methods and Materials to assist RO’s and countries in estimation and forecasting of disease burden, introduction of new vaccines, cost-effectiveness assessments
4. Support to users of burden of disease data, technical assistance for cost-effectiveness
Innovation
Accelerated Disease Control
Immunization Systems

Age-specific
mortality rates
5q045q15
Life tables
Complete vital
registration
Sample registration
system
Incomplete vital registration
DHS and other surveys
Censuses
No recent data
UN estimatesCause-specific
mortality patterns
Independent studies / reports /
models
Country level age, sex and cause
specific mortality estimates
UN population
estimates
Epidemiological data from studies, verbal autopsies,
WHO programme estimates (child, maternal,
injuries, non-communicable, TB,
HIV/AIDS)
All-cause mortalityenvelope by age and sex
Estimating (Total) Mortality at WHO

Vaccine-Preventable Diseases: 24%
Other76.77%
Polio0.00%
JE0.02%YF
0.05%Hib
0.68%Tetanus0.37%
Pertussis0.52%
Rotavirus0.79% Hepatitis B
1.05%Measles1.07%
Diphtheria0.01%
Malaria2.23%
TB2.75%
Diarrhoea (other)2.37%
Mening A/C0.05%
Pneumococcal2.83%
ALRI (Other)3.56%
HIV4.87%

Causes of 4.1 M Child Deaths, 2002
Measles13%
Hib9%
Rotavirus10%
Pneumococcal17%
Malaria29%
HIV9%
TB1%
Meningococcal A/C, JE
<1%
Pertussis7%
Tetanus5%
YF, Diphtheria, Polio, Hepatitis B
0%

Proportional Mortality Approaches
N oninfe c tiou s
D ia rrhoe a
C roup A c ute b ronc hitis
R S V Influe nz a
V ira l
S . p ne um onia e H ib
B a c te r ia l
P ne um onia
A R I
Infe c tiou s
O ve ra ll m orta lity

Natural History Approaches
H ib S . p ne um onia e
B a c te r ia l V ira l
U ntre a te d p ne um onia
N o a c c e ss to he a lth c a r e
T re a te d p ne um onia
A c c e ss to he a lth c a r e
Infe c te d N on infe c te d
E xp ose d U ne xp ose d
S usc e p tib le N on s usc e p tib le
P op ula tio n

Looking at all the sources of data
Method 1
Method 3Method 2
Best estimate
Prim
ary
data V
alidatio
n
Sensitivity analysis

General Approach• Get best data/information (literature/grey literature review)
• Primary data
• Secondary data
• Seek expert advise/opinion• natural history of the disease
• methods/models
• context
• Develop consultative process with ROs/countries
• Develop best methods/models
• Use best assumptions/probabilities
• Conduct sensitivity analysis
• Validate/check consistency & coherence
• Document (explicit & transparent)
• Subject to in-house review, then expert review

Expected Outputs• Burden of Disease Estimates
– By country, age group, sex, year– With estimates of uncertainty, document methods– Country consultation, continuous update of inputs
(?!?)
• "Scenarios" (aka Comparing Strategies)– Recommendations for best practice– Tools for use at country level– Provide support to advocacy efforts
• Cost-Effectiveness– Tools and guidelines, training, support

HQ produces burdenof disease estimates
Develop scenario modelsAnd database of inputs
Develop costing tools and guidelines
CountryRequests
CEA assistance
Targeted Country forField-testing
orEvaluation
Collaborate with countryOn CEA
Publish methods, databaseOf results, inputsCountry clearance
Simultaneous
IF!
Publish tools
Publish tools
Update annually

GAVI and the Vaccine Fund• 75 out of 192 member states with GNI
<$1000 eligible for support
• Immunization Systems Strengthening (ISS) support –performance/reward based system
• New Vaccine Support (NVS) – vaccine provided for 1st five years
• "Next Window" – 2005-2009
• ICF (Investment Case Framework)

The ADIP Paradigm

The Example: Measles• Need to develop a method for estimating
measles mortality and morbidity• Measure progress towards Measles Mortality
Reduction Goal (50% reduction in measles deaths from 1999-2005)
• Evaluate the impact of supplemental immunization activities (SIA’s) and routine coverage
• Develop a tool for countries to use to estimate their own disease burden and monitor progress

"Current" Burden of Measles1 1 1 2
Year i 1 1 1
1 2
All Ages Year iYear i
Age Group jYear i
1 (1 ) (1 )
Protected = (1 100% ) (1 90% )
(1 80% )
(1 Protected )
Protected <80% Protected >80
=
i i
i
VE MCV VE MCV
VE SIA VE SIA
VE SIA
Cases Births
Cases
All AgesYear i
Age Group j Age j Age Group jYear i Year i
% Age Group
12% 12% <1
65% 47% 1 to 4
18% 25% 5 to 9
4% 11% 10 to 14
1% 5% 15 to 19
Cases
Deaths Cases CFR

CFR Literature Review
CFR
0 10 20 30 40 50
New Zealand N=1Sri Lanka N=2
Marshall Islands N=1Zambia N=1Somalia N=1
Bangladesh N=6Pakistan N=1
India N=33Peru N=2
Nigeria N=1Myanmar N=3
DR Congo N=1Phillipines N=1
Burundi N=1Chad N=1
Malawi N=2Gambia N=6Senegal N=7
Zimbabwe N=1Niger N=2
Guinea-Bissau N=6Ghana N=1
Ethiopia N=1Thailand N=1
Kenya N=2
Country (N)
Summary Data (with confidence intervals): 12 to 23 Age Group

869,000 in 1999 to 610,000 in 2002
0.0
0.5
1.0
1.5
2.0
2.5
3.0
Mill
ion
s o
f D
eath
s
Deaths Averted

Measles: Comparing Vaccination Strategies in 35 African Countries, 2005-2015
0
100
200
300
400
500
600
700
2002 2003 2004 2005 2006 2007 2008 2009 2010 2011 2012 2013 2014 2015
An
nu
al D
eath
s (
tho
usa
nd
s)
(Th
ou
san
ds)
Constant Routine Constant Routine + 2nd Opportunity Best Estimates Routine Best Estimates Routine + 2nd Opportunity (Project) Reaching 90% Routine Reaching 90% Routine + 2nd Oppportunity

SIR Model for 192 Member States ( , ) 1 ( , ) ( , ) ( , ) ( , ) ( , ) (1 ( , )) ( , )
( , ) ( , ) ( , ) ( , ) ( , ) ( , )
( , ) ( , ) ( , ) ( , ) (1 ( , )) ( , )
where
( , ) The "birth rate" (in
dS dSa t p a t a t S a t a t S a t p a t S a t
da dtdI dI
a t S a t a t I a t a t I a tda dtdR dR
a t I a t a t R a t p a t S a tda dt
a t
crease in population) of age at time
( , ) The force of infection for age group at time
( , ) The immunization rate of age group at time
( , ) The "death rate" (decrease in population) of
a t
a t a t
p a t a t
a t
age at time
( , ) The death rate (due to all causes) among those infected with
measles of age at time
( , ) The recovery rate for age group at time
a t
a t
a t
a t a t

How to calculate R0?
t
t-1
Immigrant Infections
0,
.3Density0, 0, 1 Density
1tCases
t
t
t t
Rt
Pop
where
R R

Looking at Scenarios

Disease/syndrome Lit review
Data extracte
d
Model develop
ed
Current Estimat
es
Estimates
Deaths/Cases
Averted
WHO Clearan
ce
Expert review
Methods written
Country review
process complet
ed
Manuscript submitted
Published
Measles - static modelpartial partial
completed
completed
completed
completed
completed completed
completed
Measles - SIR model
Measles - prop model
Pertussis completed
completed
completed
completed
completed yes
PolioNA NA
completed
completed NA completed
Neonatal tetanus completed Q1 2004
Maternal tetanus
Q2 2004 Q2 2004 Q4 2004
Total tetanus
Q2 2004 Q2 2004 Q4 2004
Hepatitis B
Q1 2004 Q1 2004 Q2 2004 Q2 2004 Q2 2004
Hib meningitis
Q3 2004
Hib pneumonia
Q1 2004 Q1 2004 Q1 2004 Q3 2004 Q1 2004 Q3 2004

Work that is needed (urgently!!)High Priority/Some Work
Started
• Pneumococcal Disease (Meningitis, Pneumonia)
• Rotavirus• Yellow Fever• Rubella/CRS• Diphtheria
Lower Priority/Not Started
• Meningoccocus A/C• Japanese Encephalitis• Mumps• Dengue• Typhoid • Cholera • ETEC• Papillomavirus• RSV• Shigella• Streptococcus group A• Infant TB

CEADisease Costing
Tools
Costing studies completed
Costing studies in progress
Measles Yes Burkina Faso, Kenya, Tanzania, Laos, Zambia, Rwanda
Sudan, Nepal, Philippines, Afghanistan, Kazakhstan, Turkey, Kosovo
Neonatal Tetanus
Pakistan Indonesia
Hepatitis B Yes Mozambique, Mongolia
Hib Yes Moscow, Albania, Thailand
Rubella In progress Oman, Fiji, Tonga
Pneumococcal Yes South Africa, Kenya
Polio South Africa
Rotavirus In progress Ghana
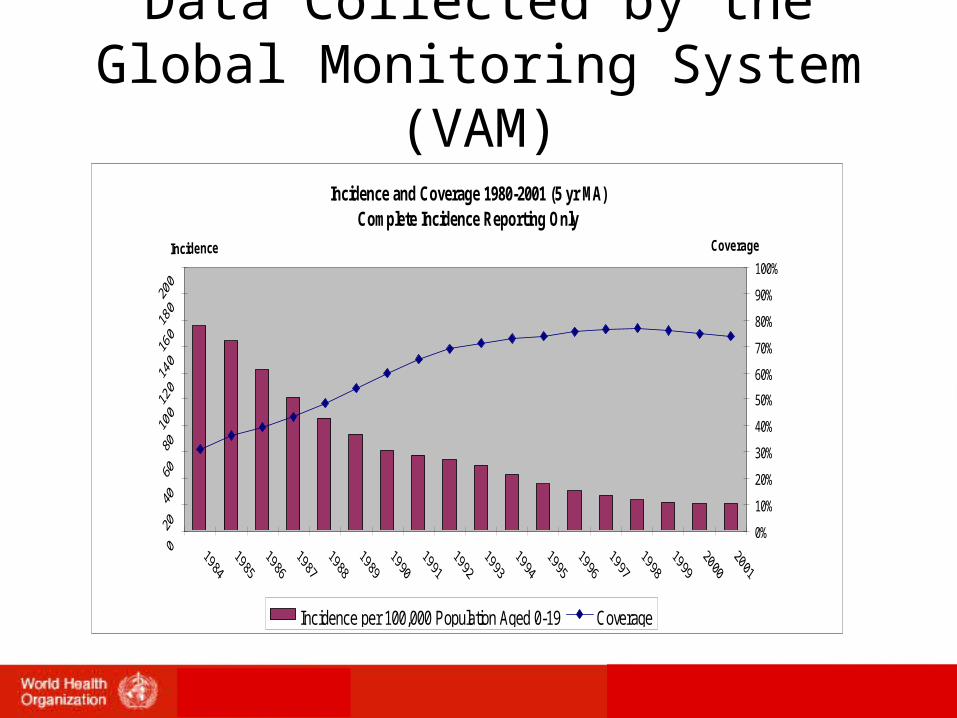
Data Collected by the Global Monitoring System (VAM)
Incidence and Coverage 1980-2001 (5 yr MA)Complete Incidence Reporting Only
0%
10%
20%
30%
40%
50%
60%
70%
80%
90%
100%
Coverage
Incidence per 100,000 Population Aged 0-19 Coverage

Mixed Bag of Needs• Simple tools for use in country to make
policy decisions – but validated compared to complex methods.
• Valid assessments of current burden of disease (MDG!!)
• Guidance on plugging "data holes"
• Introduction of new vaccines