global it market outlook - itfinditfind.or.kr/smartkorea/2009/t3_1.pdfjune 08 forecast october 08...
TRANSCRIPT
© 2009 IDC
Global IT Market Outlook
Nov./17 2009

© 2009 IDC
1. Leverage
3. Bank Liquidity IssuesBank Solvency Issues
Inter-bank Risk Aversion
2. Higher Default RatesCash Flows with Securities
4. Credit CrunchLiquidity Needs
7. Bailout
The Financial Crisis Affects the Real Economy
5. LargeCorporations
5. Small Businesses
6. Recession –Payment Stress
Jobless

© 2009 IDC Source: IMF, Consensus Economics, Inc., EIU
An Economic Shock
Worldwide GDP Forecast
4.0%
1.8%
3.8%
3.0%2.7%
4.1%3.8%
3%
3.8%
3.8%3.1%
2.5%
-1.1%
2.4%
1.2%
2.5%
2.6%
-2.5%-3%
-2%
-1%
0%
1%
2%
3%
4%
5%
2007 20082009
2010 2011 2012
0.3%0.6%
June 08 Forecast October 08 Forecast March 09 Forecast
April 09 EIU July 09 IMF October 09 IMF
Reactive Approach to Crisis
Most companies have taken short-
term actions focused on cost
containment and capital
expenditure cutbacks, aimed at
keeping cash in the business
• i.e. they have reduced or
postponed investments in
equipments, machinery or plant
property
© 2009 IDC
Observed Impact on IT Industry & IT Spending
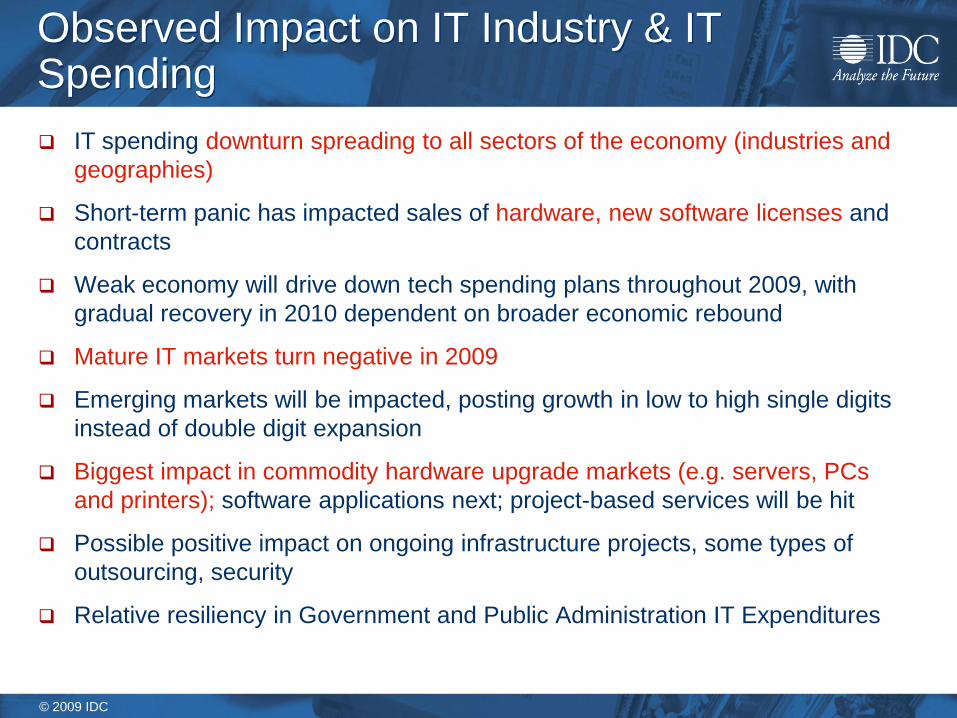
IT spending downturn spreading to all sectors of the economy (industries and
geographies)
Short-term panic has impacted sales of hardware, new software licenses and
contracts
Weak economy will drive down tech spending plans throughout 2009, with
gradual recovery in 2010 dependent on broader economic rebound
Mature IT markets turn negative in 2009
Emerging markets will be impacted, posting growth in low to high single digits
instead of double digit expansion
Biggest impact in commodity hardware upgrade markets (e.g. servers, PCs
and printers); software applications next; project-based services will be hit
Possible positive impact on ongoing infrastructure projects, some types of
outsourcing, security
Relative resiliency in Government and Public Administration IT Expenditures

© 2009 IDC
2008-2009 IT Spending Growth
Worldwide Black Book vQ3 2009
3.1%
-1.2%
5.4%
-20.1%
15.7%
11.4%
-2.4%
3.6%1.6%
-2.2%
2.1%
-3.9%
3.1%
-3.1%
-25%
-20%
-15%
-10%
-5%
0%
5%
10%
15%
20%
2008
2009
APJ
C&E. Europe
LA
MEA
N. America
W.E
Worldwide
IT Spending to Decline in 2009 in Most Regions
© 2009 IDC
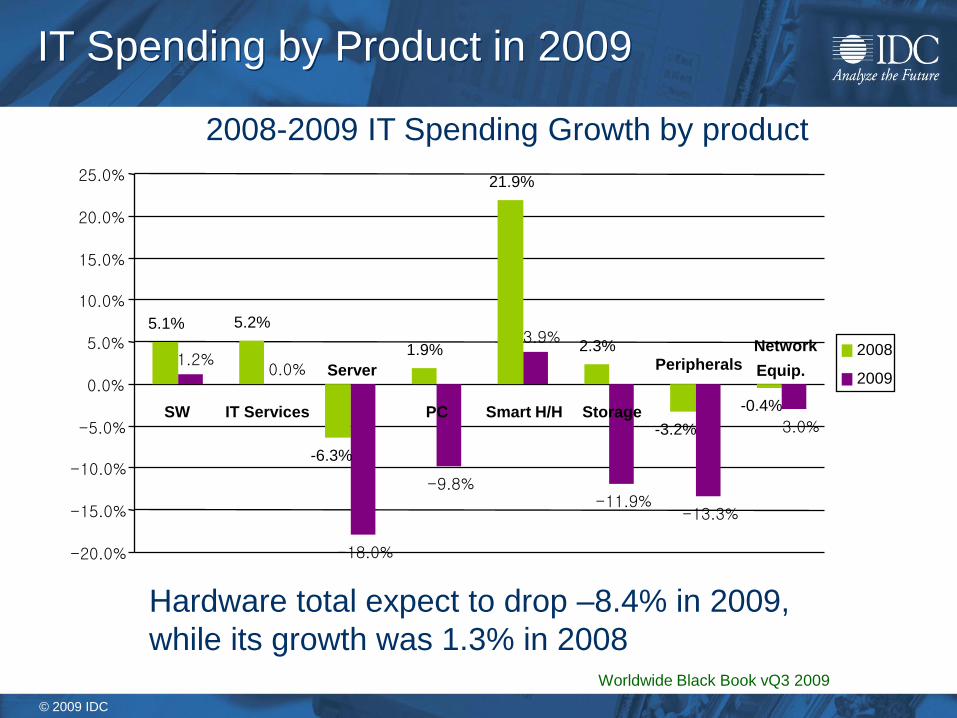
2008-2009 IT Spending Growth by product
Worldwide Black Book vQ3 2009
IT Spending by Product in 2009
5.1% 5.2%
-6.3%
1.9%
21.9%
2.3%
-3.2%
-0.4%
1.2%0.0%
-18.0%
-9.8%
3.9%
-11.9%-13.3%
-3.0%
-20.0%
-15.0%
-10.0%
-5.0%
0.0%
5.0%
10.0%
15.0%
20.0%
25.0%
SW IT Services
Server
PC Smart H/H Storage
PeripheralsNetwork
Equip.
2008
2009
Hardware total expect to drop –8.4% in 2009,
while its growth was 1.3% in 2008

© 2009 IDC
Looking Forward:An Economic Unknown
$1-3 Trillion ForBank Bailouts
Tax Cuts
Smart Grid
SMB Incentives
Health Care
Infrastructure
Broadband
Auto Manufacturers
Green Building

© 2009 IDC
In the Meantime, Some Opportunities
Hot
Enterprise Social Media
Security Management
Mobile Data
Business Analytics
IT Outsourcing & BPO
SaaS
Virtual Machine SW
Internet Advertising
Search & Discovery
Storage Replication
Cold
Commodity Hardware
Project Based Consulting
Mobile Voice
IT Training
Finance & Accounting
ERP
Sales Force Automation
Manufacturing SW
DSL
Large Enterprise IT
Watch These
Virtualization Mgt SW
Real Time Analytics
Ethical Hacking
IP Surveillance
Location Based Services
Smart Grid
Video Search
Compliance
Reputation Mgt SW
MPOG Virtual Artifacts

© 2009 IDC
IDC Asia/Pacific CIO Survey:
Source: IDC AP CIO Surveys (March 2008) N=219
‘Strategy formulation’
‘Innovation’
‘Leveraging IT to
achieve bus. Goals’‘Attracting &
retaining talent’‘IT vendor/supplier
partner mgt’
‘External customer
Satisfaction’
‘Internal customer
Satisfaction’
‘Effectively
supporting LOB’
‘Budget management’
‘On-time project completion’
What are the top 3 leading KPIs (key performance indicators) that shape your role?
Asia/Pacific-based CIO Priorities TodayKey Performance Indicators

© 2009 IDC
0%
10%
20%
30%
40%
50%
60%
70%
80%
90%
100%
Strategy formulation
Innovation
Leveraging IT to achieve bus. goals
Revenue target
Attracting & retaining talent
IT vendor/supplier/partner mgt
External customer satisfaction
Internal customer satisfaction
Effectively supporting LOB
Budget management
On-time project completion
Running
IT
Growing
IT
Transforming
IT
Asia/Pacific CIO Poll:
What are the top 3 leading KPIs (key performance indicators) that shape your role?
Asia/Pacific-based CIO Priorities TodayKey Performance Indicators
Source: IDC AP CIO Surveys (March 2008) N=219

© 2009 IDC
0%
10%
20%
30%
40%
50%
60%
70%
80%
90%
100%
Strategy formulation
Innovation
Leveraging IT to achieve bus. goals
Revenue target
Attracting & retaining talent
IT vendor/supplier/partner mgt
External customer satisfaction
Internal customer satisfaction
Effectively supporting LOB
Budget management
On-time project completion
Asia/Pacific CIO Poll:
What are the top 3 leading KPIs (key performance indicators) that shape your role?
Running
IT
Growing
IT
Transforming
IT
Asia/Pacific-based CIO Priorities TodayKey Performance Indicators
Source: IDC AP CIO Surveys (March 2008) N=219

© 2009 IDC
Emerging Markets, SMB Outperform
Emerging markets growth will drop
But be 3X overall market growth
“BRIC + 9” will drive this growth
Middle East & Africa will be a
bright spot in 2010
SMB IT spending will drop
But be 1.4X market growth

© 2009 IDC
Resilient Geographies
-22.5
-1.8
-0.4
0
0.1
1.5
2.5
5.7
5.7
5.9
6.5
9.1
14.3
15.9
-27.5
-5.6
-3.2
-2.7
-2.1
-3.3
-0.4
5.3
4.8
1
3.9
-16.1
1.5
2
-30 -20 -10 0 10 20
Russia
Japan
France
UK
USA
Canada
Turkey
India
Brazil
South Africa
China
UAE
Peru
Saudi Arabia
Q2 2009
Q4 2008
Worldwide IT Spending Growth 2009 (%)
Source : IDC Worldwide Black Book, Q4 2008 & Q2 2009

© 2009 IDC
IT Staff (000) Servers (M) Mobile Internet
Users (M)
Non
Traditional
Devices (M)
Information
(EB)
User
Interactions (B
per Day)
WW Growth from 2008-2012
The Technology Catalyst
1.1X1.9X
3.0X
3.6X
4.5X
8.4X
1,242
442
2008 20120
4,000
8,000
12,000
2008 2012
All OtherComputers
470
2,500
2008 2012
56
475
2008 2012
Efficiency
Resource Sharing
Complexity
Economy of Scale
Off Premises

© 2009 IDC
Expansion to the Cloud Accelerates
Growth will slow, but still expand
growth edge over traditional offerings
Lots of vendor movement…
Oracle, HP get strategic on Cloud
IBM will go into “fast ramp” phase
IT Services players will get on board
Lots of cross-sector Cloud partnerships
Next generation, cloud-enabled systems (“enterprise cloud”)
“Bridges” between Cloud services and on-premise systems
Emergence of Non conventional competitors like Google, etc

© 2009 IDC
Offline Misery Drives Online Sales
Online people will exceed 1.5 billion in
2009 (~1/4 of the planet)
Online commerce – while slower – will
break the $8 trillion barrier, take share
Online advertising – under pressure –
will reach 10% of total ad revenues in
the U.S.
Lots of online ad network
consolidation

© 2009 IDC
Green/Sustainable Tech Will Thrive
Green IT will be disguised as “cost
savings” in 2009
Offerings with near-term payback will
rise; big ticket will be pushed down the
agenda
Green Energy investments will focus on
efficiency and conservation in 2009
Smart metering, home area nets, in-
home displays, etc.
Emerging markets will be the epicenter
of innovation

© 2009 IDC
Government Initiatives Seed Growth
Economic development & education
Online (cloud) economic development,
training and innovation zones
Health and Energy industry
restructuring/streamlining
Notably in the U.S. and Europe
Financial markets stability and
transparency
Information management,
access/discovery, analytics
© 2009 IDC
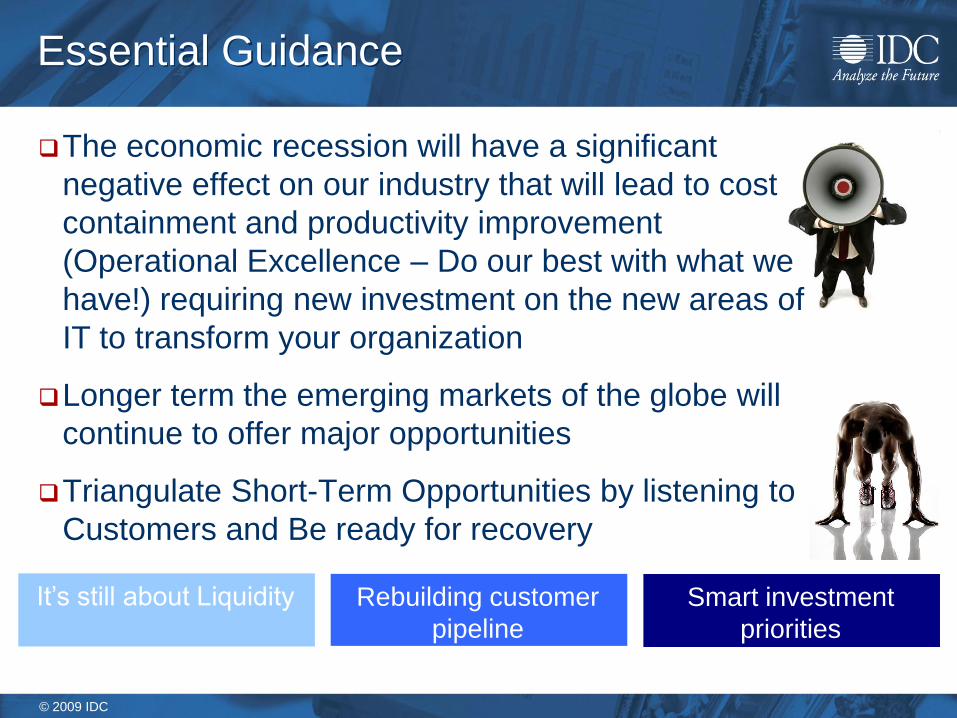
The economic recession will have a significant
negative effect on our industry that will lead to cost
containment and productivity improvement
(Operational Excellence – Do our best with what we
have!) requiring new investment on the new areas of
IT to transform your organization
Longer term the emerging markets of the globe will
continue to offer major opportunities
Triangulate Short-Term Opportunities by listening to
Customers and Be ready for recovery
Essential Guidance
It’s still about Liquidity Rebuilding customer
pipeline
Smart investment
priorities

© 2009 IDC
WW IT Market Outlook, 2007-2013
Source: (GDP) EIU Oct 2009, (IT Spending) IDC vQ3 WW Blackbook Oct 2009 Preliminary
-25.0
-20.0
-15.0
-10.0
-5.0
0.0
5.0
10.0
15.0
20.0
25.0
2007 2008 2009 2010 2011 2012 2013
APJ CEE LA MEA NA WE WW
2009(%) CAGR(%)
APJ -1.2 5
CEE -20.1 6.9
LA 1.6 8.4
MEA -2.4 10
NA -2.2 3.3
WE -3.9 2.5
WW -3.1 4
-10.0%
-5.0%
0.0%
5.0%
10.0%
15.0%
2007 2008 2009 2010 2011 2012 2013
Hardware SW IT Services Total IT

© 2009 IDC
Korea IT Market in 2008 & 2009
IT investments have been more limited and more highly scrutinized in 2009
-3.7%
2.8%1.1%
16.1%
3.5%
8.6%9.8%
4.7%3.0%
-3.7%
-12.1%
-4.3%
-15.0%
5.3%
-3.0%-2.1%
-20%
-15%
-10%
-5%
0%
5%
10%
15%
20%
PC HCP Server Disk Storage Network Equip. Packaged SW IT Service Total
2008 2009

© 2009 IDC
Korea IT Market Forecast, 2009 – 2013
In 2009, Overall IT market is
expected to be 17,045B won with
–2.1% of growth and will reach
19,691B Won in 2013 with 2.5 %
of CAGR.
A modest recovery will begin in
2010
Software market will mark
relatively higher growth, 7.1% of
5 year CAGR
Biggest impact has been on IT
SVC along with hardware
upgrade markets (and low profit
caused by severe price
competition)
There will be more spending on
software and services to enforce
compliance
(Billion Won)
0
2,000
4,000
6,000
8,000
10,000
12,000
14,000
16,000
18,000
20,000
22,000
2008 2009 2010 2011 2012 2013
-5%
-3%
-1%
1%
3%
5%
7%
9%
11%
13%
Hardware Software IT Services
Hardware GR Software GR IT Svcs GR
Overall IT GR
CAGR
(09-13)
2.6%(SVC)
7.1%(SW)
0.6%(HW)
