global life actuarial internal use only assal-iais training seminar: market and credit risk in the...
TRANSCRIPT

Global Life Actuarial
INTERNAL USE ONLY
ASSAL-IAIS Training Seminar: Market and Credit Risk in the Swiss Solvency Test
22nd November 2012Alex Summers

© Z
uri
ch In
sura
nce
Com
pan
y L
td.
INTERNAL USE ONLY 2
Important note
The views expressed in this presentation are the presenter’s own and do not necessarily represent the views of either Zurich Insurance Group (Zurich), or FINMA
I am very grateful to colleagues within Zurich and at FINMA for their assistance in preparation
Further information from FINMA on the Swiss Solvency Test can be found on FINMA’s website at http://www.finma.ch

© Z
uri
ch In
sura
nce
Com
pan
y L
td.
INTERNAL USE ONLY 3
Agenda
Recap: risk calculations in SST
Market Risk in the SST
Scenario based modelling of market risk
Replicating Portfolios case study
Credit Risk in the SST

© Z
uri
ch In
sura
nce
Com
pan
y L
td.
INTERNAL USE ONLY 4
Risk based framework for calculating SST
Scenarios
Standard Models or Internal Models
Mix of predefined and company specific scenarios
Target Capital SST Report
Market Consistent Data and Best Estimate Assumptions
Market Risk
Credit Risk
Life
P&C
Market Value Assets
Risk Models Valuation Models
Best Estimate Liabilities
Risk margin
Output of analytical models (Distribution)
Health
Aggregation Method
Source: FOPI, 2007

© Z
uri
ch In
sura
nce
Com
pan
y L
td.
INTERNAL USE ONLY 5
Risk measure is 99% expected shortfall
Probability density of the change in available capital
Average value of available capital in the 1% “bad” cases = Expected shortfall
Probability < 1%
Economic balance sheet at t=1 (stochastic)
Year 1: uncertain
Catastrophes
Claims
Revaluation of liabilities due to new information
New business during one year
Change in market value of assets
Available capital changes due to random events
Year 0:
known
Best estimate of liabilities
Available Capital
Market value of assets
Economic balance sheet at t=0 (deterministic)
© Z
uri
ch In
sura
nce
Com
pan
y L
td.
INTERNAL USE ONLY 6
Market and credit risk in the SST
Market riskInterest rates, spreads, foreign exchange, equity alternative investments, volatilities
Credit riskComplete or partial defaultMigration: change in creditworthiness or rating
For groups: changes in value of intra-group loans and other Capital and Risk Transfer Instruments

© Z
uri
ch In
sura
nce
Com
pan
y L
td.
INTERNAL USE ONLY 7
Agenda
Recap: risk calculations in SST
Market Risk in the SST
Scenario based modelling of market risk
Replicating Portfolios case study
Credit Risk in the SST

© Z
uri
ch In
sura
nce
Com
pan
y L
td.
INTERNAL USE ONLY 8
Market risk is typically the dominant risk in SST, particularly for life insurers, but there is significant variation across companies
Source: FINMA SST report 2012

© Z
uri
ch In
sura
nce
Com
pan
y L
td.
INTERNAL USE ONLY 9
SST Standard Model for Market Risk
Incorporates large 82 risk drivers across 4 currenciesInterest rates of different termsCredit spreads for different rating classesSwap – Government spreadExchange ratesImplied volatilitiesEquitiesReal estateHedge funds, private equity, direct participations
Individual and pairwise combinations of stresses to available capitalConsider impacts on both assets and liabilities in case there is any loss absorbency
Simplifying assumptions of linear impact, underlying multivariate normal distribution
FINMA supply standard deviation and correlation parameters based on historical analysis
Covariance model for aggregation to overall analytic distribution for market risk
© Z
uri
ch In
sura
nce
Com
pan
y L
td.
INTERNAL USE ONLY 10
Worked example for market risk in SST standard model
Consider risk driver of 10 year CHF risk-free rate
Suppose a 100bp increase in the 10 year CHF risk-free rate reduces the market value of assets by CHF 1M, and reduces the best estimate liabilities by 1.2M
The sensitivity of available capital per bp is(-1-(-1.2))/100 = CHF 2000 /bp
FINMA supply an annual volatility parameter of 55bps, based on historical analysis
If this were the only contribution to market risk, the standard deviation of the distribution of available capital over one year would be estimated as (2000x55) = CHF 110k
Based on the assumption of a normal distribution, the 1 in 100 expected shortfall would then be 110k x 2.33 = CHF 256k

© Z
uri
ch In
sura
nce
Com
pan
y L
td.
INTERNAL USE ONLY 11
Internal models for market risk relax the simplifying assumptions, or else aim for a scenario based approach
Can consider different:Probability distribution functions for risk factorsProbability distribution parameters for risk factorsLoss functions e.g. non-linearCross-termsAggregation e.g. copulas, particularly for increased tail dependencies
Alternatively consider a stochastic approach using a real world economic scenario generator (ESG)
Dealing with dynamic hedging / dynamic portfolio management can be a challenge

© Z
uri
ch In
sura
nce
Com
pan
y L
td.
INTERNAL USE ONLY 12Source: FINMA SST report 2012
SST allows decomposition of market risk into different drivers. Comparison across companies shows significant variations

© Z
uri
ch In
sura
nce
Com
pan
y L
td.
INTERNAL USE ONLY 13
Market risk scenarios can make a significant contribution to overall SST target capital
Source: FINMA SST report 2012
Scenarios can help with communication and understanding of risks, supporting focus on mitigationTotal contribution of all scenarios to target capital is 10% for life, 19% for non-life

© Z
uri
ch In
sura
nce
Com
pan
y L
td.
INTERNAL USE ONLY 14
Agenda
Recap: risk calculations in SST
Market Risk in the SST
Scenario based modelling of market risk
Replicating Portfolios case study
Credit Risk in the SST

© Z
uri
ch In
sura
nce
Com
pan
y L
td.
INTERNAL USE ONLY 15
SST requires use of Internal Models except where Standard Model is adequate
The core of the SST framework are the underlying methodology and principles, not the standard models
Methodology of the Solvency Test
Internal Models Standard Models
Implicit and explicit prudence, limits, etc. to take into account
the approximations used for the standard model
Company specific approach and simplifications
Internal models are assessed with reference to the methodology of the SST framework
Valuation, risk measure, time horizon,…

© Z
uri
ch In
sura
nce
Com
pan
y L
td.
INTERNAL USE ONLY 16
Generic structure for scenario based model for SST economic capital calculations
Risk Factors Portfolio of Assets and Liabilities
Capital and Risk Transfer InstrumentsDependency
Assumptions
Scenarios
Profit and Loss
Valuation
s1, s2,…………..……., sn
e1, e2,………….……., en
SST economic capital models project the economic balance sheet 1 year into the future
In a scenario based model, future states of the world at t=1 have to be simulated. These states encompass the evolution of all relevant risk factors over the whole duration of the assets and liabilities
A key challenge is that revaluation of complex life insurance liabilities requires risk-neutral Monte Carlo valuation… within each of thousands of real-world scenarios

© Z
uri
ch In
sura
nce
Com
pan
y L
td.
INTERNAL USE ONLY 17
Real world scenarios one year into the future
Risk factors need to be projected to possible future states in one year’s time
The projections should lead to consistent states of the worldArbitrage-freeDependencies between the risk factors need to be taken into account, and might be higher in tails
Real world projection, not risk-neutral, based on observed historical data

© Z
uri
ch In
sura
nce
Com
pan
y L
td.
INTERNAL USE ONLY 18
Agenda
Recap: risk calculations in SST
Market Risk in the SST
Scenario based modelling of market risk
Replicating Portfolios case study
Credit Risk in the SST

© Z
uri
ch In
sura
nce
Com
pan
y L
td.
INTERNAL USE ONLY 19
The stochastic-on-stochastic challenge for market risk in the SST
t=0
For each future state of the world, a brute force approach would require a set of risk-neutral scenarios for full Monte Carlo simulation

© Z
uri
ch In
sura
nce
Com
pan
y L
td.
INTERNAL USE ONLY 20
A simplified central representation of liabilities makes SST assessment of market risks feasible and brings additional benefits• Helps quantify and understand market risk:
– Faster, simpler required capital calculations
– Identification of unrewarded risks, non-hedgeable ALM risk
– Improve quality of management information
© 2010 The Actuarial Profession www.actuaries.org.uk

© Z
uri
ch In
sura
nce
Com
pan
y L
td.
INTERNAL USE ONLY 21
Replicating portfolios are just one of a number of similar alternatives for market risk measurement in SST internal models
Different proxy methods describe liabilities and/or assets in different terms
Least Squares Monte CarloCurve fittingReplicating Portfolios
All three approaches can be mathematically equivalent but practicalities and interpretations can differ
Replicating portfolios give additional ease of communication, understanding and a helpful link to ALM
© Z
uri
ch In
sura
nce
Com
pan
y L
td.
INTERNAL USE ONLY 22
Replicating Portfolios are directly compatible with SST Principles
Market-consistent valuationAll assets and liabilities are valued market consistently, including options and guarantees
Total balance sheet approachAll material financial instruments must be taken into account. As a result, there are no off balance sheet items
04/19/23

© Z
uri
ch In
sura
nce
Com
pan
y L
td.
INTERNAL USE ONLY 23
We can approximate valuation of a complex liability through a linear combination of financial instruments
© 2010 The Actuarial Profession www.actuaries.org.uk
GB
P
Time
Market value development
scenario 1
Market value development
scenario 2
Guarantee
Bonus scenario 1
Bond, replicating guarantee
European call options,
replicating bonus payments
In practice we replicate the results of a liability cash flow model, not the true value of the liability

© Z
uri
ch In
sura
nce
Com
pan
y L
td.
INTERNAL USE ONLY 24
Replicating portfolios allow transfer and creation of information about liabilities
Valuation, greeks and cash flow patterns can be obtained under any economic assumption quickly and easily
© 2010 The Actuarial Profession www.actuaries.org.uk
-400
-250
-100
2,000 7,000 12,000 17,000
Equity index
US
D m
illi
on
© Z
uri
ch In
sura
nce
Com
pan
y L
td.
INTERNAL USE ONLY 25
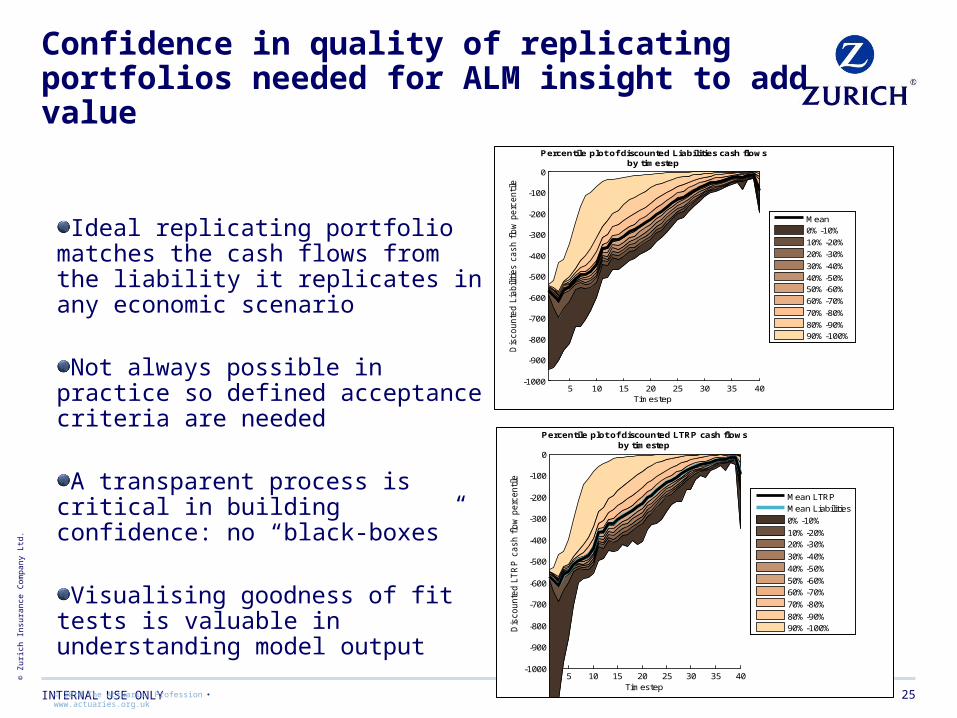
Confidence in quality of replicating portfolios needed for ALM insight to add value
Ideal replicating portfolio matches the cash flows from the liability it replicates in any economic scenario
Not always possible in practice so defined acceptance criteria are needed
A transparent process is critical in building confidence: no “black-boxes”
Visualising goodness of fit tests is valuable in understanding model output
© 2010 The Actuarial Profession www.actuaries.org.uk
5 10 15 20 25 30 35 40-1000
-900
-800
-700
-600
-500
-400
-300
-200
-100
0
Timestep
Dis
counte
d L
iabili
ties c
ash f
low
perc
entile
Percentile plot of discounted Liabilities cash flowsby timestep
Mean0%-10%
10%-20%
20%-30%
30%-40%
40%-50%50%-60%
60%-70%
70%-80%
80%-90%90%-100%
5 10 15 20 25 30 35 40-1000
-900
-800
-700
-600
-500
-400
-300
-200
-100
0
Timestep
Dis
counte
d L
TR
P c
ash f
low
perc
entile
Percentile plot of discounted LTRP cash flowsby timestep
Mean LTRPMean Liabilities
0%-10%
10%-20%20%-30%
30%-40%
40%-50%
50%-60%60%-70%
70%-80%
80%-90%90%-100%

© Z
uri
ch In
sura
nce
Com
pan
y L
td.
INTERNAL USE ONLY 26
Careful choice of scenarios for fitting and validation is important
•Using a wide range of scenarios gives confidence that replicating portfolios will suitably represent the market value of liabilities over the full distribution of one-year real world simulations
© 2010 The Actuarial Profession www.actuaries.org.uk

© Z
uri
ch In
sura
nce
Com
pan
y L
td.
INTERNAL USE ONLY 27
Standardised communication helps share insights beyond replicating portfolio experts
Standardised, automated reporting essential given high volume of data
Training users important
Careful analysis of constituents is useful
Reveals nature of risksDemonstrates stability over timeAvoiding “over-fitting”
Thought required before use as a benchmark for investment management
© 2010 The Actuarial Profession www.actuaries.org.uk
-12000
-10000
-8000
-6000
-4000
-2000
0 LTRP Asset Allocation by Market value - detailed
ZCB
Swaption
Equity Index Sell
Property Index Sell
CH
F (
mill
ions
)
Long
-20000
-18000
-16000
-14000
-12000
-10000
-8000
-6000
-4000
-2000
0RP Asset Allocation by Notional Value - detailed
ZCB
Swaption
Equity Index Sell
Property Index Sell
CH
F (
mill
ions
)
Long

© Z
uri
ch In
sura
nce
Com
pan
y L
td.
INTERNAL USE ONLY 28
Analysis of Economic Capital for market risk using replicating portfolios gives deeper understanding of drivers
© 2010 The Actuarial Profession www.actuaries.org.uk
Market value by 30 year interest rate
-2,000
-1,000
0
1,000
2,000
3,000
4,000
5,000
6,000
0% 1% 2% 3% 4% 5% 6% 7% 8% 9% 10% 11% 12%
30 year spot rate
LC
mill
ion
Average of surplus of all 10 000 scenarios (yellow triangle)
Surplus of all 10 000 scenarios (grey dots)
Average of surplus of 100 worst scenarios (green square)
Surplus of 100 worst scenarios (red dots)
SST benefits extend beyond risk measurement into risk management

© Z
uri
ch In
sura
nce
Com
pan
y L
td.
INTERNAL USE ONLY 29
Using replicating portfolios to analyse non-hedgeable market risk
The construction of replicating portfolios from candidate assets makes them ideal for identifying and understanding NH risks
Can evaluate NH market risks by considering differences between tradable and non-tradable replicating portfolios
A similar approach could be applied to apportioning required capital
© 2010 The Actuarial Profession www.actuaries.org.uk
Market value by 5 year interest rate
-3,000
-2,000
-1,000
0
1,000
2,000
3,000
4,000
5,000
6,000
0% 1% 2% 3% 4% 5% 6%
5 year spot rate
LC
mill
ion

© Z
uri
ch In
sura
nce
Com
pan
y L
td.
INTERNAL USE ONLY 30
Replicating portfolios can make SST modelling of CRTIs feasible for large groups
For SST, liability data are needed at both group and local level
Diversification benefits need careful allocation to give correct capital requirement
It can be very challenging to construct a dynamic model for interactions within an insurance group
Replicating portfolios can be rapidly revalued and so provide an effective solution
Legal Entity 2
Legal Entity 3
Legal Entity 1
Parent Company
Fungible capital
Market Value Margin
Group
Intra-group retrocession, contingent capital issued and received, etc.
Source: FINMA
Legal Entity 2
Legal Entity 3
Legal Entity 1
Parent Company
Fungible capital
Market Value Margin
Group
Intra-group retrocession, contingent capital issued and received, etc.
Source: FINMA
30© 2010 The Actuarial Profession www.actuaries.org.uk

© Z
uri
ch In
sura
nce
Com
pan
y L
td.
INTERNAL USE ONLY 31
Agenda
Recap: risk calculations in SST
Market Risk in the SST
Scenario based modelling of market risk
Replicating Portfolios case study
Credit Risk in the SST

© Z
uri
ch In
sura
nce
Com
pan
y L
td.
INTERNAL USE ONLY 32
Credit risk in SST standard model
SST credit risk model is based on standardised approach from Basel banking regulation
Simplicative multiplicative factor model:1. Assign a risk weighting factor according to counterparty and credit
rating2. Multiply market value of asset by risk weighting factor to give risk-
weighted market value of assets3. Multiply by 8%4. Sum across all holdings to give required capital
Risk weighting factors range from 0% for AAA government bonds, up to 1250% (=1/8%) for securitisations
Factors already incorporate diversification effects
Credit risk mitigation may be considered in calculation

© Z
uri
ch In
sura
nce
Com
pan
y L
td.
INTERNAL USE ONLY 33
SST Internal models for credit risk seek to address potential shortcomings of standard model
The standard credit risk model relies on external credit rating agencies, and does not take specific portfolio inter-dependency and diversification into account
Internal modelsMay consider refinements to probability of default or loss given defaultEnable a more realistic modeling of the stochastic dependency between counterpartiesTake diversification effects into accountCan enable a realistic modeling of the stochastic dependency between credit and market risk
FINMA requires that companies model both default and migration riskCredit Spread Risks are allocated under Market risk

© Z
uri
ch In
sura
nce
Com
pan
y L
td.
INTERNAL USE ONLY 34
Overview of market and credit risk in SST
SST allows a decomposition of required capital into different drivers
Scenarios play a key role in correcting tails of the distribution and aiding communication and understanding of risks
Market risks are often dominant but can be challenging to model
SST Standard Model for market risk is based on shocks both to individual risk drivers, and pairwise combinations
Replicating portfolios make modelling feasible
Credit risk modelling in SST is based on the Basel framework
Internal models may offer improved treatment of dependencies and diversification

© Z
uri
ch In
sura
nce
Com
pan
y L
td.
INTERNAL USE ONLY 35
Thank you for your attention
Any further questions?