global market analysis - food and agriculture … web...giews global information and early warning...
TRANSCRIPT

global information and early warning system on food and agricultureGIEWS
May 2012
Food Outlook Global Market Analysis
Table of conTenTs
fao food Price Indices (april 2011 - april 2012)
125
200
275
350
425
2011 2012
2002-2004=100
Dairy
Oils & FatsCereals
Sugar
Meat
AMFJDNOSAJJMA
Market summaries 1-9
Market assessments 10-60Wheat 10Coarse grains 14Rice 22Oilseeds, oils and meals 32 Sugar 41Meat and meat products 44Milk and milk products 51Fish and fishery products 54
Major policy developments Grains 20-21Rice 29-31Oilseeds 39-40Meat 48-50 special feature 61-67World market volatility challenges facing poor net food-importing countries and possible trade policy responses
statistical tables 68-105
Market indicators 106-117Historical and implied price volatility 106CBOT market participation 107Forward curves 109Ocean freight rates 111Food import bills 113The FAO price indices 115
HIGHLIGHTSGlobal food prices seem to have stabilized at a relatively high level of around 214 points as measured by the FAO Food Price Index. Although the outlook for the second half of this year and into the next indicates generally improved supplies, demand remains strong and global food import bill in 2012 is expected to fall only slightly from the 2011 record.
■ ceReals
World cereal production is heading towards a modest expansion in 2012 to a new record, more than sufficient to cover the projected cereal utilization in the new season (2012/13), and resulting in increasing global inventories.
■ WHeaT
The forecast for 2012 wheat production is cut sharply since March. However, global wheat supplies in 2012/13 are still expected to be adequate in view of an anticipated decline in utilization. As a result, international prices are likely to remain under downward pressure, barring any unexpected major supply shocks.
■ coaRse GRaIns
FAO’s first forecast for world production of coarse grains in 2012 points to a modest increase over 2011, but also to a new record. However, the higher production may result in only a partial replenishment of the low world stocks, a factor that may continue to provide support to prices.
■ RIce
Slackening import demand and the return of India as a major rice exporter are behind a weakening of international rice prices since September 2011. World rice crops in 2011 and 2012 are expected to exceed consumption lifting the world stock-to-use ratio to new highs.
■ oIlseeDs
International prices for oilcrops and derived products have appreciated strongly since January and should remain firm given the increasingly tight supply and demand situation of the current season. The market is thus increasingly focusing on 2012/13 planting intentions.
■ sUGaR
Despite falling production in Brazil, world sugar output in 2011/12 looks set to exceed consumption, generating a large surplus for the second consecutive year. Weakening import demand is forecast to result in a contraction of world trade but also in an easing of international sugar quotations from the high levels recorded in 2011.
■ MeaT
Global meat markets in 2012 are expected to see a recovery of supplies in traditionally importing countries and strong competition for markets. Near record prices are constraining consumption growth.
■ MIlK
International prices of dairy products are declining in the face of rising supplies. At the same time, import demand remains strong, keeping prices well above recent historical averages.
■ fIsH
Sustained demand for fish and fishery products is boosting aquaculture production worldwide and pushing prices higher. Overall production is expected to grow by at least 2 percent in 2012, supported by a strong increase in aquaculture output. Trade is expected to remain brisk with 2012 export values rising again.
ISSN 1560-8182
Acknowledgements
The Food Outlook report is a product of the FAO Trade and Markets Division (EST). It is written by a team of economists, under the overall
guidance of David Hallam (EST Director), whose names and contacts appear under their respective market summary contributions. Special
thanks go to Frank Rose and Ann Berg for their continuing contributions to the analysis of the futures market. The report also benefited from
research support by many colleagues, namely, David Bedford, Julie Claro, Berardina Forzinetti, Grace Karumathy, David Mancini, Patrizia
Mascianá, Marco Milo, Fiorella Picchioni, Barbara Senfter and the Fisheries statistical team.
Thanks also go to Rita Ashton for compiling the report and overall administrative support, as well as to Claudio Cerquiglini, for preparing the
charts and statistical tables. Additionally, the team is grateful to Nancy Hart for her editorial assistance.

Market summaries
May 2012 1
Cereal market summary
Cereal production, utilization and stocks
200
400
600
800
1800
2000
2200
2400
12/1310/1108/0906/0704/0502/03
Million tonnes Million tonnes
f’cast
Stocks (right axis)
Production (left axis) Utilization (left axis)
Contacts:
[email protected]@fao.org
World cereal market at a glance1
2010/11 2011/12 2012/13
Change: 2012/13
over 2011/12
estim. f'cast
million tonnes %
WORLD BALANCE
Production 2 253.7 2 344.1 2 370.7 1.1
Trade2 281.4 293.1 295.5 0.8
Total utilization 2 275.4 2 324.7 2 357.2 1.4
Food 1 059.4 1 073.4 1 084.7 1.1
Feed 763.8 789.8 806.6 2.1
Other uses 452.2 461.5 465.9 1.0
Ending stocks 500.6 515.2 524.0 1.7
SUPPLY AND DEMAND INDICATORS
Per caput food consumption:
World (kg/year) 153.3 153.6 154.1 0.3
LIFDC3 (kg/year) 160.0 160.7 162.4 1.1
World stock-to-use ratio (%) 21.5 21.9 21.7
Major exporters stock-to-disappearance ratio (%) 16.8 17.5 18.2
FAO CEREAL PRICE INDEX (2002-2004=100) 2010 2011 2012
Change: Jan-Apr 2012
over Jan-Apr 2011
Jan-Apr %
183 247 225 -11.7
1 Rice in milled equivalent.2 Trade refers to exports based on a July/June marketing season for wheat and coarse grains and on a January/December marketing season for rice.3 Low-Income Food-Deficit countries.
The FAO’s first forecast for world cereal production in 2012 points to a 1 percent (or 27 million tonnes) increase from 2011 to a new record of 2 371 million tonnes. Increases are expected for coarse grains and rice, while wheat may decrease.
Total cereal utilization is anticipated to expand by 1.4 percent in 2012/13, to 2 357 million tonnes, with feed utilization growing fastest and food consumption keeping pace with population. On the other hand, growth in industrial use of cereals for the production of biofuels is likely to stall after several years of strong gains.
Based on these early prospects for world production and utilization, world end-of-season cereal stocks for crop years closing in 2013 could increase to 524 million tonnes, roughly 9 million tonnes, or 1.7 percent, higher than their opening levels. This is not expected to result in any significant variation in the global stocks-to-use ratio, which is estimated to remain stable at roughly 22 percent. Among the major cereals, world carryovers are forecast to decline for wheat while increasing for coarse grains and rice. The forecast rise in inventories of coarse grains could still leave its stocks-to-use ratio at a precariously low level of 14.3 percent, up marginally from 2011/12.
World trade in cereals in 2012/13 is forecast to reach 295.5 million tonnes, slightly higher than in 2011/12. This increase mostly concerns maize, supported by rebounding supplies, more than offsetting an anticipated contraction in wheat, while rice trade is forecast to remain stable.
The FAO Cereal Price Index averaged 224 points in April 2012, down nearly 2 percent from March, with all cereals showing weakness, amid favourable supply prospects. In April, wheat prices on average were roughly 21 percent, maize 15 percent and rice 4 percent lower than the corresponding month last year.

Food Outlook
May 20122
Wheat market summary
The latest forecast for world wheat production in 2012
points to a sharper decline from 2011 than the FAO forecast
published in March. World wheat production in 2012 is
anticipated to fall by 3.6 percent from 2011 to 675 million
tonnes, with the largest declines forecast for Ukraine,
followed by Kazakhstan, China, Morocco and the EU. The
anticipated contractions in world production coincides with
expectation of a slight reduction in total wheat utilization
in the 2012/13 marketing season. This follows a significant
expansion of wheat utilization in the 2011/12 season, mainly
driven by an exceptional growth in feed demand. However,
given the expected recovery in supplies of coarse grains in
the coming season, the usage of wheat for annual feeding is
likely to fall to more normal levels.
Nonetheless, after a healthy stock build-up this season, wheat
inventories are projected to contract in the coming season,
falling by 6.5 percent to 183 million tonnes. The drop would
be even more significant if total wheat utilization were to
increase rather than fall as currently anticipated. This prospect
is also captured by the stocks-to-use ratios, which, in spite of
a projected drop from their high levels this season, would still
remain at relatively comfortable levels.
World wheat trade in 2012/13 is forecast to contract by
around 1.8 percent, after an almost 8.7 percent surge in
2011/12, reflecting a weakening of import demand, especially
for feed wheat. As a result, the pressure for prices to rise may
ease, notwithstanding the expected decline in world wheat
production. Large export supplies are also seen to weigh on
world markets indicating that, barring any major unexpected
supply shocks in the coming months, international prices are
likely to average lower than in 2011/12.
Wheat production, utilization and stocks
100
150
200
250
300
500
550
600
650
700
12/1310/1108/0906/0704/0502/03
Million tonnes Million tonnes
f’cast
Stocks (right axis)
Production (left axis) Utilization (left axis)Contacts:
[email protected]@fao.org
World wheat market at a glance
2010/11 2011/12 2012/13
Change: 2012/13
over 2011/12
estim. f'cast
million tonnes %
WORLD BALANCE
Production 655.6 700.0 675.1 -3.6
Trade1 124.6 137.4 135.0 -1.7
Total utilization 664.1 690.7 686.5 -0.6
Food 468.0 473.5 475.5 0.4
Feed 120.8 138.9 133.8 -3.7
Other uses 75.2 78.3 77.3 -1.3
Ending stocks 188.2 195.3 182.7 -6.5
SUPPLY AND DEMAND INDICATORS
Per caput food consumption:
World (kg/year) 67.7 67.7 67.5 -0.3
LIFDC (kg/year) 49.9 50.3 50.4 0.2
World stock-to-use ratio (%) 27.2 28.4 26.3
Major exporters stock-to-disappearance ratio2 (%) 19.8 20.3 18.6
FAO WHEAT PRICE INDEX3 (2002-2004=100) 2010 2011 2012
Change: Jan-Apr 2012
over Jan-Apr 2011
Jan-Apr %
169 222 193 -19.9
1 Trade refers to exports based on a common July/June marketing season.2 Major exporters include Argentina, Australia, Canada, EU, Kazakhstan, Russian Fed., Ukraine and the United States.3 Derived from International Grains Council (IGC) wheat index.

Market summaries
May 2012 3
Coarse grain market summary
The supply-and-demand outlook for coarse grains in
2012/13 remains very tentative at this early stage, when
plantings for this year’s crops are not even complete in
major producing countries of the Northern Hemisphere.
Nonetheless, based on the latest indications, world
production is heading towards a record in 2012, a welcome
development given the exceptionally tight supply situation
witnessed in 2011/12. The expansion in world production
is expected to be driven by an anticipated sharp rise in
plantings in the United States. However, the production
increase is unlikely to be sufficient to ease the market
tightness because of the very low level of opening stocks,
which also need to be replenished.
Compared to the current season, total utilization in 2012/13
is forecast to increase faster, boosted by higher feed use of
maize as opposed to wheat. World trade in coarse grains
is also set to expand, after a contraction in 2011/12, with
most of the increase concerning maize. Several countries,
especially in Asia, are likely to resume importing coarse
grains rather than wheat, especially as their prices may
become more competitive as the season proceeds.
World stocks of coarse grains are anticipated to increase by
the close of season in 2013, but perhaps not sufficiently. This
is evidenced by the very low projected stocks-to-use ratio,
which is estimated at 14.3 percent in 2012/13, only a notch
up from 14.0 percent in 2011/12, which was the lowest
ratio since at least 1980. More notably, the inventories held
by major exporters, as a group, may remain below average.
Coarse grain production, utilization and stocks
100
150
200
250
300
850
950
1050
1150
1250
12/1310/1108/0906/0704/0502/03
Million tonnes Million tonnes
f’cast
Stocks (right axis)
Production (left axis) Utilization (left axis)Contacts:
[email protected]@fao.org
World coarse grain market at a glance
2010/11 2011/12 2012/13
Change: 2012/13
over 2011/12
estim. f'cast
million tonnes %
WORLD BALANCE
Production 1 130.1 1 163.9 1 207.3 3.7
Trade1 121.6 121.3 126.0 3.9
Total utilization 1 150.5 1 165.6 1 193.7 2.4
Food 202.0 204.0 206.7 1.3
Feed 631.0 638.7 660.2 3.4
Other uses 317.5 322.9 326.8 1.2
Ending stocks 171.4 167.1 177.1 6.0
SUPPLY AND DEMAND INDICATORS
Per caput food consumption:
World (kg/year) 29.3 29.2 29.4 0.7
LIFDC (kg/year) 41.4 40.9 41.4 1.2
World stock-to-use ratio (%) 14.7 14.0 14.3
Major exporters stock-to-disappearance ratio2 (%) 10.6 9.7 11.0
FAO COARSE GRAIN PRICE INDEX (2002-2004=100) 2010 2011 2012
Change: Jan-Apr 2012
over Jan-Apr 2011
Jan-Apr %
176 277 262 -4.7
1 Trade refers to exports based on a common July/June marketing season.2 Major exporters include Argentina, Australia, Brazil, Canada, EU, Russian Fed., Ukraine and the United States.

Food Outlook
May 20124
Rice market summary
International rice prices have been easing since
September 2011, coinciding with the resumption of
massive exports of regular rice by India. The country’s
return to the international rice arena intensified
competition among exporters, virtually neutralizing
the positive effects that Thailand’s high producer price
policy had on world quotations. By April 2012, world
prices had shed 10 percent of their September value,
with all rice varieties affected.
World rice production is estimated to have expanded
by 2.6 percent in 2011. Under expectations of normal
weather and with the advancement of ambitious
sectoral development programmes, it is foreseen to
grow by a further 1.7 percent in 2012 to 488 million
tonnes (milled rice basis), notwithstanding some
disappointing first crop results in South America.
Trade in rice is forecast to fall by 2.6 percent in 2012,
mainly depressed by a reduction in purchases by
virtually all the major traditional importers. Among
exporters, Thailand is anticipated to witness a severe
contraction of sales, owing to uncompetitive pricing,
but still retain its leadership. Despite a slow start, Viet
Nam is expected to keep deliveries unchanged from
last year, remaining the second largest exporter. By
contrast, shipments from India look set to surge,
enough to make it into the third largest source of rice
trade, ahead of Pakistan and the United States.
Global rice productions in both 2011 and 2012 are
expected to outpace consumption for the seventh
and eighth consecutive years. As a result, world rice
stocks at the close of the 2011/2012 and 2012/2013
marketing seasons are forecast to increase, lifting the
world stock-to-use ratio to new highs.
Rice production, utilization and stocks
50
100
150
200
350
400
450
500
11/1209/1007/0805/0603/0401/02
Million tonnes, milled eq. Million tonnes, milled eq.
f’cast
Stocks (right axis)
Production (left axis) Utilization (left axis)
World rice market at a glance
2009/10 2010/11 2011/12
Change: 2011/12
over 2010/11
estim. f'cast
million tonnes %
WORLD BALANCE
Production 455.4 468.1 480.1 2.6
Trade1 31.5 35.2 34.3 -2.6
Total utilization 448.6 460.8 468.4 1.6
Food 382.4 389.3 395.9 1.7
Ending stocks 134.4 141.0 152.8 8.4
SUPPLY AND DEMAND INDICATORS
Per caput food consumption:
World (kg/year) 56.0 56.4 56.7 0.5
LIFDC (kg/year) 68.1 68.7 69.4 1.0
World stock-to-use ratio (%) 29.2 30.1 32.0
Major exporters stock-to-disappearance ratio2 (%) 20.8 20.0 22.7
FAO RICE PRICE INDEX (2002-2004=100) 2010 2011 2012
Change: Jan-Apr 2012
over Jan-Apr 2011
Jan-Apr %
229 251 233 -6.8
1 Calendar year exports (second year shown).2 Major exporters include India, Pakistan, Thailand, the United States and Viet Nam.
More detailed information on the rice market is available in the FAO Rice Market Monitor which can be accessed at:http://www.fao.org/economic/est/publications/rice-publications/rice-market-monitor-rmm/en/
Contacts:
[email protected]@fao.org

Market summaries
May 2012 5
Oilseeds market summary
After two seasons of relatively ample supplies, in
2011/12, the market for oilseeds and derived products
is set to tighten again. Global oilcrop production will
not be sufficient to satisfy growing demand for oils
and meals. Global soybean production is estimated to
decrease by almost 10 percent, one of the steepest
year-on-year falls on record. With oilcrops other than
soybeans only partly compensating for the shortfall,
total oilcrop production should drop by 4 percent
from last season to a three-year low. Notwithstanding,
a moderate growth in global oil supplies should be
possible, thanks mainly to further expanding palm oil
production and to the availability of large stocks at
the beginning of the season. Global meal supplies,
on the other hand, given their heavy dependence on
soybeans, anticipate to experience a pronounced drop.
With respect to demand, global consumption of oils/
fats should continue expanding at an about average
rate, which also reflects further rising demand from
the biodiesel industry. By contrast, growth in meal
consumption is expected to slow down markedly, as
reduced supplies and rising meal prices are expected
to curtail demand. In general, consumption growth
could only be satisfied by drawing from inventories
with a conspicuous reduction in global stocks of oils,
and especially meals, likely to be necessary. This will
push the global stock-to-use ratios for both product
groups to historically low levels. Consequently,
following the last few months’ rise in international
quotations for oilseeds and derived products,
continued firmness in prices seems likely. Adding to
market concerns is the prospect of only a modest, if
any, growth in 2012/13 aggregate oilcrop plantings
in the northern hemisphere, which would imply a
strong reliance on South America for an improvement
in the global supply situation.
50
100
150
200
250
300
20122011201020092008200720062005
Meals/cakes
Oils/fats
Oilseeds
FAO monthly international price indices for oilseeds, oils/fats and meals/cakes (2002-2004=100)
Contact:
World oilseed and product market at a glance
2009/10 2010/11 2011/12
Change: 2011/12
over 2010/11
estim. f'cast
million tonnes %
TOTAL OILSEEDS
Production 456.7 468.0 450.9 -3.7
OILS AND FATS
Production 172.6 179.9 181.9 1.1
Supply 196.4 208.8 212.5 1.8
Utilization 168.7 176.7 185.3 4.9
Trade 89.5 92.1 96.2 4.5
Stock-to-utilization ratio (%) 16.5 17.4 14.8
MEALS AND CAKES
Production 114.1 117.8 110.7 -6.0
Supply 128.2 136.9 131.9 -3.7
Utilization 107.4 113.6 116.0 2.1
Trade 67.2 69.9 70.5 0.9
Stock-to-utilization ratio (%) 17.8 18.7 13.2
FAO PRICE INDICES (Jan-Dec) (2002-2004=100) 2010 2011 2012
Change: Jan-Apr 2012
over Jan-Apr 2011
Jan-Apr %
Oilseeds 172 211 205 -7.2
Meals/cakes 217 212 203 -13.2
Oils/fats 194 252 242 -10.7
Note: Refer to table 11 for further explanation regarding definitions and coverage.
Food Outlook
May 20126
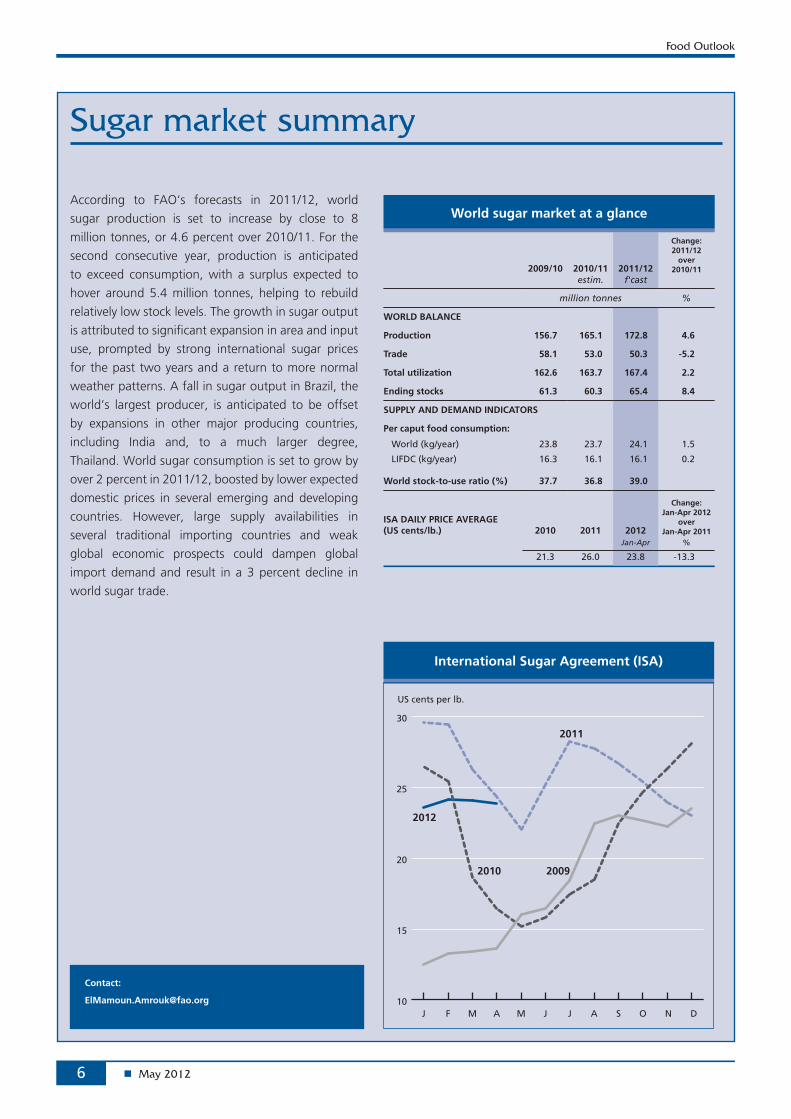
Sugar market summary
According to FAO‘s forecasts in 2011/12, world
sugar production is set to increase by close to 8
million tonnes, or 4.6 percent over 2010/11. For the
second consecutive year, production is anticipated
to exceed consumption, with a surplus expected to
hover around 5.4 million tonnes, helping to rebuild
relatively low stock levels. The growth in sugar output
is attributed to significant expansion in area and input
use, prompted by strong international sugar prices
for the past two years and a return to more normal
weather patterns. A fall in sugar output in Brazil, the
world’s largest producer, is anticipated to be offset
by expansions in other major producing countries,
including India and, to a much larger degree,
Thailand. World sugar consumption is set to grow by
over 2 percent in 2011/12, boosted by lower expected
domestic prices in several emerging and developing
countries. However, large supply availabilities in
several traditional importing countries and weak
global economic prospects could dampen global
import demand and result in a 3 percent decline in
world sugar trade.
International Sugar Agreement (ISA)
10
15
20
25
30
20092010
2012
2011
US cents per lb.
DNOSAJJMAMFJ
Contact:
World sugar market at a glance
2009/10 2010/11 2011/12
Change: 2011/12
over 2010/11
estim. f'cast
million tonnes %
WORLD BALANCE
Production 156.7 165.1 172.8 4.6
Trade 58.1 53.0 50.3 -5.2
Total utilization 162.6 163.7 167.4 2.2
Ending stocks 61.3 60.3 65.4 8.4
SUPPLY AND DEMAND INDICATORS
Per caput food consumption:
World (kg/year) 23.8 23.7 24.1 1.5
LIFDC (kg/year) 16.3 16.1 16.1 0.2
World stock-to-use ratio (%) 37.7 36.8 39.0
ISA DAILY PRICE AVERAGE (US cents/lb.) 2010 2011 2012
Change: Jan-Apr 2012
over Jan-Apr 2011
Jan-Apr %
21.3 26.0 23.8 -13.3

Market summaries
May 2012 7
Meat and meat products market summary
Driven exclusively by gains in poultry and pigmeat
production, global meat output is set to expand
by nearly 2 percent to 302 million tonnes in 2012.
Most of the sector growth is likely to originate in the
developing countries, as developed countries may
witness a second year of slipping output as profitability
stumbles in the face of high input costs, stagnating
domestic meat consumption and severe competition
from developing countries. The struggle for markets is
expected to intensify in 2012 as increased production in
key importing countries slows down global meat trade
expansion. This, combined with limited supplies in
developed exporting countries, is shifting international
market shares towards developing countries, in
particular Brazil and India.
Drought in the Unites States, the major world meat
exporter, and limited animal numbers in other exporting
countries have kept international meat prices at near
record levels in the first quarter of 2012. At 182 points
in April, the FAO meat price index was up from March,
supported by persistent gains in bovine and pigmeat
prices. Slowing global import demand and two years
of stagnating consumption in developed countries
may imply less price pressure in 2012; however, meat
production this year will hinge critically on feed prices
and the animal disease situation.FAO international meat price indices
(2002-2004 = 100)
70
100
130
160
190
220
20122011201020092008
Bovine
Poultry
Ovine
Total meat
Pigmeat
Contact:
World meat market at a glance
2010 2011 2012Change: 2012
over 2011 estim. f'cast
million tonnes %
WORLD BALANCE
Production 294.6 297.2 302.0 1.6
Bovine meat 67.5 67.5 67.5 -
Poultry meat 98.2 101.6 103.5 1.8
Pigmeat 109.9 109.0 111.7 2.6
Ovine meat 13.5 13.5 13.6 0.9
Trade 26.6 28.5 29.2 2.4
Bovine meat 7.7 7.8 8.1 4.0
Poultry meat 11.6 12.6 13.0 3.1
Pigmeat 6.2 7.1 7.0 -0.7
Ovine meat 0.8 0.7 0.7 1.4
SUPPLY AND DEMAND INDICATORS
Per caput food consumption:
World (kg/year) 42.5 42.3 42.5 0.5
Developed (kg/year) 79.2 78.9 78.4 -0.5
Developing (kg/year) 32.4 32.3 32.8 1.5
FAO MEAT PRICE INDEX (2002-2004=100) 2010 2011 2012
Change: Jan-Apr 2012
over Jan-Apr 2011
Jan-Apr %
152 157 179 3.3

Food Outlook
May 20128
Milk and milk products market summary
Prices of dairy products began to decline in mid-2011, as
supplies to the international market improved. In April,
after a favourable outcome of the milk-producing season
in the Southern Hemisphere and an equally positive
opening of the season in the Northern Hemisphere, prices
registered a further fall. The price slide reflected a rise in
export availability but also a fall in the value of the euro
against the US dollar. Yet, in spite of the recent drop,
international prices for dairy products remain well above
historical averages.
With publically financed inventories at minimal levels in the
EU and the United States, the market is particularly sensitive
to sudden changes in milk production and the availability of
milk products. Nonetheless, the positive supply outlook for
the rest of 2012 is likely to translate into further downward
pressure on prices.
World milk production in 2012 is forecast to grow by 2.7
percent to 750 million tonnes. Asia is expected to account
for most of the increase, but higher output is anticipated in
most regions.
World trade in dairy products is foreseen to continue
expanding in 2012. Demand remains firm, with imports
anticipated to reach 52.7 million tonnes of milk equivalent.
Asia will continue to be the main market, followed by
North Africa, the Middle East, and Latin America and the
Caribbean. Growing world import demand is expected to
be met mainly through pasture-based milk supplies from
Oceania and South America.
FAO international dairy price index (2002-2004=100)
50
150
250
350
201220102008200620042002200019981996
The index is derived from a trade-weighted average of a selectionof representative internationally traded dairy products.
Contact:
World dairy market at a glance
2010 2011 2012Change: 2012
over 2011 estim. f'cast
million tonnes, milk equiv. %
WORLD BALANCE
Total milk production 713.6 730.1 750.1 2.7
Total trade 47.8 50.7 52.7 4.0
SUPPLY AND DEMAND INDICATORS
Per caput food consumption:
World (kg/year) 103.3 104.5 106.1 1.6
Developed (kg/year) 233.4 234.3 237.8 1.5
Developing (kg/year) 67.8 69.5 71.1 2.2
Trade share of prod. (%) 6.7 6.9 7.0 1.2
FAO DAIRY PRICE INDEX (2002-2004=100) 2010 2011 2012
Change: Jan-Apr 2012
over Jan-Apr 2011
Jan-Apr %
200 221 198 -13.4

Market summaries
May 2012 9
Fish and fishery products market summary
Sustained demand for fish and fishery products is
boosting aquaculture production worldwide and pushing
prices higher, despite some consumer resistance in the
more traditional markets in southern Europe. Overall
production for the year is expected to grow by 2.1
percent to 157.3 million tonnes, thanks to a 5.8 percent
increase in aquaculture output that more than offset a
small decline in capture fisheries following limitations on
catches of small pelagic species in the Pacific.
Behind the strong demand for fish lies an increase in
average per capita food fish consumption, which grew
by 1.1 percent in 2011 and is expected to rise by a further
2.6 percent in 2012, reaching 19.2 kg per year. Most
of this increase is being met by fish from aquaculture
production, but with less fish used for feed during 2012,
capture fisheries will also contribute to the growth in
fish consumption as food.
International trade is expected to increase by 9.4 percent
in 2012, implying a slowing down compared with trade
growth in 2011.
Prices have increased over the last three quarters,
especially for captured species such as tuna, herring,
mackerel and squid. Farmed fish prices have been mixed,
salmon is down from 2011, while lower production of
farmed shrimp has boosted shrimp prices. The FAO Fish
Price Index was up 12.4 percent last year and is expected
to increase further. FAO fish price index (2002-2004 = 100)
80
105
130
155
180
201220102008200620042002200019981996
Data source: Norwegian Seafood Council
FAO total fish price index
Capture totalAquaculture TotalContact:
World fish market at a glance
2010 2011 2012Change: 2012
over 2011 estim. f'cast
million tonnes %
WORLD BALANCE
Production 148.5 154.0 157.3 2.1
Capture fisheries 88.6 90.4 90.0 -0.4
Aquaculture 59.9 63.6 67.3 5.8
Trade value (exports USD billion) 108.6 126.1 138.0 9.4
Trade volume (live weight) 56.7 58.5 60.2 2.9
Total utilization 148.5 154.0 157.3 2.1
Food 128.3 130.8 135.7 3.7
Feed 15.0 18.2 16.6 -8.5
Other uses 5.1 5.0 5.0 -
SUPPLY AND DEMAND INDICATORS
Per caput food consumption:
Food fish (kg/year) 18.6 18.8 19.2 2.6
From capture fisheries (kg/year) 9.9 9.6 9.7 0.6
From aquaculture (kg/year) 8.7 9.1 9.5 4.6
FAO FISH PRICE INDEX1 (2002-2004=100) 2010 2011 2012
Change: Jan-Apr 2012
over Jan-Apr 2011
Jan-Apr %
137 154 157 2.8
1 Data source: Norwegian Seafood Council

Food Outlook
May 201210
Figure 1. Wheat export price (US no. 2 H.W. Gulf)
100
200
300
400
2010/11
2009/10
2008/09
2011/12
USD per tonne
JMAMFJDNOSAJ
Figure 2. CBOT wheat futures for September
220
270
320
370
USD per tonne
S O N D J S M A
2011 values 2012 values
Market assessments
WHEAT
PRICES
Large supplies put downward pressure on pricesInternational wheat prices during the first half of the year
remained firm but below the corresponding period last
year. Large export supplies continued to weigh on wheat
quotations but price declines were restrained by strong
demand from the feed sector because of the continuing
tightness in global maize supplies. The benchmark US No.2 Hard Red Winter, f.o.b. Gulf averaged USD 280 per tonne
in April, down 5 percent from the beginning of year and 23
percent lower than in April 2011.
In the futures market, soft red winter (SRW) prices
at the Chicago Board of Trade (CBOT) fell even below the
CBOT maize values on several occasions in recent months.
This development, combined with the general narrowing of
the price spread between wheat and maize witnessed since
the start of the 2011/12 season, increased the appeal for
wheat over maize in feed rations. Looking ahead, wheat
futures for September delivery remained considerably below
their levels in the corresponding period last year and in late
April, Chicago wheat futures had averaged USD 240 per
tonne, down 4 percent from the start of the year. In spite of
the forecast decline in world wheat production this year, the
expectation of continued ample stocks, combined with the
anticipated strong recovery in maize supplies, is likely to keep
wheat prices under downward pressure.
PRODUCTION
Smaller wheat harvest expected in 2012FAO’s latest forecast of global wheat production in 2012
stands at 675 million tonnes, 15 million tonnes down from
the first tentative prediction in March and 3.6 percent down
from last year’s near record crop, but still well above the
average of the past five years. Although plantings increased,
or are forecast to increase, in many countries in response to
continuing high prices, indications earlier this year already
pointed to a slight decline in output as a return to normal
yields was expected in areas where record highs were
achieved last year. However, as the seasons advance, latest
information now shows a much more pronounced decrease,
largely because the impact of unfavourable winter weather
in some major producing parts of Europe, particularly in
the east, has been more severe than expected. Persisting
drought also slashed prospects in Morocco in North Africa
while the outlook for the spring crop planting in Central Asia
worsened due to prolonged dryness.
In North America, latest indications for wheat
production in the United States confirmed a strong
recovery from the below-average 2011 crop. The country’s
all-wheat area in 2012 is officially forecast to increase by
some 3 percent from 2011. The condition of the winter
wheat crop as of early April was reported to be much better
than in the preceding year, largely reflecting better moisture
availability in the Central and Southern Plains compared
to the drought situation of a year ago. Assuming normal
conditions until harvest, the aggregate 2012 wheat output
is forecast at 59 million tonnes. In Canada, prospects for the
main spring wheat crop planting, underway as of March,

Market assessments
May 2012 11
Table 1. World wheat market at a glance
2010/11 2011/12 2012/13
Change: 2012/13
over 2011/12
estim. f'cast
million tonnes %
WORLD BALANCE
Production 655.6 700.0 675.1 -3.6
Trade1 124.6 137.4 135.0 -1.7
Total utilization 664.1 690.7 686.5 -0.6
Food 468.0 473.5 475.5 0.4
Feed 120.8 138.9 133.8 -3.7
Other uses 75.2 78.3 77.3 -1.3
Ending stocks 188.2 195.3 182.7 -6.5
SUPPLY AND DEMAND INDICATORS
Per caput food consumption:
World (kg/year) 67.7 67.7 67.5 -0.3
LIFDC (kg/year) 49.9 50.3 50.4 0.2
World stock-to-use ratio (%) 27.2 28.4 26.3
Major exporters stock-to-disappearance ratio2 (%) 19.8 20.3 18.6
FAO WHEAT PRICE INDEX3 (2002-2004=100) 2010 2011 2012
Change: Jan-Apr 2012
over Jan-Apr 2011
Jan-Apr %
169 222 193 -19.9
1 Trade refers to exports based on a common July/June marketing season.2 Major exporters include Argentina, Australia, Canada, EU, Kazakhstan, Russian Fed., Ukraine and the United States.3 Derived from International Grains Council (IGC) wheat index.
Table 2. Wheat production: leading producers1
2011 2012Change: 2012
over 2011 estim. f'cast
million tonnes %
European Union 137.9 135.0 -2.1China (Mainland) 117.9 115.5 -2.0India 86.9 88.3 1.6United States 54.4 59.0 8.5Russian Federation 56.2 56.8 1.1Australia 29.5 26.0 -11.9Canada 25.3 26.1 3.2Pakistan 24.3 24.0 -1.2Turkey 21.8 19.4 -11.0Ukraine 22.3 14.0 -37.2Kazakhstan 22.7 14.5 -36.1Iran Islamic Rep. of 14.0 13.5 -3.6Argentina 13.4 13.0 -3.0Egypt 8.4 8.5 1.2Uzbekistan 6.4 6.5 1.6Other countries 58.6 55.0 -6.1
World 700.0 675.1 -3.6
1 Countries listed according to their position in global production (average 2010-2012).
have improved following good precipitation across many
major producing areas where earlier dryness had been a
concern. The improved planting conditions will make it easier
for farmers to realize reported intentions to expand the area
sown significantly, bringing back into production land that
was too wet to plant last spring.
In the EU, although winter crop plantings were estimated
to have increased slightly, severe winter weather caused
higher than normal losses in many parts, resulting in a
decrease in expectations for the final harvested area. Poland
was hit hardest, but parts of France, Germany, Czech
Republic, Bulgaria and Hungary are also reported to have
been significantly affected. The destroyed winter wheat
areas may be replanted with other crops this spring but in
some cases, as reported in Poland, lack of inputs may see
them remaining unsown. On the positive side, abundant
widespread rainfall arrived in early April throughout many
parts of the EU that were suffering from prolonged dryness
such as in the United Kingdom, Germany and Poland in
the north, Spain and Italy in the Mediterranean region, and
Romania in the east. However, in the driest areas, much
more rain will be needed during the growing season to avoid
significant loss of yield potential. Based on information as of
mid-April, and assuming normal conditions for the remainder
of the season, total EU production is now forecast at 135
million tones, about 2 percent below last year’s level.
In the Russian Federation, latest indications point
to a marginal rise in production of wheat in 2012, largely
reflecting an increase in plantings. Most crops were
protected by ample covering of snow during the winter so
about average levels of winterkill could be expected, despite
severely cold periods. Assuming normal growing conditions
for the remainder of the season, output is forecast at 56.8
million tonnes, 1 percent up from 2011. By contrast, in
Ukraine, a sharp decline in wheat output is expected. This
reflects particularly adverse conditions this season, with some
major producing areas severely affected by drought since the
planting period last autumn, while winterkill has been more
pronounced than normal due to severe low temperatures
and limited snow cover. The most affected areas are
expected to be replanted with other crops this spring. With
the harvested area forecast to fall sharply and lower yields
expected, production is forecast at 14 million tonnes, nearly
40 percent below last year’s bumper crop and well below
the average of the past five years.
In Asia, harvesting of the 2012 wheat crops in the Far East subregion is already underway and prospects are mostly
good in the main producing countries following generally
favourable precipitation and normal temperature during
the growing stage. In China, although growing conditions

Food Outlook
May 201212
Figure 4. Major wheat exporters
0 10 20 30
2011/12 estimate 2012/13 forecast
Million tonnes
UnitedStates
EU
Canada
Argentina
Ukraine
Kazakhstan
Australia
RussianFederation
Figure 3. Wheat imports by region
0
20
40
60
80
2011/12 estimate
2012/13 forecast
Million tonnes
Asia Africa EuropeSouthAmerica
CentralAmerica
have been generally satisfactory and no significant change
in area was reported, output is expected to fall by 2 percent
from last year’s record harvest, reflecting a return to average
yields after last year’s bumper levels. In India, an early
official estimate puts this year’s wheat harvest at a record
88.3 million tonnes, reflecting relatively good availability
of irrigation water, fertilizer and other inputs. In Pakistan,
despite an increase in area, a return to closer to average
yields is forecast to result in a total harvest of about 24
million tonnes in 2012, slightly below the 2011 record level.
In the Asian CIS subregion, Kazakhstan is the major wheat
producer and the bulk of the crop is spring sown in April to
May. The area planted is officially forecast at 13.5 million
hectares, slightly down from 2011, given that large wheat
surpluses still exist after the record harvest last year and
thus it is anticipated that land will be diverted to alternative
crops. The final area planted could be further reduced due
to inadequate soil moisture following dry weather in autumn
and winter. Lower plantings, combined with a return to
average yields after high levels last year, are likely to result in
a significantly smaller output this season. In the Near East, favourable prospects for the winter wheat crop are reported,
reflecting ample moisture reserves from winter precipitation.
In North Africa, wheat crop prospects are mixed: the
outlook is unfavourable in Morocco, where severe drought
has sharply reduced yield prospects, but more favourable in
Algeria and Tunisia, reflecting ample moisture supplies.
In the Southern Hemisphere, the bulk of the winter wheat
planting is due to get underway in May in Australia. Early
indications point to reduced plantings after a particularly
large area last year and because of expectations that wheat
will be less profitable this year relative to other major crops.
Furthermore, with yields expected to return to average
levels after last year’s highs, output in 2012 is tentatively
forecast to fall to about 26 million tonnes. In South America, where wheat sowing takes place from May to
September, early indications point to a decline in plantings in
Argentina, as farmers are expected to switch land to other
crops anticipated to be more profitable this year, barley in
particular. In Brazil, while plantings are expected to remain
around last year’s levels, a return to average yields after
high levels in 2011 will likely lead to a smaller crop in 2012
although still close to average.
TRADE
Wheat trade to contract in 2012/13 FAO’s first forecast for world wheat trade exports in
2012/13 (July/June) stands at 135 million tonnes, down 1.7
million tonnes from 2011/12 and 4.6 million tonnes from
the all time high of 139.7 million tonnes in 2008/09. The
anticipated contraction in wheat imports in 2012/13 mainly
reflects smaller purchases by several Asian countries.
Total wheat imports by Africa are forecast at 39.6 million
tonnes, unchanged from 2011/12. In North Africa, imports
by Algeria, Egypt and Tunisia may decrease slightly but
purchases by Morocco could surge by 1.5 million tonnes,
because of the anticipated decline in domestic production
following prolonged dry conditions. The country has already
extended the suspension of import duties on soft wheat
to the end of April 2012 and of durum to the end of May
2012. Total imports in sub-Saharan Africa are expected
to decline, mostly on smaller imports by Nigeria, the
subregion’s largest importer, given the country’s drive to

Market assessments
May 2012 13
Figure 5. Wheat stocks and ratios
0
100
200
300
2012/132011/122010/112009/102008/0915
20
25
30
Million tonnes Percent
Major Exporters Rest of the World
World Stock-to-use ratioStock-to-disappearance ratio of Major Exporters
estim. f’cast
increase the use of cassava flour in bread production as well
as the introduction of new measures to limit wheat flour
imports.
In Asia, aggregate imports in 2012/13 are forecast at
59 million tonnes, down 2.5 million tonnes from 2011/12.
Smaller purchases are anticipated for the Islamic Republic of Iran, where carryovers from large imports during the
second half of the 2011/12 season could result in lower
imports in 2012/13 despite the anticipated reduction in
domestic production this year. Wheat imports by Japan and
the Republic of Korea are also expected to decline mainly
because of larger purchases of coarse grains, the global
supply of which is likely to improve in the new season.
In Latin America and the Caribbean, total imports in
2012/13 are forecast to remain at around the same level
as in 2011/12, or around 22 million tonnes. Imports by
Brazil, the region’s largest wheat importer, are forecast to
increase due to expectation of a slight reduction in this year’s
production. However, deliveries to Mexico, the second
largest wheat importer in the region, could remain at around
the same high levels as in 2011/12 due to another below-
average production season resulting from drought.
Elsewhere, imports in Europe are forecast to rise, mostly
on larger purchases of feed wheat by the EU. Given the
expectation of a drop in the EU wheat production in 2012
but ample supplies of wheat in the nearby Black Sea region,
imports could reach 8 million tonnes, the highest in a
decade.
World wheat export supplies in 2012/13 are expected
to prove as adequate as in 2011/12, especially in view of
the projected contraction in import demand. Given the
anticipated recovery in wheat production in the United
States, exports from the United States are forecast to
increase most, compensating for declines in shipments from
Australia, Kazakhstan and the EU. Exports from Canada,
the Russian Federation and Ukraine are likely to remain at
around the same levels as in 2011/12 but larger shipments
are forecast for India, given the large size of carryover stocks
and anticipation of yet another record crop this year.
UTILIZATION
Utilization to decline in 2012/13 from the exceptionally high levels in 2011/12 Following strong growth in wheat utilization in 2011/12,
driven by an exceptional increase in feed use of wheat, total
wheat utilization in 2012/13 is likely to decline slightly to 686
million tonnes, which would still exceed the 10-year trend.
World utilization of wheat for direct human consumption
is expected to amount to 475 million tonnes, up somewhat
from 2011/12 and accounting for 69 percent of the total
wheat use. At this level, world wheat consumption, on a
per capita basis, would be steady at around 67.5 kg per
annum. Per capita wheat consumption is expected to remain
at around 60 kg in the developing countries and at 97.5 kg
in the developed countries. At the same time, total feed utilization of wheat is forecast to contract by almost 4
percent to 134 million tonnes. This decline comes after a
robust 15 percent expansion in 2011/12, caused primarily
by competitive feed wheat prices compared to maize. The
anticipated strong recovery in coarse grain supplies, maize in
particular, is the reason for a return of feed wheat utilization
to more normal levels. The biggest declines in feed usage of
wheat in 2012/13 are expected in the United States and the
EU, the latter representing the world’s leading user of wheat
for animal feed. The other uses of wheat which include
industrial use, seeds and post-harvest losses, are projected to
remain at the same level as in 2011/12, at around 78 million
tonnes, with a slight increase in industrial use offsetting
declines in post-harvest losses.
STOCKS
Wheat inventories to decline sharply in 2013 while remaining relatively highWorld wheat stocks are forecast to decline by 6.5 percent,
or 12.5 million tonnes, to reach 183 million tonnes by the
close of the 2013 crop seasons, The biggest declines are
projected for China (- 5 million tonnes), Ukraine (- 3.6
million tonnes), the Russian Federation (- 3.2 million
tonnes), Australia (- 900 000 tonnes), Kazakhstan
(- 700 000 tonnes) and Morocco (- 700 000 tonnes) more

Food Outlook
May 201214
Figure 7. CBOT maize futures for December
200
220
240
260
280
USD per tonne
D J F M A
2011 values 2012 values
2012 nearby values
Figure 6. Maize export price (US no. 2 yellow, Gulf)
100
150
200
250
300
350
2010/11
2009/10
2008/092011/12
USD per tonne
JMAMFJDNOSAJ
than offsetting increases in a few countries, most notably in
the US (+1.9 million tonnes), India (+ 1 million tonnes) and
Brazil (+ 600 000 tonnes).
The anticipated contraction of stocks next season follows
a likely replenishment of almost 4 percent in the current
season ending in 2012. The main reason for the drawdown
is the anticipated sharp fall in world production this year.
FAO’s earlier forecasts pointed to a smaller drop in world
production and an increase in the level of stocks because
total supplies were seen to exceed utilization in 2012/13.
However, based on the latest forecast for world wheat
production in 2012 – down 3.6 percent from 2011 – stocks
would need to be drawn down significantly, even after
taking into account the anticipated reduction in total wheat
utilization in 2012/13. At the current forecast level, world
inventories would exceed the three- decade low of 140
million tonnes in 2008 but the world wheat stocks-to-use ratio could drop to 26.3 percent, from 28.4 percent
estimated in 2011/12.
More notably, the ratio of major wheat exporters’ closing stocks to their total disappearance – defined
as domestic utilization plus exports – could fall to 18.6
percent in 2012/13 from 20.3 percent in the current season.1
Nonetheless, the projected ratio is almost 6 percentage
points higher than the 2007/08 season when prices surged
in world markets, and also above the 5-year average of
17.3 percent. The fact that this ratio would still stand at a
relatively comfortable level indicates that supplies in major
1 Starting with this report, the definition of major wheat exporters is revised and the major exporters group now includes Kazakhstan, the Russian Federation and Ukraine in addition to the five traditional exporters, Argentina, Australia, Canada, EU and the United States.
exporting countries are adequate to meet not only their own
domestic consumption but also the world import demand in
2012/13.
COARSE GRAINS
PRICES
Prices remain firm but could decline on improved supply prospects Tight old-crop (2011) supplies continued to underpin prices in
coarse grain markets with maize trading at a premium to wheat
for much of last year. In 2011, international prices remained
well above 2010 levels. While prices fell somewhat during the
second half of 2011, following the arrival of large supplies of
wheat, they remained mostly firm before gaining some strength
in early 2012. The benchmark US maize prices (yellow, No. 2, f.o.b.) averaged USD 273 per tonne in April, up 5 percent
from December 2011, but down 15 percent from April last
year. In addition to abundant wheat supplies this season,
stagnating maize-based ethanol production also helped limit
the price rise, in spite of historically low maize inventories in the
United States, the world’s largest maize producer.
Looking ahead, however, markets are anticipating a
rebound in supply after major harvests in 2012 are complete,
especially in the United States where – according to the March
USDA Prospective Plantings report – plantings are forecast
to be up 4 percent over 2011 and 9 percent over 2010. The
anticipated increase in plantings in the United States is driven
by expectation of higher returns, in comparison to soybeans
(Figure 8 ).

Market assessments
May 2012 15
Figure 8. Soybean/maize ratio
1.9
2.0
2.1
2.2
2.3
2.4
2.5
2.6
1.9
2.0
2.1
2.2
2.3
2.4
2.5
2.6
S O DN J F M A2011 2012
From a historical perspective in the USA, whenever this ratioexceeds 2.4, the general bias favours soybean over maize,resulting in a shift of planting area from maize to soybeans.
Table 3. World coarse grain market at a glance
2010/11 2011/12 2012/13
Change: 2012/13
over 2011/12
estim. f'cast
million tonnes %
WORLD BALANCE
Production 1 130.1 1 163.9 1 207.3 3.7
Trade1 121.6 121.3 126.0 3.9
Total utilization 1 150.5 1 165.6 1 193.7 2.4
Food 202.0 204.0 206.7 1.3
Feed 631.0 638.7 660.2 3.4
Other uses 317.5 322.9 326.8 1.2
Ending stocks 171.4 167.1 177.1 6.0
SUPPLY AND DEMAND INDICATORS
Per caput food consumption:
World (kg/year) 29.3 29.2 29.4 0.7
LIFDC (kg/year) 41.4 40.9 41.4 1.2
World stock-to-use ratio (%) 14.7 14.0 14.3
Major exporters stock-to-disappearance ratio2 (%) 10.6 9.7 11.0
FAO COARSE GRAIN PRICE INDEX (2002-2004=100) 2010 2011 2012
Change: Jan-Apr 2012
over Jan-Apr 2011
Jan-Apr %
176 277 262 -4.7
1 Trade refers to exports based on a common July/June marketing season.2 Major exporters include Argentina, Australia, Brazil, Canada, EU, Russian Fed., Ukraine and the United States.
Table 4. Coarse grain production: leading producers1
2011 2012Change: 2012
over 2011 estim. f'cast
million tonnes %
United States 324.0 358.6 10.7China (Mainland) 201.1 199.3 -0.9European Union 148.5 149.1 0.4Brazil 59.0 68.3 15.8India 42.1 41.1 -2.4Argentina 31.9 28.2 -11.6Russian Federation 34.2 34.3 0.3Ukraine 33.5 33.4 -0.3Mexico 26.7 29.0 8.6Canada 21.9 24.8 13.2Nigeria 22.3 22.8 2.2Indonesia 17.6 17.7 0.6Ethiopia 17.1 15.2 -11.1Australia 13.4 12.7 -5.2South Africa 11.5 12.2 6.1Other countries 159.1 160.6 0.9
World 1 163.9 1 207.3 3.7
1 Countries listed according to their position in global production (average 2010-2012).
Against this background, CBOT maize futures for December delivery have been falling in recent weeks, with
nearby prices, which at this time of the year reflect old-crop
supply situation, higher than deferred prices (in this case
December), which reflect new crop prospects (Figure 7).
The maize futures for December 2012 delivery averaged
USD 213 per tonne in April, down 17 percent from the
December 2011 futures cast in April last year and 13 percent
lower than the April average for the nearby (July) delivery.
Although prices will be influenced by weather conditions
during critical periods of the growing season, especially in
July when pollination is required, the trend in December
values underscores the possibility of a decline in prices from
their current high levels.
PRODUCTION
Global output of coarse grains in 2012 set to reach a new record FAO’s first forecast for world production of coarse grains
in 2012 stands at about 1 207 million tonnes, 3.7 percent
up from last year’s record of 1 164 million tonnes. The bulk
of the increase is anticipated in the United States, the
world’s largest producer, where record maize plantings are
forecast, but also in Brazil, where the main crop harvest is
already underway and a sharp increase in maize production
is expected this year.
Global output of maize in 2012 is forecast at some 916
million tonnes, up 4.1 percent from 2011. In the United States, the 2012 planting season got off to an early start in
the southern states under favourable conditions. According
to the USDA Prospective Plantings report issued at the

Food Outlook
May 201216
Figure 9. Maize production
0
250
500
750
1000
2012/132011/122010/112009/102008/09
Million tonnes
United States
Brazil
China (Mainland) EU
Others
estim. f’cast
Figure 10. Barley production
0
60
120
180
2012/132011/122010/112009/102008/09
Million tonnes
EU
Canada
CIS
Others
estim. f’cast
end of March, farmers are expected to plant 38.8 million
hectares, the biggest area of maize since 1937, and up
some 4.3 percent from 2011, largely in response to relatively
tight supplies and the prospect of good returns. Assuming
these planting intentions materialize and normal conditions
prevail throughout the season, US output of maize in 2012
is tentatively forecast to reach a record 345 million tonnes.
In China, the world’s second largest maize producer,
production is expected to remain close to last year’s record,
at around 190 million tonnes. Even assuming yields return
to average levels after last year’s highs, this could be largely
offset by an increase in area, as farmers are expected to
plant more maize in response to firm price prospects. In
the EU, maize plantings are forecast to increase this year,
and may increase more than anticipated, given the latest
indications that a larger-than-expected area of winter wheat
has been destroyed and will be replanted with spring crops.
However, assuming a return to average yields after high
levels last year, output is expected to decrease by about 4
percent to 64 million tonnes.
In the Southern Hemisphere, the main 2012 maize
harvests are already complete or in the final stages. In
South America, Brazil’s aggregate maize output in 2012
is forecast at a record 66 million tonnes, up 17 percent from
the previous high in 2011, driven by a sharp increase in
aggregate plantings, which more than offset the negative
impact of prolonged dry weather for the main crop in the
key southern growing areas of Rio Grande do Sul and
Paraná. By contrast, in Argentina, the 2012 maize output
is forecast at 20.3 million tonnes, down 11 percent from
the record level of 2011, due to the adverse affects of
prolonged dry weather. In southern Africa, prospects for
the current main coarse grains season are mixed. In South Africa, the largest producer in the subregion, a 7 percent
increase in output to 11.7 million tonnes is forecast, with
larger plantings more than offsetting a drop in yields due to
a protracted period of below-normal rains since the start of
2012. Elsewhere in the subregion, smaller maize harvests are
expected in Malawi, Zambia, and Zimbabwe, on account
of dry weather and an estimated drop in the area planted.
Following generally favourable weather in Mozambique
and Namibia, production similar to the good outturns in
2011 is anticipated, while current prospects point to an
improved output in Angola (except in coastal areas due to
a dry spell) following the poor output in 2011. Erratic rains
at the start of planting and uneven distribution during the
cropping season are likely to lead to a drop in production in
the import-dependent countries of Swaziland, Lesotho and
Botswana.
World output of barley in 2012 is forecast to remain
virtually unchanged in 2012, at about 136 million tonnes.
Among the major barley producing countries, significant
declines expected in North Africa and CIS Asia could be
mostly offset by increased outputs in the EU and North
America. In the EU, the aggregate barley area is expected
to rise compared to 2011, largely reflecting an expansion
of spring plantings, especially where winter crops have
been damaged and re-sowing will take place. Assuming
normal conditions, EU’s output is forecast to rise by about 4
percent, to 54 million tonnes. In the United States, planting
intentions point to a sizeable increase in barley cultivation
and a larger crop is expected. Likewise, in Canada, plantings
are expected to increase sharply, recovering from a reduced
area last year, with production forecast to rise by 15 percent

Market assessments
May 2012 17
Figure 11. Coarse grain imports by region
0
20
40
60
80
2011/12 estimate
2012/13 forecast
Million tonnes
Asia Africa EuropeSouthAmerica
CentralAmerica
Figure 12. Major coarse grain exporters
0 20 40 60
2011/12 estimate 2012/13 forecast
Million tonnes
UnitedStates
EU
Canada
Brazil
Ukraine
Argentina
Australia
RussianFederation
to 9 million tonnes. The major declines in barley output this
year are expected in Morocco, due to drought.
The forecast for world sorghum output in 2012 stands
at about 61 million tonnes, an increase of 9 percent over
last year’s reduced crop. In Africa, which normally accounts
for about 40 to 45 percent of the world’s production, the
expected increase largely assumes a recovery in Sudan,
after a poor drought-stricken crop in 2011. Elsewhere, a
significant production recovery is expected in the US after a
sharp reduction in 2011. India is also set to harvest a larger
crop this year.
TRADE
World trade in coarse grains in 2012/13 to increase sharply Predicting the size of world trade in the new season is
difficult at this early stage when harvests in the Northern
Hemisphere are still many months away and the critical
summer period is still ahead. However, based on the
overall supply outlook for next season and current demand
expectations, international trade in coarse grains in 2012/13
(July/June) is tentatively expected to increase by nearly 4
percent from 2011/12 to 126 million tonnes in 2012/13.
Among the major coarse grains, maize should account for
most of the anticipated expansion in world trade. World
maize trade is forecast to grow by 4 percent, to reach
99 million tonnes in 2012/13, the highest since 2007/08.
Trade in barley and sorghum could increase slightly, to
17.5 million tonnes and 6 million tonnes respectively. Trade
in other coarse grains, including millet, rye and oats, is
expected to remain unchanged.
The forecast rebound in world trade of coarse grains in
2012/13 is a reflection of the anticipated recovery in global
supplies, in general, and of exportable maize supplies in the
United States, in particular. In 2011/12, several countries,
especially in Asia, opted for larger imports of low quality
wheat, instead of coarse grains because of more attractive
wheat prices. This development is likely to be reversed in the
new season. Aggregate imports in Asia are forecast to reach
a record 69 million tonnes in 2012/13, up almost 5 percent
from the 2011/12 estimate. The increase mostly reflects
larger purchases by the Republic of Korea, after a decline
in 2011/12, and by Japan and China. In China, maize
imports alone could increase to 5 million tonnes (the highest
since the beginning of the record in 1980/81) up from an
estimated volume of 3.7 million tonnes in 2011/12. Given
the current forecast of a slight decline in maize production in
China (Mainland), more imports may be needed in order to
meet the anticipated growth in domestic utilization.
In Africa, total imports are set to grow by 8 percent to
18.8 million tonnes. Higher imports of barley, mostly by
Morocco, account for most of this increase while imports
by nearly all the other countries are forecast to remain
close to 2011/12 levels. Total deliveries to countries in Latin America and the Caribbean are forecast to reach
26.7 million tonnes, down marginally from the 2011/12
estimate. Imports by almost all major importers in the
region are anticipated to remain at around 2011/12
levels. However, in Mexico, the region’s largest importer,
maize purchases could decline slightly, after they rose in
2011/12 to compensate the decline in domestic production.
Elsewhere, in Europe, total imports are likely to increase in
the new season, reaching 7.6 million tonnes. The rise would

Food Outlook
May 201218
Figure 13. Coarse grain utilization
0
350
700
1050
1400
2012/132011/122010/112009/102008/09
Million tonnes
Feed use
Other uses
Food use
estim. f’cast
Table 5. Maize use for ethanol (excluding non-fuel) in the United States
2004/05 2005/06 2006/07 2007/08 2008/09 2009/10 2010/11
estim.
2011/12*
(f’cast)
Thousand tonnes
Maize production
Ethanol use 127 513 127 000313 894
Yearly change (%) 13 21 32 44 21 25 9 -0.4
As production (%) 11 14 20 23 30 35 40 40
Source: WASDE-USDA. *April 2012 USDA’s initial assessment of US and world crop supply and demand prospects.
be mostly in the EU, where this year’s maize production is
forecast down from 2011.
Based on early prospects for 2012/13, world export
supplies appear to be more than sufficient to meet import
demand. In the United States, the world’s largest producer
and exporter, maize production is heading towards a record
in 2012 and unlike the situation in 2011/12 when exports
are expected to decrease by 12 percent, shipments in
2012/13 (July/June) are projected to rebound by 11 percent
and reach 47 million tonnes. Among other exporters,
Ukraine is again expected to ship a large volume of maize
as well as barley, putting the country’s total coarse grain
export volume on par with the anticipated exports (16.9
million tonnes) from Argentina, normally the second largest
exporter after the US. Sales of maize, barley and sorghum
from Argentina are anticipated to decline slightly in 2012/13
because of this year’s reduced output. In Canada and the
EU, larger anticipated barley production is forecast to result
in higher exports in the new season while, in Australia, a
reverse is expected with barley exports declining slightly.
Brazil is forecast to be a major exporter of maize for the
third consecutive season, exporting as much as 10 million
tonnes in 2012/13, an increase of 1 million tonnes over
2011/12.
UTILIZATION
Total utilization expands on faster feed growth Total utilization of coarse grains is tentatively forecast at
around 1 194 million tonnes in 2012/13, up 2.4 percent
from the estimate for 2011/12 and still slightly below the 10-
year trend for the second consecutive season. Global feed
utilization, which represents the bulk of the total utilization
of coarse grains, is expected to increase by 3.4 percent to
660 million tonnes. This compares to an anticipated 1.3
percent increase in 2011/12 and a contraction of 1 percent
from the previous season. Feed use in the developed
countries, as a group, is forecast to expand by almost 5
percent, to 338 million tonnes in 2012/13. Most of this
expansion reflects the anticipated maize supply recovery in
the United States where total feed use is projected to rise by
over 10 percent following a 5 percent decline in 2011/12.
In the developing countries, total feed use is forecast at 322
million tonnes, up 2 percent from 2011/12, which is slightly
below the growth estimated for the current season, mostly
reflecting a slowdown in feed use in South America.
Total food consumption of coarse grains is forecast to
increase by 1.3 percent in 2012/13, to 207 million tonnes.
The bulk of the increase in total food consumption of
coarse grains is anticipated to take place in the developing
countries, especially in Africa. The other use of coarse
grains, which includes industrial (biofuels, sweeteners,
starch, etc.), seeds and post-harvest losses is forecast to
reach 327 million tonnes in 2012/13, up 1.2 percent from
2011/12. The driving factor in the industrial usage of
coarse grains over the past decade has been the fast year-
on-year growth in maize-based ethanol production in the
United States. However, the stagnation in production of
ethanol in 2011/12 (Table 5) is anticipated to continue well
into the 2012/13 marketing season, given the current high
level of ethanol inventories, which could limit any further
rise in ethanol production and hence industrial demand for
maize.

Market assessments
May 2012 19
Figure 14. Coarse grain stocks and ratios
0
100
200
300
2012/132011/122010/112009/102008/095
10
15
20
Million tonnes Percent
United States Rest of the World
World Stock-to-use ratioStock-to-disappearance ratio of Major Exporters
estim. f’cast
STOCKS
World inventories increase but stocks-to-use indicate another tight season Based on the preliminary forecasts for production in 2012
and utilization in 2012/13, world coarse grain stocks could
increase by 6 percent from their current low opening level,
to around 177 million tonnes by the close of seasons in
2013. This prospect stems mainly from the expectation of a
strong rebound in stocks held the United States next year
while in 2012 maize inventories are expected to fall to a
precariously low level of 20 million tonnes – the lowest since
1996. Given the projected sharp expansion in United States
production and taking into account the current forecast for
domestic utilization and exports, maize inventories are set to
increase by 33 percent, or nearly 7 million tonnes, pushing
up total coarse grain inventories in the US to nearly 27
million tones in 2013.
In spite of the partial recovery in the United States, at
the current forecast level, the world stocks-to-use ratio
for coarse grains may only rise slightly from its current low
of 14.0 percent (smallest ratio since at least 1980) to 14.3
percent in 2012/13. More importantly, the ratio of major coarse grains exporters’ closing stocks to their total disappearance – defined as domestic utilization plus
exports – could increase from 9.7 percent in the current
season to only 11.0 percent.2 This compares to a five-
year average of 14.3 percent, which indicates the strong
possibility of a continuation of the tight supply situation
in 2012/13 unless harvests prove larger or total utilization
smaller than currently projected.
2 Starting with this report, the definition of major exporters of coarse grains is revised and the major exporters group now includes Brazil, the Russian Federation and Ukraine in addition to the five traditional exporters, Argentina, Australia, Canada, EU and the US.
Food Outlook
May 201220
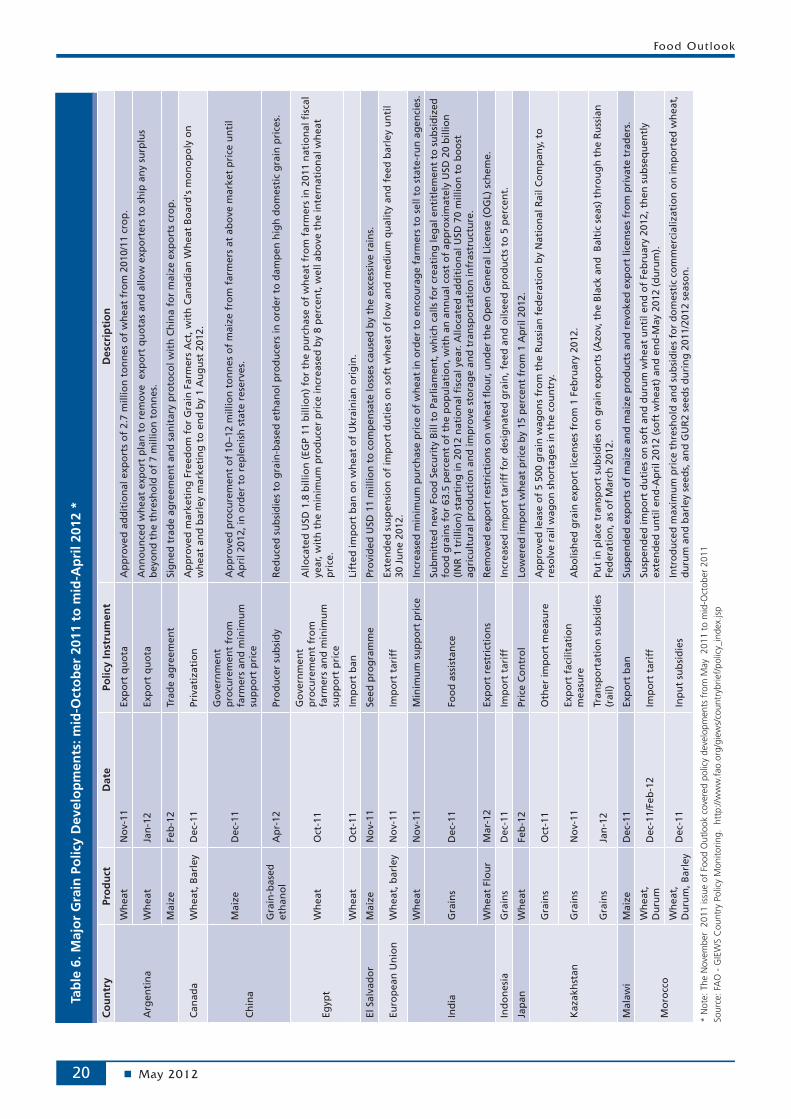
Tab
le 6
. Maj
or
Gra
in P
olic
y D
evel
op
men
ts: m
id-O
cto
ber
201
1 to
mid
-Ap
ril 2
012
*
Co
un
try
Pro
du
ctD
ate
Polic
y In
stru
men
tD
escr
ipti
on
Arg
enti
na
Wh
eat
No
v-11
Exp
ort
qu
ota
Ap
pro
ved
ad
dit
ion
al e
xpo
rts
of
2.7
mill
ion
to
nn
es o
f w
hea
t fr
om
201
0/11
cro
p.
Wh
eat
Jan
-12
Exp
ort
qu
ota
An
no
un
ced
wh
eat
exp
ort
pla
n t
o r
emo
ve e
xpo
rt q
uo
tas
and
allo
w e
xpo
rter
s to
sh
ip a
ny
surp
lus
bey
on
d t
he
thre
sho
ld o
f 7
mill
ion
to
nn
es.
Mai
zeFe
b-1
2Tr
ade
agre
emen
tSi
gn
ed t
rad
e ag
reem
ent
and
san
itar
y p
roto
col w
ith
Ch
ina
for
mai
ze e
xpo
rts
cro
p.
Can
ada
Wh
eat,
Bar
ley
Dec
-11
Priv
atiz
atio
nA
pp
rove
d m
arke
tin
g F
reed
om
fo
r G
rain
Far
mer
s A
ct, w
ith
Can
adia
n W
hea
t B
oar
d's
mo
no
po
ly o
n
wh
eat
and
bar
ley
mar
keti
ng
to
en
d b
y 1
Au
gu
st 2
012.
Ch
ina
Mai
zeD
ec-1
1
Go
vern
men
t p
rocu
rem
ent
fro
m
farm
ers
and
min
imu
m
sup
po
rt p
rice
Ap
pro
ved
pro
cure
men
t o
f 10
–12
mill
ion
to
nn
es o
f m
aize
fro
m f
arm
ers
at a
bo
ve m
arke
t p
rice
un
til
Ap
ril 2
012,
in o
rder
to
rep
len
ish
sta
te r
eser
ves.
Gra
in-b
ased
et
han
ol
Ap
r-12
Pro
du
cer
sub
sid
yR
edu
ced
su
bsi
die
s to
gra
in-b
ased
eth
ano
l pro
du
cers
in o
rder
to
dam
pen
hig
h d
om
esti
c g
rain
pri
ces.
Egyp
tW
hea
tO
ct-1
1
Go
vern
men
t p
rocu
rem
ent
fro
m
farm
ers
and
min
imu
m
sup
po
rt p
rice
Allo
cate
d U
SD 1
.8 b
illio
n (
EGP
11 b
illio
n)
for
the
pu
rch
ase
of
wh
eat
fro
m f
arm
ers
in 2
011
nat
ion
al fi
scal
ye
ar, w
ith
th
e m
inim
um
pro
du
cer
pri
ce in
crea
sed
by
8 p
erce
nt,
wel
l ab
ove
th
e in
tern
atio
nal
wh
eat
pri
ce.
Wh
eat
Oct
-11
Imp
ort
ban
Lift
ed im
po
rt b
an o
n w
hea
t o
f U
krai
nia
n o
rig
in.
El S
alva
do
rM
aize
No
v-11
Seed
pro
gra
mm
ePr
ovi
ded
USD
11
mill
ion
to
co
mp
ensa
te lo
sses
cau
sed
by
the
exce
ssiv
e ra
ins.
Euro
pea
n U
nio
nW
hea
t, b
arle
yN
ov-
11Im
po
rt t
arif
fEx
ten
ded
su
spen
sio
n o
f im
po
rt d
uti
es o
n s
oft
wh
eat
of
low
an
d m
ediu
m q
ual
ity
and
fee
d b
arle
y u
nti
l 30
Ju
ne
2012
.
Ind
ia
Wh
eat
No
v-11
Min
imu
m s
up
po
rt p
rice
Incr
ease
d m
inim
um
pu
rch
ase
pri
ce o
f w
hea
t in
ord
er t
o e
nco
ura
ge
farm
ers
to s
ell t
o s
tate
-ru
n a
gen
cies
.
Gra
ins
Dec
-11
Foo
d a
ssis
tan
ce
Sub
mit
ted
new
Fo
od
Sec
uri
ty B
ill t
o P
arlia
men
t, w
hic
h c
alls
fo
r cr
eati
ng
leg
al e
nti
tlem
ent
to s
ub
sid
ized
fo
od
gra
ins
for
63.5
per
cen
t o
f th
e p
op
ula
tio
n, w
ith
an
an
nu
al c
ost
of
app
roxi
mat
ely
USD
20
bill
ion
(I
NR
1 t
rilli
on
) st
arti
ng
in 2
012
nat
ion
al fi
scal
yea
r. A
lloca
ted
ad
dit
ion
al U
SD 7
0 m
illio
n t
o b
oo
st
agri
cult
ura
l pro
du
ctio
n a
nd
imp
rove
sto
rag
e an
d t
ran
spo
rtat
ion
infr
astr
uct
ure
.
Wh
eat
Flo
ur
Mar
-12
Exp
ort
res
tric
tio
ns
Rem
ove
d e
xpo
rt r
estr
icti
on
s o
n w
hea
t fl
ou
r, u
nd
er t
he
Op
en G
ener
al L
icen
se (
OG
L) s
chem
e.
Ind
on
esia
Gra
ins
Dec
-11
Imp
ort
tar
iff
Incr
ease
d im
po
rt t
arif
f fo
r d
esig
nat
ed g
rain
, fee
d a
nd
oils
eed
pro
du
cts
to 5
per
cen
t.
Jap
anW
hea
tFe
b-1
2Pr
ice
Co
ntr
ol
Low
ered
imp
ort
wh
eat
pri
ce b
y 15
per
cen
t fr
om
1 A
pri
l 201
2.
Kaz
akh
stan
Gra
ins
Oct
-11
Oth
er im
po
rt m
easu
reA
pp
rove
d le
ase
of
5 50
0 g
rain
wag
on
s fr
om
th
e R
uss
ian
fed
erat
ion
by
Nat
ion
al R
ail C
om
pan
y, t
o
reso
lve
rail
wag
on
sh
ort
ages
in t
he
cou
ntr
y.
Gra
ins
No
v-11
Exp
ort
fac
ilita
tio
n
mea
sure
Ab
olis
hed
gra
in e
xpo
rt li
cen
ses
fro
m 1
Feb
ruar
y 20
12.
Gra
ins
Jan
-12
Tran
spo
rtat
ion
su
bsi
die
s (r
ail)
Put
in p
lace
tra
nsp
ort
su
bsi
die
s o
n g
rain
exp
ort
s (A
zov,
th
e B
lack
an
d B
alti
c se
as)
thro
ug
h t
he
Ru
ssia
n
Fed
erat
ion
, as
of
Mar
ch 2
012.
Mal
awi
Mai
zeD
ec-1
1Ex
po
rt b
anSu
spen
ded
exp
ort
s o
f m
aize
an
d m
aize
pro
du
cts
and
rev
oke
d e
xpo
rt li
cen
ses
fro
m p
riva
te t
rad
ers.
Mo
rocc
o
Wh
eat,
D
uru
mD
ec-1
1/Fe
b-1
2Im
po
rt t
arif
fSu
spen
ded
imp
ort
du
ties
on
so
ft a
nd
du
rum
wh
eat
un
til e
nd
of
Feb
ruar
y 20
12, t
hen
su
bse
qu
entl
y ex
ten
ded
un
til e
nd
-Ap
ril 2
012
(so
ft w
hea
t) a
nd
en
d-M
ay 2
012
(du
rum
).
Wh
eat,
D
uru
m, B
arle
yD
ec-1
1In
pu
t su
bsi
die
sIn
tro
du
ced
max
imu
m p
rice
th
resh
old
an
d s
ub
sid
ies
for
do
mes
tic
com
mer
cial
izat
ion
on
imp
ort
ed w
hea
t,
du
rum
an
d b
arle
y se
eds,
an
d G
UR
2 se
eds
du
rin
g 2
011/
2012
sea
son
.
* N
ote:
The
Nov
embe
r 2
011
issu
e of
Foo
d O
utlo
ok c
over
ed p
olic
y de
velo
pmen
ts f
rom
May
201
1 to
mid
-Oct
ober
201
1So
urce
: FA
O -
GIE
WS
Cou
ntry
Pol
icy
Mon
itorin
g. h
ttp:
//ww
w.f
ao.o
rg/g
iew
s/co
untr
ybrie
f/po
licy_
inde
x.js
p
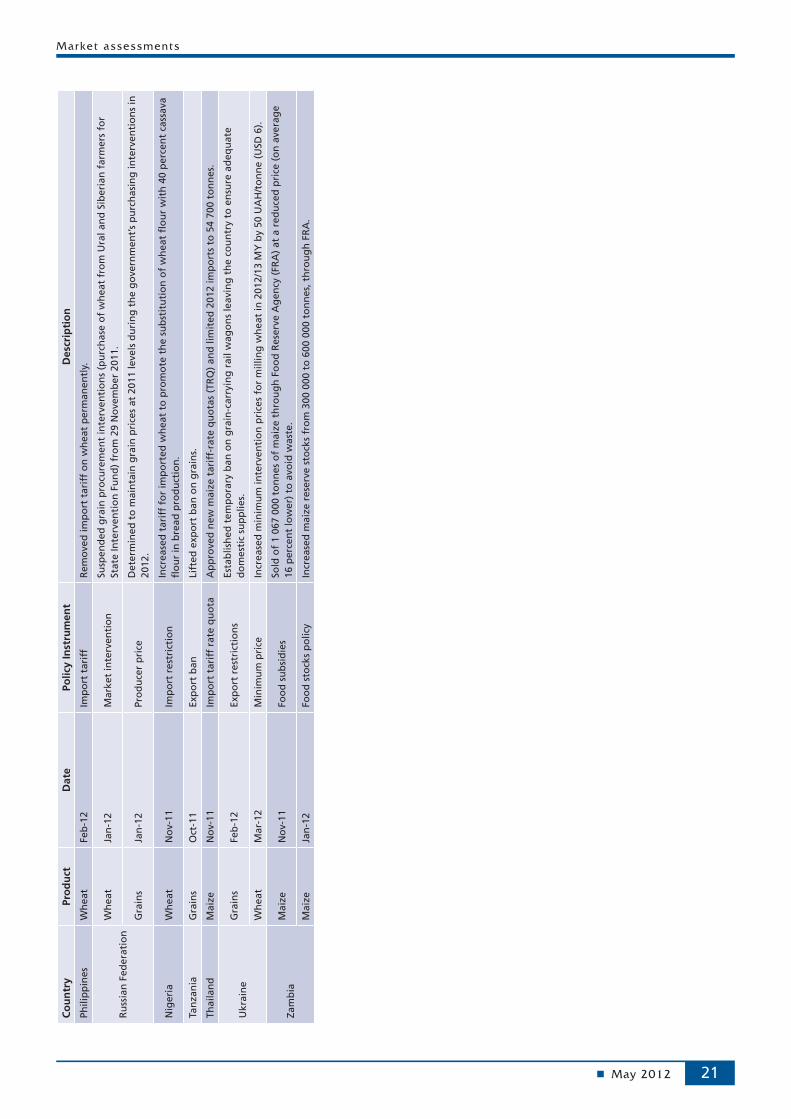
Market assessments
May 2012 21
Co
un
try
Pro
du
ctD
ate
Polic
y In
stru
men
tD
escr
ipti
on
Phili
pp
ines
Wh
eat
Feb
-12
Imp
ort
tar
iff
Rem
ove
d im
po
rt t
arif
f o
n w
hea
t p
erm
anen
tly.
Ru
ssia
n F
eder
atio
n
Wh
eat
Jan
-12
Mar
ket
inte
rven
tio
nSu
spen
ded
gra
in p
rocu
rem
ent
inte
rven
tio
ns
(pu
rch
ase
of
wh
eat
fro
m U
ral a
nd
Sib
eria
n f
arm
ers
for
Stat
e In
terv
enti
on
Fu
nd
) fr
om
29
No
vem
ber
201
1.
Gra
ins
Jan
-12
Pro
du
cer
pri
ceD
eter
min
ed t
o m
ain
tain
gra
in p
rice
s at
201
1 le
vels
du
rin
g t
he
go
vern
men
t’s
pu
rch
asin
g in
terv
enti
on
s in
20
12.
Nig
eria
Wh
eat
No
v-11
Imp
ort
res
tric
tio
nIn
crea
sed
tar
iff
for
imp
ort
ed w
hea
t to
pro
mo
te t
he
sub
stit
uti
on
of
wh
eat
flo
ur
wit
h 4
0 p
erce
nt
cass
ava
flo
ur
in b
read
pro
du
ctio
n.
Tan
zan
iaG
rain
sO
ct-1
1Ex
po
rt b
anLi
fted
exp
ort
ban
on
gra
ins.
Thai
lan
dM
aize
No
v-11
Imp
ort
tar
iff
rate
qu
ota
Ap
pro
ved
new
mai
ze t
arif
f-ra
te q
uo
tas
(TR
Q)
and
lim
ited
201
2 im
po
rts
to 5
4 70
0 to
nn
es.
Ukr
ain
eG
rain
sFe
b-1
2Ex
po
rt r
estr
icti
on
sEs
tab
lish
ed t
emp
ora
ry b
an o
n g
rain
-car
ryin
g r
ail w
ago
ns
leav
ing
th
e co
un
try
to e
nsu
re a
deq
uat
e d
om
esti
c su
pp
lies.
Wh
eat
Mar
-12
Min
imu
m p
rice
Incr
ease
d m
inim
um
inte
rven
tio
n p
rice
s fo
r m
illin
g w
hea
t in
201
2/13
MY
by
50 U
AH
/to
nn
e (U
SD 6
).
Zam
bia
Mai
zeN
ov-
11Fo
od
su
bsi
die
sSo
ld o
f 1
067
000
ton
nes
of
mai
ze t
hro
ug
h F
oo
d R
eser
ve A
gen
cy (
FRA
) at
a r
edu
ced
pri
ce (
on
ave
rag
e 16
per
cen
t lo
wer
) to
avo
id w
aste
.
Mai
zeJa
n-1
2Fo
od
sto
cks
po
licy
Incr
ease
d m
aize
res
erve
sto
cks
fro
m 3
00 0
00 t
o 6
00 0
00 t
on
nes
, th
rou
gh
FR
A.

Food Outlook
May 201222
Figure 15. Export prices for lower quality rice
350
400
450
500
550
600
AMFJDNOSAJJMA
2011 2012
USD per tonne
Thailand 25%
India 25%
Pakistan 25%
Viet Nam 25%
RICE
PRICES
Sliding since the resumption of regular exports by IndiaInternational rice prices have been easing since September
2011, coinciding with the lifting of India’s three-year ban
on regular rice exports and the ensuing heavy shipments
from the country. India’s return to the market intensified
competition among exporters, virtually neutralizing the
positive effects that Thailand’s new rice pledging scheme3
had had on international rice prices since its announcement
in June 2011. Accordingly, the FAO All Rice Price Index
(2002-2004=100), averaged 234 points in April 2012, down
from 235 in January and well below the 260 value recorded
in September 2011. All the rice varieties, from Indica,
Japonica to aromatic, suffered losses, bringing the value of
the index in the first quarter of 2012 down by 8 percent
compared with the same period last year.
Rice export prices showed a tendency to weaken in
Pakistan and Viet Nam, as both countries struggled to
remain competitive with India. Prices in the United States and
South America also drifted downwards on sluggish external
demand. However, despite the arrival of large supplies from
the secondary crop in March, rice quotations remained
firm in Thailand, supported internally by large government
purchases at above market prices and subsequent public
stock accumulation. In March, large sales of parboiled rice to
Nigeria further boosted Thai prices: in April the benchmark
Thai white rice, 100%B, for example, was quoted USD 569
per tonne, up from USD 548 per tonne in January. However,
amid prospects of a bumper second crop harvest in the
coming months, the Thai government lately reiterated the
proposal to establish formal cooperation with four other
rice exporters, Myanmar, Cambodia, Laos and Vietnam,
allegedly to avert major instability in the international rice
market. While such an initiative, if agreed, would give
support to international quotations over the rest of the year,
other factors will influence them, including the evolution of
the US dollar exchange rate and international grain prices.
Nonetheless, given expectations of abundant upcoming rice
harvests and large world carryover stocks, world prices may
remain on a downward slope in the near future.
3 Thai rice pledging programme offered producers minimum prices that were about 30 percent above the prices guaranteed in 2010.
PRODUCTION4
More favourable climatic conditions expected to support global rice production in 2012With the rice season virtually completed, the latest estimate
of 2011world rice production has been lowered slightly
to 480.1 million tonnes, still pointing to a 2.6 percent, or
12.0 million tonne, increase from 2010 and to an all time
high. Much of the downward revision in the 2011 world
estimate resulted from adjustments in the output figures,
especially of Bangladesh but also Mali, Pakistan, Senegal and Venezuela. Compared with the previous season, the
increase in world output in 2011 was principally fostered
by outstanding results in India, which, on the back of
a favourable monsoon, experienced a 7.4 million tonne
expansion to 103.4 million tonnes, breaking the 100 million
tonne landmark for the first time. Considerably more rice
was also harvested in Asia by China, Pakistan and Viet Nam. Further sizeable gains were achieved by Cambodia, Malaysia, Nepal and the Philippines, while a series of
setbacks, including floods, excessive rains and diseases,
depressed output in Indonesia, Myanmar, Sri Lanka and Thailand. Outside Asia, the 2011 season concluded
positively in Argentina, Australia, Brazil, Egypt and Uruguay, while poor growing conditions were partly behind
disappointing crop results in Madagascar and in countries
of West Africa, especially Mali and Senegal.The attention, however, is now turning to the 2012
season. Producers in the Northern Hemisphere are in
the process of planting, or about to plant, their first
4 Production figures are all expressed in milled rice equivalent, unless stated otherwise.
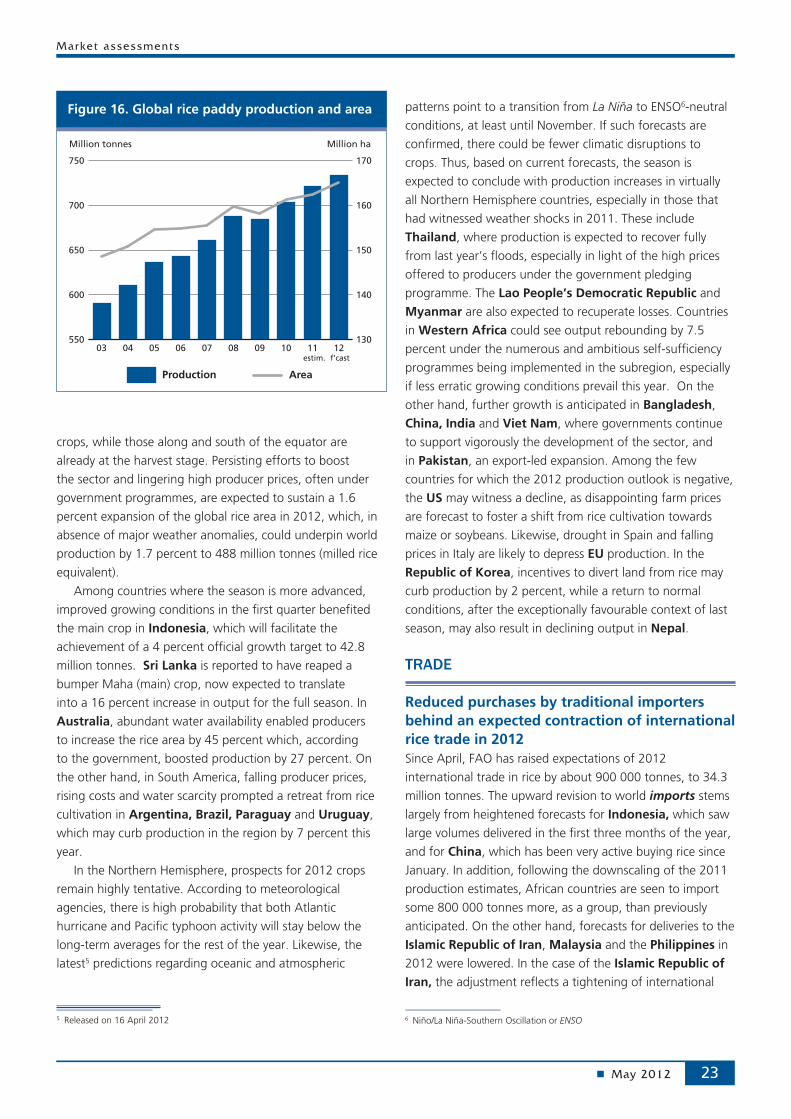
Market assessments
May 2012 23
Figure 16. Global rice paddy production and area
550
600
650
700
750
12111009080706050403130
140
150
160
170
Million tonnes Million ha
Production Area
estim. f’cast
crops, while those along and south of the equator are
already at the harvest stage. Persisting efforts to boost
the sector and lingering high producer prices, often under
government programmes, are expected to sustain a 1.6
percent expansion of the global rice area in 2012, which, in
absence of major weather anomalies, could underpin world
production by 1.7 percent to 488 million tonnes (milled rice
equivalent).
Among countries where the season is more advanced,
improved growing conditions in the first quarter benefited
the main crop in Indonesia, which will facilitate the
achievement of a 4 percent official growth target to 42.8
million tonnes. Sri Lanka is reported to have reaped a
bumper Maha (main) crop, now expected to translate
into a 16 percent increase in output for the full season. In
Australia, abundant water availability enabled producers
to increase the rice area by 45 percent which, according
to the government, boosted production by 27 percent. On
the other hand, in South America, falling producer prices,
rising costs and water scarcity prompted a retreat from rice
cultivation in Argentina, Brazil, Paraguay and Uruguay,
which may curb production in the region by 7 percent this
year.
In the Northern Hemisphere, prospects for 2012 crops
remain highly tentative. According to meteorological
agencies, there is high probability that both Atlantic
hurricane and Pacific typhoon activity will stay below the
long-term averages for the rest of the year. Likewise, the
latest5 predictions regarding oceanic and atmospheric
5 Released on 16 April 2012
patterns point to a transition from La Niña to ENSO6-neutral
conditions, at least until November. If such forecasts are
confirmed, there could be fewer climatic disruptions to
crops. Thus, based on current forecasts, the season is
expected to conclude with production increases in virtually
all Northern Hemisphere countries, especially in those that
had witnessed weather shocks in 2011. These include
Thailand, where production is expected to recover fully
from last year’s floods, especially in light of the high prices
offered to producers under the government pledging
programme. The Lao People’s Democratic Republic and Myanmar are also expected to recuperate losses. Countries
in Western Africa could see output rebounding by 7.5
percent under the numerous and ambitious self-sufficiency
programmes being implemented in the subregion, especially
if less erratic growing conditions prevail this year. On the
other hand, further growth is anticipated in Bangladesh,
China, India and Viet Nam, where governments continue
to support vigorously the development of the sector, and
in Pakistan, an export-led expansion. Among the few
countries for which the 2012 production outlook is negative,
the US may witness a decline, as disappointing farm prices
are forecast to foster a shift from rice cultivation towards
maize or soybeans. Likewise, drought in Spain and falling
prices in Italy are likely to depress EU production. In the
Republic of Korea, incentives to divert land from rice may
curb production by 2 percent, while a return to normal
conditions, after the exceptionally favourable context of last
season, may also result in declining output in Nepal.
TRADE
Reduced purchases by traditional importers behind an expected contraction of international rice trade in 2012Since April, FAO has raised expectations of 2012
international trade in rice by about 900 000 tonnes, to 34.3
million tonnes. The upward revision to world imports stems
largely from heightened forecasts for Indonesia, which saw
large volumes delivered in the first three months of the year,
and for China, which has been very active buying rice since
January. In addition, following the downscaling of the 2011
production estimates, African countries are seen to import
some 800 000 tonnes more, as a group, than previously
anticipated. On the other hand, forecasts for deliveries to the Islamic Republic of Iran, Malaysia and the Philippines in
2012 were lowered. In the case of the Islamic Republic of Iran, the adjustment reflects a tightening of international
6 Niño/La Niña-Southern Oscillation or ENSO

Food Outlook
May 201224
Figure 17. World rice trade and FAO rice export price index
0
15
30
45
121110090807060504030
100
200
300
Million tonnes, milled eq. 2002-2004=100
Exports FAO Rice ExportPrice Index
estim. f’cast
Figure 18. Rice imports by region
0
4
8
12
121110090807060504
Near East
Far East Africa
Lat. Am.
Million tonnes, milled eq.
Others
Europe
estim. f’cast
Figure 19. Rice exports by the major exporters
0
3
6
9
12
2011 estimate
2012 forecast
Million tonnes, milled eq.
India Pakistan Thailand USA Viet Nam Others
sanctions, which are making the conclusion of trade
transactions with the country more difficult. As for the
raising of the 2012 world export forecast, it was mainly
on account of Brazil, India, Myanmar and Pakistan.
By contrast, prospects for sales by Thailand deteriorated
following the extension of the pledging programme to the
secondary rice crop, as this will imply a continuation of
high export prices, which could further erode the country’s
competitiveness.
At 34.3 million tonnes, the volume of rice trade in
calendar 2012 would be almost 3 percent smaller than the
record of 35.2 million tonnes exchanged last year. Much
of the decline in world imports is expected to arise from
considerable reductions in purchases by Bangladesh, Indonesia and the Philippines, traditionally among the
key destinations of rice trade, but also by Nepal, mainly
reflecting abundant supplies. Imports by Nigeria may fall
somewhat, because, as of July, the government plans to
raise the rice import duties from an overall 35 percent to
50 percent. Nonetheless, imports by the country are still
forecast in the order of 2 million tonnes, meaning Nigeria
will remain the world’s leading rice importing country. On
the other hand, a number of markets are foreseen to take
a larger volume of foreign rice this year than last. This
mainly concerns China, where domestic prices remain high
enough to attract increased flows of foreign rice, but also
the EU, the Democratic Republic of Korea and, in the
Near East, countries such as Iraq, Jordan and Saudi Arabia.
Notwithstanding the sanctions, deliveries to the Islamic Republic of Iran are anticipated to remain in the order of
1.1 million tonnes, as the country is looking for alternatives,
including barter trade, to circumvent the sanctions.
Altogether, African countries are forecast to import 11.4
million tonnes, up 2 percent from 2011 and almost a third of
total trade.
Among exporters, Thailand is anticipated to sell 7.5
million tonnes this year, 29 percent less than the 10.6
million tonnes shipped in 2011. Sustained by the high prices
guaranteed under the pledging programme, Thai export
quotations now stand about 25 to 30 percent above those of
competitors, which is prompting a shift of importers towards
other origins. However, at the forecasted volume of exports,
Thailand would still retain its primacy among exporters.
Likewise, sales by Brazil, which reached a 1.3 million tonne
record in 2011 thanks to government programmes to move
surpluses out of the production zones, are expected to fall by
over 50 percent. More modest declines are anticipated to be
incurred by Argentina, the US and Uruguay. Following the
lifting of export restraints and owing to competitive pricing,
a large share of the world market is likely to be captured by

Market assessments
May 2012 25
India, now forecast to ship 6.3 million tonnes, or 58 percent
more than last year. Australia, Cambodia and Pakistan also seem to be in a position to step up deliveries, while Viet Nam, the second largest international supplier, is foreseen to
export 7.2 million tonnes, almost unchanged from 2011.
UTILIZATION
Declining domestic prices to sustain an increase in per capita rice food consumption Global rice utilization is forecast to increase by 1.9 percent in
2012/13, to 477 million tonnes. Of these, 403 million tonnes
are estimated to be destined to direct human consumption,
which would lift the average annual rice food per capita
intake from 56.7 kg in 2011/12 to 57.0 kg in 2012/13.
Supplies destined to animal feed are assessed to expand
by 3 percent to 12.6 million tonnes, with other end uses
(including post-harvest losses) foreseen to hover around 62
million tonnes.
To some extent, the anticipated increase of average per
capita food consumption in 2012/13 may be facilitated
by a stabilization, if not a drop, of retail prices in domestic
markets. Looking at the pattern emerging over the past
twelve months, rice prices have tended to remain stable or
to dip in most regions, with the exception of East Africa,
which continues to witness substantial increases. One
major development which could have a significant impact
on rice consumption in the next year is the announced
implementation of India’s National Food Security Bill as of
2013. Under the proposal, entitlements to subsidized rice
are to be extended to 75 percent of the rural population
and to 50 percent of the urban population. It is estimated
that its implementation will require 64 million tonnes of
grain (wheat and rice) for distribution and cost up to USD 67
billion (rupees 3.5 trillion).
STOCKS
World rice inventories to continue rising to new recordsWorld rice production is estimated to have regularly
exceeded utilization since 2005/06, resulting in successive
accumulation of rice inventories. This tendency also is
expected to prevail in the current and coming seasons.
World stocks at the end of seasons in 2012 are foreseen
to rise by over 8 percent (11.7 million tonnes) to 152.8
million tonnes. Increases are expected to be widespread
and especially marked in China, India, Egypt, Indonesia and
Pakistan. Notwithstanding the production shortfall, Thailand
is also expected to build up its inventories, an effect of the
Table 7. World rice market at a glance
2009/10 2010/11 2011/12
Change: 2011/12
over 2010/11
estim. f'cast
million tonnes %
WORLD BALANCE
Production 455.4 468.1 480.1 2.6
Trade1 31.5 35.2 34.3 -2.6
Total utilization 448.6 460.8 468.4 1.6
Food 382.4 389.3 395.9 1.7
Ending stocks 134.4 141.0 152.8 8.4
SUPPLY AND DEMAND INDICATORS
Per caput food consumption:
World (kg/year) 56.0 56.4 56.7 0.5
LIFDC (kg/year) 68.1 68.7 69.4 1.0
World stock-to-use ratio (%) 29.2 30.1 32.0
Major exporters stock-to-disappearance ratio2 (%) 20.8 20.0 22.7
FAO RICE PRICE INDEX (2002-2004=100) 2010 2011 2012
Change: Jan-Apr 2012
over Jan-Apr 2011
Jan-Apr %
229 251 233 -6.8
1 Calendar year exports (second year shown).2 Major exporters include India, Pakistan, Thailand, the United States and Viet Nam.
More detailed information on the rice market is available in the FAO Rice Market Monitor which can be accessed at:http://www.fao.org/economic/est/publications/rice-publications/rice-market-monitor-rmm/en/
Figure 20. Rice production, utilization and stocks
50
100
150
200
350
400
450
500
11/1209/1007/0805/0603/0401/02
Million tonnes, milled eq. Million tonnes, milled eq.
f’cast
Stocks (right axis)
Production (left axis) Utilization (left axis)

Food Outlook
May 201226
AS
IAM
on
thU
SD
/K
g3
mo
nth
s e
arl
ier
1 y
ea
r e
arl
ier
2 y
ea
rs e
arl
ier
Ba
ng
lad
esh
: D
ha
ka
(co
ars
e)
Ma
r-1
20
.35
Bh
uta
n:
Sa
md
rup
Jo
ng
kh
ar
(wh
ite
)Fe
b-1
20
.37
Ca
mb
od
ia:
Ph
no
m P
en
h (
mix
)*M
ar-
12
0.4
2
Ch
ina
: 5
0 C
ity A
vg
. (j
ap
on
ica
se
co
nd
qu
ality
)M
ar-
12
0.8
5
Ind
ia:
De
lhi
Ma
r-1
20
.47
Ind
on
esi
a:
Ntl
. A
vg
.M
ar-
12
1.1
4
Jap
an
: T
ok
yo
Ku
-are
a (
wh
ite
)Fe
b-1
25
.58
La
o P
DR
: V
ien
tia
ne
(o
rdin
ary
fir
st q
ua
lity
)M
ar-
12
1.0
0
Mo
ng
olia
: U
laa
nb
aa
tar
M
ar-
12
1.2
4
Mya
nm
ar:
Ntl
. A
vg
. D
ec-1
10
.50
Ne
pa
l: K
ath
ma
nd
u (
co
ars
e)
Fe
b-1
20
.44
Pa
kis
tan
: K
ara
ch
i (i
rri)
M
ar-
12
0.5
4
Ph
ilip
pin
es:
Ntl
. A
vg
. (w
ell-m
ille
d)
Ma
r-1
20
.82
Sri
La
nk
a:
Co
lom
bo
(w
hit
e)
Ma
r-1
20
.43
Th
aila
nd
: B
an
gk
ok
(5
% b
rok
en
)*Fe
b-1
20
.49
Vie
t N
am
: D
on
g T
ha
p (
25
% b
rok
en
)M
ar-
12
0.3
5
WE
ST
ER
N A
FR
ICA
Be
nin
: C
oto
no
u (
imp
ort
ed
)Fe
b-1
21
.07
Bu
rkin
a F
aso
: O
ua
ga
do
ug
ou
(im
po
rte
d)*
Ma
r-1
20
.75
Ca
pe
Ve
rde
: Sa
nti
ag
o (
imp
ort
ed
)Fe
b-1
21
.11
Ch
ad
: N
'Dja
me
na
(im
po
rte
d)
Fe
b-1
21
.01
Ma
li:
Ba
ma
ko
*
Ma
r-1
20
.75
Ma
uri
tan
ia:
No
ua
kch
ott
(im
po
rte
d)
Jan
-12
0.6
9
Nig
er:
Nia
me
y (
imp
ort
ed
)Ja
n-1
20
.89
Se
ne
ga
l: D
ak
ar
(im
po
rte
d)
Jan
-12
0.8
1
CE
NT
RA
L A
FR
ICA
De
m.
Re
p.
Co
ng
o:
Kin
sha
sa (
imp
ort
ed
)Fe
b-1
21
.06
EA
ST
ER
N A
FIR
CA
Bu
run
di: B
uju
mb
ura
D
ec-1
11
.32
Djib
ou
ti:
Djib
ou
ti (
Be
lem
)*D
ec-1
10
.70
Rw
an
da
: K
iga
li*
Fe
b-1
21
.16
So
ma
lia
: M
og
ad
ish
u (
imp
ort
ed
) Fe
b-1
20
.77
Ug
an
da
: K
am
pa
la*
M
ar-
12
1.3
4
Un
ite
d R
ep
. o
f T
an
za
nia
: D
ar
es
Sa
laa
m*
M
ar-
12
1.2
7
mo
nth
ly p
rice
tre
nd
His
tori
ca
lLa
test
ava
ila
ble
:La
test
qu
ota
tio
n a
va
ila
ble
co
mp
are
d t
o:
/1
-100
0-1
00
00100
-100
0-1
00
00100
-100
0-1
00
00100
2007
20
2010
007
2010
12012
-100
0-1
00
00100
-100
0-1
00
00100
-100
0-1
00
00100
2007
20
2010
007
2010
12012
-100
0-1
00
00100
-100
0-1
00
00100
-100
0-1
00
00100
2007
20
2010
007
2010
12012
-100
0-1
00
00100
-100
0-1
00
00100
-100
0-1
00
00100
2007
20
2010
007
2010
12012
Tab
le 8
. Mo
nth
ly r
etai
l pri
ces
of
rice
in s
elec
ted
mar
kets
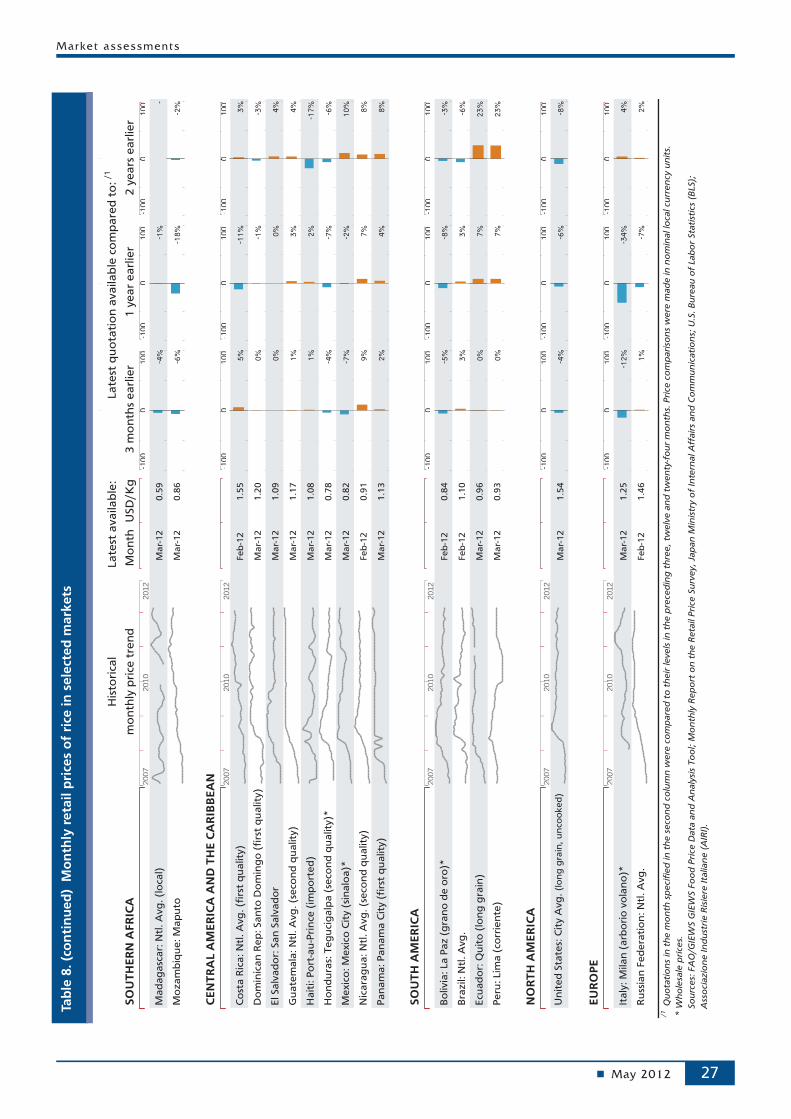
Market assessments
May 2012 27
Tab
le 8
. (co
nti
nu
ed)
Mo
nth
ly r
etai
l pri
ces
of
rice
in s
elec
ted
mar
kets
SOU
THER
N A
FRIC
AM
on
thU
SD
/Kg
3 m
on
ths
ea
rlie
r1
ye
ar
ea
rlie
r2
ye
ars
ea
rlie
r
Ma
da
ga
sca
r: N
tl.
Avg
. (l
oca
l)M
ar-
12
0.5
9
Mo
za
mb
iqu
e:
Ma
pu
to
Ma
r-1
20
.86
CEN
TRA
L A
MER
ICA
AN
D T
HE
CA
RIB
BEA
N
Co
sta
Ric
a:
Ntl
. A
vg
. (f
irst
qu
alit
y)
Fe
b-1
21
.55
Do
min
ica
n R
ep
: Sa
nto
Do
min
go
(fi
rst
qu
ality
) M
ar-
12
1.2
0
El Sa
lva
do
r: S
an
Sa
lva
do
r M
ar-
12
1.0
9
Gu
ate
ma
la:
Ntl
. A
vg
. (s
eco
nd
qu
alit
y)
Ma
r-1
21
.17
Ha
iti: P
ort
-au
-Pri
nce
(im
po
rte
d)
Ma
r-1
21
.08
Ho
nd
ura
s: T
eg
uci
ga
lpa
(se
con
d q
ua
lity)*
Ma
r-1
20
.78
Me
xic
o:
Me
xic
o C
ity (
sin
alo
a)*
Ma
r-1
20
.82
Nic
ara
gu
a:
Ntl
. A
vg
. (s
eco
nd
qu
alit
y)
Fe
b-1
20
.91
Pa
na
ma
: P
an
am
a C
ity (
firs
t q
ua
lity)
Ma
r-1
21
.13
SOU
TH A
MER
ICA
Bo
livia
: La
Pa
z (
gra
no
de
oro
)*Fe
b-1
20
.84
Bra
zil:
Ntl
. A
vg
. Fe
b-1
21
.10
Ecu
ad
or:
Qu
ito
(lo
ng
gra
in)
Ma
r-1
20
.96
Pe
ru:
Lim
a (
corr
ien
te)
Ma
r-1
20
.93
NO
RTH
AM
ERIC
A
Un
ite
d S
tate
s: C
ity A
vg
. (l
on
g g
rain
, u
nco
ok
ed
)
Ma
r-1
21
.54
EUR
OPE
Ita
ly:
Mila
n (
arb
ori
o v
ola
no
)*M
ar-
12
1.2
5
Ru
ssia
n F
ed
era
tio
n:
Ntl
. A
vg
.
Fe
b-1
21
.46
/1 Q
uo
tati
on
s in
th
e m
on
th s
pe
cifi
ed
in
th
e s
eco
nd
co
lum
n w
ere
co
mp
are
d t
o t
he
ir le
ve
ls in
th
e p
rece
din
g t
hre
e,
twe
lve
an
d t
we
nty
-fo
ur
mo
nth
s. P
rice
co
mp
ari
son
s w
ere
ma
de
in
no
min
al lo
cal cu
rre
ncy
un
its.
* W
ho
lesa
le p
rice
s.
S
ou
rce
s: F
AO
/GIE
WS
GIE
WS
Fo
od
Pri
ce D
ata
an
d A
na
lysi
s T
oo
l; M
on
thly
Re
po
rt o
n t
he
Re
tail
Pri
ce S
urv
ey,
Jap
an
Min
istr
y o
f In
tern
al A
ffair
s an
d C
om
mu
nic
ati
on
s; U
.S.
Bu
reau
of
Lab
or
Sta
tist
ics
(BLS
);
A
sso
ciazio
ne
In
du
stri
e R
isie
re I
talia
ne
(A
IRI)
.
His
tori
cal
La
test
ava
ila
ble
:La
test
qu
ota
tio
n a
va
ila
ble
co
mp
are
d t
o:
/1
mo
nth
ly p
rice
tre
nd
-100
0-1
0000
100
-100
0-1
0000
100
-100
0-1
0000
100
2007
2020
1000
720
10120
12
-100
0-1
0000
100
-100
0-1
0000
100
-100
0-1
0000
100
2007
2020
1000
720
10120
12
-100
0-1
0000
100
-100
0-1
0000
100
-100
0-1
0000
100
2007
2020
1000
720
10120
12
-100
0-1
0000
100
-100
0-1
0000
100
-100
0-1
0000
100
2007
2020
1000
720
10120
12
-100
0-1
0000
100
-100
0-1
0000
100
-100
0-1
0000
100
2007
2020
1000
720
10120
12
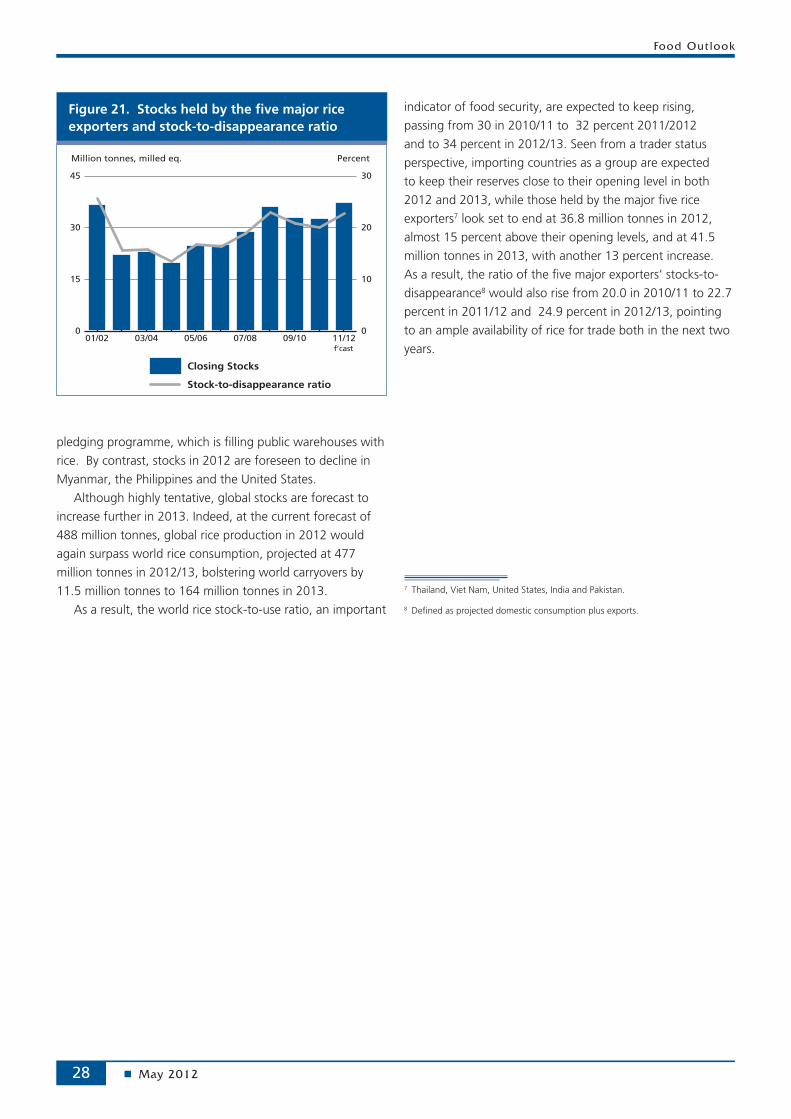
Food Outlook
May 201228
pledging programme, which is filling public warehouses with
rice. By contrast, stocks in 2012 are foreseen to decline in
Myanmar, the Philippines and the United States.
Although highly tentative, global stocks are forecast to
increase further in 2013. Indeed, at the current forecast of
488 million tonnes, global rice production in 2012 would
again surpass world rice consumption, projected at 477
million tonnes in 2012/13, bolstering world carryovers by
11.5 million tonnes to 164 million tonnes in 2013.
As a result, the world rice stock-to-use ratio, an important
Figure 21. Stocks held by the five major rice exporters and stock-to-disappearance ratio
0
15
30
45
11/1209/1007/0805/0603/0401/020
10
20
30
Million tonnes, milled eq. Percent
f’cast
Closing Stocks
Stock-to-disappearance ratio
indicator of food security, are expected to keep rising,
passing from 30 in 2010/11 to 32 percent 2011/2012
and to 34 percent in 2012/13. Seen from a trader status
perspective, importing countries as a group are expected
to keep their reserves close to their opening level in both
2012 and 2013, while those held by the major five rice
exporters7 look set to end at 36.8 million tonnes in 2012,
almost 15 percent above their opening levels, and at 41.5
million tonnes in 2013, with another 13 percent increase.
As a result, the ratio of the five major exporters’ stocks-to-
disappearance8 would also rise from 20.0 in 2010/11 to 22.7
percent in 2011/12 and 24.9 percent in 2012/13, pointing
to an ample availability of rice for trade both in the next two
years.
7 Thailand, Viet Nam, United States, India and Pakistan.
8 Defined as projected domestic consumption plus exports.

Market assessments
May 2012 29
Tab
le 9
. Maj
or
Ric
e Po
licy
Dev
elo
pm
ents
: Oct
ob
er 2
011
to A
pri
l 20
12
Co
un
try
Pro
du
ctD
ate
Polic
y In
stru
men
tD
escr
ipti
on
Ban
gla
des
h
Ric
eD
ec-1
1G
ove
rnm
ent
pro
cure
men
t,
pu
rch
asin
g p
rice
sSe
t A
man
ric
e p
rocu
rem
ent
targ
et a
t 20
0 00
0 to
nn
es, t
o b
e b
ou
gh
t b
etw
een
5 D
ecem
ber
an
d 2
8 Fe
bru
ary,
wit
h o
ffici
al p
urc
has
ing
pri
ce e
stab
lish
ed a
t U
SD 3
36 p
er t
on
ne
(tak
a 28
per
kilo
).
Ric
eM
ar-1
2G
ove
rnm
ent
pro
cure
men
t,
pu
rch
asin
g p
rice
s
Exte
nd
ed A
man
pro
cure
men
t ta
rget
to
co
ver
an a
dd
itio
nal
150
000
to
nn
es t
o 3
50 0
00 t
on
nes
. Su
pp
lies
wer
e to
be
pu
rch
ased
by
31 M
arch
201
2, w
ith
pro
cure
men
t p
rice
s se
t at
USD
336
per
to
nn
e (t
aka
28 p
er
kilo
) in
th
e ca
se o
f p
arb
oile
d r
ice
and
USD
324
per
to
nn
e (t
aka
27 p
er k
ilo)
in t
he
case
of
wh
ite
rice
.
Ric
eM
ar-1
2Im
po
rt a
gre
emen
tSi
gn
ed M
emo
ran
du
m o
f U
nd
erst
and
ing
wit
h T
hai
lan
d, g
ivin
g B
ang
lad
esh
pri
ori
ty in
th
e p
rovi
sio
n o
f u
p t
o 1
.0 m
illio
n t
on
nes
of
par
bo
iled
ric
e an
nu
ally
.
Ric
eM
ar-1
2Ex
po
rt b
anSu
spen
ded
exp
ort
ban
on
aro
mat
ic r
ice
in p
lace
sin
ce 2
008.
Ric
eA
pr-
12Pr
od
uct
ion
su
pp
ort
Earm
arke
d U
SD 4
.2 m
illio
n (
taka
350
mill
ion
) to
su
pp
ort
Au
s cr
op
cu
ltiv
atio
n d
uri
ng
th
e 20
12 s
easo
n.
Fun
ds
will
ass
ist
cult
ivat
ion
of
49 0
00 h
a, b
y fu
nd
ing
dis
trib
uti
on
of
Ner
ica
and
hig
h-y
ield
ing
see
d
vari
etie
s, a
s w
ell a
s fe
rtili
zers
to
350
000
mar
gin
al f
arm
ers.
Bo
livia
Ric
eM
ar-1
2Ex
po
rt q
uo
taIs
sued
go
vern
men
t p
erm
it f
or
30 0
00 t
on
nes
of
mill
ed/s
emi-
mill
ed r
ice
and
20
000
ton
nes
pad
dy/
bro
ken
s to
be
exp
ort
ed, u
p f
rom
a p
revi
ou
s ap
plic
able
ove
rall
ceili
ng
of
30 0
00 t
on
nes
.
Ric
eM
ar-1
2G
ove
rnm
ent
pro
cure
men
t,
pu
rch
asin
g p
rice
sEn
able
d s
tate
en
terp
rise
EM
APA
to
pro
cure
su
pp
lies
fro
m t
he
2012
har
vest
at
USD
230
per
to
nn
e,
star
tin
g M
arch
201
2.
Bra
zil
Ric
eM
ar-1
2Su
pp
ort
pri
ces
Allo
cate
d U
SD 4
03 m
illio
n (
reai
s 73
7 m
illio
n)
to im
ple
men
t th
e m
inim
um
gu
aran
teed
pri
ce p
olic
y fo
r u
p t
o 2
.02
mill
ion
to
nn
es o
f ri
ce in
201
2. F
loo
r p
rice
s u
nd
er t
he
pro
gra
m r
emai
n s
et a
t U
SD 2
07–3
38 p
er
ton
ne
(rea
is 1
8.90
–30.
96 p
er 5
0 ki
lo b
ag).
Bra
zil/A
rgen
tin
aR
ice
Mar
-12
Imp
ort
qu
ota
An
no
un
ced
ag
reem
ent
to li
mit
th
e fl
ow
s o
f ri
ce f
rom
Arg
enti
na
to B
razi
l.
Ch
ina
(Mai
nla
nd
)
Ric
eFe
b-1
2Su
pp
ort
pri
ces
Rai
sed
go
vern
men
t p
add
y p
rocu
rem
ent
pri
ces
for
the
2012
sea
son
by
18 p
erce
nt
to U
SD 3
78 p
er t
on
ne
(yu
an 1
20 p
er 5
0 ki
lo b
ag)
of
earl
y in
dic
a ri
ce, b
y 17
per
cen
t to
USD
394
per
to
nn
e (1
25 y
uan
per
50
kilo
b
ag)
of
late
/inte
rmed
iate
ind
ica
rice
, an
d b
y 9
per
cen
t to
USD
441
per
to
nn
e (y
uan
140
per
50
kilo
bag
) o
f ja
po
nic
a ri
ce.
Gra
ins
Feb
-12
Sect
or
po
licy
fram
ewo
rkR
elea
se o
f d
raft
Gra
ins
Law
by
the
Stat
e C
ou
nci
l Leg
isla
tive
Aff
airs
Offi
ce f
or
pu
blic
co
mm
enta
ry. T
he
dra
ft a
ims
to e
nsu
re n
atio
nal
gra
in s
ecu
rity
by
pro
mo
tin
g s
tab
le g
rain
pro
du
ctio
n, e
nsu
rin
g m
arke
t st
abili
ty a
nd
str
eng
then
ing
reg
ula
tio
n a
nd
su
per
visi
on
of
dis
trib
uti
on
ch
ann
els.
Gen
eral
Mar
-12
Gen
eral
, pro
du
ctio
n
sup
po
rt
Rai
sed
201
2 b
ud
get
ary
allo
cati
on
s to
th
e ag
ricu
ltu
ral s
ecto
r b
y 18
per
cen
t t
o U
SD 1
89 b
illio
n (
yuan
1.2
tr
illio
n),
of
wh
ich
USS
26 b
illio
n (
yuan
162
.8 b
illio
n)
will
be
earm
arke
d t
o f
un
d d
irec
t p
aym
ents
to
gra
in
gro
wer
s, s
ub
sid
ies
on
see
ds
and
mac
hin
ery
and
oth
er in
pu
ts.
Co
te D
'Ivo
ire
Ric
eFe
b-1
2Pr
od
uct
ion
tar
get
Rev
ised
ric
e d
evel
op
men
t st
rate
gy
for
the
per
iod
201
2–20
20, w
ith
th
e ai
m o
f ra
isin
g o
utp
ut
to 2
.1
mill
ion
to
nn
es b
y 20
18.
Do
min
ican
R
epu
blic
Ric
eJa
n-1
2Su
pp
ort
pri
ces/
sto
ckp
ilin
g
Set
pro
du
cer
pri
ce fl
oo
r o
f U
SD 3
19–4
14 (
pes
os
1 85
0–1
950)
per
to
nn
e, a
nd
a c
eilin
g o
f U
SD 4
25–
446
per
to
nn
e (p
eso
s 2
000–
2 10
0) t
o a
pp
ly f
or
120
kilo
s o
f p
rose
qu
ia 4
/5 a
nd
co
mm
on
var
ieti
es,
resp
ecti
vely
. Ap
pro
ved
co
vera
ge
of
100
000
ton
nes
of
2011
win
ter
pad
dy
un
der
th
e n
atio
nal
war
eho
use
re
ceip
ts p
rog
ram
me.
Ric
eJa
n-1
2Ex
po
rt q
uo
taPr
ovi
ded
go
vern
men
t ap
pro
val f
or
exp
ort
of
45 0
00 t
on
nes
of
rice
.
Ric
eA
pr-
12Su
pp
ort
pri
ces
–
Pro
du
ctio
n s
up
po
rt
Set
pad
dy
sup
po
rt p
rice
s at
USD
425
–446
per
to
nn
e (p
eso
s 2
000
–2 1
00 p
er 1
20 k
ilos)
of
com
mo
n
vari
etie
s fr
om
th
e 20
12 s
pri
ng
har
vest
. Pri
ce b
and
s n
ot
to a
pp
ly f
or
Puit
a, C
rist
al a
nd
Yo
kaju
var
ieti
es.
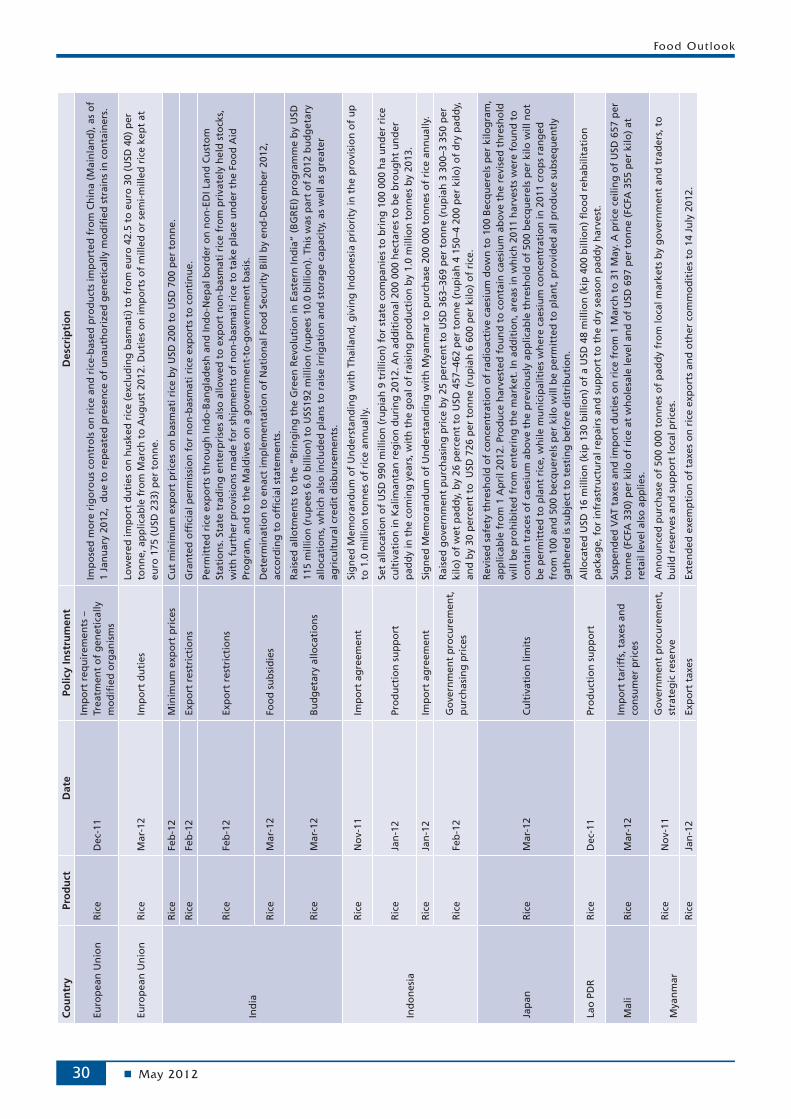
Food Outlook
May 201230
Co
un
try
Pro
du
ctD
ate
Polic
y In
stru
men
tD
escr
ipti
on
Euro
pea
n U
nio
nR
ice
Dec
-11
Imp
ort
req
uir
emen
ts –
Tr
eatm
ent
of
gen
etic
ally
m
od
ified
org
anis
ms
Imp
ose
d m
ore
rig
oro
us
con
tro
ls o
n r
ice
and
ric
e-b
ased
pro
du
cts
imp
ort
ed f
rom
Ch
ina
(Mai
nla
nd
), a
s o
f 1
Jan
uar
y 20
12,
du
e to
rep
eate
d p
rese
nce
of
un
auth
ori
zed
gen
etic
ally
mo
difi
ed s
trai
ns
in c
on
tain
ers.
Euro
pea
n U
nio
nR
ice
Mar
-12
Imp
ort
du
ties
Low
ered
imp
ort
du
ties
on
hu
sked
ric
e (e
xclu
din
g b
asm
ati)
to
fro
m e
uro
42.
5 to
eu
ro 3
0 (U
SD 4
0) p
er
ton
ne,
ap
plic
able
fro
m M
arch
to
Au
gu
st 2
012.
Du
ties
on
imp
ort
s o
f m
illed
or
sem
i-m
illed
ric
e ke
pt
at
euro
175
(U
SD 2
33)
per
to
nn
e.
Ind
ia
Ric
eFe
b-1
2M
inim
um
exp
ort
pri
ces
Cu
t m
inim
um
exp
ort
pri
ces
on
bas
mat
i ric
e b
y U
SD 2
00 t
o U
SD 7
00 p
er t
on
ne.
Ric
eFe
b-1
2Ex
po
rt r
estr
icti
on
sG
ran
ted
offi
cial
per
mis
sio
n f
or
no
n-b
asm
ati r
ice
exp
ort
s to
co
nti
nu
e.
Ric
eFe
b-1
2Ex
po
rt r
estr
icti
on
s
Perm
itte
d r
ice
exp
ort
s th
rou
gh
Ind
o-B
ang
lad
esh
an
d In
do
-Nep
al b
ord
er o
n n
on
-ED
I Lan
d C
ust
om
St
atio
ns.
Sta
te t
rad
ing
en
terp
rise
s al
so a
llow
ed t
o e
xpo
rt n
on
-bas
mat
i ric
e fr
om
pri
vate
ly h
eld
sto
cks,
w
ith
fu
rth
er p
rovi
sio
ns
mad
e fo
r sh
ipm
ents
of
no
n-b
asm
ati r
ice
to t
ake
pla
ce u
nd
er t
he
Foo
d A
id
Pro
gra
m, a
nd
to
th
e M
ald
ives
on
a g
ove
rnm
ent-
to-g
ove
rnm
ent
bas
is.
Ric
eM
ar-1
2Fo
od
su
bsi
die
sD
eter
min
atio
n t
o e
nac
t im
ple
men
tati
on
of
Nat
ion
al F
oo
d S
ecu
rity
Bill
by
end
-Dec
emb
er 2
012,
ac
cord
ing
to
offi
cial
sta
tem
ents
.
Ric
eM
ar-1
2B
ud
get
ary
allo
cati
on
s
Rai
sed
allo
tmen
ts t
o t
he
“Bri
ng
ing
th
e G
reen
Rev
olu
tio
n in
Eas
tern
Ind
ia”
(BG
REI
) p
rog
ram
me
by
USD
11
5 m
illio
n (
rup
ees
6.0
bill
ion
) to
USS
192
mill
ion
(ru
pee
s 10
.0 b
illio
n).
Th
is w
as p
art
of
2012
bu
dg
etar
y al
loca
tio
ns,
wh
ich
als
o in
clu
ded
pla
ns
to r
aise
irri
gat
ion
an
d s
tora
ge
cap
acit
y, a
s w
ell a
s g
reat
er
agri
cult
ura
l cre
dit
dis
bu
rsem
ents
.
Ind
on
esia
Ric
eN
ov-
11Im
po
rt a
gre
emen
tSi
gn
ed M
emo
ran
du
m o
f U
nd
erst
and
ing
wit
h T
hai
lan
d, g
ivin
g In
do
nes
ia p
rio
rity
in t
he
pro
visi
on
of
up
to
1.0
mill
ion
to
nn
es o
f ri
ce a
nn
ual
ly.
Ric
eJa
n-1
2Pr
od
uct
ion
su
pp
ort
Set
allo
cati
on
of
USD
990
mill
ion
(ru
pia
h 9
tri
llio
n)
for
stat
e co
mp
anie
s to
bri
ng
100
000
ha
un
der
ric
e cu
ltiv
atio
n in
Kal
iman
tan
reg
ion
du
rin
g 2
012.
An
ad
dit
ion
al 2
00 0
00 h
ecta
res
to b
e b
rou
gh
t u
nd
er
pad
dy
in t
he
com
ing
yea
rs, w
ith
th
e g
oal
of
rais
ing
pro
du
ctio
n b
y 1.
0 m
illio
n t
on
nes
by
2013
.
Ric
eJa
n-1
2Im
po
rt a
gre
emen
tSi
gn
ed M
emo
ran
du
m o
f U
nd
erst
and
ing
wit
h M
yan
mar
to
pu
rch
ase
200
000
ton
nes
of
rice
an
nu
ally
.
Ric
eFe
b-1
2G
ove
rnm
ent
pro
cure
men
t,
pu
rch
asin
g p
rice
s
Rai
sed
go
vern
men
t p
urc
has
ing
pri
ce b
y 25
per
cen
t to
USD
363
–369
per
to
nn
e (r
up
iah
3 3
00–3
350
per
ki
lo)
of
wet
pad
dy,
by
26 p
erce
nt
to U
SD 4
57–4
62 p
er t
on
ne
(ru
pia
h 4
150
–4 2
00 p
er k
ilo)
of
dry
pad
dy,
an
d b
y 30
per
cen
t to
USD
726
per
to
nn
e (r
up
iah
6 6
00 p
er k
ilo)
of
rice
.
Jap
anR
ice
Mar
-12
Cu
ltiv
atio
n li
mit
s
Rev
ised
saf
ety
thre
sho
ld o
f co
nce
ntr
atio
n o
f ra
dio
acti
ve c
aesi
um
do
wn
to
100
Bec
qu
erel
s p
er k
ilog
ram
, ap
plic
able
fro
m 1
Ap
ril 2
012.
Pro
du
ce h
arve
sted
fo
un
d t
o c
on
tain
cae
siu
m a
bo
ve t
he
revi
sed
th
resh
old
w
ill b
e p
roh
ibit
ed f
rom
en
teri
ng
th
e m
arke
t. In
ad
dit
ion
, are
as in
wh
ich
201
1 h
arve
sts
wer
e fo
un
d t
o
con
tain
tra
ces
of
caes
ium
ab
ove
th
e p
revi
ou
sly
app
licab
le t
hre
sho
ld o
f 50
0 b
ecq
uer
els
per
kilo
will
no
t b
e p
erm
itte
d t
o p
lan
t ri
ce, w
hile
mu
nic
ipal
itie
s w
her
e ca
esiu
m c
on
cen
trat
ion
in 2
011
cro
ps
ran
ged
fr
om
100
an
d 5
00 b
ecq
uer
els
per
kilo
will
be
per
mit
ted
to
pla
nt,
pro
vid
ed a
ll p
rod
uce
su
bse
qu
entl
y g
ath
ered
is s
ub
ject
to
tes
tin
g b
efo
re d
istr
ibu
tio
n.
Lao
PD
RR
ice
Dec
-11
Pro
du
ctio
n s
up
po
rtA
lloca
ted
USD
16
mill
ion
(ki
p 1
30 b
illio
n)
of
a U
SD 4
8 m
illio
n (
kip
400
bill
ion
) fl
oo
d r
ehab
ilita
tio
n
pac
kag
e, f
or
infr
astr
uct
ura
l rep
airs
an
d s
up
po
rt t
o t
he
dry
sea
son
pad
dy
har
vest
.
Mal
iR
ice
Mar
-12
Imp
ort
tar
iffs
, tax
es a
nd
co
nsu
mer
pri
ces
Susp
end
ed V
AT
taxe
s an
d im
po
rt d
uti
es o
n r
ice
fro
m 1
Mar
ch t
o 3
1 M
ay. A
pri
ce c
eilin
g o
f U
SD 6
57 p
er
ton
ne
(FC
FA 3
30)
per
kilo
of
rice
at
wh
ole
sale
leve
l an
d o
f U
SD 6
97 p
er t
on
ne
(FC
FA 3
55 p
er k
ilo)
at
reta
il le
vel a
lso
ap
plie
s.
Mya
nm
arR
ice
No
v-11
Go
vern
men
t p
rocu
rem
ent,
st
rate
gic
res
erve
An
no
un
ced
pu
rch
ase
of
500
000
ton
nes
of
pad
dy
fro
m lo
cal m
arke
ts b
y g
ove
rnm
ent
and
tra
der
s, t
o
bu
ild r
eser
ves
and
su
pp
ort
loca
l pri
ces.
Ric
eJa
n-1
2Ex
po
rt t
axes
Exte
nd
ed e
xem
pti
on
of
taxe
s o
n r
ice
exp
ort
s an
d o
ther
co
mm
od
itie
s to
14
July
201
2.

Market assessments
May 2012 31
Co
un
try
Pro
du
ctD
ate
Polic
y In
stru
men
tD
escr
ipti
on
Nig
eria
Gen
eral
Dec
-11
Pro
du
ctio
n s
up
po
rt
An
no
un
ced
pla
ns
to o
verh
aul t
he
fert
ilize
r d
istr
ibu
tio
n s
yste
m, a
s p
art
of
the
Ag
ricu
ltu
ral
Tran
sfo
rmat
ion
Act
ion
Pla
n (
ATA
P). A
dd
itio
nal
su
pp
ort
to
tak
e th
e fo
rm o
f lo
an g
uar
ante
es f
or
pu
rch
ase
of
agri
cult
ura
l in
pu
ts, a
ris
k-sh
arin
g f
acili
ty f
or
agri
cult
ura
l len
din
g, a
s w
ell a
s th
e el
imin
atio
n
of
imp
ort
du
ties
on
ag
ricu
ltu
ral m
ach
iner
y an
d e
qu
ipm
ent
as o
f 1
Jan
uar
y 20
12.
Ric
eD
ec-1
1Im
po
rt le
vies
Esta
blis
hed
levi
es f
or
hu
sked
ric
e at
25
per
cen
t (n
on
e p
revi
ou
sly)
on
to
p o
f a
5 p
erce
nt
du
ty r
ate
star
tin
g 1
Ju
ly 2
012.
In t
he
case
of
mill
ed/s
emi-
mill
ed r
ice,
levi
es w
ill b
e ra
ised
to
40
per
cen
t (2
0 p
erce
nt
pre
vio
usl
y), t
o b
e ap
plie
d o
n t
op
of
a 10
per
cen
t im
po
rt d
uty
. Ch
arg
es t
o b
e ra
ised
fu
rth
er a
s o
f 1
Jan
uar
y 20
13, w
ith
mill
ed/s
emi-
mill
ed r
ice
to a
ttra
ct a
levy
of
100
per
cen
t.
Phili
pp
ines
Ric
eM
ar-1
1Im
po
rt q
uo
taA
lloca
ted
du
ty f
ree
imp
ort
qu
ota
of
380
000
ton
nes
to
th
e p
riva
te s
ecto
r fo
r 20
12.
Gen
eral
Jan
-12
Bu
dg
etar
y al
loca
tio
ns
Bo
ost
ed b
ud
get
ary
allo
cati
on
s to
th
e D
epar
tmen
t o
f A
gri
cult
ure
to
USD
1.4
bill
ion
(p
eso
s 61
.73
bill
ion
),
mo
st o
f w
hic
h w
ill g
o t
o fi
nan
ce in
terv
enti
on
s u
nd
er t
he
Foo
d S
tap
les
Suffi
cien
cy P
rog
ram
(FS
SP).
Sier
ra L
eon
eR
ice/
Ru
bb
erJa
n-1
2Fo
reig
n a
gri
cult
ura
l in
vest
men
tA
nn
ou
nce
d a
six
-yea
r p
roje
ct o
f th
e g
ove
rnm
ent
and
Ch
ines
e in
vest
ors
to
pu
t 13
5 00
0 h
a u
nd
er r
ice
and
ru
bb
er c
ult
ivat
ion
.
Sri L
anka
Ric
eJa
n-1
2St
ock
rel
ease
Rel
ease
of
100
000
ton
nes
of
pad
dy
by
Pad
dy
Mar
keti
ng
Bo
ard
, ah
ead
of
star
t to
Mah
a 20
12
pro
cure
men
t d
rive
.
Ric
eJa
n-1
2Ex
po
rt t
arg
etSe
t ri
ce e
xpo
rt t
arg
et o
f 20
0 00
0 to
nn
es f
or
2015
. Exp
ort
zo
nes
in A
mp
ara,
Po
lon
nar
uw
a, H
amb
anto
ta
and
Man
nar
to
be
esta
blis
hed
fo
r th
e p
urp
ose
.
Ric
eM
ar-1
2G
ove
rnm
ent
pro
cure
men
t,
cred
itEs
tab
lish
ed U
SD 2
22 m
illio
n (
rup
ees
28.5
bill
ion
) w
ort
h o
f cr
edit
to
fac
ilita
te p
ub
lic a
nd
pri
vate
sec
tor
pu
rch
ases
of
pad
dy
du
rin
g t
he
seas
on
.
Thai
lan
d
Ric
eN
ov-
11G
ove
rnm
ent
pro
cure
men
tA
pp
rove
d o
n-f
arm
sto
rag
e p
lan
fo
r vo
lum
es m
ort
gag
ed u
nd
er t
he
Pad
dy
Pled
gin
g P
rog
ram
. Th
e sc
hem
e co
vere
d 1
.0 m
illio
n t
on
nes
of
pad
dy
in n
ort
her
n a
nd
no
rth
east
ern
pro
vin
ces,
bet
wee
n 1
D
ecem
ber
201
1 an
d 2
9 Fe
bru
ary
2012
.
Ric
eFe
b-1
2G
ove
rnm
ent
pro
cure
men
t,
sup
po
rt p
rice
s
Exte
nd
ed P
add
y Pl
edg
ing
Pro
gra
m t
o c
ove
r 20
11–2
012
off
-sea
son
cro
ps,
fro
m 1
Mar
ch u
nti
l 15
Sep
tem
ber
201
2. F
arm
ers
to c
on
tin
ue
rece
ivin
g b
etw
een
USD
441
–639
(b
aht
13 8
00–2
0 00
0) p
er t
on
ne
of
pad
dy
they
ch
oo
se t
o p
led
ge,
bu
t vo
lum
es w
ill b
e re
stri
cted
to
a m
axim
um
val
ue
of
USD
16
000
(bah
t 50
0 00
0) o
r 33
to
nn
es, p
er h
ou
seh
old
.
Ven
ezu
ela
Ric
eA
pr-
12Su
pp
ort
pri
ces
Rai
sed
pad
dy
pro
du
cer
pri
ces
by
24 p
erce
nt
to U
SD 5
81 p
er t
on
ne
(Bo
livar
s 2.
50 p
er k
ilo)
of
Typ
e A
p
add
y, a
nd
USD
600
per
to
nn
e (B
oliv
ar 2
.58
per
kilo
) o
f Ty
pe
B p
add
y.
Vie
t N
am
Ric
eD
ec-1
1M
inim
um
exp
ort
pri
ces
Set
min
imu
m e
xpo
rt p
rice
s at
USD
500
per
to
nn
e o
f 5
per
cen
t b
roke
n r
ice
and
at
USD
470
per
to
nn
e o
f 25
per
cen
t b
roke
n r
ice.
Ric
eJa
n-1
2M
inim
um
exp
ort
pri
ces
Red
uce
d m
inim
um
exp
ort
pri
ces
for
5 p
erce
nt
and
25
per
cen
t b
roke
n r
ice
to U
SD 4
85 a
nd
USD
455
per
to
nn
e, r
esp
ecti
vely
.
Ric
eJa
n-1
2M
inim
um
exp
ort
pri
ces
Red
uce
d m
inim
um
exp
ort
pri
ces
for
5 p
erce
nt
bro
ken
ric
e to
USD
450
per
to
nn
e, a
nd
to
USD
425
per
to
nn
e in
th
e ca
se o
f 25
per
cen
t b
roke
n r
ice.
Ric
eJa
n-1
2Im
po
rt q
uo
taEx
emp
ted
300
000
to
nn
es o
f ri
ce f
rom
Cam
bo
dia
fro
m im
po
rt d
uti
es a
nn
ual
ly, v
alid
fro
m 1
7 Fe
bru
ary
2012
to
31
Dec
emb
er 2
013.
Ric
eM
ar-1
2G
ove
rnm
ent
pro
cure
men
t,
sup
po
rt p
rice
s
Ag
reed
by
mem
ber
co
mp
anie
s o
f th
e V
ietn
am F
oo
d A
sso
ciat
ion
to
pu
rch
ase
1.0
mill
ion
to
nn
es
pad
dy,
sta
rtin
g 1
5 M
arch
at
USD
250
per
to
nn
e (V
ND
5 0
00 p
er k
ilo).
Cre
dit
at
pre
fere
nti
al r
ates
to
be
exte
nd
ed t
o p
urc
has
ing
co
mp
anie
s, w
ho
wer
e re
qu
este
d t
o k
eep
su
pp
lies
in s
tock
fo
r th
ree
mo
nth
s.
Ric
eM
ar-1
2M
inim
um
exp
ort
pri
ces
Red
uce
d m
inim
um
exp
ort
pri
ces
for
5 p
erce
nt
bro
ken
ric
e to
USD
425
, an
d t
o U
SD 4
00 p
er t
on
ne
in t
he
case
of
25%
bro
ken
ric
e.
Ric
eA
pr-
12M
inim
um
exp
ort
pri
ces
Rai
sed
min
imu
m e
xpo
rt p
rice
s fo
r 5
per
cen
t b
roke
n r
ice
to U
SD 4
50 p
er t
on
ne,
an
d t
o U
SD 4
25 p
er
ton
ne
for
25 p
erce
nt
bro
ken
ric
e.
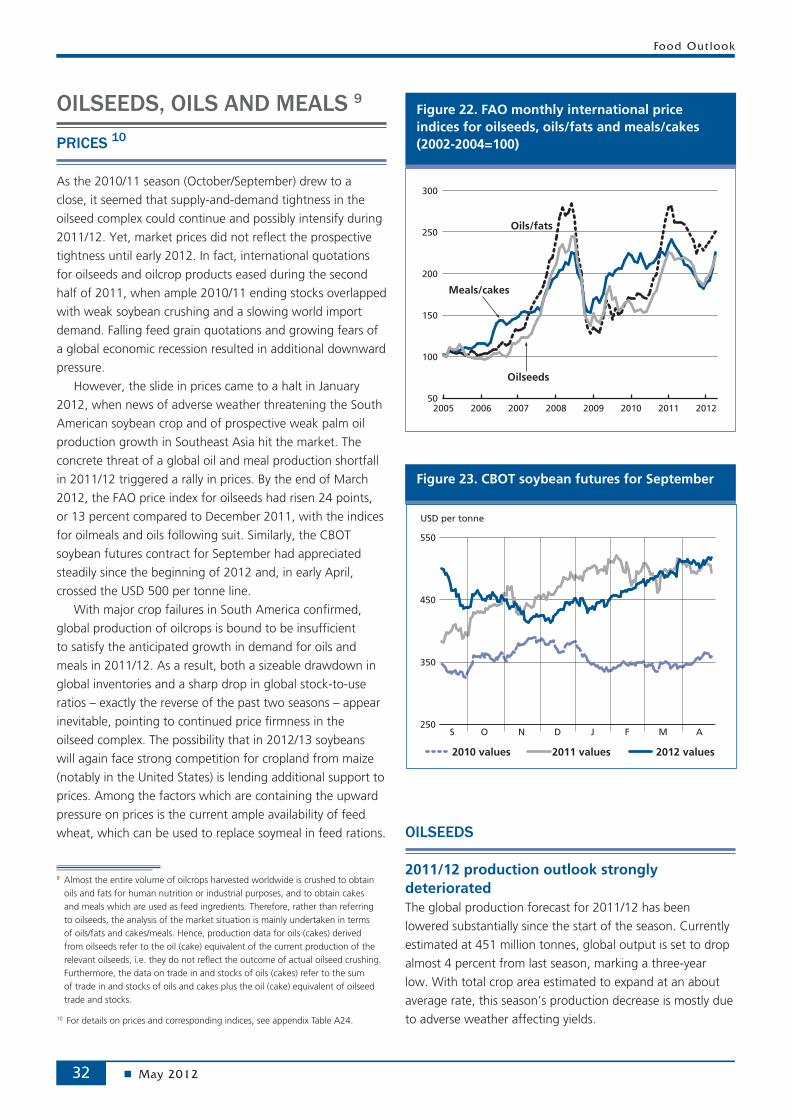
Food Outlook
May 201232
OILSEEDS, OILS AND MEALS 9
PRICES 10
As the 2010/11 season (October/September) drew to a
close, it seemed that supply-and-demand tightness in the
oilseed complex could continue and possibly intensify during
2011/12. Yet, market prices did not reflect the prospective
tightness until early 2012. In fact, international quotations
for oilseeds and oilcrop products eased during the second
half of 2011, when ample 2010/11 ending stocks overlapped
with weak soybean crushing and a slowing world import
demand. Falling feed grain quotations and growing fears of
a global economic recession resulted in additional downward
pressure.
However, the slide in prices came to a halt in January
2012, when news of adverse weather threatening the South
American soybean crop and of prospective weak palm oil
production growth in Southeast Asia hit the market. The
concrete threat of a global oil and meal production shortfall
in 2011/12 triggered a rally in prices. By the end of March
2012, the FAO price index for oilseeds had risen 24 points,
or 13 percent compared to December 2011, with the indices
for oilmeals and oils following suit. Similarly, the CBOT
soybean futures contract for September had appreciated
steadily since the beginning of 2012 and, in early April,
crossed the USD 500 per tonne line.
With major crop failures in South America confirmed,
global production of oilcrops is bound to be insufficient
to satisfy the anticipated growth in demand for oils and
meals in 2011/12. As a result, both a sizeable drawdown in
global inventories and a sharp drop in global stock-to-use
ratios – exactly the reverse of the past two seasons – appear
inevitable, pointing to continued price firmness in the
oilseed complex. The possibility that in 2012/13 soybeans
will again face strong competition for cropland from maize
(notably in the United States) is lending additional support to
prices. Among the factors which are containing the upward
pressure on prices is the current ample availability of feed
wheat, which can be used to replace soymeal in feed rations.
9 Almost the entire volume of oilcrops harvested worldwide is crushed to obtain oils and fats for human nutrition or industrial purposes, and to obtain cakes and meals which are used as feed ingredients. Therefore, rather than referring to oilseeds, the analysis of the market situation is mainly undertaken in terms of oils/fats and cakes/meals. Hence, production data for oils (cakes) derived from oilseeds refer to the oil (cake) equivalent of the current production of the relevant oilseeds, i.e. they do not reflect the outcome of actual oilseed crushing. Furthermore, the data on trade in and stocks of oils (cakes) refer to the sum of trade in and stocks of oils and cakes plus the oil (cake) equivalent of oilseed trade and stocks.
10 For details on prices and corresponding indices, see appendix Table A24.
OILSEEDS
2011/12 production outlook strongly deterioratedThe global production forecast for 2011/12 has been
lowered substantially since the start of the season. Currently
estimated at 451 million tonnes, global output is set to drop
almost 4 percent from last season, marking a three-year
low. With total crop area estimated to expand at an about
average rate, this season’s production decrease is mostly due
to adverse weather affecting yields.
Figure 22. FAO monthly international price indices for oilseeds, oils/fats and meals/cakes (2002-2004=100)
50
100
150
200
250
300
20122011201020092008200720062005
Meals/cakes
Oils/fats
Oilseeds
Figure 23. CBOT soybean futures for September
250
350
450
550
USD per tonne
S O N D J F M A
2010 values 2011 values 2012 values

Market assessments
May 2012 33
Figure 26. FAO monthly price index for oils/fats (2002-2004=100)
150
200
250
300
2009/10
2011/12
2010/11
SAJJMAMFJDNO
Figure 25. FAO monthly price index for meals/cakes (2002-2004=100)
160
190
220
250
2011/12
2009/10
2010/11
SAJJMAMFJDNO
Figure 24. FAO monthly price index for oilseeds (2002-2004=100)
130
160
190
220
250
2011/12
2009/10
2010/11
SAJJMAMFJDNO
The hardest hit crop is soybean. Following the 8 percent
production drop in the United States, due to lower
plantings and poor yields, the latest estimates for South
America’s soy crop indicate a year-on-year fall of more than
14 percent. After the region’s three main producers, Brazil, Argentina and Paraguay increased the area planted to
soybeans, exceptionally dry weather caused by the La Niña
phenomenon decimated yields in some of the key growing
areas. In the three countries, crop losses are estimated at,
respectively, 13, 10 and 56 percent. Together, the Americas
are expected to produce 26 million tonnes or 11 percent
less soybeans than last season. China also experienced a
marked drop in its soy output – mainly a result of further
cuts in area. This leaves India as the only important soybean
producer reporting an increase in production. Overall, global
soy production is bound to decrease by almost 10 percent,
one of the steepest year-on-year falls on record. Global
production of rapeseed and groundnut also is expected to
fall, though these drops encroach much less on aggregate
output. In the case of rapeseed, production drops in the
EU and India are confirmed, whereas the estimates for
Canada and Australia have been significantly raised
compared to the initial forecasts. For the other oilcrops,
notably sunflowerseed and cottonseed, considerable year-
on-year improvements in global output are likely. Growth in
sunflowerseed production is concentrated in the EU and CIS
countries, while much of the rise in cottonseed is in Asia.
Table 10. World production of major oilseeds
2009/10 2010/11estim.
2011/12 f’cast
Change 2011/12
over 2010/11
%
million tonnes
Soybeans 259.7 265.3 240.0 -9.5
Rapeseed 61.4 60.9 60.6 -0.5
Cottonseed 40.4 43.5 46.6 7.1
Groundnuts (unshelled) 34.9 36.9 36.4 -1.6
Sunflower seed 32.8 33.2 38.0 14.5
Palm kernels 11.7 12.6 13.0 3.8
Copra 5.8 4.9 5.6 15.2
Total 446.3 457.3 440.2 - 3.7
Note: The split years bring together northern hemisphere annual crops harvested in the latter part of the first year shown, with southern hemisphere annual crops harvested in the early part of the second year shown. For tree crops, which are produced throughout the year, calendar year production for the second year shown is used.

Food Outlook
May 201234
Table 11. World oilseed and product marketat a glance
2009/10 2010/11 2011/12
Change: 2011/12
over 2010/11
estim. f'cast
million tonnes %
TOTAL OILSEEDS
Production 456.7 468.0 450.9 -3.7
OILS AND FATS1
Production 172.6 179.9 181.9 1.1
Supply2 196.4 208.8 212.5 1.8
Utilization3 168.7 176.7 185.3 4.9
Trade4 89.5 92.1 96.2 4.5
Stock-to-utilization ratio (%) 16.5 17.4 14.8
MEALS AND CAKES5
Production 114.1 117.8 110.7 -6.0
Supply2 128.2 136.9 131.9 -3.7
Utilization3 107.4 113.6 116.0 2.1
Trade4 67.2 69.9 70.5 0.9
Stock-to-utilization ratio (%) 17.8 18.7 13.2
FAO PRICE INDICES (Oct-Sep) (2002-2004=100) 2009/10 2010/11 2011/12
Change: 2011/12
over 2010/11
Oct-Apr %
Oilseeds 162 215 199 -7.0
Meals/cakes 215 221 196 -14.8
Oils/fats 174 256 236 -8.9
Note: Refer to footnote 9 in the text for further explanation regarding definitions and coverage.1 Includes oils and fats of vegetable, animal and marin origin.2 Production plus opening stocks.3 Residual of the balance.4 Trade data refer to exports based on a common October/September marketing season.5 All meal figures are expressed in protein equivalent; meals include all meals and cakes derived from oilcrops as well as meals of marine and animal origin.
OILS AND FATS 11
Below average growth confirmed for oils/fats supplies Current 2011/12 crop estimates translate into a well below
average 1 percent year-on-year increase in overall oils/
fats production. Despite the production rise anticipated
for sunflowerseed (a high oil-yielding crop), this season’s
decimated soybean crop will pull down total oil extracted
from annual oilcrops. However, perennial crops are
expected to compensate for this decrease, particularly palm
oil, production of which is forecast to expand by about
5 percent, largely thanks to further expansion in mature oil
11 This section refers to oils from all origins, which – in addition to products derived from the oil crops discussed under the section on oilseeds – include palm oil, marine oils as well as animal fats.
Figure 27. Global production and utilization of oils/fats
-6
-3
0
3
6
150
160
170
180
190
2011/122010/112009/102008/092007/08
Million tonnes Million tonnes
estim. f’cast
Balance (production minus utilization, right axis)
Production (left axis) Utilization (left axis)
palm area in Indonesia. In Malaysia, production growth is
expected to slow down strongly due to the tree’s biological
yield cycle and excessive rainfall experienced since December,
due to La Niña.
Global oils/fats supplies, which comprise 2011/12
production plus 2010/11 ending stocks, are forecast to
increase by 2–3 percent, owing to ample stock positions
at the beginning of this season. However, the anticipated
growth remains low in historic terms. World soyoil supplies
should actually fall by about 5 percent. With regard to key
producers, domestic availability of oils/fats is set to grow
in Indonesia, Malaysia and Canada. By contrast, modest
or no growth is expected in China and India, while a
significant drop in supplies is forecast for the United States,
Argentina and Brazil.
World consumption to continue expanding Global demand for oils/fats is expected to continue
expanding at an average rate of about 5 percent, reaching
185 million tonnes. Growth is expected to concentrate in
developing countries, in particular emerging economies,
where economic growth should keep driving up average
per capita consumption. In addition, further rising demand
from the biodiesel industry is expected to account for about
one-third of the projected increase in global consumption.
Growth continues to be driven by higher mandatory
blending rates and the creation of additional production
capacity in a number of countries.
As in past years, much of the increase in global demand
is expected to originate in Asia, with food and oleochemical
uses as main areas of growth and China and India as
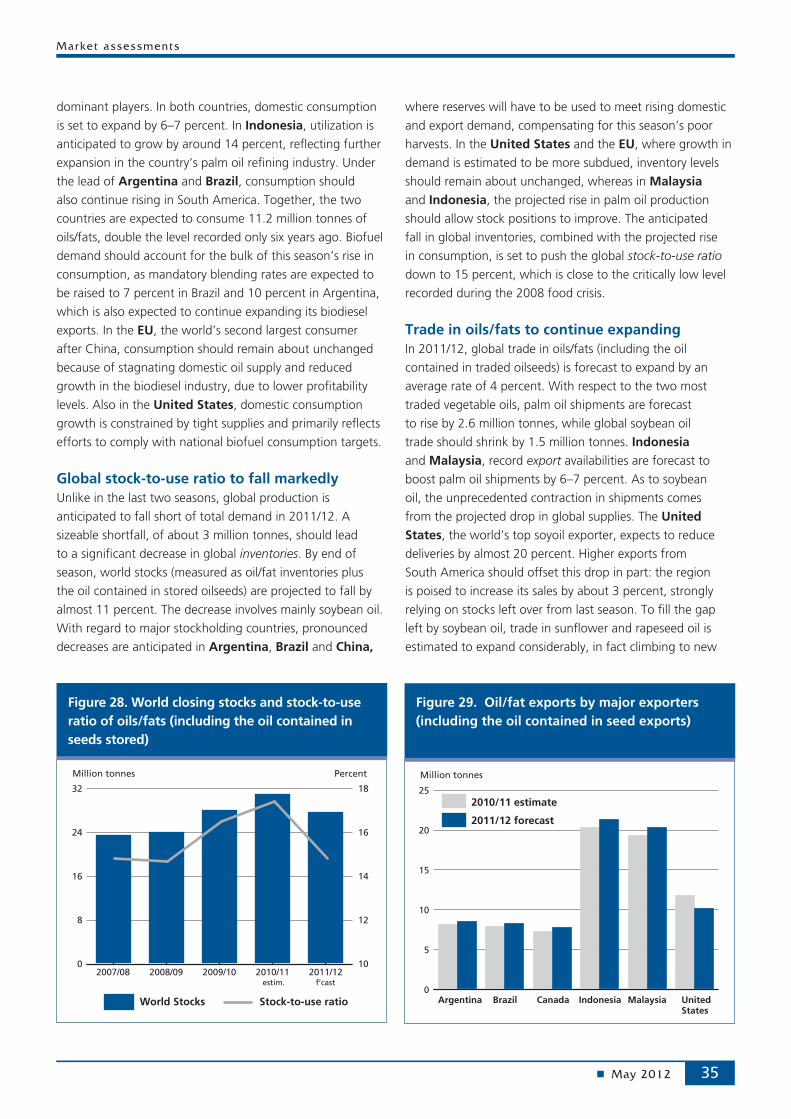
Market assessments
May 2012 35
Figure 28. World closing stocks and stock-to-use ratio of oils/fats (including the oil contained in seeds stored)
0
8
16
24
32
2011/122010/112009/102008/092007/0810
12
14
16
18
Million tonnes Percent
World Stocks Stock-to-use ratio
estim. f’cast
dominant players. In both countries, domestic consumption
is set to expand by 6–7 percent. In Indonesia, utilization is
anticipated to grow by around 14 percent, reflecting further
expansion in the country’s palm oil refining industry. Under
the lead of Argentina and Brazil, consumption should
also continue rising in South America. Together, the two
countries are expected to consume 11.2 million tonnes of
oils/fats, double the level recorded only six years ago. Biofuel
demand should account for the bulk of this season’s rise in
consumption, as mandatory blending rates are expected to
be raised to 7 percent in Brazil and 10 percent in Argentina,
which is also expected to continue expanding its biodiesel
exports. In the EU, the world’s second largest consumer
after China, consumption should remain about unchanged
because of stagnating domestic oil supply and reduced
growth in the biodiesel industry, due to lower profitability
levels. Also in the United States, domestic consumption
growth is constrained by tight supplies and primarily reflects
efforts to comply with national biofuel consumption targets.
Global stock-to-use ratio to fall markedly Unlike in the last two seasons, global production is
anticipated to fall short of total demand in 2011/12. A
sizeable shortfall, of about 3 million tonnes, should lead
to a significant decrease in global inventories. By end of
season, world stocks (measured as oil/fat inventories plus
the oil contained in stored oilseeds) are projected to fall by
almost 11 percent. The decrease involves mainly soybean oil.
With regard to major stockholding countries, pronounced
decreases are anticipated in Argentina, Brazil and China,
where reserves will have to be used to meet rising domestic
and export demand, compensating for this season’s poor
harvests. In the United States and the EU, where growth in
demand is estimated to be more subdued, inventory levels
should remain about unchanged, whereas in Malaysia
and Indonesia, the projected rise in palm oil production
should allow stock positions to improve. The anticipated
fall in global inventories, combined with the projected rise
in consumption, is set to push the global stock-to-use ratio
down to 15 percent, which is close to the critically low level
recorded during the 2008 food crisis.
Trade in oils/fats to continue expandingIn 2011/12, global trade in oils/fats (including the oil
contained in traded oilseeds) is forecast to expand by an
average rate of 4 percent. With respect to the two most
traded vegetable oils, palm oil shipments are forecast
to rise by 2.6 million tonnes, while global soybean oil
trade should shrink by 1.5 million tonnes. Indonesia
and Malaysia, record export availabilities are forecast to
boost palm oil shipments by 6–7 percent. As to soybean
oil, the unprecedented contraction in shipments comes
from the projected drop in global supplies. The United States, the world’s top soyoil exporter, expects to reduce
deliveries by almost 20 percent. Higher exports from
South America should offset this drop in part: the region
is poised to increase its sales by about 3 percent, strongly
relying on stocks left over from last season. To fill the gap
left by soybean oil, trade in sunflower and rapeseed oil is
estimated to expand considerably, in fact climbing to new
Figure 29. Oil/fat exports by major exporters (including the oil contained in seed exports)
0
5
10
15
20
252010/11 estimate
2011/12 forecast
Million tonnes
UnitedStates
IndonesiaCanada MalaysiaArgentina Brazil

Food Outlook
May 201236
records. Growth mainly involves CIS countries, Canada and
Australia, which all have had good crops. With regards
to the Russian Federation and Ukraine, the share of
domestic seed and oil output entering trade is set to
continue rising.
As to global imports, most of the anticipated growth
is expected to occur in Asia under the lead of China and
India. China’s purchases are projected to climb 8 percent to
over 21 million tonnes (including the oil contained in seed
imports). India could import a record 9.6 million tonnes,
marking a 10 percent year-on-year increase. Their strong
growth rates are both related to further population and
income growth, coupled with stagnating domestic oilcrop
production. Both nations continue to rely heavily on foreign
purchases to satisfy domestic demand. Other countries in
Asia with rising import requirements include Malaysia,
Pakistan and Turkey. In the EU, the world’s second largest
buyer, imports should remain about unchanged thanks to
this year’s record sunflowerseed harvest as well as sluggish
demand growth in the biodiesel industry and rising imports
of ready-made biodiesel.
MEALS AND CAKES 12
Pronounced drop in global meal supplies Based on the latest 2011/12 crop estimates, global meals/
cakes production should drop by an unprecedented 15.5
12 This section refers to meals from all origins. In addition to products derived from the oil crops discussed under the section on oilseeds, this also includes fish meal and meals of animal origin.
million tonnes compared to last season, mirroring this
season’s sharp decline in soybean production. Global
soymeal output is set to fall by no less than 9 percent
from last season’s record level, with higher sunflower
and cottonseed meal output providing only limited relief.
However, thanks to last season’s record soymeal closing
stocks, the fall in global meal supplies (comprising 2011/12
production and 2010/11 carry-out stocks) should be
contained at 3–4 percent. The decrease primarily concerns
the world’s leading soybean producers, in particular
the United States, followed by Brazil, Paraguay and
Argentina. Noticeable improvements are anticipated in
Canada, Australia, the Russian Federation and Ukraine,
thanks to good rape and sunflowerseed harvests, and in the
key cotton growing nations of Asia.
Meal consumption growth to slow down markedlyThe anticipated drop in supplies, which has started
to translate into higher prices, is expected to temper
consumption growth: year-on-year expansion may not reach
2 percent, compared to 5–6 percent in the last two seasons.
Commodity-wise, the contraction will mainly concern
soybean meal: consumption of the world’s leading oilmeal is
estimated to expand by about 3 million tonnes, as opposed
to 11 million tones last season. Likewise, combined demand
for other meals/cakes is expected to grow conspicuously less
than in the past. Overall growth will likely be confined to
developing countries. Their share in total utilization should
reach 60 percent. Asia continues to play the lead role, with
further livestock sector expansion fuelling growth. Although
Figure 31. Global production and utilization of meals/cakes (in protein equivalent)
-8
-4
0
4
8
85
95
105
115
125
2011/122010/112009/102008/092007/08
Million tonnes Million tonnes
estim. f’cast
Balance (production minus utilization, right axis)
Production (left axis) Utilization (left axis)
Figure 30. Total oil/fat imports by region or major country (including the oil contained in seed imports)
0
10
20
30
40
2011/122009/102007/082005/062003/04
Latin America
Asia excl. China (total) Europe
China (total)
Million tonnes
United States & Canada Africa
f’cast
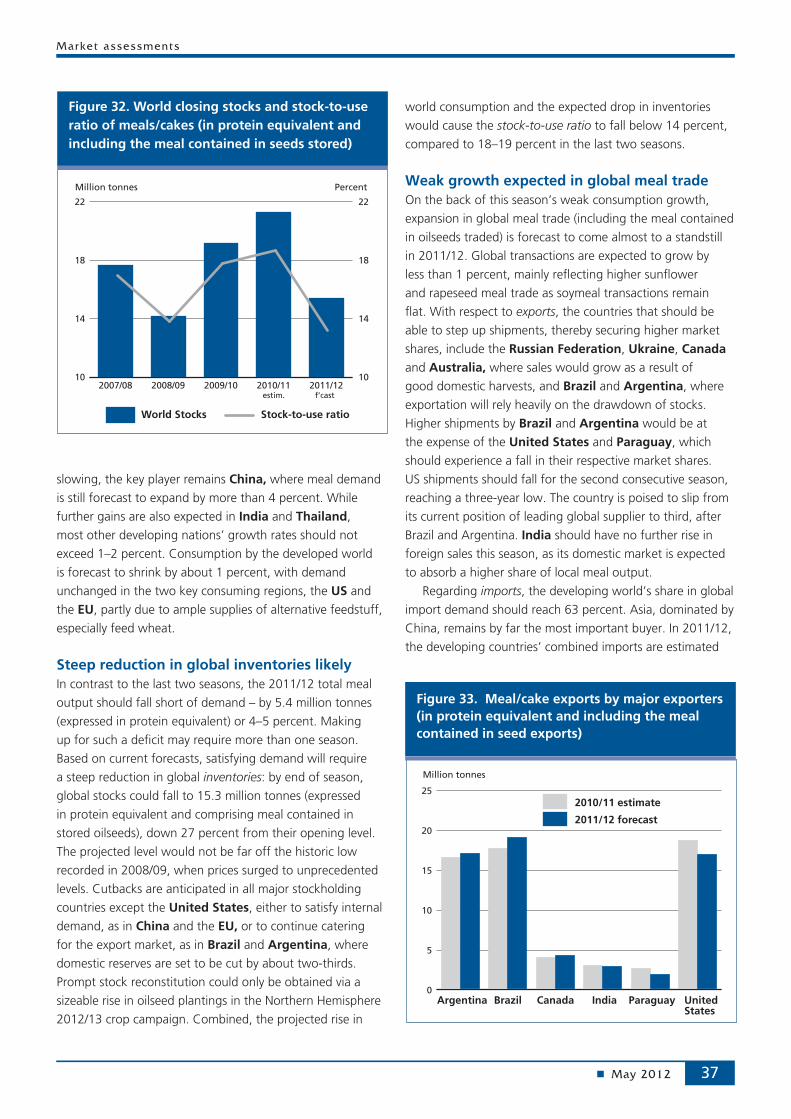
Market assessments
May 2012 37
Figure 32. World closing stocks and stock-to-use ratio of meals/cakes (in protein equivalent and including the meal contained in seeds stored)
10
14
18
22
2011/122010/112009/102008/092007/0810
14
18
22
Million tonnes Percent
World Stocks Stock-to-use ratio
estim. f’cast
slowing, the key player remains China, where meal demand
is still forecast to expand by more than 4 percent. While
further gains are also expected in India and Thailand,
most other developing nations’ growth rates should not
exceed 1–2 percent. Consumption by the developed world
is forecast to shrink by about 1 percent, with demand
unchanged in the two key consuming regions, the US and
the EU, partly due to ample supplies of alternative feedstuff,
especially feed wheat.
Steep reduction in global inventories likely In contrast to the last two seasons, the 2011/12 total meal
output should fall short of demand – by 5.4 million tonnes
(expressed in protein equivalent) or 4–5 percent. Making
up for such a deficit may require more than one season.
Based on current forecasts, satisfying demand will require
a steep reduction in global inventories: by end of season,
global stocks could fall to 15.3 million tonnes (expressed
in protein equivalent and comprising meal contained in
stored oilseeds), down 27 percent from their opening level.
The projected level would not be far off the historic low
recorded in 2008/09, when prices surged to unprecedented
levels. Cutbacks are anticipated in all major stockholding
countries except the United States, either to satisfy internal
demand, as in China and the EU, or to continue catering
for the export market, as in Brazil and Argentina, where
domestic reserves are set to be cut by about two-thirds.
Prompt stock reconstitution could only be obtained via a
sizeable rise in oilseed plantings in the Northern Hemisphere
2012/13 crop campaign. Combined, the projected rise in
world consumption and the expected drop in inventories
would cause the stock-to-use ratio to fall below 14 percent,
compared to 18–19 percent in the last two seasons.
Weak growth expected in global meal trade On the back of this season’s weak consumption growth,
expansion in global meal trade (including the meal contained
in oilseeds traded) is forecast to come almost to a standstill
in 2011/12. Global transactions are expected to grow by
less than 1 percent, mainly reflecting higher sunflower
and rapeseed meal trade as soymeal transactions remain
flat. With respect to exports, the countries that should be
able to step up shipments, thereby securing higher market
shares, include the Russian Federation, Ukraine, Canada
and Australia, where sales would grow as a result of
good domestic harvests, and Brazil and Argentina, where
exportation will rely heavily on the drawdown of stocks.
Higher shipments by Brazil and Argentina would be at
the expense of the United States and Paraguay, which
should experience a fall in their respective market shares.
US shipments should fall for the second consecutive season,
reaching a three-year low. The country is poised to slip from
its current position of leading global supplier to third, after
Brazil and Argentina. India should have no further rise in
foreign sales this season, as its domestic market is expected
to absorb a higher share of local meal output.
Regarding imports, the developing world’s share in global
import demand should reach 63 percent. Asia, dominated by
China, remains by far the most important buyer. In 2011/12,
the developing countries’ combined imports are estimated
Figure 33. Meal/cake exports by major exporters (in protein equivalent and including the meal contained in seed exports)
0
5
10
15
20
252010/11 estimate
2011/12 forecast
Million tonnes
UnitedStates
Canada India ParaguayArgentina Brazil

Food Outlook
May 201238
to exceed 100 million tonnes (including the meal contained
in oilseeds traded), which is double the level recorded ten
years ago. However, compared to past seasons, the firmness
in international prices in recent months could reduce the
developing world’s appetite for imported oilmeals (and
oilseeds). The projected import growth represents the lowest
expansion in years. China remains the world’s main source
of import growth, reflecting further rising domestic demand
for livestock products and additional growth in the country’s
import-oriented crushing industry. Developed country
imports may decrease slightly, levelling off at around 60
million tonnes. For the EU, which is the key player, available
domestic supplies should be sufficient to meet subdued meal
demand.
2012/13 OILSEED PRODUCTION OUTLOOK
With the 2011/12 season still on-going, it is too early to
provide supply and demand projections for oilseeds in
2012/13. The only area where some preliminary, though
incomplete, information can be offered concerns planting
intentions in the Northern Hemisphere, where preparations
for the next oilcrop campaign are underway.
In principle, the current season’s tight supply-and-
demand situation and historically high international prices
in the oilseed complex throughout 2011/12 should act as
an incentive for 2012/13 oilseed plantings. However, similar
to last year, renewed competition for land between oilcrops
and grains could affect plantings.
This applies in particular to soybeans in the United States where, based on expected relative returns from maize
and soybeans, soybean plantings are tentatively estimated
to fall 1.4 percent compared to last year – almost 5 percent
below the 2009/10 record acreage. Assuming an average
yield level, 2012/13 soybean production could remain close
to the below-average output recorded for 2011/12. In
China, based on unofficial reports about planting intentions,
a further significant decrease in production is possible, while
India’s crop could remain close to last year’s record level.
These assumptions suggest that any improvement in global
soybean supplies in 2012/13 would very much depend on
the size of South America’s 2013 soybean crop. Besides a
return to normal weather, a conspicuous increase in Brazil’s
and Argentina’s soy acreage would be required to achieve
the kind of output rise required for a relaxation in the global
supply and demand picture.
With regard to rapeseed, a modest increase in production
in northern hemisphere producing countries (which account
for the bulk of global output) seems possible. This, however
would only allow for a partial recovery from the reductions
recorded over the current and last season. Although Canada
is projecting a record output, the EU’s crop once again
appears to be threatened by unfavourable weather. For
cottonseed, Northern Hemisphere production could drop
from this season’s record level as both the United States
and China may see a reduction in plantings. Finally, a repeat
of this season’s above average sunflowerseed output could
be achieved assuming a further expansion in plantings in CIS countries.
Figure 34. Meal/cake imports by region or major country (in protein equivalent and including the meal contained in seed imports)
0
5
10
15
20
25
2011/122009/102007/082005/062003/04
Latin America Asia excl. China (total) Europe
China (total)
Million tonnes
United States & Canada Africa
f’cast

Market assessments
May 2012 39
Tab
le 1
2. M
ajo
r O
ilsee
d P
olic
y D
evel
op
men
ts: O
cto
ber
201
1 to
Mar
ch 2
012
Co
un
try
Pro
du
ctD
ate
Polic
y D
om
ain
Des
crip
tio
n
Arg
enti
na
Ara
ble
cro
ps
Jan
-12
Lan
d r
igh
tsIn
tro
du
ced
new
lim
its
on
fo
reig
n o
wn
ersh
ip o
f la
nd
.
Ban
gla
des
hC
oo
kin
g o
ilFe
b-1
2Pr
ice
con
tro
lEx
ten
ded
ret
ail p
rice
co
ntr
ol m
easu
res,
to
sh
ield
co
nsu
mer
s fr
om
su
rges
in in
tern
atio
nal
pri
ces.
Bel
aru
sR
apes
eed
, ra
pes
eed
oil
Dec
-11
Exp
ort
po
licy
Ban
ned
exp
ort
s o
f ra
pes
eed
an
d r
apes
eed
oil
tem
po
rari
ly, t
o p
reve
nt
do
mes
tic
veg
etab
le o
il sh
ort
age.
Bh
uta
nV
eget
able
oils
Dec
-11
Imp
ort
po
licy
Secu
red
veg
etab
le o
il im
po
rts
fro
m In
dia
un
der
go
v-to
-go
v d
eal.
Bra
zil
Soyb
ean
sD
ec-1
1En
viro
nm
enta
l po
licy
Exte
nd
ed v
olu
nta
ry m
ora
tori
um
on
tra
din
g a
nd
fin
anci
ng
of
soyb
ean
s g
row
n o
n la
nd
ille
gal
y cl
eare
d in
th
e A
maz
on
reg
ion
un
til J
anau
ry 2
013.
Soyb
ean
oil
Dec
-11
Soci
al p
olic
yD
isco
nti
nu
ed s
oci
al t
ax r
ebat
e ap
ply
ing
to
so
yoil
and
mea
l des
tin
ed f
or
exp
ort
s.
Oils
eed
s an
d
gra
ins
Mar
-12
Tran
spo
rtat
ion
/exp
ort
p
olic
y Su
pp
ort
ed d
evel
op
men
t o
f n
ew m
ajo
r g
rain
s p
ort
in A
maz
on
Reg
ion
.
Can
ada
Cam
elin
a &
sa
fflo
wer
see
dD
ec-1
1En
viro
nm
enta
l po
licy
Gra
nte
d p
ub
lic f
un
din
g t
o a
dva
nce
su
stai
nab
le p
rod
uct
ion
of
new
oils
fo
r in
du
stri
al a
pp
licat
ion
s o
ther
th
an f
uel
.
Veg
etab
le o
ilsM
ar-1
2Pu
blic
hea
lth
po
licy
Au
tho
rize
d h
ealt
h c
laim
s ec
ou
rag
ing
th
e u
se o
f p
oly
/mo
no
-un
satu
rate
d f
at o
n f
oo
d p
rod
uct
lab
els.
Ch
ina
Soyb
ean
sSe
pt
to N
ov
2011
Stat
e re
serv
esR
elea
sed
sta
te r
eser
ves
in a
n e
ffo
rt t
o c
hec
k ri
se in
do
mes
tic
oil/
mea
l pri
ces.
Soyb
ean
sD
ec-1
1Fo
reig
n a
gri
cult
ura
l in
vest
men
t A
pp
rove
d in
vest
men
t b
y st
ate-
ow
ned
gra
in c
om
pan
y in
to c
rush
ing
fac
iliti
es in
Bra
zil.
Rap
esee
dJa
n-1
2St
ate
rese
rves
Rec
on
stit
ute
d s
tate
res
erve
s fo
r fu
ture
mar
ket
inte
rven
tio
ns
and
to
su
pp
ort
do
mes
tic
farm
gat
e p
rice
s.
Oilm
eals
Jan
-12
Imp
ort
po
licy
Susp
end
ed o
ilmea
l im
po
rts
fro
m In
dia
, bas
ed o
n d
etec
tio
n o
f h
azar
do
us
sub
stan
ces
in
rap
esee
dm
eal c
on
sig
nm
ents
.
Oliv
e o
ilFe
b-1
2Im
po
rt p
olic
ySu
spen
ded
imp
ort
s o
f o
ilve
oil
fro
m It
aly
to v
erif
y la
bel
ling
pra
ctic
es.
Oils
eed
s an
d
gra
ins
2012
to
201
5M
arke
t p
olic
ies
An
no
un
ced
pro
gra
mm
e to
fo
ster
th
e u
se o
f fu
ture
s m
arke
ts.
Rap
esee
dM
ar-1
2Im
po
rt p
olic
yR
elax
ed b
an o
n r
apes
eed
imp
ort
s fr
om
Can
ada
furt
her
.
Euro
pea
n U
nio
n
Bio
fuel
sO
ct-1
1R
enew
able
en
erg
y p
olic
yPo
stp
on
ed f
urt
her
th
e re
leas
e o
f g
uid
elin
es o
n t
he
imp
act
of
lan
d u
se c
han
ges
(IL
UC
) o
n c
arb
on
sa
vin
gs
in b
iofu
el u
tiliz
atio
n.
Sun
flo
wer
seed
Dec
-11
Imp
ort
po
licy
Lau
nch
ed n
ew B
ilate
ral T
rad
e A
gre
emen
t w
ith
Ukr
ain
e, a
llow
ing
Ukr
ain
e to
mai
nta
in e
xpo
rt t
ax
aim
ed a
t p
rote
ctin
g d
om
esti
c in
du
stry
.
Bio
die
sel
Jan
-12
Ren
ewab
le e
ner
gy
po
licy
Ad
mis
sio
n, b
y G
erm
any,
of
bio
die
sel p
rod
uce
d f
rom
use
d c
oo
kin
g o
il fo
r d
ou
ble
co
un
tin
g w
ith
in
the
EU’s
bio
ener
gy
con
sum
pti
on
tar
get
s.
Soyb
ean
sJa
n-1
2G
MO
po
licie
s an
d
reg
ula
tio
ns
Ap
pro
val s
et b
y Eu
rop
ean
Co
mm
issi
on
fo
r fo
ur
new
GM
so
y va
riet
ies
for
imp
ort
atio
n a
nd
p
roce
ssin
g, t
ho
ug
h n
ot
for
cult
ivat
ion
.

Food Outlook
May 201240
Co
un
try
Pro
du
ctD
ate
Polic
y D
om
ain
Des
crip
tio
n
Ind
ia
Rap
esee
dD
ec-1
1Fa
rm s
up
po
rt p
rice
sR
aise
d s
up
po
rt p
rice
fo
r ra
pes
eed
to
fo
ster
nat
ion
al o
ilsee
d p
rod
uct
ion
.
Palm
oil
Dec
-11
Imp
ort
po
licy
Rev
iew
un
der
way
of
po
licy
mea
sure
s to
pre
serv
e cr
ud
e p
alm
oil
imp
ort
s fr
om
Ind
on
esia
(fo
llow
ing
In
do
nes
ia's
Oct
-11
exp
ort
tax
ad
just
men
t).
Veg
etab
le o
ilsD
ec-1
1Ex
po
rt p
olic
yEx
emp
ted
Bh
uta
n f
rom
Ind
ian
exp
ort
ban
on
ed
ible
oils
un
der
go
v-to
-go
v d
eal.
Co
pra
Mar
-12
Farm
su
pp
ort
pri
ces
Rai
sed
su
pp
ort
pri
ce f
or
mill
ing
an
d b
all c
op
ra f
or
cale
nd
ar y
ear
2012
.
Ind
on
esia
Soyb
ean
sO
ct-1
1 o
nw
ard
Exp
ort
po
licy
Mai
nta
ined
slid
ing
exp
ort
tax
reg
ime
to e
nsu
re a
deq
uat
e d
om
esti
c su
pp
lies
and
pre
ven
t h
ikes
in
con
sum
er p
rice
s.
Bio
die
sel
Jan
to
Dec
201
2R
enew
able
en
erg
y p
olic
yR
aise
d t
he
sub
sid
y f
or
bio
die
sel m
anu
fact
ure
rs.
Palm
oil
Jan
-12
Imp
ort
po
licy
Rei
nst
ated
imp
ort
tax
on
so
ybea
ns,
so
ybea
n fl
ou
r an
d c
erta
in o
ilmea
ls t
o 5
%.
Palm
oil
Jan
-12
Exp
ort
po
licy
Ente
red
into
fo
rce
Free
Tra
de
Ag
reem
ent
wit
h P
akis
tan
, in
clu
din
g r
edu
ctio
n o
f Pa
kist
ani i
mp
ort
du
ty
on
pal
m o
il fr
om
Ind
on
esia
.
Jord
anO
live
oil
Dec
-11
Mar
ket
sup
po
rtC
on
tin
ued
go
vern
men
t p
rocu
rem
ent
of
oilv
e o
il in
an
eff
ort
to
ass
ist
farm
ers.
Kaz
akh
asta
nV
eget
able
oils
Sep
t 11
to
Jan
12
Exp
ort
po
licy
Ban
ned
veg
etab
le o
il ex
po
rts
tem
po
rari
ly t
o p
reve
nt
do
mes
tic
sho
rtag
es.
Mal
aysi
a
Bio
die
sel
Dec
-11
Ren
ewab
le e
ner
gy
po
licy
Imp
lem
ente
d m
and
ato
ry s
ale
of
pal
m o
il-b
ased
bio
die
sel (
B5)
in p
arts
of
the
cou
ntr
y.
Palm
oil
Jan
-12
Envi
ron
men
tal p
olic
ySe
t u
p In
tern
atio
nal
Oil
Palm
Bio
mas
s C
entr
e in
su
pp
ort
of
pri
vate
eff
ort
s in
th
e ar
eas
of
sust
ain
able
cu
ltiv
atio
n/p
roce
ssin
g p
ract
ices
an
d b
io-r
enew
able
pro
du
ct d
evel
op
men
t.
Paki
stan
Palm
oil
Jan
-12
Imp
ort
po
licy
Ente
red
int
forc
e a
Free
Tra
de
Ag
reem
ent
wit
h In
do
nes
ia, i
ncl
ud
ing
tar
iff
con
cess
ion
s o
n p
alm
oil
imp
ort
s fr
om
Ind
on
esia
.
Para
gu
aySo
ybea
ns
Feb
-12
Emer
gen
cy r
elie
fPu
t sp
ecia
l dro
ug
ht-
relie
f m
easu
res
in p
lace
fo
r fa
rmer
s an
d r
ura
l co
mm
un
itie
s.
Phili
pp
ines
Co
con
ut
Jan
to
Dec
12
Sect
or
dev
elo
pm
ent
assi
stan
ceSt
ren
gth
ened
go
vern
men
t p
rog
ram
mes
in s
up
po
rt o
f co
con
ut
rep
lan
tin
g.
Ru
ssia
n F
eder
atio
nSu
nfl
ow
erse
ed20
12 t
o 2
015
Exp
ort
po
licy
Red
uce
d s
un
flo
wer
seed
exp
ort
tax
ove
r 4
year
s u
nd
er W
TO a
cces
sio
n a
gre
emen
t.
Thai
lan
dPa
lm o
ilJa
n-1
2R
enew
able
en
erg
y p
olic
yA
do
pte
d n
atio
nal
cer
tifi
cati
on
sch
eme
for
sust
ain
able
pal
m o
il an
d r
ead
ied
it f
or
imp
lem
enta
tio
n.
Ukr
ain
eSu
nfl
ow
erse
edD
ec-1
1Ex
po
rt p
olic
yEn
acte
d n
ew B
ilate
ral T
rad
e A
gre
emen
t w
ith
th
e Eu
rop
ean
Un
ion
th
at a
llow
s U
krai
ne
to m
ain
tain
ex
po
rt t
ax a
imed
at
pro
tect
ing
do
mes
tic
seed
pro
cess
ors
an
d o
il ex
po
rter
s.
Un
ited
Sta
tes
Bio
fuel
Dec
-11
Ren
ewab
le e
ner
gy
po
licy
Gra
nte
d p
ub
lic f
un
din
g t
o s
up
po
rt p
rod
uct
ion
an
d p
rod
uct
dev
elo
pm
ent
effo
rts
of
bio
fuel
ind
ust
ry.
Gra
ins
and
o
ilsee
ds
Dec
-11
Mar
ket
reg
ula
tio
nR
estr
icte
d v
olu
me
of
futu
re c
on
trac
ts t
hat
are
tra
ded
by
fin
anci
al in
vest
ors
.
Bio
die
sel
Dec
-11
Ren
ewab
le e
ner
gy
po
licy
Let
bio
die
sel t
ax c
red
it e
xpir
e w
ith
ou
t re
new
al.
Bio
fuel
Jan
-12
Ren
ewab
le e
ner
gy
po
licy
Rev
ised
up
war
d t
he
offi
cial
tar
get
vo
lum
es a
nd
per
cen
tag
e st
and
ard
s fo
r re
new
able
fu
els
in 2
012.
Palm
oil
Jan
-12
Ren
ewab
le e
ner
gy
po
licy
Det
erm
ined
th
at p
alm
oil-
bas
ed b
iod
iese
l do
es n
ot
qu
alif
y as
ren
ewab
le f
uel
un
der
US
bio
ener
gy
po
licy
du
e to
insu
ffici
ent
red
uct
ion
in G
HG
em
issi
on
s.
Uzb
ekis
tan
Veg
etab
le o
ilsJa
n-1
2Im
po
rt p
olic
yR
aise
d e
xcis
e d
uty
on
ed
ible
oil
imp
ort
s.
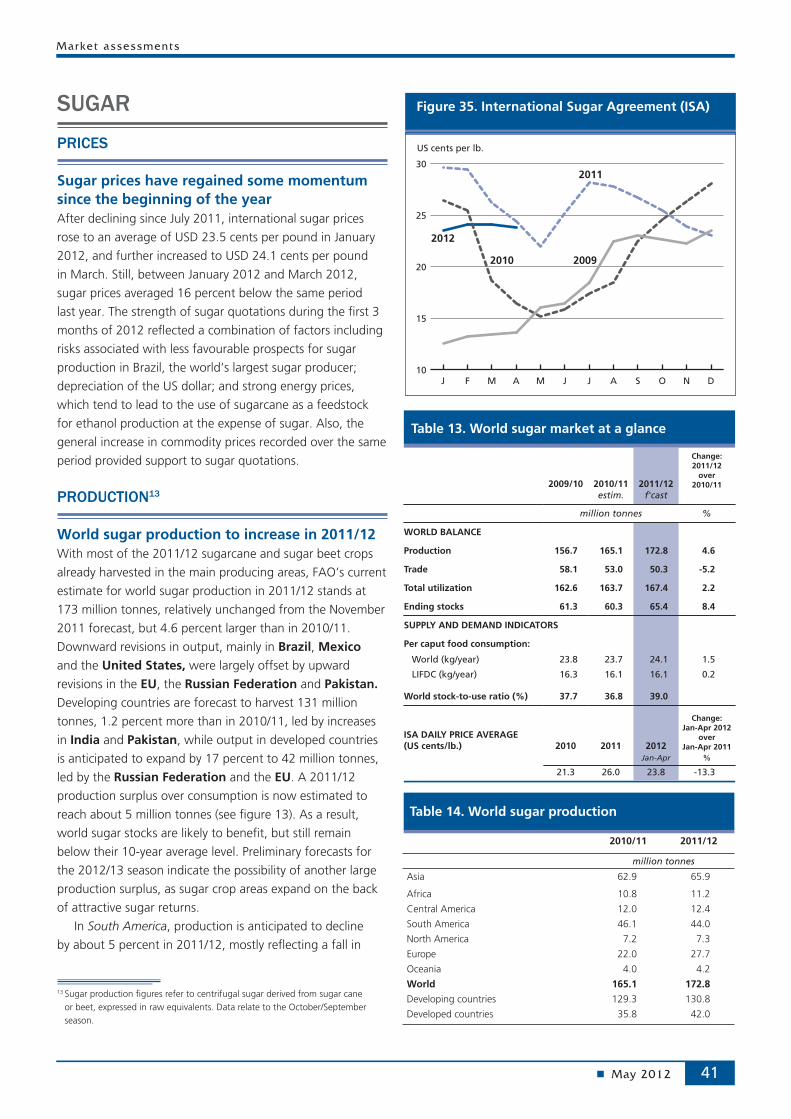
Market assessments
May 2012 41
Figure 35. International Sugar Agreement (ISA)
10
15
20
25
30
2012
20092010
2011
US cents per lb.
DNOSAJJMAMFJ
Table 14. World sugar production
2010/11 2011/12
million tonnes
Asia 62.9 65.9
Africa 10.8 11.2
Central America 12.0 12.4
South America 46.1 44.0
North America 7.2 7.3
Europe 22.0 27.7
Oceania 4.0 4.2
World 165.1 172.8
Developing countries 129.3 130.8
Developed countries 35.8 42.0
Table 13. World sugar market at a glance
2009/10 2010/11 2011/12
Change: 2011/12
over 2010/11
estim. f'cast
million tonnes %
WORLD BALANCE
Production 156.7 165.1 172.8 4.6
Trade 58.1 53.0 50.3 -5.2
Total utilization 162.6 163.7 167.4 2.2
Ending stocks 61.3 60.3 65.4 8.4
SUPPLY AND DEMAND INDICATORS
Per caput food consumption:
World (kg/year) 23.8 23.7 24.1 1.5
LIFDC (kg/year) 16.3 16.1 16.1 0.2
World stock-to-use ratio (%) 37.7 36.8 39.0
ISA DAILY PRICE AVERAGE (US cents/lb.) 2010 2011 2012
Change: Jan-Apr 2012
over Jan-Apr 2011
Jan-Apr %
21.3 26.0 23.8 -13.3
SUGAR
PRICES
Sugar prices have regained some momentum since the beginning of the yearAfter declining since July 2011, international sugar prices
rose to an average of USD 23.5 cents per pound in January
2012, and further increased to USD 24.1 cents per pound
in March. Still, between January 2012 and March 2012,
sugar prices averaged 16 percent below the same period
last year. The strength of sugar quotations during the first 3
months of 2012 reflected a combination of factors including
risks associated with less favourable prospects for sugar
production in Brazil, the world’s largest sugar producer;
depreciation of the US dollar; and strong energy prices,
which tend to lead to the use of sugarcane as a feedstock
for ethanol production at the expense of sugar. Also, the
general increase in commodity prices recorded over the same
period provided support to sugar quotations.
PRODUCTION13
World sugar production to increase in 2011/12With most of the 2011/12 sugarcane and sugar beet crops
already harvested in the main producing areas, FAO’s current
estimate for world sugar production in 2011/12 stands at
173 million tonnes, relatively unchanged from the November
2011 forecast, but 4.6 percent larger than in 2010/11.
Downward revisions in output, mainly in Brazil, Mexico
and the United States, were largely offset by upward
revisions in the EU, the Russian Federation and Pakistan. Developing countries are forecast to harvest 131 million
tonnes, 1.2 percent more than in 2010/11, led by increases
in India and Pakistan, while output in developed countries
is anticipated to expand by 17 percent to 42 million tonnes,
led by the Russian Federation and the EU. A 2011/12
production surplus over consumption is now estimated to
reach about 5 million tonnes (see figure 13). As a result,
world sugar stocks are likely to benefit, but still remain
below their 10-year average level. Preliminary forecasts for
the 2012/13 season indicate the possibility of another large
production surplus, as sugar crop areas expand on the back
of attractive sugar returns.
In South America, production is anticipated to decline
by about 5 percent in 2011/12, mostly reflecting a fall in
13 Sugar production figures refer to centrifugal sugar derived from sugar cane or beet, expressed in raw equivalents. Data relate to the October/September season.

Food Outlook
May 201242
Brazil. The decrease in output is attributed to generally
unfavourable growing and harvesting conditions, but also
to a reduction in the rate of new plantings. Sugarcane fields
are generally renewed every 5 years in Brazil to maintain
high yields. However, reported financial difficulties faced
by millers and cane growers have slowed the rate of field
renewals. Estimates indicate total sugarcane production
will drop by 10 percent from the previous season, with an
estimated 49 percent of the total sugarcane harvest allocated
for the production of sugar. This is up from 46 percent in
2010/11, mainly because the processing of cane into sugar
yields higher margins than those realized from converting
cane into ethanol. Sugar production is expected to expand
in Colombia, the second largest producer in the region, and
to remain relatively unchanged in Argentina, where frost
hampered cane production. In Central America, preliminary
forecasts indicate production in Mexico will decline from
2010/11, but high sugar prices could encourage producers
to expand areas for the next season. In Guatemala, higher
than expected sugarcane yields should boost production,
while a series of policy measures, including higher cane
prices, are set to boost output in Cuba.
In Africa, sugar production is projected to rise on the
back of largely favourable weather conditions. Ethiopia,
Mozambique and Sudan are set to harvest greater crops
than in 2010/11, while a slight growth is expected in Egypt. In South Africa, the largest producer in the region, the
effects of the 2010 drought impacted cane yields and output
will remain unchanged.
In Asia, sugar output is expected to rise over the 2011/12
marketing season, driven by strong growth in India. Record
sugarcane prices in 2009 encouraged farmers in the country
to plant additional area to sugarcane and boost input use.
India’s sugar market deals with a longstanding situation
in which its sugar production is cyclical – it has 2–3 years
of surplus followed by 2–3 years of deficit. In recent years,
the cycle has been more pronounced, with larger swings in
production and trade. These cycles result from a disconnect
between administered cane prices and market-driven
sugar prices, which leads to an accumulation of arrears by
mills. In a move to address this issue, the government has
introduced corrective measures, such as changing the release
mechanism of non-levy quota from a monthly to a quarterly
basis. Latest estimates indicate that 2011/12 sugar output in
Thailand, the world’s second largest sugar exporter, will be
slightly higher than the all-time high recorded the previous
season, with better than expected yields due to favourable
weather conditions. Despite an expansion in area, a decrease
in production is expected in China for 2011/12 as a result
of heavy rains in Guangxi, China’s largest sugar producing
region, and drought in Yunnan, its second largest producing
province. Financial assistance as well as the subsidized inputs
sugar mills provided to farmers were major contributing
factors to boost plantings. In Pakistan, estimates for sugar
production in 2011/12 point to an increase, following last’s
year favourable monsoon rains. Output in 2011/12 is set to
increase in Indonesia, Vietnam and Japan, and to remain
stagnant in Turkey.
In Europe, the latest estimates for the EU indicate strong
gains in sugar production, largely due to an expansion in
beet area and improvements in yields at both farm and mill
levels. Production under quota remains set at 14 million
tonnes, hence leaving 4 million tonnes of out-of-quota
sugar production. Similarly, propelled by a significant surge
Figure 36. Sugar production by major producing countries
0
15
30
45
2010/11 estimate
2011/12 forecast
Million tonnes
USAMexicoIndia BrazilChina Thailand EU
Figure 37. World sugar surplus/deficit
-10
0
10
20
201120092007200520032001-15
0
15
30
Million tonnes US cents per lb.
Surplus/Deficit ISA price
f’cast

Market assessments
May 2012 43
Figure 38. Stocks held by the five major sugar exporters and stock-to-disappearance ratio
0
10
20
30
40
2011/122010/112009/102008/092007/082006/0780
85
90
95
100
Million tonnes Percent
World Stocks Stock-to-disappearance ratio
f’castestim.
in the beet area, sugar output is expected to expand in the
Russian Federation, in contrast with last year when severe
drought negatively impacted crop development. Gains are
also anticipated in Ukraine, helped by favourable weather.
In Australia, sugar production is set to rise by 5 percent,
spurred by high domestic prices over the past three years
which led to a sharp increase in sugarcane area. In the rest
of the world, production in the United States is forecast
to surpass slightly its 2010/11 level, with falling beet sugar
production expected to be offset by expanding cane sugar
output.
UTILIZATION
World sugar consumption to return to long-term trend According to latest FAO estimates, global sugar consumption
is anticipated to reach 167.4 million tonnes in 2011/12,
which is 3.7 million tonnes, or 2.2 percent more than in
2010/11. Increased supply availability and lower prices are
expected to support larger sugar intake than in the previous
season. In 2009/10 and 2010/11, high domestic sugar
prices curtailed demand in virtually all regions. In China, for
example, they prompted several food producers to substitute
starch sweeteners for sugar. Elsewhere, governments
implemented measures to curb sugar price inflation. These
steps included sugar stock releases (China, India), retail price
controls and cuts in import tariffs (Pakistan, Bangladesh).
Under current prospects, world per capita sugar
consumption will remain steady at 23.8 kg in 2011/12.
Aggregate sugar utilization in developing countries is set to
expand by 2.4 million tonnes to 118 million tonnes, or 70.4
percent of global consumption. In the generally more mature
markets of developed countries, consumption is to increase
by 1.3 million tonnes. However, a slowdown of global
economic growth in 2012 could undermine prospects for
demand expansion, as manufacturing and food preparation
sectors, which account for the bulk of aggregate sugar
consumption, are particularly sensitive to income changes.
TRADE
World trade to contract as import demand weakensLatest FAO estimates of world sugar imports for 2011/12
(October/September) stand at 49 million tonnes, 5 percent
less than in the previous season. This reflects an expected
decline in imports by major traditional importing countries,
where large crops are set to depress purchases. Propelled
by rising population and per capita income, Asia’s import
growth is likely to remain steady. Purchases by China
are expected to augment, sustained by strong domestic
demand and the need to replenish state reserves, after large
quantities were released in 2010/11 to contain domestic
sugar prices. Shipments into Indonesia are also expected
to increase – in part to fulfil recent expansions in its refining
capacity. In Europe, shipments to the EU are forecast to
fall due to higher domestic production. Since the launching
of various reforms to the sugar sub-sector in 2006, the
EU has turned from being a net sugar exporter to one of
the world’s largest net sugar importers. Deliveries to the
Russian Federation, once the world’s largest importer of
sugar, are expected to fall significantly as a result of large
domestic availabilities. In the rest of the world, purchases
by the United States are forecast to remain similar to the
previous season, including 1.4 million tonnes shipped under
TRQ. Additional imports may be needed in the course of
the season to rebuild reserves. Total imports by countries
in Africa are expected to decline, as improving domestic
supplies displace imports.
World trade is expected to decline in 2011/12, reflecting
lower output in Brazil, the world’s largest exporter, and large
production in traditional importing countries. In addition,
the need to rebuild stocks may restrain exports. Brazil is now expected to ship about 23 million tonnes, down 15.8
percent from 2010/2011, due to lower supply availability,
with the Russian Federation its main destination market.
On the other hand, sales from Thailand, the world’s second
largest sugar exporter, are expected to expand, spurred
by adequate supply from both production and stocks.
The bulk of the sugar will be shipped to neighbouring
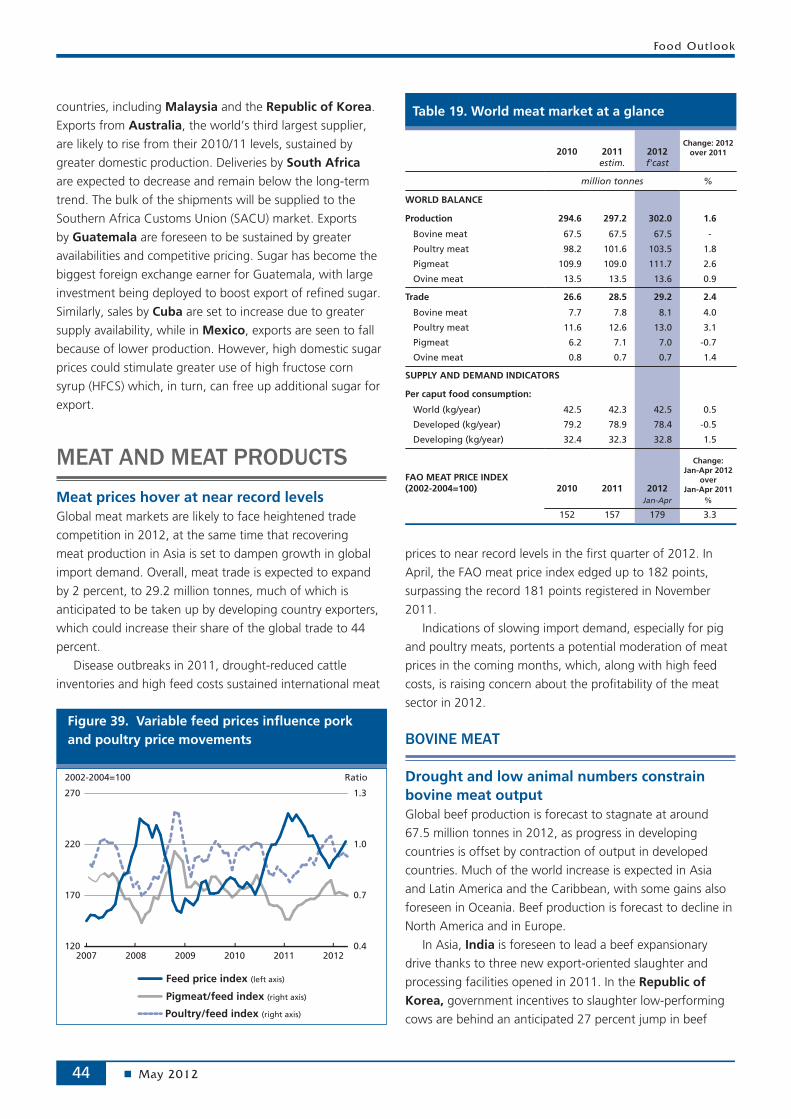
Food Outlook
May 201244
countries, including Malaysia and the Republic of Korea.
Exports from Australia, the world’s third largest supplier,
are likely to rise from their 2010/11 levels, sustained by
greater domestic production. Deliveries by South Africa
are expected to decrease and remain below the long-term
trend. The bulk of the shipments will be supplied to the
Southern Africa Customs Union (SACU) market. Exports
by Guatemala are foreseen to be sustained by greater
availabilities and competitive pricing. Sugar has become the
biggest foreign exchange earner for Guatemala, with large
investment being deployed to boost export of refined sugar.
Similarly, sales by Cuba are set to increase due to greater
supply availability, while in Mexico, exports are seen to fall
because of lower production. However, high domestic sugar
prices could stimulate greater use of high fructose corn
syrup (HFCS) which, in turn, can free up additional sugar for
export.
MEAT AND MEAT PRODUCTS
Meat prices hover at near record levels Global meat markets are likely to face heightened trade
competition in 2012, at the same time that recovering
meat production in Asia is set to dampen growth in global
import demand. Overall, meat trade is expected to expand
by 2 percent, to 29.2 million tonnes, much of which is
anticipated to be taken up by developing country exporters,
which could increase their share of the global trade to 44
percent.
Disease outbreaks in 2011, drought-reduced cattle
inventories and high feed costs sustained international meat
prices to near record levels in the first quarter of 2012. In
April, the FAO meat price index edged up to 182 points,
surpassing the record 181 points registered in November
2011.
Indications of slowing import demand, especially for pig
and poultry meats, portents a potential moderation of meat
prices in the coming months, which, along with high feed
costs, is raising concern about the profitability of the meat
sector in 2012.
BOVINE MEAT
Drought and low animal numbers constrain bovine meat output Global beef production is forecast to stagnate at around
67.5 million tonnes in 2012, as progress in developing
countries is offset by contraction of output in developed
countries. Much of the world increase is expected in Asia
and Latin America and the Caribbean, with some gains also
foreseen in Oceania. Beef production is forecast to decline in
North America and in Europe.
In Asia, India is foreseen to lead a beef expansionary
drive thanks to three new export-oriented slaughter and
processing facilities opened in 2011. In the Republic of Korea, government incentives to slaughter low-performing
cows are behind an anticipated 27 percent jump in beef
Figure 39. Variable feed prices influence pork and poultry price movements
0.4
0.7
1.0
1.3
120
170
220
270
201220112010200920082007
2002-2004=100 Ratio
Feed price index (left axis)
Pigmeat/feed index (right axis)
Poultry/feed index (right axis)
Table 19. World meat market at a glance
2010 2011 2012Change: 2012
over 2011 estim. f'cast
million tonnes %
WORLD BALANCE
Production 294.6 297.2 302.0 1.6
Bovine meat 67.5 67.5 67.5 -
Poultry meat 98.2 101.6 103.5 1.8
Pigmeat 109.9 109.0 111.7 2.6
Ovine meat 13.5 13.5 13.6 0.9
Trade 26.6 28.5 29.2 2.4
Bovine meat 7.7 7.8 8.1 4.0
Poultry meat 11.6 12.6 13.0 3.1
Pigmeat 6.2 7.1 7.0 -0.7
Ovine meat 0.8 0.7 0.7 1.4
SUPPLY AND DEMAND INDICATORS
Per caput food consumption:
World (kg/year) 42.5 42.3 42.5 0.5
Developed (kg/year) 79.2 78.9 78.4 -0.5
Developing (kg/year) 32.4 32.3 32.8 1.5
FAO MEAT PRICE INDEX (2002-2004=100) 2010 2011 2012
Change: Jan-Apr 2012
over Jan-Apr 2011
Jan-Apr %
152 157 179 3.3
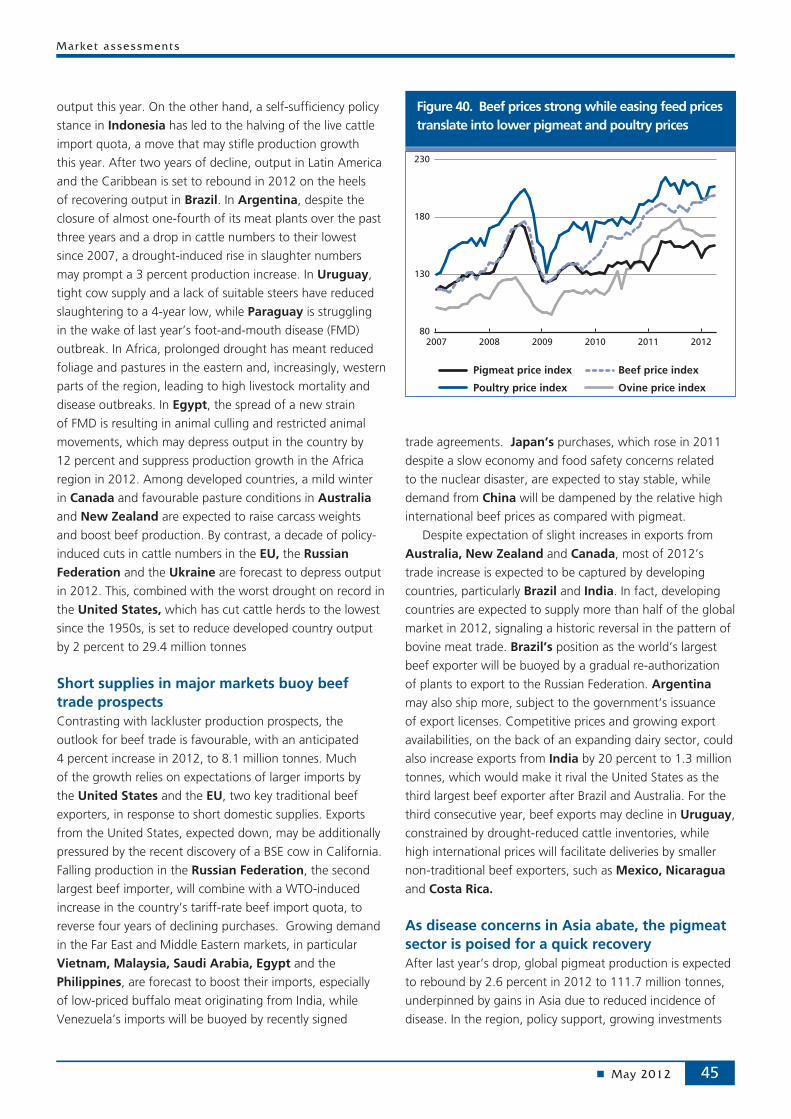
Market assessments
May 2012 45
Figure 40. Beef prices strong while easing feed prices translate into lower pigmeat and poultry prices
80
130
180
230
201220112010200920082007
Poultry price index
Pigmeat price index
Ovine price index
Beef price index
output this year. On the other hand, a self-sufficiency policy
stance in Indonesia has led to the halving of the live cattle
import quota, a move that may stifle production growth
this year. After two years of decline, output in Latin America
and the Caribbean is set to rebound in 2012 on the heels
of recovering output in Brazil. In Argentina, despite the
closure of almost one-fourth of its meat plants over the past
three years and a drop in cattle numbers to their lowest
since 2007, a drought-induced rise in slaughter numbers
may prompt a 3 percent production increase. In Uruguay,
tight cow supply and a lack of suitable steers have reduced
slaughtering to a 4-year low, while Paraguay is struggling
in the wake of last year’s foot-and-mouth disease (FMD)
outbreak. In Africa, prolonged drought has meant reduced
foliage and pastures in the eastern and, increasingly, western
parts of the region, leading to high livestock mortality and
disease outbreaks. In Egypt, the spread of a new strain
of FMD is resulting in animal culling and restricted animal
movements, which may depress output in the country by
12 percent and suppress production growth in the Africa
region in 2012. Among developed countries, a mild winter
in Canada and favourable pasture conditions in Australia and New Zealand are expected to raise carcass weights
and boost beef production. By contrast, a decade of policy-
induced cuts in cattle numbers in the EU, the Russian Federation and the Ukraine are forecast to depress output
in 2012. This, combined with the worst drought on record in
the United States, which has cut cattle herds to the lowest
since the 1950s, is set to reduce developed country output
by 2 percent to 29.4 million tonnes
Short supplies in major markets buoy beef trade prospects Contrasting with lackluster production prospects, the
outlook for beef trade is favourable, with an anticipated
4 percent increase in 2012, to 8.1 million tonnes. Much
of the growth relies on expectations of larger imports by
the United States and the EU, two key traditional beef
exporters, in response to short domestic supplies. Exports
from the United States, expected down, may be additionally
pressured by the recent discovery of a BSE cow in California.
Falling production in the Russian Federation, the second
largest beef importer, will combine with a WTO-induced
increase in the country’s tariff-rate beef import quota, to
reverse four years of declining purchases. Growing demand
in the Far East and Middle Eastern markets, in particular
Vietnam, Malaysia, Saudi Arabia, Egypt and the Philippines, are forecast to boost their imports, especially
of low-priced buffalo meat originating from India, while
Venezuela’s imports will be buoyed by recently signed
trade agreements. Japan’s purchases, which rose in 2011
despite a slow economy and food safety concerns related
to the nuclear disaster, are expected to stay stable, while
demand from China will be dampened by the relative high
international beef prices as compared with pigmeat.
Despite expectation of slight increases in exports from
Australia, New Zealand and Canada, most of 2012’s
trade increase is expected to be captured by developing
countries, particularly Brazil and India. In fact, developing
countries are expected to supply more than half of the global
market in 2012, signaling a historic reversal in the pattern of
bovine meat trade. Brazil’s position as the world’s largest
beef exporter will be buoyed by a gradual re-authorization
of plants to export to the Russian Federation. Argentina
may also ship more, subject to the government’s issuance
of export licenses. Competitive prices and growing export
availabilities, on the back of an expanding dairy sector, could
also increase exports from India by 20 percent to 1.3 million
tonnes, which would make it rival the United States as the
third largest beef exporter after Brazil and Australia. For the
third consecutive year, beef exports may decline in Uruguay,
constrained by drought-reduced cattle inventories, while
high international prices will facilitate deliveries by smaller
non-traditional beef exporters, such as Mexico, Nicaragua and Costa Rica.
As disease concerns in Asia abate, the pigmeat sector is poised for a quick recoveryAfter last year’s drop, global pigmeat production is expected
to rebound by 2.6 percent in 2012 to 111.7 million tonnes,
underpinned by gains in Asia due to reduced incidence of
disease. In the region, policy support, growing investments
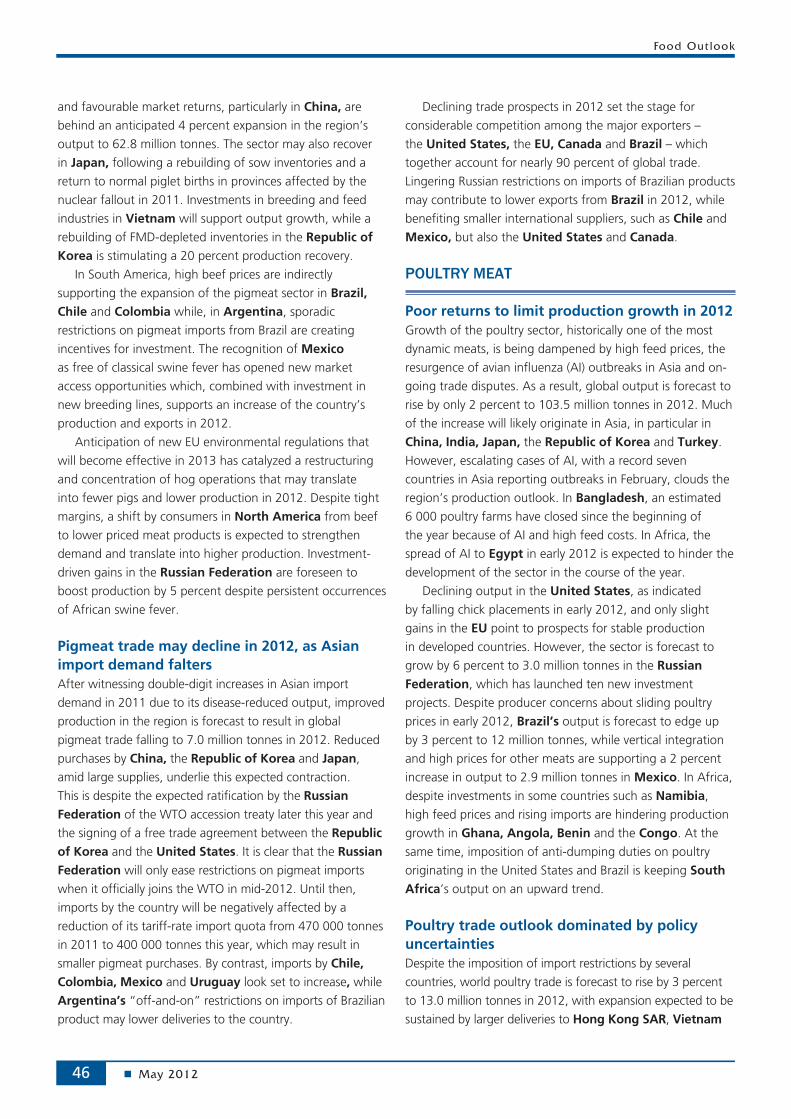
Food Outlook
May 201246
and favourable market returns, particularly in China, are
behind an anticipated 4 percent expansion in the region’s
output to 62.8 million tonnes. The sector may also recover
in Japan, following a rebuilding of sow inventories and a
return to normal piglet births in provinces affected by the
nuclear fallout in 2011. Investments in breeding and feed
industries in Vietnam will support output growth, while a
rebuilding of FMD-depleted inventories in the Republic of Korea is stimulating a 20 percent production recovery.
In South America, high beef prices are indirectly
supporting the expansion of the pigmeat sector in Brazil, Chile and Colombia while, in Argentina, sporadic
restrictions on pigmeat imports from Brazil are creating
incentives for investment. The recognition of Mexico
as free of classical swine fever has opened new market
access opportunities which, combined with investment in
new breeding lines, supports an increase of the country’s
production and exports in 2012.
Anticipation of new EU environmental regulations that
will become effective in 2013 has catalyzed a restructuring
and concentration of hog operations that may translate
into fewer pigs and lower production in 2012. Despite tight
margins, a shift by consumers in North America from beef
to lower priced meat products is expected to strengthen
demand and translate into higher production. Investment-
driven gains in the Russian Federation are foreseen to
boost production by 5 percent despite persistent occurrences
of African swine fever.
Pigmeat trade may decline in 2012, as Asian import demand falters After witnessing double-digit increases in Asian import
demand in 2011 due to its disease-reduced output, improved
production in the region is forecast to result in global
pigmeat trade falling to 7.0 million tonnes in 2012. Reduced
purchases by China, the Republic of Korea and Japan,
amid large supplies, underlie this expected contraction.
This is despite the expected ratification by the Russian Federation of the WTO accession treaty later this year and
the signing of a free trade agreement between the Republic of Korea and the United States. It is clear that the Russian Federation will only ease restrictions on pigmeat imports
when it officially joins the WTO in mid-2012. Until then,
imports by the country will be negatively affected by a
reduction of its tariff-rate import quota from 470 000 tonnes
in 2011 to 400 000 tonnes this year, which may result in
smaller pigmeat purchases. By contrast, imports by Chile, Colombia, Mexico and Uruguay look set to increase, while
Argentina’s “off-and-on” restrictions on imports of Brazilian
product may lower deliveries to the country.
Declining trade prospects in 2012 set the stage for
considerable competition among the major exporters –
the United States, the EU, Canada and Brazil – which
together account for nearly 90 percent of global trade.
Lingering Russian restrictions on imports of Brazilian products
may contribute to lower exports from Brazil in 2012, while
benefiting smaller international suppliers, such as Chile and
Mexico, but also the United States and Canada.
POULTRY MEAT
Poor returns to limit production growth in 2012 Growth of the poultry sector, historically one of the most
dynamic meats, is being dampened by high feed prices, the
resurgence of avian influenza (AI) outbreaks in Asia and on-
going trade disputes. As a result, global output is forecast to
rise by only 2 percent to 103.5 million tonnes in 2012. Much
of the increase will likely originate in Asia, in particular in
China, India, Japan, the Republic of Korea and Turkey.
However, escalating cases of AI, with a record seven
countries in Asia reporting outbreaks in February, clouds the
region’s production outlook. In Bangladesh, an estimated
6 000 poultry farms have closed since the beginning of
the year because of AI and high feed costs. In Africa, the
spread of AI to Egypt in early 2012 is expected to hinder the
development of the sector in the course of the year.
Declining output in the United States, as indicated
by falling chick placements in early 2012, and only slight
gains in the EU point to prospects for stable production
in developed countries. However, the sector is forecast to
grow by 6 percent to 3.0 million tonnes in the Russian Federation, which has launched ten new investment
projects. Despite producer concerns about sliding poultry
prices in early 2012, Brazil’s output is forecast to edge up
by 3 percent to 12 million tonnes, while vertical integration
and high prices for other meats are supporting a 2 percent
increase in output to 2.9 million tonnes in Mexico. In Africa,
despite investments in some countries such as Namibia,
high feed prices and rising imports are hindering production
growth in Ghana, Angola, Benin and the Congo. At the
same time, imposition of anti-dumping duties on poultry
originating in the United States and Brazil is keeping South Africa’s output on an upward trend.
Poultry trade outlook dominated by policy uncertaintiesDespite the imposition of import restrictions by several
countries, world poultry trade is forecast to rise by 3 percent
to 13.0 million tonnes in 2012, with expansion expected to be
sustained by larger deliveries to Hong Kong SAR, Vietnam

Market assessments
May 2012 47
and Indonesia, as well as Saudi Arabia and the United Arab Emirates. Imports by Saudi Arabia, the third largest
market after Hong Kong SAR and Japan, will be influenced by
the status of a government fodder subsidy granted to national
poultry operations in 2011, the depletion of which is pushing
up poultry prices and stimulating import demand. Deliveries
to the Russian Federation, which was the world’s largest
market until the imposition of restrictive import measures four
years ago, are expected to edge up somewhat, following a
WTO-induced increase in the poultry tariff-rate quota. Rising
domestic demand will continue to boost imports by African
countries, in particular Egypt, Angola, Benin, and Ghana, with the resultant regional dependency on imports now
estimated at 24 percent of domestic consumption, compared
to 18 percent in 2009. Import growth in Latin America and
the Caribbean will be led by Chile, Mexico and Venezuela.
By contrast, following the imposition of anti-dumping duties
on poultry originating in the United States, China may
buy less, although part of the product delivered to Hong
Kong SAR is likely to be re-exported to the mainland. The
application of anti-dumping tariffs on Brazilian product by
South Africa is likely to negatively influence Brazil’s deliveries
to South Africa in 2012, while improved domestic availability
is forecast to depress purchases by Japan. The continued
imposition by India, a minor importer, of non-tariff barriers on
poultry and the resulting request by the US for consultations
under the dispute settlement provisions of the World Trade
Organization (WTO) is illustrative of the multiple constraints
facing international poultry trade.
As for poultry meat exports, a return to a more
favourable exchange rate may support a 2 percent increase
in Brazilian shipments, despite the slow relisting of Brazilian
poultry plants by the Russian Federation. Exports from
Thailand will be supported by the EU’s April decision to
lift an 8-year ban on raw poultry shipments by mid-year.
Similarly, sales by Turkey are likely to be boosted by the
granting of access to the Saudi Arabian market, after a
6-year ban. Strong regional demand, particularly from Chile
and Venezuela, are sustaining a steady growth in shipments
from Argentina. On the other hand, limited domestic
supplies and more restricted access to markets may dampen
growth in the United States to less than 1 percent and even
result in declining shipments by the EU.
OVINE MEAT
Prices stabilize as higher output relieves market tightnessThe tight global supplies that characterized sheepmeat
markets in 2011 are easing slightly as production edges
up 1 percent to 13.6 million tonnes. Most of the output
gains will be derived from the non-meat trading countries
in Africa and Asia, in particular Sudan, Nigeria, Ethiopia, India, the Islamic Republic of Iran, Pakistan and Turkey.
However, sheep prices in many African and Middle Eastern
countries remain at near record levels, raising concerns
about availability and affordability in a region where
sheepmeat can represent as much as one-third of total meat
consumption. In Oceania, good pasture and favourable
lambing conditions in Australia and New Zealand have
reversed four years of declining output, with production
forecast to rise by 3 percent. Drought conditions in the
United States have exacted a toll on sheep numbers while
a lingering contraction of output in the EU is expected to
boost imports after two years of decline.
Sheepmeat trade to increase as production recovers in OceaniaHigher export availabilities in 2012 from Australia and
New Zealand, the suppliers of over 80 percent of global
trade, set the stage to reverse three years of declining global
trade. Sheepmeat trade may edge up to 741 000 tonnes,
supported by strong import demand. Export availabilities
from some non-traditional exporting countries, such as
Argentina and Uruguay will be limited by drought.
Shipments from Pakistan may expand in response to strong
demand and high prices in Middle Eastern countries. EU
imports, which have declined two years in a row because
of difficulties in procuring supplies from New Zealand, are
estimated up slightly as are those by the United States. An
expansion into the Chinese market will continue with import
of sheepmeat cuts suitable to China’s traditional hotpot
cooking style. Live trade in sheep continues to support the
Australian industry, although shipments to Saudi Arabia,
traditionally one of the largest markets for Australian live
sheep, have been declining for the past five years as a result
of competition from East African nations, including Sudan
and Somalia.

Food Outlook
May 201248
Tab
le 1
6. M
ajo
r M
eat
Mar
ket
Polic
y D
evel
op
men
ts: N
ove
mb
er 2
011-
Ap
ril 2
012
Co
un
try
Pro
du
ctD
ate
Polic
y In
stru
men
tD
escr
ipti
on
Arg
enti
na
po
rkM
ar-1
2Im
po
rt r
estr
icti
on
Imp
lem
ente
d im
po
rt r
estr
icti
on
s re
qu
irin
g e
xpo
rter
s to
ap
ply
fo
r im
po
rt li
cen
ses
.
Aze
rbai
jan
live
catt
leM
ar-1
2Im
po
rt a
cces
sA
zerb
aija
n p
ort
s o
pen
ed t
o C
anad
ian
live
cat
tle
exp
ort
s.
Bo
tsw
ana
po
rkJa
n-1
2Im
po
rt B
anIm
po
sed
imp
ort
ban
on
So
uth
Afr
ican
po
rk a
nd
pig
pro
du
cts
afte
r o
utb
reak
of
Afr
ican
Sw
ine
Feve
r
Ch
ina
live
bre
edin
g
anim
als,
fro
zen
em
bry
os
and
se
men
No
v-11
Imp
ort
req
uir
emen
tsA
nn
ou
nce
d n
ew p
olic
y o
n a
ll im
po
rts
of
bre
edin
g a
nim
als
and
fro
zen
sem
en a
nd
em
bry
os
- m
ust
sh
ow
th
ree
gen
erat
ion
s o
f p
edig
ree
(gre
at g
ran
dp
aren
t, g
ran
dp
aren
t, a
nd
par
ent
gen
erat
ion
s).
Euro
pea
n U
nio
n
live
anim
als
No
v-11
An
imal
wel
fare
re
gu
lati
on
sR
evie
w o
f th
e re
gu
lati
on
on
th
e an
imal
wel
fare
fo
r an
imal
s d
uri
ng
tra
nsp
ort
.
po
ult
ryA
pr-
12Im
po
rt B
an
Lift
ed t
he
eig
ht-
year
ban
on
th
e im
po
rts
of
fres
h c
hic
ken
mea
t fr
om
Th
aila
nd
, eff
ecti
ve J
uly
1, a
fter
no
b
ird
flu
cas
e re
po
rted
in T
hai
lan
d f
or
mo
re t
han
th
ree
con
secu
tive
yea
rs.
po
rk, b
eef
Ap
r-12
Exp
ort
su
bsi
die
sC
ut
exp
ort
ref
un
ds
on
pro
cess
ed p
ork
to
zer
o; l
ow
ered
exp
ort
ref
un
ds
on
bee
f ca
rcas
ses
fro
m E
uro
244
(U
SD 3
21)
to E
uro
163
(U
SD 2
13)
per
to
nn
e. R
edu
ced
rat
es a
lso
fo
r d
ebo
ned
, fre
sh a
nd
oth
er b
eef
cuts
.
Ru
ssia
n
Fed
erat
ion
, K
azak
hst
an,
Bel
aru
s,
Ukr
ain
e, T
urk
ey,
Egyp
t, K
uw
ait,
Le
ban
on
, A
lger
ia, J
ord
an,
Mo
rocc
o,
Jap
an, M
exic
o,
Arg
enti
na,
U
rug
uay
an
d
the
U.S
lives
tock
Ap
r-12
Imp
ort
res
tric
tio
ns
Res
tric
tio
ns
on
live
sto
ck a
nd
pro
du
cts
imp
ort
s fr
om
th
e EU
imp
ose
d a
fter
Sch
mal
len
ber
g V
iru
s o
utb
reak
.
Ho
ng
Ko
ng
SA
Rp
ou
ltry
Jan
-12
Imp
ort
Ban
Susp
ensi
on
of
imp
ort
s o
f liv
e p
ou
ltry
an
d p
ou
ltry
pro
du
cts
fro
m p
arts
of
nei
gh
bo
uri
ng
Sh
enzh
en (
Ch
ina)
af
ter
an A
I-re
late
d h
um
an f
atal
ity.
Ind
on
esia
Bee
fJa
n-1
2Im
po
rt q
uo
taC
ut
bee
f im
po
rt q
uo
ta f
or
2012
, fro
m 5
0 00
0 -
60
000
ton
nes
per
yea
r to
34
000
ton
nes
.
Cat
tle
Low
ed t
he
qu
ota
fo
r liv
e ca
ttle
imp
ort
s fr
om
520
000
to
280
000
hea
d.
Isra
elp
ou
ltry
Jan
-12
sub
sid
ies
Co
nfi
rmed
co
nti
nu
atio
n o
f p
ou
ltry
su
bsi
die
s
Jap
an
po
ult
ryFe
b-1
2im
po
rt b
anIm
po
sed
imp
ort
ban
on
Au
stra
lian
po
ult
ry f
ollo
win
g a
n o
utb
reak
of
avia
n fl
u a
t a
Vic
tori
an d
uck
far
m.
po
ult
ryFe
b-1
2im
po
rt b
an
Lift
ed a
n A
I-in
du
ced
imp
ort
ban
on
US
po
ult
ry c
om
ing
fro
m t
he
stat
e o
f N
ort
h C
aro
lina.
bee
fA
pr-
12Im
po
rt b
an
Lift
ed a
n im
po
rt s
usp
ensi
on
on
a U
.S. m
eat
pro
cess
ing
co
mp
any
afte
r it
en
sure
d c
om
plia
nce
wit
h a
U
S-Ja
pan
bila
tera
l acc
ord
on
man
agin
g b
ovi
ne
spo
ng
ifo
rm e
nce
ph
alo
pat
hy
(BSE
) d
isea
se r
isk
in b
eef
ship
men
ts
bee
fA
pr-
12Im
po
rt q
uo
taIn
crea
sed
imp
ort
qu
ota
fo
r M
exic
an b
eef
fro
m t
he
curr
ent
6 00
0 to
nn
es p
er y
ear
to 1
0,50
0 to
nn
es p
er
year
; (Pr
efer
enti
al)
tari
ff r
ates
rem
ain
at
30.8
per
cen
t fo
r ch
illed
an
d f
roze
n b
on
eles
s p
rod
uct
s
Kaz
akh
stan
po
rkJa
n-1
2im
po
rt b
anIm
po
sed
imp
ort
ban
on
po
rk f
rom
th
e Sa
rato
v an
d O
ren
bu
rg r
egio
ns
of
the
Ru
ssia
n F
eder
atio
n b
ecau
se
of
Afr
ican
Sw
ine
feve
r

Market assessments
May 2012 49
Co
un
try
Pro
du
ctD
ate
Polic
y In
stru
men
tD
escr
ipti
on
Ko
rea,
Rep
. of
bee
fJa
n-1
2im
po
rt b
an
Lift
ed n
ine-
year
imp
ort
ban
on
Can
adia
n b
eef;
th
e d
ecis
ion
mar
ks t
he
offi
cial
re-
op
enin
g o
f th
e m
arke
t si
nce
Can
ada’
s fi
rst
case
of
BSE
in
200
3.
Ko
rea,
Rep
. of
-
USA
bee
fM
ar-1
2Fr
ee T
rad
e ag
reem
ent
Red
uce
d t
arif
f in
th
e R
epu
blic
of
Ko
rea
on
US
bee
f im
po
rts
fro
m 4
0 p
erce
nt,
to
37.
33 p
erce
nt
as f
ree
Trad
e A
gre
emen
t b
etw
een
th
e R
ep. o
f K
ore
a an
d t
he
US
(KO
RU
S) c
om
es in
fo
rce
on
15
Mar
ch 2
012
Ko
rea,
Rep
. of
po
rkM
ar-1
2Im
po
rt q
uo
taEx
ten
ded
du
ty-f
ree
tari
ff-r
ate
qu
ota
(TR
Q)
for
chill
ed/f
roze
n p
ork
bel
lies
for
70 0
00 t
on
nes
, eff
ecti
ve
fro
m A
pri
l 1 -
Ju
ne
30, 2
012.
Ko
rea,
Rep
. of
po
rkA
pr-
12Im
po
rt q
uo
ta
Red
uce
d d
uty
fre
e ta
riff
rat
e q
uo
ta (
TRQ
) fo
r fr
esh
/fro
zen
po
rk b
ellie
s fr
om
th
e in
itia
l 70
000
ton
nes
to
20
000
to
nn
es f
or
the
per
iod
Ap
ril-
Jun
e.
Ku
wai
t
live
anim
als
(ch
icke
n),
eg
gs
Dec
-12
Imp
ort
ban
Ban
on
imp
ort
s o
f b
ird
s an
d e
gg
s fr
om
th
e Is
lam
ic R
epu
blic
of
Iran
fo
llow
ing
rep
ort
s b
y th
e W
orl
d
Hea
lth
Org
aniz
atio
n (
WH
O)
ind
icat
ing
th
e p
rese
nce
of
bir
d fl
u in
th
e co
un
try
live
chic
ken
, p
ou
ltry
, eg
gs
Mar
-12
Imp
ort
ban
Ban
on
imp
ort
s o
f p
ou
ltry
, eg
gs
and
ch
icks
fro
m S
ri L
anka
an
d A
ust
ralia
po
ult
ryM
ar-1
2Im
po
rt b
an
Lift
ed b
an o
n im
po
rts
of
all U
S p
ou
ltry
pro
du
cts
Mex
ico
mea
tD
ec-1
1Im
po
rt r
equ
irem
ents
New
cer
tifi
cati
on
req
uir
ed o
n s
hip
men
ts o
f ce
rtai
n m
eat
and
po
ult
ry p
rod
uct
s fr
om
th
e U
nit
ed S
tate
s.
po
rkJa
n-1
2Im
po
rt r
estr
icti
on
sU
S p
ork
pla
nt
in Io
wa
rem
ove
d f
rom
elig
ible
exp
ort
ers
list
Om
anp
ou
ltry
Mar
-12
Imp
ort
ban
Imp
ose
d b
an o
n im
po
rts
of
po
ult
ry f
rom
Ind
ia b
ased
on
th
e W
orl
d O
rgan
izat
ion
fo
r A
nim
al H
ealt
h
(OIE
) n
orm
s
Para
gu
ayca
ttle
an
d
bu
ffal
oes
Jan
-12
An
imal
Hea
lth
reg
ula
tio
ns
Imp
ose
d m
and
ato
ry v
acci
nat
ion
ag
ain
st F
oo
t an
d M
ou
th D
isea
se (
FMD
). C
attl
e an
d b
uff
alo
es
vacc
inat
ed f
rom
1 F
ebru
ary
to 2
Mar
ch 2
012.
Ru
ssia
n
Fed
erat
ion
-B
elar
us-
Kaz
akh
stan
bee
f, p
ork
, p
ou
ltry
Dec
-11
Imp
ort
qu
ota
Esta
blis
hed
201
2 ta
riff
rat
e q
uo
tas
on
to
tal m
eat
and
po
ult
ry u
nd
er t
he
Ru
ssia
n F
eder
atio
n-B
elar
us-
Kaz
akh
stan
Cu
sto
ms
Un
ion
. To
tal v
olu
mes
low
ered
fo
r th
e R
uss
ian
Fed
erat
ion
(p
ork
an
d p
ou
ltry
),
rais
ed f
or
Kaz
akh
stan
(p
ork
an
d b
eef)
an
d k
ept
un
chan
ged
fo
r B
elar
us.
Dec
-11
Co
nve
ned
Cu
sto
ms
Un
ion
(C
U)
Co
mm
issi
on
on
Dec
emb
er 9
, 201
1, w
hic
h d
ecid
ed a
do
pti
on
of
the
2012
H
S N
om
encl
atu
re o
f th
e W
orl
d C
ust
om
s O
rgan
izat
ion
an
d o
f te
chn
ical
reg
ula
tio
ns
on
“Fo
od
Pro
du
cts
Lab
elin
g”.
Ru
ssia
n F
eder
atio
n
bee
f, p
ork
, p
ou
ltry
Jan
-12
Imp
ort
qu
ota
sEs
tab
lish
ed b
eef,
po
rk, p
ou
ltry
TR
Qs
for
2012
: 530
000
to
nn
es T
RQ
fo
r fr
oze
n b
eef;
30
000
ton
nes
TR
Q
for
fres
h/c
hill
ed b
eef;
400
000
to
nn
es T
RQ
fo
r p
ork
plu
s 30
000
to
nn
es T
RQ
fo
r p
ork
tri
mm
ing
s; 3
30 0
00
ton
nes
TR
Q f
or
fro
zen
po
ult
ry m
eat.
po
ult
ryFe
b-1
2Im
po
rt b
an li
fted
Lift
ed im
po
rt b
an o
n U
krai
ne
po
ult
ry p
rod
uce
d b
y th
e M
yro
niv
ska
po
ult
ry f
arm
(K
aniv
, Ch
erka
sy
reg
ion
). T
he
ban
had
bee
n t
emp
ora
rily
imp
ose
d o
n O
cto
ber
18,
201
0 d
ue
to v
iola
tio
ns
of
san
itar
y an
d
vete
rin
ary
reg
ula
tio
ns.
pro
tein
fe
eds
of
anim
al
ori
gin
Mar
-12
Imp
ort
ban
Lift
ed b
an o
n im
po
rts
of
pro
tein
fee
ds
of
anim
al o
rig
in f
rom
all
EU c
ou
ntr
ies
as o
f 26
Mar
ch 2
012.
live
anim
als
Mar
-12
Imp
ort
ban
Imp
ose
d b
an o
n im
po
rts
of
live
catt
le, p
ig, s
hee
p a
nd
go
ats
fro
m t
he
EU a
s o
f M
arch
20
du
e to
th
e Sc
hm
alle
nb
erg
vir
us
ou
tbre
ak.
Sau
di A
rab
iap
ou
ltry
Jan
-12
Imp
ort
ban
lift
edLi
fted
imp
ort
ban
on
po
ult
ry f
rom
Tu
rkey
wh
ich
had
bee
n in
pla
ce s
ince
th
e la
st o
utb
reak
of
the
bir
d
flu
ep
idem
ic in
200
5

Food Outlook
May 201250
Co
un
try
Pro
du
ctD
ate
Polic
y In
stru
men
tD
escr
ipti
on
Sou
th A
fric
ap
ou
ltry
Mar
-12
Imp
ort
Du
ty
Imp
ose
d p
rovi
sio
nal
an
ti-d
um
pin
g t
arif
fs o
f 6
to 6
3 p
erce
nt
on
imp
ort
s o
f B
razi
lian
wh
ole
fro
zen
ch
icke
ns
and
bo
nel
ess
po
ult
ry c
uts
. Du
ties
to
be
app
lied
fo
r a
26-w
eek
per
iod
un
til a
pre
limin
ary
du
mp
ing
inve
stig
atio
n b
y th
e In
tern
atio
nal
Tra
de
Ad
min
istr
atio
n C
om
mis
sio
n o
f So
uth
Afr
ica
- IT
AC
)
com
ple
ted
.
Swaz
ilan
dp
ork
Feb
-12
Imp
ort
Ban
Imp
ose
d im
po
rt b
an o
n S
ou
th A
fric
an p
ork
an
d p
ig p
rod
uct
s af
ter
ou
tbre
ak o
f A
fric
an S
win
e Fe
ver
Turk
eyca
ttle
Ap
r-12
Imp
ort
req
uir
emen
tsSu
spen
ded
rel
ease
of
imp
ort
lice
nse
s o
n c
attl
e fr
om
th
e EU
aft
er S
chm
alle
nb
erg
vir
us
ou
tbre
ak
Un
ited
Sta
tes
mea
tN
ov-
11M
arke
tin
g r
equ
irem
ents
U.S
. law
on
man
dat
ory
co
un
try-
of-
ori
gin
lab
ellin
g (
CO
OL)
req
uir
emen
ts f
or
lives
tock
an
d m
eat
(am
on
g
oth
er p
rod
uct
s) d
ecla
red
by
the
Wo
rld
Tra
de
Org
aniz
atio
n (
WTO
) to
be
bar
rier
s to
tra
de.
po
rkJa
n-1
2Im
po
rt b
an li
fted
Imp
ort
ban
on
Bra
zilia
n p
ork
imp
ort
s fr
om
San
ta C
ater
ina
stat
e lif
ted
.
mea
tM
ar-1
2M
arke
tin
g r
equ
irem
ents
The
US
file
d a
n a
pp
eal w
ith
th
e W
TO d
isp
uti
ng
th
e ru
ling
ind
icat
ing
th
at s
om
e p
rovi
sio
ns
of
the
U.S
. la
w o
n m
and
ato
ry c
ou
ntr
y o
f o
rig
in (
CO
OL)
lab
elin
g w
ere
bar
rier
s to
tra
de
Uru
gu
ayca
ttle
g
enet
ic
mat
eria
lM
ar-1
2Im
po
rt b
anTe
mp
ora
ry s
usp
end
ed im
po
rts
of
gen
etic
mat
eria
l (ru
min
ant
sem
en a
nd
em
bry
os)
fro
m E
uro
pea
n
cou
ntr
ies
du
e to
th
e o
utb
reak
of
Sch
mal
len
ber
g v
iru
s.

Market assessments
May 2012 51
Figure 41. FAO international dairy price index (2002-2004=100)
50
150
250
350
201220102008200620042002200019981996
The index is derived from a trade-weighted average of a selectionof representative internationally traded dairy products.
Table 21. World dairy market at a glance
2010 2011 2012Change: 2012
over 2011 estim. f'cast
million tonnes, milk equiv. %
WORLD BALANCE
Total milk production 713.6 730.1 750.1 2.7
Total trade 47.8 50.7 52.7 4.0
SUPPLY AND DEMAND INDICATORS
Per caput food consumption:
World (kg/year) 103.3 104.5 106.1 1.6
Developed (kg/year) 233.4 234.3 237.8 1.5
Developing (kg/year) 67.8 69.5 71.1 2.2
Trade share of prod. (%) 6.7 6.9 7.0 1.2
FAO DAIRY PRICE INDEX (2002-2004=100) 2010 2011 2012
Change: Jan-Apr 2012
over Jan-Apr 2011
Jan-Apr %
200 221 198 -13.4
MILK AND MILK PRODUCTS
PRICES
Prices fall in the face of increased availability on the international marketInternational prices of dairy products began to decline in
mid-2011, as supplies to the international market improved.
During the five-month period October 2011 to February
2012, the FAO international dairy products price index
(2002–2004=100) stayed within a narrow range of 200 to
207. In March, prices registered a sharp decline, reflecting
the favourable conclusion of the Southern Hemisphere
milk producing season and an equally positive opening of
the Northern Hemisphere season. Prices have weakened
for all the products that constitute the index. Comparing
April 2012 with a year earlier, butter was down USD 1 250
per tonne, or 26 percent, while whole milk powder fell by
USD 794 per tonne, or 19 percent. Skimmed milk powder
registered a fall of USD 744 per tonne, or 20 percent, while
cheddar cheese dropped by USD 725 per tonne, or 16
percent. The price slide reflected a rise in export availability
and a fall in the value of the euro against the US dollar.
Yet despite the drop, international prices for dairy
products still remain well above historical averages. With
publicly financed inventories at minimal levels in the EU and
the United States, the market remains sensitive to sudden
changes in milk production and availability of milk products.
The positive supply outlook for the rest of 2012 is likely to
mean further downward pressure on prices.
PRODUCTION
Milk production continues to grow, especially in Asia, Oceania and South AmericaWorld milk production in 2012 is forecast to grow by 2.7
percent to 750 million tonnes. Asia is expected to account
for most of the increase, with output in India, the world’s
largest milk producing country, forecast to rise by 5.2 million
tonnes to 127 million tonnes. Dynamic domestic demand
is the main engine stimulating growth, as India is largely
absent from the international market for dairy products.
Increased output is also anticipated in China, Pakistan and Turkey, as consumer demand continues to rise.
In Africa, a small increase in milk output is anticipated for
2012. For example, milk production is Kenya is expected to
recover somewhat, due to favourable rains in October and
March that improved pasture conditions in drought-affected
areas – which are expected to last until at least mid-2012;
however, a shortage of some types of feed remains a
constraint. High maize prices are expected to constrain
growth in milk production in South Africa in 2012, leaving
it unchanged. Elsewhere in the region, an outbreak of foot-
and-mouth disease in Egypt has led to higher calf morality
and may depress milk output.
Rising incomes and strong international prices have
favoured production growth in several countries in Latin
America and the Caribbean. Most South American countries
had very good pasture conditions during the 2011/2012
production year. Overall, South American milk production
grew by 4.4 percent during the 2011 calendar year to reach
68 million tonnes, registering strong gains in Argentina,
Ecuador and Uruguay, with a similar magnitude of increase

Food Outlook
May 201252
anticipated for 2012. As international prices have remained
relatively high by historical standards, good returns on
overseas sales have allowed greater use of concentrated
feed, further increasing milk yields per animal. The largest
producer, Brazil, is also forecast to increase milk output
this year, even though some regions suffered from drought
during 2011 which has affected pasture condition. Output
in Chile may be curbed in 2012, due to a dry end to the
2011/2012 season associated with a la niña weather
phenomenon which adversely affected both pasture
condition and feed availability. In Central America, output
from the main producing countries, including Mexico and
Costa Rica, is expected to be largely stable.
In North America, milk production in the United States
is forecast to rise to 90.6 million tonnes, reflecting dairy herd
expansion in response to positive national and international
demand. Production in Canada is expected to remain stable at
8.3 million tonnes, within the limits set by the milk quota system.
In Europe, the EU is forecast to raise production by 1
percent to 156.5 million tonnes in 2012, as improved milk
yields more than compensate for reduced cow numbers.
Additionally, spring weather has been favourable for pasture
growth and the new milk production season has started
positively. Production limits are being raised by 1 percent
per year in the EU, in preparation for the abolition of the
quota system in 2015. Milk production in the Russian Federation is anticipated to rise as a result of falling feed
prices and herd rebuilding, follow a sharp contraction in
the dairy herd during the drought of 2010. In neighbouring
Ukraine, milk production may stabilize, following a period
of prolonged decline, due to government programmes to
support the sector and lower feed prices. In Oceania, a
prolonged period of high prices for dairy products on the
international market and associated levels of profitability
have stimulated milk production. In New Zealand, output
rebounded strongly during the 2011/12 season, stemming
from an increase in herd size combined with above average
pasture conditions, and is expected to close 9 percent above
the previous season. In Australia, the end of the prolonged
drought has encouraged farmers to rebuild their dairy herds
which, combined with generally good rainfall during the
2011/12 season, could boost milk production by 4 percent.
TRADE
A favourable outcome of the season in Oceania and South America drives international prices downWorld trade in dairy products is expected to continue to
expand in 2012. Demand remains firm and imports are
forecast to reach 52.5 million tonnes of milk equivalent.
In recent months, prices have been affected by two main
factors: a fall in value of the euro against the US dollar that
began in mid-2011, and more recently, a strong finish to the
Southern Hemisphere production season. The current market
sentiment finds importers delaying placing orders in order to
see if prices drop further.
Asia will continue to be the main market, with additional
demand expected to come from countries such as China, Saudi Arabia, Indonesia, the Republic of Korea and Singapore. Elsewhere, imports by Egypt may also grow,
as could purchases by the two principal purchasers in Latin
America, Mexico and Venezuela. However, imports by
third-placed Brazil may decrease, due to rising domestic
milk production. Strong increase in availabilities from
pasture-based production in Argentina, New Zealand and Uruguay may stimulate their exports to rise by 12 percent,
8 percent and 5 percent respectively. The other principal
trading countries – Australia, Belarus, the EU and the United States – are anticipated to maintain sales levels
similar to 2011.
WHOLE MILK POWDER (WMP)
International WMP prices were largely unchanged from
August 2011 to February 2012, at around USD 3 575 per
tonne. In the Southern Hemisphere, the strong closing of
the 2011/2012 season resulted in larger than expected
availability in March and April. As a consequence, prices
fell, with April WMP trading some USD 280 lower at
USD 3 295 per tonne. World exports of WMP are projected
to show continued growth in 2012, rising by 124 000
tonnes to reach 2.4 million tonnes. Sustained demand is
forecast for Asia, the main market, as well as for importers
in North Africa, the Middle East and Latin America. China, Egypt, Algeria and Venezuela, the major importing
countries (in order of volume of trade) make up 40 percent
of world WMP trade. All four countries are expected
to increase purchases in 2012, as are other important
importing countries such as (in order of volume of trade)
Saudi Arabia, United Arab Emirates, Singapore, Sri Lanka, Indonesia and Oman. Conversely, imports by
Brazil and Nigeria may decline. Demand for WMP is
very geographically diverse, due to its wide use in both
the processing industry and for direct retail sale. As for
exporters, Argentina, Australia and New Zealand will
supply most of the increase in trade, as supply limitations
and more profitable alternative uses are expected to
curb exports from the EU. These four exporters supply
80 percent of the international WMP market.

Market assessments
May 2012 53
Table 18. Major exporters of dairy products
2008-10
Average
2011
prelim.
2012
f’cast
thousand tonnes
WHOLE MILK POWDER
World 2 073 2 277 2 401
New Zealand 791 1110 1210
EU* 464 390 393
Argentina 126 200 225
Australia 130 116 122
SKIM MILK POWDER
World 1 330 1 707 1 757
EU* 263 518 500
United States 341 436 450
New Zealand 331 362 405
Australia 142 140 136
BUTTER
World 844 826 856
New Zealand 396 414 439
EU* 149 126 129
Belarus 69 64 68
United States 58 64 56
Australia 63 41 38
CHEESE
World 2 061 2 412 2 485
European Union* 603 682 689
Saudi Arabia 200 284 341
New Zealand 267 253 251
United States 139 226 230
Egypt 133 175 182
Australia 160 168 172
* Excluding trade between the EU Member States. From 2007: EU-27
Figure 42. EU intervention prices, price and export refund for butter and skim milk powder
0
1500
3000
4500
1211100908070605040302
SMP (interv. price)
SMP Refund
SMP (export price) Butter (export price)Butter (interv. price)
Butter Refund
Euro per tonne
SKIM MILK POWDER (SMP)
Trade in SMP is anticipated to rise by 3 percent in 2012, to
1.8 million tonnes. SMP prices were relatively stable during
the final months of 2011 and in January of 2012, hovering
around the USD 3 400 mark and reflecting a balanced
market overall. Subsequently, average prices dropped each
month between February and April to stand at USD 3 025
SMP is central to the milk processing industry in many
countries and, as such, market demand is widespread. The
principal markets are (in order of volume) Mexico, China, Indonesia, the Philippines, Algeria and Malaysia,
followed by Thailand, Singapore, Saudi Arabia and Egypt. Overall demand is expected to remain firm in these
markets. China, in particular, is anticipated to increase its
purchases substantially, by 20 000 tonnes, and is on course to become the major importer of SMP by the middle of the decade: China became the major importer of WMP in 2010. Increased imports are also anticipated (in
order of volume) for Mexico, Indonesia, the Philippines and Malaysia. Conversely, purchases by Algeria, fifth
ranked in terms of volume, may decrease as the government
seeks to promote domestic milk production. Slightly over
three-quarters of world exports are supplied by (in order of
volume) the EU, the United States and New Zealand. For
2012, the largest increase in supplies is expected to come
from New Zealand, with strong growth also foreseen
for fellow pasture-based milk producers, Uruguay and Argentina. The United States is also expected to increase
its sales, as milk production is growing and the export of
SMP is the principal vehicle for balancing its domestic dairy
market. Conversely, better returns from cheese production
may cause EU export availabilities to decline by about 3
percent. At the same time, as in the case of the United
States, SMP exports play an important role in maintaining
balance in the EU milk market, as overall internal demand is
biased towards milk fat for butter and cheese production,
rather than milk protein.
BUTTER
In tandem with its co-product, SMP, butter prices fell sharply
in February and March during the February to April period,
dropping by USD 400 to stand at USD 3 500 per tonne.
Trade in butter is forecast to grow by 3.7 percent in 2012, to
856 000 tonnes. This is anticipated to be a consequence of
increased deliveries by New Zealand, Belarus, Argentina
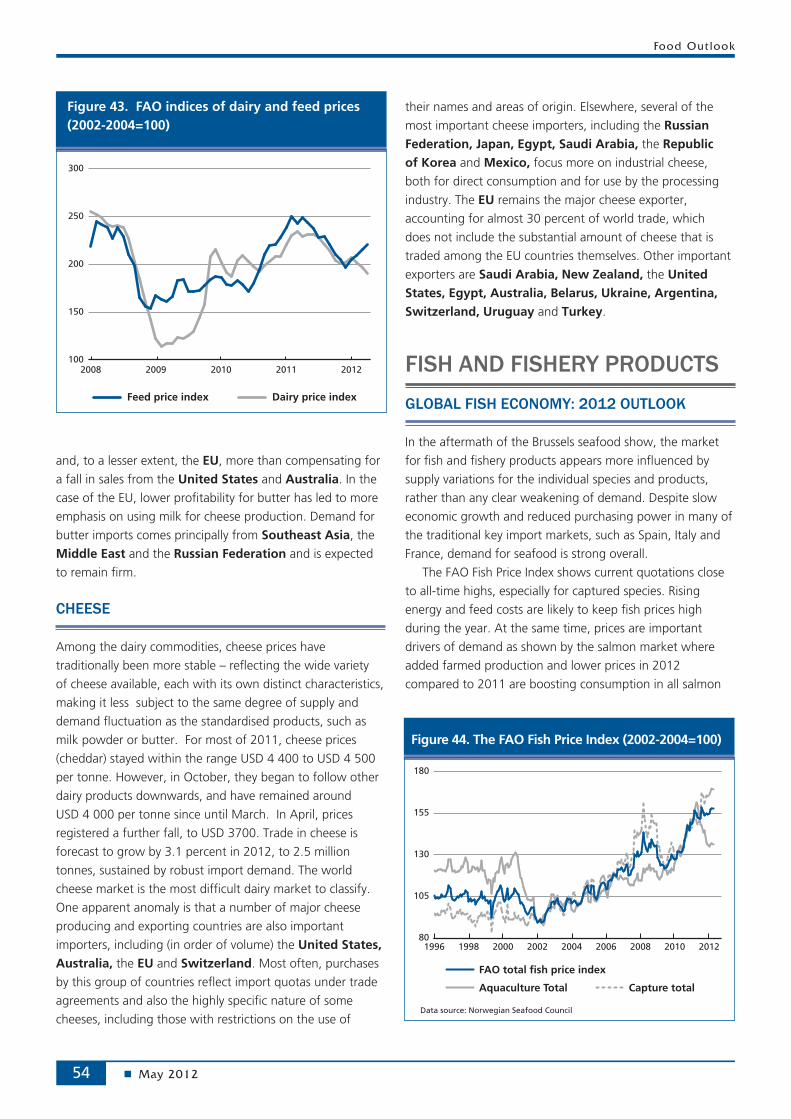
Food Outlook
May 201254
Figure 43. FAO indices of dairy and feed prices (2002-2004=100)
100
150
200
250
300
20122011201020092008
Feed price index Dairy price index
Figure 44. The FAO Fish Price Index (2002-2004=100)
80
105
130
155
180
201220102008200620042002200019981996
Data source: Norwegian Seafood Council
FAO total fish price index
Capture totalAquaculture Total
and, to a lesser extent, the EU, more than compensating for
a fall in sales from the United States and Australia. In the
case of the EU, lower profitability for butter has led to more
emphasis on using milk for cheese production. Demand for
butter imports comes principally from Southeast Asia, the
Middle East and the Russian Federation and is expected
to remain firm.
CHEESE
Among the dairy commodities, cheese prices have
traditionally been more stable – reflecting the wide variety
of cheese available, each with its own distinct characteristics,
making it less subject to the same degree of supply and
demand fluctuation as the standardised products, such as
milk powder or butter. For most of 2011, cheese prices
(cheddar) stayed within the range USD 4 400 to USD 4 500
per tonne. However, in October, they began to follow other
dairy products downwards, and have remained around
USD 4 000 per tonne since until March. In April, prices
registered a further fall, to USD 3700. Trade in cheese is
forecast to grow by 3.1 percent in 2012, to 2.5 million
tonnes, sustained by robust import demand. The world
cheese market is the most difficult dairy market to classify.
One apparent anomaly is that a number of major cheese
producing and exporting countries are also important
importers, including (in order of volume) the United States, Australia, the EU and Switzerland. Most often, purchases
by this group of countries reflect import quotas under trade
agreements and also the highly specific nature of some
cheeses, including those with restrictions on the use of
their names and areas of origin. Elsewhere, several of the
most important cheese importers, including the Russian Federation, Japan, Egypt, Saudi Arabia, the Republic of Korea and Mexico, focus more on industrial cheese,
both for direct consumption and for use by the processing
industry. The EU remains the major cheese exporter,
accounting for almost 30 percent of world trade, which
does not include the substantial amount of cheese that is
traded among the EU countries themselves. Other important
exporters are Saudi Arabia, New Zealand, the United States, Egypt, Australia, Belarus, Ukraine, Argentina, Switzerland, Uruguay and Turkey.
FISH AND FISHERY PRODUCTS
GLOBAL FISH ECONOMY: 2012 OUTLOOK
In the aftermath of the Brussels seafood show, the market
for fish and fishery products appears more influenced by
supply variations for the individual species and products,
rather than any clear weakening of demand. Despite slow
economic growth and reduced purchasing power in many of
the traditional key import markets, such as Spain, Italy and
France, demand for seafood is strong overall.
The FAO Fish Price Index shows current quotations close
to all-time highs, especially for captured species. Rising
energy and feed costs are likely to keep fish prices high
during the year. At the same time, prices are important
drivers of demand as shown by the salmon market where
added farmed production and lower prices in 2012
compared to 2011 are boosting consumption in all salmon

Market assessments
May 2012 55
Table 19. World fish market at a glance
2010 2011 2012Change: 2012
over 2011 estim. f'cast
million tonnes %
WORLD BALANCE
Production 148.5 154.0 157.3 2.1
Capture fisheries 88.6 90.4 90.0 -0.4
Aquaculture 59.9 63.6 67.3 5.8
Trade value (exports USD billion) 108.6 126.1 138.0 9.4
Trade volume (live weight) 56.7 58.5 60.2 2.9
Total utilization 148.5 154.0 157.3 2.1
Food 128.3 130.8 135.7 3.7
Feed 15.0 18.2 16.6 -8.5
Other uses 5.1 5.0 5.0 -
SUPPLY AND DEMAND INDICATORS
Per caput food consumption:
Food fish (kg/year) 18.6 18.8 19.2 2.6
From capture fisheries (kg/year) 9.9 9.6 9.7 0.6
From aquaculture (kg/year) 8.7 9.1 9.5 4.6
FAO FISH PRICE INDEX1 (2002-2004=100) 2010 2011 2012
Change: Jan-Apr 2012
over Jan-Apr 2011
Jan-Apr %
137 154 157 2.8
1 Data source: Norwegian Seafood Council
Figure 45. Main shrimp importing markets
0
500
1000
1500
2000
2011201020092008200720062005
Thousand tonnes
United States
EU 27 (intra)
EU 27 (extra)
Japan
Table 20. Shrimp imports by product (Japan)
2007 2008 2009 2010 2011
(thousand tonnes)
Live 0.2 0.1 0.1 0.1 0.1
Fresh/chilled * ** ** ** **
Frozen, raw 207.3 196.6 197.6 205.3 205.2
Dried/salted/in brine 1.6 1.8 2.9 2.6 0.8
Cooked, frozen 17.9 19.7 20.9 21.6 23.6
Cooked & smoked 0.3 0.3 0.3 0.3 0.5
Prepared/preserved* 48.2 44 41.1 46.6 49.2
Sushi (with rice) 0.1 0.1 2.2 2 3.2
Total (incld. Ebi) 275.5 262.6 265.2 280.7 285.3
* (incl. tempura shrimp) Source: JFTA/INFOFISH** (less than 50 tonnes)
markets.
SHRIMP
Shrimp: supply squeeze from bad weather and production problems keep prices high but new season will bring reliefWorld production of farmed shrimp fell to 2.5 million tonnes
in 2011, nearly 20 percent less than 2010, because of supply
shortfalls in Asia. With the new Asian 2012 season starting
in April and May, supply is forecast to recover and prices to
soften somewhat.
The market for shrimp however, should stay firm. In the
United States, improved retail demand contributed to a
marginal rise in imports. The, cold weather and the weak
economy in early 2012 had a negative impact on European
shrimp consumption although prices remained stable during
the first quarter of 2012. EU imports dipped 1.2 percent to
610 000 tonnes, although Spain, Italy and the UK increased
imports.
Asian markets were mixed with strong growth in the
Republic of Korea and Malaysia and with Thailand and
Viet Nam importing more for the processing industry.
On the other hand, imports of frozen shrimp declined in
China and Hong Kong. Domestic demand for fresh shrimp
increased in some of the producing countries, including
India. Supported by the strong yen and high demand for
prepared shrimp products, Japan’s shrimp imports rose
1.6 percent last year to 285 300 tonnes, while in China,
2011 shrimp imports of 53 000 tonnes represented a 7.8
percent decrease from 2010.
In the coming months, more farmed vannamei is
expected from Thailand, India and Viet Nam. Thai production
in 2012 is forecast to increase to 700 000 tonnes whereas
Indian production of black tiger may decline 40–50 percent
to 60 000–70 000 tonnes. Indian vannamei producers, on
the contrary, could reach 100 000 tonnes, a more than 30
percent increase from 2011. Supplies of vannamei are also
expected to increase from Viet Nam, and the anticipated
higher production will certainly put pressure on prices,
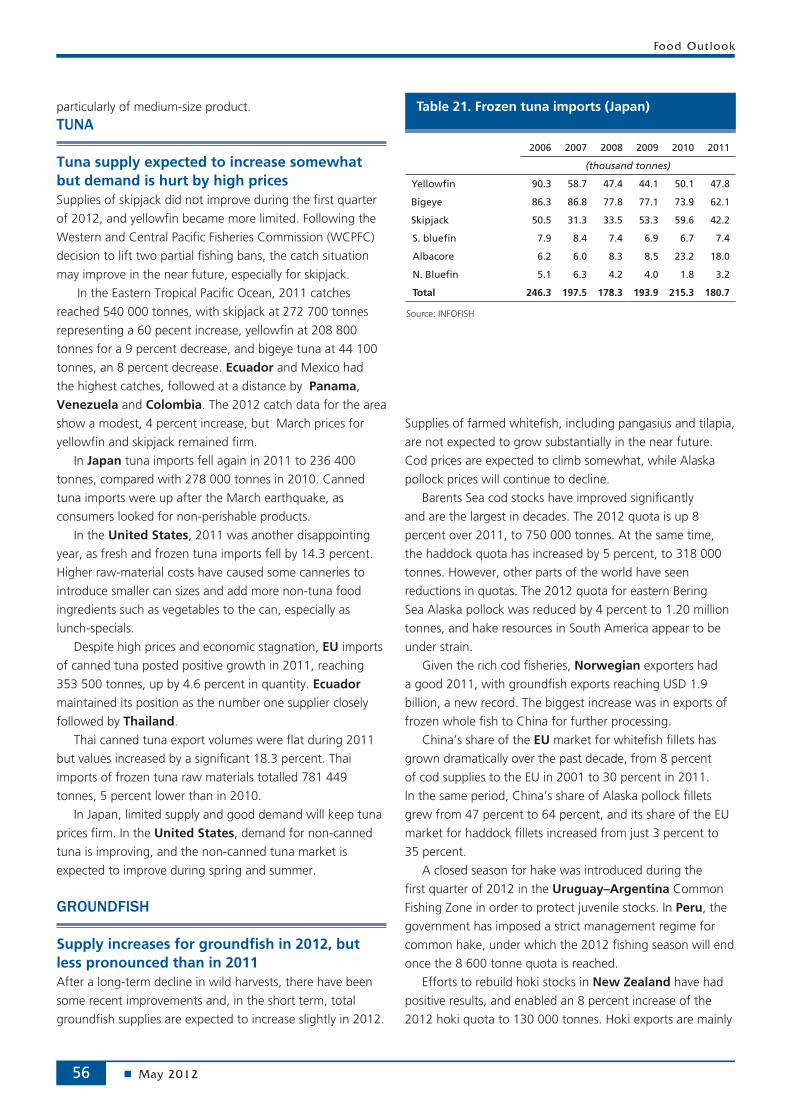
Food Outlook
May 201256
Table 21. Frozen tuna imports (Japan)
2006 2007 2008 2009 2010 2011
(thousand tonnes)
Yellowfin 90.3 58.7 47.4 44.1 50.1 47.8
Bigeye 86.3 86.8 77.8 77.1 73.9 62.1
Skipjack 50.5 31.3 33.5 53.3 59.6 42.2
S. bluefin 7.9 8.4 7.4 6.9 6.7 7.4
Albacore 6.2 6.0 8.3 8.5 23.2 18.0
N. Bluefin 5.1 6.3 4.2 4.0 1.8 3.2
Total 246.3 197.5 178.3 193.9 215.3 180.7
Source: INFOFISH
particularly of medium-size product.
TUNA
Tuna supply expected to increase somewhat but demand is hurt by high pricesSupplies of skipjack did not improve during the first quarter
of 2012, and yellowfin became more limited. Following the
Western and Central Pacific Fisheries Commission (WCPFC)
decision to lift two partial fishing bans, the catch situation
may improve in the near future, especially for skipjack.
In the Eastern Tropical Pacific Ocean, 2011 catches
reached 540 000 tonnes, with skipjack at 272 700 tonnes
representing a 60 pecent increase, yellowfin at 208 800
tonnes for a 9 percent decrease, and bigeye tuna at 44 100
tonnes, an 8 percent decrease. Ecuador and Mexico had
the highest catches, followed at a distance by Panama,
Venezuela and Colombia. The 2012 catch data for the area
show a modest, 4 percent increase, but March prices for
yellowfin and skipjack remained firm.
In Japan tuna imports fell again in 2011 to 236 400
tonnes, compared with 278 000 tonnes in 2010. Canned
tuna imports were up after the March earthquake, as
consumers looked for non-perishable products.
In the United States, 2011 was another disappointing
year, as fresh and frozen tuna imports fell by 14.3 percent.
Higher raw-material costs have caused some canneries to
introduce smaller can sizes and add more non-tuna food
ingredients such as vegetables to the can, especially as
lunch-specials.
Despite high prices and economic stagnation, EU imports
of canned tuna posted positive growth in 2011, reaching
353 500 tonnes, up by 4.6 percent in quantity. Ecuador maintained its position as the number one supplier closely
followed by Thailand.
Thai canned tuna export volumes were flat during 2011
but values increased by a significant 18.3 percent. Thai
imports of frozen tuna raw materials totalled 781 449
tonnes, 5 percent lower than in 2010.
In Japan, limited supply and good demand will keep tuna
prices firm. In the United States, demand for non-canned
tuna is improving, and the non-canned tuna market is
expected to improve during spring and summer.
GROUNDFISH
Supply increases for groundfish in 2012, but less pronounced than in 2011 After a long-term decline in wild harvests, there have been
some recent improvements and, in the short term, total
groundfish supplies are expected to increase slightly in 2012.
Supplies of farmed whitefish, including pangasius and tilapia,
are not expected to grow substantially in the near future.
Cod prices are expected to climb somewhat, while Alaska
pollock prices will continue to decline.
Barents Sea cod stocks have improved significantly
and are the largest in decades. The 2012 quota is up 8
percent over 2011, to 750 000 tonnes. At the same time,
the haddock quota has increased by 5 percent, to 318 000
tonnes. However, other parts of the world have seen
reductions in quotas. The 2012 quota for eastern Bering
Sea Alaska pollock was reduced by 4 percent to 1.20 million
tonnes, and hake resources in South America appear to be
under strain.
Given the rich cod fisheries, Norwegian exporters had
a good 2011, with groundfish exports reaching USD 1.9
billion, a new record. The biggest increase was in exports of
frozen whole fish to China for further processing.
China’s share of the EU market for whitefish fillets has
grown dramatically over the past decade, from 8 percent
of cod supplies to the EU in 2001 to 30 percent in 2011.
In the same period, China’s share of Alaska pollock fillets
grew from 47 percent to 64 percent, and its share of the EU
market for haddock fillets increased from just 3 percent to
35 percent.
A closed season for hake was introduced during the
first quarter of 2012 in the Uruguay–Argentina Common
Fishing Zone in order to protect juvenile stocks. In Peru, the
government has imposed a strict management regime for
common hake, under which the 2012 fishing season will end
once the 8 600 tonne quota is reached.
Efforts to rebuild hoki stocks in New Zealand have had
positive results, and enabled an 8 percent increase of the
2012 hoki quota to 130 000 tonnes. Hoki exports are mainly

Market assessments
May 2012 57
aimed at regional markets such as Australia and Japan.
CEPHALOPODS
Cephalopods face tight supplies and higher pricesWith the continued tight supply situation for cephalopods,
prices should remain high and firming, especially for
cuttlefish, but less so for squid. Octopus prices may continue
to climb with continued tight supply. However, there also
seems to be a slight decline in demand, especially in Japan.
For the medium term, the outlook is for weaker demand,
stable prices for squid and octopus, and continued rising
prices for cuttlefish.
Octopus. The octopus market is suffering from tight supplies.
Morocco saw catches drop 30 percent during 2011, and a
further 41 percent during early 2012, and has a new fishing
ban from April 1, 2012. Morocco and Mauritania remain the
dominant suppliers with Mexico emerging as a new player.
Squid and cuttlefish. Importers faced a massive decline in
squid supplies in 2011. Spain saw the most drastic reduction
in imports, down by 33 percent to 112 000 tonnes, the lowest
level in decades. Italy’s imports of squid declined by 7.5
percent. The exception was Japan, where squid imports grew
by almost 25 percent in 2011, with China now accounting for
46 percent of total imports in Japan.
Cuttlefish prices fell slightly on the Japanese market
during early 2012. On the Spanish market, squid and
cuttlefish prices increased during the first quarter as a result
of tighter supplies. However, imports from China brought
prices down during March. India is increasingly looking to
China as a market for squid and cuttlefish, not only as a
processor but as a consumer. China accounts for 80 percent
of India’s seafood exports.
FRESHWATER FISH
Tilapia losing ground in the US marketTilapia. Global tilapia supply is on the increase in 2012
with demand mainly coming from domestic and regional
consumers in Asia, Africa and South America. During 2012,
China is likely to export more to Africa and focus less on the
US market.
Despite harsh weather conditions, Chinese export
volumes of tilapia grew 2.3 percent with an increased value
of 10 percent in 2011. Frozen fillet exports decreased 15
percent in volume, but this was somewhat compensated for
by higher shipments of the cheaper whole frozen tilapia to
African markets such as Cameroon, Ivory Coast, Angola, Democratic Republic of Congo, Ghana, Namibia, Nigeria and Benin. Average export prices strengthened to
USD 1.88 per kg in 2011, up 13 percent.
United States imports of tilapia in 2011 declined for
the first time in a decade, decreasing 10 percent to 192
900 tonnes, while the import value declined a marginal
0.5 percent, to USD 838 million, as tilapia suffers in the
competition with the cheaper pangasius.
EU imports in 2011 saw a 1 percent increase, reaching
20 700 tonnes. China, EU’s main supplier, saw shipments
decline slightly, but imports were higher from other Asian
sources such as Viet Nam, Taiwan PC and Indonesia, which increased by 160 percent, 13 percent and 9 percent,
respectively.
Large private sector investments into the sector are
boosting production in a number of countries in the region,
including Brazil, Guatemala, Honduras and Mexico.
Production is targeting both domestic consumption as well
as export markets.
Catfish supply expected to increase during 2012 but with a stronger focus on quality and safetyCatfish. After a difficult 2011 characterized by disease
problems, weak markets and tight access to finance, the
catfish supply situation is expected to improve in 2012, with
Viet Nam focusing on quality of exports through massive
efforts to apply international standards such as SQF 1 000,
Global GAP or those of the Aquaculture Stewardship Council
(ASC).
The EU import of freshwater fish totalled 209 000
tonnes, 12 percent less than 2011. Nearly 90 percent of
Figure 46. Prices of octopus (whole, frozen) in Spain, origin Morocco
3
6
9
12
20122011201020092008200720062005
Euro per kg.
T2 T8

Food Outlook
May 201258
Figure 47. Prices of seabass and seabream in Italy
3
4
5
6
20122011201020092008200720062005
Euro per kg.
Seabream Seabass
this consisted of pangasius from Viet Nam. Demand for
pangasius from Viet Nam is also on the increase in Asia,
with Singapore, the Philippines and Thailand importing
39 percent, 86 percent and 37 percent more last year,
respectively. Viet Nam is continuing its diversification
strategy and has also increased exports to Mexico, Brazil and
Saudi Arabia.
US frozen catfish imports grew 59 percent to 92 000
tonnes in 2011. Despite higher prices during the year,
imported catfish remains an attractive product for consumers
and the restaurant sector, and import value increased 78
percent, to USD 350 million in 2011.
Nile perch in trouble Nile perch. Nile perch exports to the EU from Kenya,
Tanzania and Uganda, declined further in 2011 as catches
kept falling. Sustainability continues to be an issue and
enforcement remains a challenge.
Bass and bream supply tightBass and bream. Total supply of bass and bream was down
almost 4 percent in 2011 and production is likely to fall
again in 2012. Lower volume has caused prices to firm, but
may scare off consumers in the long run. Prices remained
relatively high during the first four months of 2012,
especially for bass, and are expected to firm further over the
next few months before the new supply reaches market size
during summer. Bass and bream continue to perform well
in newer markets such as the United Kingdom, Germany,
United States and the Russian Federation. Increased
domestic consumption in Turkey, the second largest
producer, has had a positive impact on the market.
SALMON
Strong supply growth of farmed salmon in 2012 – firm underlying demand should bring stability to this market thanks to attractive prices Farmed salmon. The supply of farmed salmon is projected
to grow around 12 percent in 2012, with exporters looking
to new markets such as Brazil, Russia, China and India.
Shipments to these markets increased by 20 percent in 2011,
reaching more than 210 000 tonnes.
Long-term growth in the EU and US markets is also
positive, as are recent developments in the Japanese market.
Consumption of 2011 farmed salmon increased 7 percent in
the EU, 10 percent in the US and 30 percent in Japan. The
long-term prospects for fish consumption in Japan remain
negative because of an ageing and stagnating population.
In Norway, production has risen 33 percent since 2008,
with new growth projected for 2012. Chile saw the strong
production growth of 2011 continue during early 2012.
Its 2011 salmon exports totalled almost 260 000 tonnes,
up more than 50 percent. In value terms, the increase was
even higher – 63 percent, totalling USD 1.9 billion. South
American countries now account for 32 percent of Chile’s
Table 21. Global farmed salmon production
2008 2009* 2010* 2011* 2012*
(thousand tonnes)
ATLANTIC SALMON
Norway 743 863 955 990 1075
Chile 389 233 135 200 310
UK 129 133 145 155 160
Canada 104 100 115 115 120
Faeroe Is. 39 51 45 52 60
Australia 25 30 31 31 31
Ireland 10 12 15 15 15
USA 17 14 17 16 16
Others 1 5 2 2 3
Total 1457 1441 1460 1576 1790
PACIFIC SALMON
Japan 13 16 9 8 8
Chile 92 158 155 175 195
Canada 7 5 10 12 12
New Zealand 9 12 12 12 12
Total 121 186 186 207 227
Gr. Total 1578 1627 1646 1783 2017
Source: GLOBEFISH AN 12201* estimate

Market assessments
May 2012 59
Figure 49. Prices of fishmeal and soymeal
0
500
1000
1500
2000
20122011201020092008200720062005
USD per tonne
Fishmeal Soymeal
exports, reaching 47 000 tonnes in 2011, with Brazil as the
main market in the region.
Wild salmon. Wild Pacific salmon remains important in
overall supply, representing about 30 percent of the total
market. In recent years, wild salmon harvests have been
around 1 million tonnes annually, but there can be large
annual swings. A large portion of wild salmon is shipped to
China for processing and re-export.
SMALL PELAGICS – MACKEREL, HERRING, SARDINES
Mackerel. New fish migration patterns are causing
headaches for mackerel fishing nations in Northern Europe.
Despite negotiations among the EU, Norway, Iceland and the
Faroe Islands during early 2012, there is still no agreement
on a total mackerel quota. As a result, the unilateral quotas
are too high, with parties in the conflict accusing each other
of acting irresponsibly.
Meanwhile, Norwegian mackerel exports declined 11
percent in volume last year, but prices were up significantly.
Japan was the main market, importing 75 200 tonnes in 2011,
a 5 percent increase, followed by China with 57 700 tonnes,
up 13 percent, and Turkey, which had a 26 percent decrease.
Thanks to improved catches, Norway’s mackerel export volumes
recovered during the first quarter of 2012 by 21 percent, to
58 000 tonnes. China is now importing more mackerel from
Norway, but most of this is re-exported to Japan.
With higher mackerel catches anticipated in the short run,
the high prices experienced lately may come down during
the next quarter.
Herring. Herring has had a bonanza, due to lower catches
that pushed prices sky high during 2011 and early 2012,
with prices now 60 percent higher than a year ago.
Norwegian catches and export volumes continued to decline
during early 2012.
Canned sardines. The canned sardine market in Europe
continues to decline. Shipments of sardines to the three most
important European markets – France, UK and Germany –
fell a further 18 percent last year, with the largest reduction
registered in France where imports fell from 16 700 tonnes
in 2010 to 12 300 tonnes in 2011. The main supplier to all
three markets was Morocco, followed by Portugal.
FISHMEAL – FISHOIL
After 2011 comeback of South America’s fishmeal production, 2012 looks more challenging Fishmeal prices can be expected to rise, due to Peru’s lower
quotas for anchovy catches in 2012, at a time when demand
is high. Peru confirmed its role in 2011 as the major exporter
with almost 60 percent of its production going to China.
Chile, on the other hand, saw exports stabilize in 2011 as
the upsurge in demand from domestic salmon producers
took most of the additional output. The EU, still the major
player, despite falling purchases from non-European sources,
continues to rely on South American sources for a substantial
part of its fishmeal needs. However, Norway, Iceland and
Morocco are becoming more important with their combined
share of EU imports almost doubling from 2009 to 2011, to
22 percent.
Figure 48. Prices of salmon in Europe, origin Norway
2
4
6
8
20122011201020092008200720062005
Euro per kg.
2-3 kg. 5-6 kg.

Food Outlook
May 201260
Figure 50. Prices of fish oil and soybean oil
0
500
1000
1500
2000
20122011201020092008200720062005
USD per tonne
Fish oil Soybean oil
Fish oil market quiet, as sellers hold back in hope of higher pricesThe lower-than-expected catch quota for Peru’s May–July
season for anchoveta in the North and Central area will
lead to a tighter market in the months ahead. A reduction
from last year’s quota of 3.7 million tonnes was anticipated,
but the new quota of 2.7 million tonnes took operators by
surprise.
During 2011, supply of fish oil increased to almost
normal levels as South American production returned to
market. Peru and Chile boosted their outputs while northern
European producers registered lower levels when more of
the catch went for direct human consumption. Chile saw
shipments up 24 percent while US exports fell back 15
percent because of lower menhaden shipments.
SHELLFISH AND CANNED MOLLUSCS
No crisis for imported shellfish and canned molluscs in European marketsCompanies exporting molluscs to the EU experienced a
successful year in 2011, as many consumers opted for frozen
products, which cost less.
Mussels. Mussel imports to the EU increased by 9.6
percent to 208 000 tonnes in 2011, the highest in six years.
Imports were particularly strong in Italy, Netherlands and
Spain, which accounted for 58 300 tonnes, 46 700 tonnes
and 34 200 tonnes, respectively. Spanish import volumes
of Chilean mussels rose by 70 percent in 2011, reaching 18
200 tonnes. Spain now buys a third of all Chilean mussel
exports.
Oysters. Oysters are still desired in most countries despite
high prices. As oyster production in Europe has declined,
prices have risen significantly. France, the main producer,
saw its 2011 exports fall by 18 percent to 8 000 tonnes, the
lowest level since 2008. New producers have now entered
the market, including Mexico and Morocco.
Scallops. European scallop imports continued to grow in
2011, reaching 59 000 tonnes in 2011, valued at USD 770
million, with Peru and Argentina the biggest suppliers.
Imports are dominated by France, the biggest market in
Europe, followed by Spain, Belgium and Germany.
Special features
May 2012 61
(Article by Panos Konandreas, Senior Consultant)
The views expressed herein do not necessarily reflect theofficial opinion of the Food and Agriculture Organization ofthe United Nations
Special features
WORLD MARKET VOLATILITY CHALLENGES FACING POOR NET FOOD-IMPORTING COUNTRIES AND POSSIBLE TRADE POLICY RESPONSES
Since the late 1990s the world has entered a period of
tight food supplies, higher prices and increased price volatility. These trends adversely affect the capacity of
food import-dependent countries to access supplies. Poor
households in these countries which already spend much of
their income on food and have limited coping mechanisms at
their disposal, suffer in the process.
These developments are related, in part, to the
implementation of reforms agreed under the Uruguay Round that came into effect in 1995, which resulted in a
reduction of structural surpluses and a strengthening of world
agricultural and food prices. Also as anticipated, other forms of
food assistance made available in the past, such as subsidized
exports and food aid, declined drastically in recent years. At
the same time the world food market has been dramatically
affected by factors external to agriculture, including energy
prices and speculative activity from the financial sector, as well
as unilateral export restrictions put in place by some countries.
The architects of the Uruguay Round had anticipated some
of these developments and Ministers had also agreed then
to the Marrakesh Decision1 to assist the Least Developed
Countries (LDCs) and Net-Food Importing Developing
Countries (NFIDCs) facing short-term difficulties in financing
normal levels of commercial imports of basic foodstuffs.
Despite these intentions, implementation of the Decision
has been a challenge and many LDCs and NFIDCs view it
as inadequate to provide the short-term assistance they
need, in view also of the many corroborating factors that
aggravated the world food market in recent years.
This short paper is a summary of a longer paper presented
1 Decision on Measures Concerning the Possible Negative Effects of the Reform Programme on Least-Developed and Net Food-Importing Developing Countries http://www.wto.org/english/docs_e/legal_e/35-dag_e.htm>
at a Seminar organized jointly by FAO and ICTSD in Geneva2.
The Seminar responded to concerns expressed by poor net
food-importing countries about the difficulties they have
faced in recent years in securing food supplies in uncertain
world markets3.
Characteristics of food insecurity in net food-importing countriesThe average supply of calories and protein in LDCs and
NFIDCs is well below and much more variable than the
aggregate for developing countries. Gains in the past half
century have been modest. Considering also the often very
unequal distribution of available supplies within countries,
these trends are indicative of their food security vulnerability.
A manifestation of the precariousness of the food security
situation in these countries is the frequency of being in need
of external assistance in response to food emergencies, with
some of them permanently in that state.
Their growing demand for basic foodstuffs continues
to be met by domestic supplies and growing import
volumes. In the case of cereals, self-sufficiency ratios
are hovering around 90% and 70%, for LDCs and NFIDCs
respectively. While NFIDCs have generally kept the pace of
other developing countries in increasing productivity, LDCs
achieved only modest gains. Cereal yields in LDCs are only
half of those attained by developing countries and one-third
of those achieved by developed countries. Much of the
increase in output has come from area expansion.
Cereals comprise the largest item in the food import basket accounting for some 42% and 40% of the value
of food imports of LDCs and NFIDCs, respectively, followed
by oils and fats and sugar. Together these three commodity
groups account for over three-quarters of the value of food
items imported by LDCs and over two-thirds for the NFIDCs.
The share of food aid in their total cereal imports has declined
sharply, from close to 30 percent in the beginning of the
1990s for the LDCs (8% for the NFIDCs), to about 8 percent
in the last 3 years (less than 0.5 percent for the NFIDCs).
2 Konandreas, Panos (2012). “World market volatility challenges facing poor net food-importing countries and possible trade policy responses”, Seminar on Securing food in uncertain markets: Challenges for poor, net food-importing countries, Geneva, 23 March 2012, organized jointly by the FAO Liaison Office in Geneva and the International Centre for Trade and Sustainable Development (ICTSD). See Programme and all background papers to the Seminar in: http://ictsd.org/i/events/dialogues/128643/?view=documentation .
3 In response to an initiative by concerned countries, during the WTO Eighth Ministerial Conference, some Ministers signalled their support for a proposal to establish a work programme on trade-related responses to mitigate the impact of food market prices and volatility, especially on LDCs and NFIDCs, for action by the Ninth Ministerial Conference (WT/MIN(11)/13).

Food Outlook
May 201262
Cereal yields (mt/ha)
LDCs: Cereal import bill
Contribution (%) of area and yield in cereal production increase
0
25
50
75
100
NFIDCsLDCs
Percent
Yield effect
Interaction effect
Area effect
NFIDCs: Cereal import bill
0
5
10
15
11/1208/0905/0601/0297/9893/94
USD billion
Africa (10) Asia (5) Lat. Am. (13)
0
4
8
12
11/1208/0905/0601/0297/9893/94
USD billion
Africa (33)
Latin America (1)
Asia (9)
Oceania (5)
The increase in the cost of cereal imports has been
much more affected by price increases rather than volumes
imported in recent years. Thus, for LDCs while the
aggregate volume of commercial cereal imports increased
by less than three times during 1990-2010, their cereal
import bill increased by over six times during the same
period. Similar sharp increases in the cereal import bill have
been experienced by the NFIDCs, with a volume increase by
about 70 percent and a cereal import bill nearly quadrupling
(therefore rising by some 300 percent). For both LDCs and
NFIDCs, there is considerable variation between countries,
and for some, all the increase in their cereal import bill was
due to price.
The escalating burden of food imports, necessary to
meet immediate consumption, represents a serious threat
for the economies of most LDCs and NFIDCs. The share of
food imports to total merchandize exports is very high even
under normal years, especially for the LDCs, and skyrockets
for some countries during price spikes. The imperative
of importing food often comes at the expense of other
imports including capital goods necessary for long-term
development.
What can LDCs and NFIDCs do for themselves?Limited help from reducing applied tariffs. Lowering
or eliminating import tariffs is the most common measure
0.0
1.5
3.0
4.5
10050095908580
World
Developed Developing
NFIDCs
Tonne per ha.
LDCs
Source: Compiled by the author based on FAO data
Source: Compiled by the author based on FAO data Source: Compiled by the author based on FAO data
Source: Compiled by the author based on FAO data

Special features
May 2012 63
LDCs: decomposition of growth of cereal import bill (1993-00 to 2001-11)
NFIDCs: decomposition of growth of cereal import bill (1993-00 to 2001-11)
Price effect Interaction effect Volume effect
-80%
-60%
-40%
-20%
0%
20%
40%
60%
80%
100%
Sam
oa
Kir
ibat
iSo
lom
on
Isl
.Si
err
a Le
on
eLe
soth
oLa
os
Tuva
luY
em
en
Nig
er
Ce
n.
Afr
. R
ep
Van
uat
uH
aiti
Mad
agas
car
Erit
rea
Bh
uta
nG
amb
iaZa
mb
iaSo
mal
iaTo
goG
uin
ea
Co
mo
ros
Ch
adC
amb
od
iaSe
ne
gal
Bu
rkin
a Fa
soD
jib
ou
tiM
auri
tan
iaA
fgh
anis
tan
Gu
ine
a-B
issa
uEt
hio
pia
Sud
anB
angl
ade
shM
ali
An
gola
Mal
awi
Bu
run
di
Mya
nm
arC
on
go,
DR
Tim
or-
Lest
eB
en
inU
gan
da
Tan
zan
iaM
oza
mb
iqu
eSa
o T
om
eLi
be
ria
Ne
pal
Equ
. G
uin
ea
Rw
and
a
LDC
s (4
8)
AFR
ICA
(3
3)
ASI
A (
9)
OC
EAN
IA (
5)
L. A
MER
. (1
)
-80%
-60%
-40%
-20%
0%
20%
40%
60%
80%
100%
Bar
bad
os
Mal
div
es
Ve
ne
zue
la
Sri
Lan
ka
Gre
nad
a
Mau
riti
us
St K
itts
& N
evi
s
St L
uci
a
Trin
. &
To
bag
o
Jord
an
St V
in.
& G
ren
.
Do
min
ica
Ke
nya
Egyp
t
Mo
rocc
o
Nam
ibia
Bo
tsw
ana
Do
min
ican
Re
p
Jam
aica
Cu
ba
Peru
Tun
isia
Paki
stan
Mo
ngo
lia
Cô
te d
Ivo
ire
Swaz
ilan
d
Gab
on
Ho
nd
ura
s
NFI
DC
s (2
8)
AFR
ICA
(1
0)
ASI
A (
5)
L. A
MER
. (1
3)
Price effect Interaction effect Volume effect
Source: Compiled by the author based on FAO data
Source: Compiled by the author based on FAO data

Food Outlook
May 201264
LDCs imports of food and animal products as a share of total merchandise exports (1990-2009)
NFIDCs imports of food and animal products as a share of total merchandise exports (1990-2009)
Logarithmic scale (%)
0
1
10
100
1000
Dji
bo
uti
Sam
oa
Gam
bia
Erit
rea
Tuva
luA
fgh
anis
tan
Co
mo
ros
Sao
To
me
Hai
tiSi
err
a Le
on
eK
irib
ati
Tim
or-
Lest
eSo
mal
iaV
anu
atu
Gu
ine
a-B
issa
uSe
ne
gal
Bu
run
di
Bu
rkin
a Fa
soB
en
inR
wan
da
Eth
iop
iaN
ige
rLi
be
ria
Leso
tho
Ye
me
nM
auri
tan
iaM
oza
mb
iqu
eC
on
go,
DP
Ne
pal
Mad
agas
car
Solo
mo
n I
sl.
Mal
iG
uin
ea
Togo
Tan
zan
iaU
gan
da
Mal
awi
Ce
ntr
al A
fr.
R.
Sud
anB
angl
ade
shLa
os
Cam
bo
dia
Bh
uta
nM
yan
mar
Zam
bia
Ch
adA
ngo
laEq
u.
Gu
ine
a
LDC
s
Max
Min
Simple Average
Logarithmic scale (%)
1
10
100
1000
10000
Gre
nada
Sain
t Lu
cia
St V
ince
nt
Mal
dive
s
Sain
t K
itts
Dom
inic
a
Dom
inic
an
Bar
bado
s
Cuba
Jord
an
Egyp
t
Hon
dura
s
Jam
aica
Mor
occo
Mau
riti
us
Sri L
anka
Ken
ya
Mon
gol
ia
Swaz
iland
Nam
ibia
Bot
swan
a
Peru
Tuni
sia
Côte
dIv
oire
Paki
stan
Ven
ezue
la
Trin
idad
Gab
on
NFI
DCs
Max
Min
Simple Average
Source: Compiled by the author based on FAO data
Source: Compiled by the author based on FAO data
Special features
May 2012 65
that governments take to cushion the impact on domestic
prices of imported goods when world market prices rise.
However, this option is severely limited when applied
tariffs are already low as is generally the case in many poor
countries and even their elimination is a small relief when
import prices shoot up by several multiples of prevailing
tariff levels.
Avoiding export prohibitions and restrictions. While
export restraints are seemingly politically attractive in the
short term, they are a blunt instrument. By aggravating
further world market prices they shift the burden of an even
greater adjustment to other countries. There are always
much more attractive approaches to address the needs
of vulnerable domestic consumers than imposing export
prohibitions/restrictions, which are also less costly in the
longer term. Also, to the extent that the country is a regular
exporter of food commodities, it risks losing markets if it
turns on and off exports unilaterally. Net food importing
countries should be enthusiastic proponents of approaches
in strengthening WTO rules on export prohibitions and
restrictions.
Stockholding and domestic food assistance. Building
modest stocks has been a very common response to market
instability and, although often an expensive undertaking,
their appeal is clear from the point of view of vulnerable
countries to offer some degree of protection against
domestic and external shocks. In general, there are no
effective limitations from the WTO Agreement on Agriculture
(AoA) for public stockholding for food security purposes
as long as these form an integral part of a food security
programme identified in national legislation. The same
applies to domestic food aid under clearly-defined eligibility
criteria related to nutritional objectives. The limitations arise
from cost considerations and clear rules for accumulation
and release of such stocks are essential.
Reducing the high transaction costs for intra-regional trade. Weak market integration in regions where the
majority of net food-importing countries are located tends
to result in higher food prices, adding to their vulnerability.
Some relief can be obtained by reducing transaction costs,
which is an important mitigating factor in containing price
increases and price volatility. Transactions costs can be
curbed through improvements to physical infrastructure (e.g.
roads) but also through a facilitation of regional transport
and transit formalities, simplification of cross-border
regulations and cracking down on petty corruption, which is
highly detrimental to food security.
Using AoA flexibility to invest in food production and resilience. In general the AoA disciplines are not
constraining poor countries in investing in agriculture, even
with production and trade distorting policies. The policy mix
that individual countries may use would depend on their
specific circumstances but one policy that has proven very
effective in achieving rapid increases in output is targeted
investment assistance to farmers and ‘smart’ input subsidies
to resource poor farmers.
How can the international community help?Among the measures to assist net food-importing countries
to deal with escalating food import bills are those specifically
mentioned in the Marrakesh Decision. These include: food
aid; export credits; compensatory financing; and assistance
to increase agricultural productivity and infrastructure.
Limiting the role of food aid to emergency responses.
While food aid has been an important resource in the past
to help countries with structural deficits, it now barely meets
the requirements of growing emergency situations. Also
the provision of food aid for budgetary support has been
increasingly under scrutiny. Considering also the nutritional
needs of poor households, especially in periods of scarcity, it
would be prudent to limit the use of food aid to emergencies
and nutritional support and, perhaps, broaden its scope by
including essential agricultural inputs as part of the donors’
contributions under the Food Aid Convention (FAC).
Targeting export credits. The record of officially supported
export credits in providing assistance to liquidity-constrained
countries to import food has not been very good. Only
a very small share of such credits was given to poor net-
food importing countries and the concessionality element
was minimal. Creating rules for export credits under the
Doha Round offers an opportunity to target these countries
and also reduces the risk of export credits being used
to circumvent export competition commitments. This is
the case to the extent that the credit provided responds
to recognized liquidity constraints in these countries and
therefore generates additional food imports.
Strengthening food financing facilities. The need for
assistance in financing imports of basic foodstuffs is evident
from the already heavy burden net food-importing countries
endure even when import prices are normal. IMF and the
World Bank facilities had been identified as most relevant
in the context of the Marrakesh Decision, although their
utility has been questioned by beneficiary countries for a
number of reasons. A battery of new instruments has now

Food Outlook
May 201266
Contact:[email protected]
been created by these institutions with improved conditions
of access and necessary resources, reflecting the need to
address increased vulnerabilities in poor countries in recent
years.
Increasing technical and financial assistance to boost productivity. Targeting agricultural productivity reflects
a genuine recognition of the fundamental causes of
vulnerability. The types of technical and financial assistance
would have to be holistic by addressing constraints along
the supply chain, including appropriate technologies,
processing, storage and marketing of agricultural
commodities. Reversing the past declining trends in Official
Development Assistance (ODA) investment to agriculture can
be instrumental in reducing vulnerability in poor net food-
importing countries.
Rationalizing biofuel policies. Recent reductions in
distorting policies pursued by some major grain-based
biofuel producers is a welcome development. This would
need to be supplemented by more flexibility in mandates,
making them conditional on the price of food, as well
as other innovative approaches that would capitalize on
available feedstocks being diverted to food consumption in
times of need.
Strengthening WTO disciplines on export prohibitions and restrictions. Existing disciplines on agricultural exports
have proven inadequate and are in urgent need of overhaul.
A proposal that deserves immediate attention is the
banning of restrictive measures on food purchases for non-
commercial humanitarian purposes, such as those by the
WFP. Beyond the damaging food security impacts of export
restraints, especially prohibitions, weak WTO rules in this
area undermine the multilateral trading system itself.
Beyond these general approaches, it is important to
recognize the great heterogeneity among net food-importing
countries as regards the level of economic development and
the difficulties they face in importing basic foodstuffs. This
has implications on the prioritization of assistance as well as
on the types of instruments that may be more effective for
individual countries.


Food Outlook
May 201268
Table A1 (a) & (b) Cereal Statistics 70-71
Table A2 (a) & (b) Wheat Statistics 72-73
Table A3 (a) & (b) Coarse Grains Statistics 74-75
Table A4 (a) & (b) Maize Statistics 76-77
Table A5 (a) & (b) Barley Statistics 78-79
Table A6 (a) & (b) Sorghum Statistics 80-81
Table A7 (a) & (b) Other Coarse Grains Statistics 80-81
Table A8 (a) & (b) Rice Statistics 82-83
Table A9 Cereal Supply and Utilization in Main Exporting Countries 84
Table A10 Total Oilcrops Statistics 85
Table A11 Total Oils and Fats Statistics 86
Table A12 Total Meals and Cakes Statistics 87
Table A13 Sugar Statistics 88
Table A14 Total Meat Statistics 89
Table A15 Bovine Meat Statistics 90
Table A16 Ovine Meat Statistics 91
Table A17 Pigmeat Statistics 92
Table A18 Poultry Meat Statistics 93
Table A19 Milk and Milk Products Statistics 94
Table A20 Fish and fishery products statistics 95
Table A21 Selected International Prices for Wheat and Coarse Grains 96
Table A22 Wheat and Maize Futures Prices 97
Table A23 Selected International Prices for Rice and Price Indices 98
Table A24 Selected International Prices for Oilcrop Products and Price Indices 99
Table A25 Selected International Prices for Sugar and Sugar Price Index 100
Table A26 Selected International Prices for Milk Products and Dairy Price Indices 101
Table A27 Selected International Meat Prices 102
Table A28 Selected International Meat Prices and FAO Meat Price Index 103
Table A29 Fish Price Indices (2005=100) 104
Table A30 Selected International Commodity Prices 105
Statistical tables

Statistical tables
May 2012 69
NOTES
General
on official and unofficial sources.
tables refer to FAO data as source.
may not always match, mainly because
shipments and deliveries do not necessarily
occur in the same marketing year.
unrounded data.
for countries not listed. The countries
shown in the tables were chosen based
on their importance of either production
or trade in each region. The totals
shown for Central America include
countries in the Caribbean.
for the Taiwan Province, Hong Kong SAR
and Macao SAR, unless otherwise stated.
ProductionCereals: Data refer to the calendar year
in which the whole harvest or bulk of
harvest takes place.
Sugar: Figures refer to centrifugal
sugar derived from sugar cane or beet,
expressed in raw equivalents. Data relate
to the October/September season.
UtilizationCereals: Data are on individual country’s
marketing year basis.
Sugar: Figures refer to centrifugal
sugar derived from sugar cane or beet,
expressed in raw equivalents. Data relate
to the October/September season.
TradeEuropean Union
member states is excluded, unless
otherwise stated.
Wheat: Trade data include wheat flour
in wheat grain equivalent. The time
reference period is July/June, unless
otherwise stated.
Coarse grains: The time reference
period is July/June, unless otherwise
stated.
Rice, dairy and meat products:
The time reference period is January/
December.
Oilseeds, oils and fats and meals
and sugar: The time reference period
is October/September, unless otherwise
stated.
.
StocksCereals: Data refer to carry-overs at the
close of national crop seasons ending in
the year shown.
COUNTRY CLASSIFICATION
In the presentation of statistical material,
countries are subdivided according to
geographical location as well as into the
following two main economic groupings:
“developed countries” (including the
developed market economies and the
transition markets) and “developing
countries” (including the developing
market economies and the Asia centrally
planned countries). The designation
“Developed” and “Developing”
economies is intended for statistical
convenience and does not necessarily
express a judgement about the stage
reached by a particular country or area in
the development process.
References are also made to special country groupings: Low-Income Food-Deficit Countries (LIFDCs), Least Developed Countries (LDCs). The LIFDCs include 66 countries that are net importers of basic foodstuffs with per caput income below the level used by the World Bank to determine eligibility for International Development Aid (IDA) assistance (i.e. USD 1 905 in 2009). The LDCs group currently
includes 48 countries with low income as well as weak human resources and low level of economic diversification. The list is reviewed every three years by the Economic and Social Council of the United Nations.
DISCLAIMER
The designations employed and
the presentation of material in this
publication do not imply the expression
of any opinion whatsoever on the part of
the Food and Agriculture Organization of
the United Nations concerning the legal
status of any country, territory, city or
area or of its authorities, or concerning
the delimitation of its frontiers or
boundaries.

Food Outlook
May 201270
Table A1 (a). Cereal statistics
Production Imports Exports
2008-2010 2011 2012
08/09-10/112011/12 2012/13
08/09-10/11 2011/12 2012/13
average average average estim. f’cast estim. f’cast estim. f’cast
(. . . . . . . . . . . . . . . . . . . . . . . . . . . . . . . . . . . . . . . . million tonnes . . . . . . . . . . . . . . . . . . . . . . . . . . . . . . . . . . . . . . .)
ASIA 992.6 1 066.6 1 060.2 138.6 143.5 145.0 42.8 49.5 48.2 Bangladesh 34.4 36.0 37.0 4.3 3.2 3.5 - - - China 426.8 457.7 454.3 10.9 15.9 17.2 1.0 0.8 0.8 India 213.7 232.3 234.4 0.3 0.3 0.2 5.0 10.8 11.0 Indonesia 57.6 58.8 60.6 7.8 8.9 8.9 0.1 0.1 0.1 Iran, Islamic Republic of 17.7 19.8 19.2 10.0 7.6 6.9 0.8 0.2 0.2 Iraq 2.8 3.5 3.1 4.7 5.1 4.9 - - - Japan 8.7 8.6 8.6 25.2 25.5 25.6 0.4 0.5 0.5 Kazakhstan 16.0 26.4 17.1 0.1 - - 7.0 9.2 7.8 Korea, Republic of 5.0 4.5 4.5 12.5 12.8 13.5 0.1 0.1 0.1 Myanmar 20.9 20.6 21.2 0.2 0.2 0.2 0.8 0.8 0.9 Pakistan 32.9 35.3 35.3 1.2 0.2 0.2 4.2 4.1 4.6 Philippines 17.5 18.4 18.7 5.2 4.5 4.9 - - - Saudi Arabia 1.9 1.6 1.5 11.7 13.1 12.5 - - - Thailand 26.3 25.3 27.5 2.4 2.8 2.6 10.2 8.4 8.9 Turkey 31.6 34.8 31.7 4.2 3.6 3.9 3.4 3.8 2.8 Viet Nam 30.7 32.9 33.1 3.6 3.8 3.8 6.7 7.2 7.0
AFRICA 153.6 156.4 155.2 64.7 68.5 69.4 7.0 8.1 7.0Algeria 4.1 4.2 4.4 8.1 9.1 9.1 - - - Egypt 20.3 20.5 20.9 15.6 17.0 16.2 0.4 0.3 0.3 Ethiopia 17.2 20.6 18.5 1.5 0.9 1.0 0.5 1.0 0.3 Morocco 7.8 8.6 3.4 5.4 5.8 8.3 0.2 0.2 0.1 Nigeria 24.1 25.1 25.6 6.1 6.4 5.8 0.6 0.6 0.5 South Africa 15.2 13.4 13.9 2.4 2.9 2.7 2.3 2.5 2.5 Sudan 4.9 2.7 4.8 2.1 2.7 2.4 0.1 - -
CENTRAL AMERICA 40.5 37.1 39.3 24.8 26.4 26.1 1.4 1.1 1.0 Mexico 34.1 30.5 32.7 14.6 16.0 15.7 1.2 0.9 0.9
SOUTH AMERICA 133.2 146.4 149.3 24.6 26.9 26.3 38.2 42.8 41.9 Argentina 36.3 46.4 42.2 - - - 23.3 27.4 26.0 Brazil 71.6 73.8 81.2 8.3 9.1 8.6 10.4 10.6 11.3 Chile 3.3 3.5 3.3 2.9 2.9 2.9 0.1 0.1 0.1 Colombia 3.6 3.6 3.8 5.0 5.3 5.2 0.1 0.1 0.1 Peru 3.9 3.8 3.8 3.3 3.8 3.8 - - - Venezuela 3.6 3.4 3.8 3.3 3.8 3.8 0.1 - -
NORTH AMERICA 455.6 431.5 474.2 8.5 8.6 7.8 105.4 94.1 103.0Canada 50.4 47.2 50.9 2.4 1.8 1.7 20.9 20.6 21.5 United States of America 405.2 384.3 423.4 6.1 6.8 6.1 84.5 73.6 81.5
EUROPE 456.5 461.9 452.3 16.3 17.5 19.6 65.3 71.5 70.6 European Union 296.9 288.3 285.9 12.3 13.6 15.7 27.7 21.5 20.8 Russian Federation 87.9 91.2 91.9 0.7 0.5 0.4 16.3 26.1 26.1 Serbia 9.1 8.9 8.5 0.1 0.1 0.1 1.9 1.7 1.2 Ukraine 45.4 55.9 47.6 0.2 0.3 0.3 19.0 21.6 21.8
OCEANIA 37.4 44.2 40.2 1.4 1.4 1.4 19.9 25.9 23.8 Australia 36.6 43.4 39.3 0.2 0.1 0.1 19.9 25.9 23.8
WORLD 2 269.5 2 344.1 2 370.7 279.0 292.9 295.5 279.9 293.1 295.5Developing countries 1 266.3 1 343.8 1 349.5 216.4 227.3 229.1 79.2 88.9 86.9 Developed countries 1 003.2 1 000.3 1 021.2 62.6 65.6 66.4 200.6 204.2 208.7 LIFDCs 496.0 524.0 533.1 81.5 84.0 83.5 11.4 18.6 17.9 LDCs 148.1 151.7 155.7 25.2 24.9 24.9 5.2 6.4 5.7

Statistical tables
May 2012 71
Table A1 (b). Cereal statistics
Total Utilization Stocks ending in Per caput food use
08/09-10/11 2011/12 2012/13
2009-20112012 2013
08/09-10/11 2011/12 2012/13
average average average estim. f’cast estim. f’cast estim. f’cast
(. . . . . . . . . . . . . . . . . . . . . . . . . . million tonnes . . . . . . . . . . . . . . . . . . . . .) (. . . . . . . . . . Kg/year . . . . . . .)
ASIA 1 072.9 1 138.1 1 151.1 294.7 327.0 332.4 161.7 163.1 164.1 Bangladesh 37.1 39.1 40.3 8.2 10.8 11.2 173.3 177.9 183.0 China 427.6 462.5 468.1 166.7 184.4 187.0 152.2 150.9 150.2 India 207.1 217.5 219.7 45.1 48.2 51.8 154.2 156.9 158.9 Indonesia 62.9 68.3 69.7 9.1 11.4 11.1 212.2 220.2 224.5 Iran, Islamic Republic of 26.1 26.8 26.8 5.4 5.6 4.7 198.0 196.6 197.5 Iraq 7.7 8.4 8.4 0.5 0.8 0.4 188.1 190.0 189.3 Japan 33.5 33.6 33.7 4.8 4.7 4.7 129.4 129.8 129.8 Kazakhstan 9.7 10.4 10.4 2.3 8.1 7.1 163.3 163.2 163.2 Korea, Republic of 17.2 17.6 17.8 3.7 4.0 4.2 126.0 125.4 124.9 Myanmar 20.6 20.8 21.1 5.3 4.1 3.6 249.9 250.8 250.7 Pakistan 30.2 30.7 30.8 3.3 3.0 3.2 150.9 149.2 150.0 Philippines 22.5 23.3 23.6 4.4 3.5 3.2 161.7 161.3 163.8 Saudi Arabia 13.5 14.6 14.6 3.5 3.3 2.7 147.1 151.2 150.7 Thailand 17.9 18.4 19.6 6.1 8.0 9.7 147.3 155.5 158.2 Turkey 32.8 34.2 33.1 4.2 4.6 4.3 224.8 223.1 220.5 Viet Nam 27.8 29.3 29.6 5.0 5.2 5.5 205.9 209.5 210.9
AFRICA 207.3 218.4 221.6 33.8 36.5 32.6 150.4 151.3 151.6Algeria 12.3 13.3 13.6 3.4 3.9 3.9 233.1 234.7 233.2 Egypt 34.5 36.1 36.7 6.3 7.5 7.6 267.9 267.1 266.5 Ethiopia 17.9 20.3 19.6 1.3 1.8 1.4 181.9 189.5 191.6 Morocco 12.6 13.6 12.8 2.4 3.9 2.7 244.7 246.8 246.3 Nigeria 29.3 30.9 31.4 1.6 1.8 1.3 141.6 143.7 143.9 South Africa 14.3 14.9 14.8 3.6 3.2 2.4 170.1 168.4 166.2 Sudan 7.1 6.4 7.2 1.9 0.7 0.6 140.3 138.1 141.7
CENTRAL AMERICA 63.8 64.1 64.0 5.3 4.0 4.4 166.5 166.8 165.8 Mexico 47.4 47.3 47.2 3.5 2.2 2.5 203.1 202.8 202.4
SOUTH AMERICA 118.1 126.5 128.8 20.2 20.8 23.6 121.8 121.6 120.3 Argentina 12.9 16.2 16.1 3.7 7.2 6.0 133.4 133.8 132.5 Brazil 67.9 71.6 73.8 9.2 6.5 10.4 114.6 114.2 114.3 Chile 6.2 6.4 6.1 0.6 0.6 0.6 151.6 151.1 136.8 Colombia 8.7 9.0 9.0 2.2 1.8 1.8 108.6 106.4 105.1 Peru 7.2 7.6 7.7 1.2 1.4 1.5 144.7 145.8 144.7 Venezuela 6.8 7.2 7.5 0.8 0.8 0.8 132.8 133.9 130.7
NORTH AMERICA 354.9 356.1 368.4 78.8 54.9 64.5 109.4 108.3 107.9Canada 28.7 28.8 29.0 12.5 9.1 10.2 98.2 96.1 96.5 United States of America 326.2 327.3 339.3 66.3 45.8 54.3 110.6 109.6 109.1
EUROPE 402.3 403.2 404.9 70.1 61.8 57.6 139.9 141.0 141.0 European Union 280.2 279.6 281.5 41.1 32.7 31.5 135.1 137.5 137.6 Russian Federation 68.9 68.6 68.5 17.8 12.7 10.3 144.9 142.9 142.7 Serbia 7.1 7.5 7.3 1.6 1.1 1.1 164.3 163.7 163.9 Ukraine 26.4 27.7 27.7 6.7 12.2 10.6 175.7 173.1 173.4
OCEANIA 16.8 18.3 18.4 7.7 10.2 9.0 91.7 92.1 91.2 Australia 14.7 16.1 16.2 7.3 9.7 8.5 101.7 102.3 101.5
WORLD 2 236.1 2 324.7 2 357.2 510.5 515.2 524.0 152.6 153.6 154.1Developing countries 1 382.8 1 465.7 1 483.7 339.1 366.8 372.6 157.5 158.6 159.3 Developed countries 853.3 858.9 873.5 171.4 148.5 151.5 132.8 133.1 132.9 LIFDCs 556.2 587.4 596.7 104.3 113.4 115.2 158.1 160.7 162.4 LDCs 165.0 173.1 176.7 31.8 33.8 32.2 149.2 151.3 152.9

Food Outlook
May 201272
Table A2 (a). Wheat statistics
Production Imports Exports
2008-2010 2011 2012
08/09-10/112011/12 2012/13
08/09-10/11 2011/12 2012/13
average average average estim. f’cast estim. f’cast estim. f’cast
(. . . . . . . . . . . . . . . . . . . . . . . . . . . . . . . . . . . . . . . . million tonnes . . . . . . . . . . . . . . . . . . . . . . . . . . . . . . . . . . . . . . .)
ASIA 287.8 313.4 302.2 60.6 61.9 59.4 13.5 17.1 15.7 Bangladesh 0.9 1.1 1.2 3.4 2.6 2.5 - - - China 114.3 117.9 115.5 2.6 3.8 3.8 0.1 0.2 0.2 of which Taiwan Prov. - - - 1.2 1.3 1.3 - - - India 80.0 86.9 88.3 0.1 0.2 0.1 - 2.0 2.5 Indonesia - - - 5.4 5.5 5.5 - - - Iran, Islamic Republic of 12.6 14.0 13.5 4.2 2.5 1.7 0.8 0.2 0.2 Iraq 1.8 2.1 1.9 3.5 3.7 3.5 - - - Japan 0.7 0.7 0.8 5.3 5.8 5.5 0.3 0.3 0.3 Kazakhstan 13.1 22.7 14.5 - - - 6.6 8.5 7.5 Korea, Republic of - - - 4.1 5.0 4.8 0.1 0.1 0.1 Pakistan 22.8 24.3 24.0 1.1 0.2 0.2 1.1 0.6 0.9 Philippines - - - 3.1 3.3 3.3 - - - Saudi Arabia 1.4 1.1 1.0 1.7 2.5 2.2 - - - Thailand - - - 1.5 1.8 1.7 0.1 0.2 0.2 Turkey 19.4 21.8 19.4 3.3 2.7 3.0 3.1 3.5 2.5
AFRICA 22.9 25.4 21.9 38.1 39.7 39.5 1.0 0.9 0.7Algeria 2.6 2.8 2.8 5.7 6.3 6.1 - - - Egypt 7.9 8.4 8.5 10.0 10.5 10.0 - - - Ethiopia 3.0 3.4 3.2 1.3 0.8 1.0 - - - Morocco 5.0 6.0 2.3 3.3 3.5 5.0 0.2 0.2 0.1 Nigeria 0.1 0.1 0.1 3.9 4.2 3.5 0.2 0.2 0.1 South Africa 1.9 1.9 1.7 1.4 1.6 1.6 0.2 0.2 0.2 Tunisia 1.1 1.6 1.8 1.8 2.0 1.5 0.1 0.1 0.1
CENTRAL AMERICA 4.0 3.7 3.6 7.1 8.3 8.3 1.0 0.9 0.8 Cuba - - - 0.8 0.8 0.8 - - - Mexico 4.0 3.7 3.6 3.4 4.5 4.5 0.9 0.8 0.8
SOUTH AMERICA 21.4 24.3 22.8 12.8 13.5 13.7 9.8 11.6 10.8 Argentina 11.1 13.4 13.0 - - - 7.0 9.0 8.5 Brazil 5.6 5.7 5.1 6.5 7.0 7.2 1.4 1.0 0.7 Chile 1.4 1.6 1.4 0.8 0.7 0.7 - - - Colombia - - - 1.4 1.4 1.4 - - - Peru 0.2 0.2 0.2 1.6 1.7 1.7 - - - Venezuela - - - 1.6 1.7 1.7 - - -
NORTH AMERICA 89.0 79.7 85.1 3.0 3.5 3.0 45.9 43.4 46.0Canada 26.2 25.3 26.1 0.1 - - 17.3 17.4 17.5 United States of America 62.8 54.4 59.0 2.9 3.5 3.0 28.6 26.0 28.5
EUROPE 225.8 223.8 213.2 7.9 9.8 10.3 45.2 43.1 41.9 European Union 141.9 137.9 135.0 5.8 7.5 8.0 22.6 16.0 15.0 Russian Federation 55.7 56.2 56.8 0.1 - - 13.5 21.5 21.5 Ukraine 21.2 22.3 14.0 - 0.2 0.2 8.5 5.2 5.0
OCEANIA 24.0 29.8 26.3 0.7 0.7 0.7 15.1 20.5 19.0 Australia 23.7 29.5 26.0 - - - 15.1 20.5 19.0
WORLD 674.9 700.0 675.1 130.3 137.4 135.0 131.5 137.4 135.0Developing countries 309.2 330.0 321.8 105.3 108.2 106.5 17.9 21.0 19.6 Developed countries 365.7 370.0 353.3 25.0 29.2 28.5 113.6 116.5 115.4 LIFDCs 113.4 121.0 123.5 51.0 51.6 50.0 1.0 2.9 3.3 LDCs 10.8 10.8 11.4 16.1 15.1 15.0 0.1 - -

Statistical tables
May 2012 73
Table A2 (b). Wheat statistics
Total Utilization Stocks ending in Per caput food use
08/09-10/11 2011/12 2012/13
2009-20112012 2013
08/09-10/11 2011/12 2012/13
average average average estim. f’cast estim. f’cast estim. f’cast
(. . . . . . . . . . . . . . . . . . . . . . . . . . million tonnes . . . . . . . . . . . . . . . . . . . . .) (. . . . . . . . . . Kg/year . . . . . . . .)
ASIA 330.4 352.3 352.1 97.9 105.6 99.0 64.4 64.8 64.8 Bangladesh 3.3 3.6 3.7 2.3 3.7 3.7 19.2 20.3 20.6 China 114.9 125.4 124.3 49.3 46.7 41.6 64.6 63.4 62.9 of which Taiwan Prov. 1.2 1.3 1.3 0.3 0.4 0.4 47.0 47.2 47.2 India 79.9 84.6 84.9 19.3 19.0 20.0 60.1 62.0 62.3 Indonesia 5.2 5.4 5.4 2.6 2.9 3.0 19.2 19.6 19.7 Iran, Islamic Republic of 15.3 15.8 15.9 4.1 4.6 3.7 165.3 165.2 165.2 Iraq 5.4 5.6 5.7 0.3 0.6 0.2 141.3 141.5 141.6 Japan 5.8 5.9 6.0 0.6 0.7 0.6 41.3 42.1 42.3 Kazakhstan 7.1 7.7 7.7 2.1 7.6 6.9 147.8 147.0 147.2 Korea, Republic of 4.1 4.8 4.6 0.6 1.0 1.2 48.6 49.3 49.1 Pakistan 23.1 23.4 23.5 1.4 1.4 1.3 126.2 126.1 126.3 Philippines 3.0 3.0 3.0 0.6 0.6 0.6 26.5 25.2 25.2 Saudi Arabia 2.9 3.6 3.7 1.7 1.8 1.3 102.7 102.6 102.4 Thailand 1.3 1.6 1.5 0.3 0.4 0.4 13.9 15.9 15.1 Turkey 19.4 20.5 20.2 2.2 2.8 2.5 197.7 195.7 193.3
AFRICA 58.9 62.8 62.1 14.2 16.3 15.0 50.8 50.9 50.4Algeria 8.3 9.0 9.0 2.6 3.2 3.2 210.8 212.7 211.5 Egypt 17.0 18.2 18.3 4.1 5.2 5.3 182.7 182.8 183.0 Ethiopia 4.3 4.4 4.3 0.4 0.2 0.2 44.3 44.6 45.1 Morocco 8.0 8.6 7.9 1.3 2.4 1.7 190.7 192.2 192.3 Nigeria 3.6 4.1 3.9 0.6 0.7 0.3 19.4 20.7 20.2 South Africa 3.0 3.1 3.1 0.6 0.6 0.6 57.8 56.8 56.3 Tunisia 3.0 3.0 3.2 0.9 1.3 1.3 216.8 216.7 217.4
CENTRAL AMERICA 10.1 11.1 10.7 1.0 0.8 1.2 45.6 45.5 44.9 Cuba 0.8 0.8 0.8 - - - 57.4 57.3 57.3 Mexico 6.4 7.4 7.0 0.5 0.3 0.6 50.8 50.6 50.1
SOUTH AMERICA 25.0 26.2 25.6 5.4 7.0 7.0 59.8 60.1 59.0 Argentina 5.0 5.1 5.1 2.1 3.7 3.1 116.7 116.9 115.7 Brazil 10.7 11.3 11.0 1.2 0.8 1.4 52.2 52.3 52.3 Chile 2.2 2.3 2.1 0.2 0.2 0.2 121.2 121.3 107.0 Colombia 1.3 1.4 1.4 0.2 0.2 0.2 27.2 27.8 27.4 Peru 1.7 1.8 1.8 0.3 0.5 0.6 57.4 57.5 56.9 Venezuela 1.6 1.7 1.7 0.2 0.2 0.2 56.2 57.0 54.4
NORTH AMERICA 39.6 41.1 39.9 29.8 28.1 30.0 80.2 79.8 79.7Canada 7.6 8.8 8.3 7.2 6.5 6.5 82.2 80.4 81.1 United States of America 32.0 32.3 31.6 22.6 21.6 23.5 80.0 79.8 79.5
EUROPE 184.8 188.3 187.1 33.8 30.7 24.6 112.6 113.0 113.1 European Union 125.0 128.2 127.4 15.4 11.4 11.5 111.6 112.6 112.8 Russian Federation 38.9 38.8 38.5 12.9 9.2 6.1 112.4 111.3 111.2 Ukraine 12.6 12.9 12.8 3.6 8.0 4.4 124.4 123.4 123.4
OCEANIA 8.0 8.8 8.9 4.6 6.8 5.9 69.5 69.1 68.3 Australia 7.0 7.8 7.9 4.2 6.4 5.5 82.7 82.8 82.0
WORLD 656.7 690.7 686.5 186.8 195.3 182.7 67.6 67.7 67.5Developing countries 391.2 417.8 415.6 111.5 115.8 108.7 60.2 60.4 60.2 Developed countries 265.5 272.8 270.9 75.3 79.5 73.9 97.3 97.5 97.5 LIFDCs 159.6 168.9 169.6 42.1 44.7 45.1 49.3 50.3 50.4 LDCs 25.4 26.8 26.8 8.3 8.6 8.3 26.9 27.8 27.6

Food Outlook
May 201274
Table A3 (a). Coarse grain statistics
Production Imports Exports
2008-2010 2011 2012
08/09-10/112011/12 2012/13
08/09-10/11 2011/12 2012/13
average average average estim. f’cast estim. f’cast estim. f’cast
(. . . . . . . . . . . . . . . . . . . . . . . . . . . . . . . . . . . . . . . . million tonnes . . . . . . . . . . . . . . . . . . . . . . . . . . . . . . . . . . . . . . .)
ASIA 288.1 318.3 314.2 62.4 65.8 69.1 4.5 5.2 4.9 China 178.4 201.2 199.4 7.3 10.5 12.0 0.2 0.1 0.1 of which Taiwan Prov. 0.1 0.1 0.1 4.5 4.5 4.7 - - - India 38.9 42.1 41.1 - 0.1 0.1 2.1 2.5 2.5 Indonesia 17.4 17.6 17.7 1.1 1.9 1.9 0.1 0.1 0.1 Iran, Islamic Republic of 3.6 4.3 4.2 4.6 4.0 4.0 - - - Japan 0.2 0.2 0.2 19.3 19.0 19.4 - - - Korea, D.P.R. 1.9 2.0 2.1 0.2 0.2 0.1 - - - Korea, Republic of 0.3 0.3 0.3 8.1 7.5 8.4 - - - Malaysia 0.1 0.1 0.1 2.8 2.8 2.8 - - - Pakistan 3.9 4.1 4.1 - - - - - - Philippines 6.8 7.3 7.3 0.4 0.3 0.4 - - - Saudi Arabia 0.5 0.5 0.5 8.9 9.3 9.0 - - - Thailand 4.4 4.4 4.4 0.5 0.6 0.6 0.6 0.7 0.7 Turkey 11.7 12.5 11.8 0.6 0.5 0.5 0.2 0.3 0.3 Viet Nam 4.6 4.7 4.8 1.3 1.7 1.7 - - -
AFRICA 114.8 114.5 116.2 16.4 17.4 18.8 5.5 6.9 6.0Algeria 1.5 1.5 1.6 2.4 2.7 2.9 - - - Egypt 8.3 8.2 8.4 5.4 6.1 6.1 - - - Ethiopia 14.1 17.1 15.2 0.2 - - 0.5 1.0 0.3 Kenya 2.9 3.0 3.3 1.0 0.9 1.1 - - - Morocco 2.8 2.6 1.1 2.1 2.3 3.3 - - - Nigeria 21.8 22.3 22.8 0.1 0.2 0.2 0.4 0.4 0.4 South Africa 13.3 11.5 12.2 0.1 0.3 0.2 2.1 2.3 2.3 Sudan 4.4 2.3 4.2 0.3 0.9 0.5 0.1 - - Tanzania, United Rep. of 4.8 4.6 4.8 0.1 0.1 0.1 0.1 - -
CENTRAL AMERICA 34.7 31.6 34.0 15.6 15.7 15.4 0.4 0.1 0.1 Mexico 30.0 26.7 29.0 10.6 10.8 10.5 0.3 0.1 0.1
SOUTH AMERICA 95.4 104.3 110.0 10.6 11.8 11.2 25.5 28.6 28.5 Argentina 24.4 31.9 28.2 - - - 15.7 17.8 16.9 Brazil 57.9 59.0 68.3 1.2 1.2 0.7 8.3 9.0 10.0 Chile 1.8 1.8 1.8 2.0 2.1 2.1 0.1 0.1 0.1 Colombia 1.7 1.8 1.9 3.5 3.8 3.8 - - - Peru 1.8 1.8 1.8 1.6 1.9 1.9 - - - Venezuela 2.8 2.8 3.0 1.5 1.8 1.8 - - -
NORTH AMERICA 359.4 345.9 383.4 4.6 4.0 3.7 56.1 47.6 54.0Canada 24.2 21.9 24.8 1.9 1.4 1.3 3.6 3.2 4.0 United States of America 335.3 324.0 358.6 2.6 2.6 2.4 52.5 44.5 50.0
EUROPE 228.2 235.3 236.3 6.8 6.0 7.6 19.7 27.8 28.1 European Union 153.2 148.5 149.1 5.3 4.8 6.4 4.9 5.2 5.5 Russian Federation 31.6 34.2 34.3 0.4 0.3 0.2 2.7 4.4 4.4 Serbia 7.1 6.8 6.5 - - - 1.5 1.5 1.0 Ukraine 24.1 33.5 33.5 - - - 10.5 16.4 16.8
OCEANIA 13.3 13.9 13.2 0.3 0.2 0.2 4.6 5.0 4.4 Australia 12.8 13.4 12.7 - - - 4.6 5.0 4.4
WORLD 1 134.0 1 163.9 1 207.3 116.6 121.1 126.0 116.3 121.3 126.0Developing countries 514.5 551.0 556.8 83.7 89.7 93.0 33.3 37.9 36.9 Developed countries 619.6 612.9 650.5 32.9 31.4 33.0 82.9 83.4 89.1 LIFDCs 173.7 180.7 182.0 14.6 16.1 16.7 6.0 7.7 6.8 LDCs 66.4 67.6 69.2 2.7 3.0 2.6 3.1 4.3 3.5

Statistical tables
May 2012 75
Table A3 (b). Coarse grain statistics
Total Utilization Stocks ending in Per caput food use
08/09-10/11 2011/12 2012/13
2009-20112012 2013
08/09-10/11 2011/12 2012/13
average average average estim. f’cast estim. f’cast estim. f’cast
(. . . . . . . . . . . . . . . . . . . . . . . . . . million tonnes . . . . . . . . . . . . . . . . . . . . .) (. . . . . . . . . . Kg/year . . . . . . . .)
ASIA 344.7 373.0 378.3 68.8 75.3 75.2 15.7 16.0 15.9 China 183.8 204.9 210.9 47.4 54.4 54.7 10.7 10.9 10.8 of which Taiwan Prov. 4.8 4.7 4.7 0.4 0.3 0.3 7.0 7.0 7.0 India 36.2 38.8 38.3 3.8 4.7 4.8 22.1 22.9 22.8 Indonesia 17.9 19.6 19.9 2.1 2.5 2.2 34.0 35.0 34.9 Iran, Islamic Republic of 8.2 8.4 8.2 1.0 0.7 0.7 1.4 1.3 1.3 Japan 19.6 19.6 19.5 1.7 1.4 1.4 29.2 29.3 29.3 Korea, D.P.R. 2.1 2.2 2.3 - 0.1 0.1 74.9 71.4 72.0 Korea, Republic of 8.4 8.2 8.6 1.9 1.7 1.7 4.4 4.3 4.3 Malaysia 2.9 3.0 2.9 0.3 0.1 0.1 1.7 1.6 1.6 Pakistan 4.0 4.2 4.1 1.1 1.0 1.0 9.7 9.5 9.4 Philippines 7.2 7.6 7.6 0.8 0.5 0.5 15.6 16.6 16.7 Saudi Arabia 9.6 9.8 9.6 1.7 1.4 1.3 3.7 3.6 3.5 Thailand 4.4 4.3 4.3 0.2 0.2 0.2 2.7 2.7 2.7 Turkey 12.5 12.9 12.0 1.9 1.7 1.7 17.0 16.7 16.5 Viet Nam 5.8 6.3 6.5 0.7 0.8 0.8 5.2 5.5 5.5
AFRICA 123.0 128.3 131.4 16.4 16.9 14.4 77.8 77.7 78.5Algeria 3.9 4.3 4.5 0.8 0.7 0.7 20.0 19.7 19.4 Egypt 13.7 14.0 14.5 0.9 1.0 1.0 46.8 45.8 45.0 Ethiopia 13.5 15.8 15.2 0.9 1.6 1.2 136.7 143.9 145.5 Kenya 3.9 4.1 4.3 0.8 0.4 0.5 85.6 85.6 85.8 Morocco 4.6 4.9 4.9 1.1 1.5 1.0 52.9 53.5 52.9 Nigeria 21.4 22.1 22.7 0.7 0.7 0.6 98.0 97.9 98.5 South Africa 10.4 10.9 10.8 3.0 2.6 1.8 95.8 95.1 93.0 Sudan 4.9 3.7 4.6 0.5 - 0.1 89.3 78.4 84.8 Tanzania, United Rep. of 4.8 4.9 5.1 0.8 0.6 0.4 87.6 86.8 86.7
CENTRAL AMERICA 49.9 49.0 49.2 3.9 2.8 2.9 102.2 102.2 101.6 Mexico 40.2 39.1 39.3 2.9 1.9 1.9 145.1 144.7 144.6
SOUTH AMERICA 77.8 84.8 87.7 13.4 12.7 15.6 26.0 25.8 25.8 Argentina 7.5 10.6 10.6 1.5 3.4 2.8 7.5 7.4 7.3 Brazil 49.0 51.9 54.6 7.8 5.4 8.8 22.0 21.8 22.1 Chile 3.8 3.9 3.8 0.4 0.3 0.3 18.9 18.9 18.7 Colombia 5.4 5.7 5.7 1.8 1.6 1.6 42.5 42.0 41.4 Peru 3.5 3.7 3.8 0.5 0.6 0.6 25.0 25.0 24.5 Venezuela 4.2 4.5 4.8 0.4 0.6 0.6 50.1 49.6 48.9
NORTH AMERICA 310.9 310.8 324.4 47.7 25.5 33.4 18.2 18.1 18.0Canada 20.8 19.7 20.4 5.2 2.6 3.7 5.9 5.6 5.6 United States of America 290.0 291.1 304.0 42.5 22.9 29.8 19.5 19.5 19.3
EUROPE 213.8 210.9 213.9 35.8 30.5 32.5 22.6 23.0 23.0 European Union 152.5 148.5 151.3 25.2 20.9 19.6 18.4 19.7 19.7 Russian Federation 29.4 29.1 29.3 4.9 3.4 4.2 28.2 26.9 26.9 Serbia 5.4 5.9 5.6 0.9 0.4 0.3 20.9 20.8 20.8 Ukraine 13.7 14.6 14.7 3.1 4.2 6.3 47.4 45.3 45.6
OCEANIA 8.3 8.8 8.8 3.1 3.4 3.1 8.2 8.1 8.1 Australia 7.5 8.0 8.0 3.0 3.3 3.0 10.6 10.4 10.2
WORLD 1 128.3 1 165.6 1 193.7 189.1 167.1 177.1 28.8 29.2 29.4Developing countries 558.7 597.8 609.3 97.3 102.8 104.0 30.1 30.6 30.8 Developed countries 569.6 567.8 584.4 91.8 64.4 73.1 23.4 23.6 23.4 LIFDCs 180.2 190.0 192.9 21.1 22.7 21.6 40.3 40.9 41.4 LDCs 64.6 67.8 69.4 9.1 10.5 9.5 56.1 56.7 57.9

Food Outlook
May 201276
Table A4 (a). Maize statistics
Production Imports Exports
2008-2010 2011 2012
08/09-10/112011/12 2012/13
08/09-10/11 2011/12 2012/13
average average average estim. f’cast estim. f’cast estim. f’cast
(. . . . . . . . . . . . . . . . . . . . . . . . . . . . . . . . . . . . . . . . million tonnes . . . . . . . . . . . . . . . . . . . . . . . . . . . . . . . . . . . . . . .)
ASIA 241.2 268.0 265.4 46.0 49.6 52.9 3.9 4.3 4.4 China 169.1 191.8 190.0 5.0 8.1 9.6 0.1 0.1 0.1 of which Taiwan Prov. - - - 4.4 4.3 4.5 - - - India 19.4 21.6 20.6 - 0.1 0.1 2.1 2.5 2.5 Indonesia 17.4 17.6 17.7 1.0 1.8 1.8 0.1 0.1 0.1 Iran, Islamic Republic of 1.1 1.3 1.2 3.3 3.4 3.4 - - - Japan - - - 16.1 16.0 16.2 - - - Korea, D.P.R. 1.8 1.9 2.0 0.2 0.2 0.1 - - - Korea, Republic of 0.1 0.1 0.1 8.0 7.4 8.3 - - - Malaysia 0.1 0.1 0.1 2.8 2.8 2.8 - - - Pakistan 3.4 3.5 3.5 - - - - - - Philippines 6.8 7.3 7.3 0.3 0.3 0.3 - - - Thailand 4.3 4.2 4.2 0.5 0.6 0.6 0.6 0.7 0.7 Turkey 4.3 4.2 4.1 0.4 0.4 0.4 0.1 0.1 0.1 Viet Nam 4.6 4.7 4.8 1.2 1.6 1.6 - - -
AFRICA 62.5 64.6 64.4 13.9 14.9 15.9 4.2 5.1 4.7Algeria - - - 2.2 2.5 2.7 - - - Egypt 7.4 7.3 7.6 5.4 6.0 6.0 - - - Ethiopia 5.0 6.4 5.5 - - - 0.2 0.3 - Kenya 2.7 2.7 3.0 0.9 0.9 1.1 - - - Morocco 0.2 0.2 0.1 1.7 2.0 2.2 - - - Nigeria 8.8 9.5 9.5 0.1 0.2 0.2 0.3 0.3 0.3 South Africa 12.8 10.9 11.7 - 0.2 - 2.1 2.3 2.3 Tanzania, United Rep. of 3.8 3.6 3.8 - 0.1 0.1 0.1 - -
CENTRAL AMERICA 26.9 23.7 26.4 13.0 14.0 13.5 0.4 0.1 0.1 Mexico 22.6 19.2 21.8 8.1 9.0 8.5 0.3 0.1 0.1
SOUTH AMERICA 85.5 90.3 97.7 8.8 10.0 9.3 23.1 24.1 24.5 Argentina 19.3 22.9 20.3 - - - 13.5 13.5 13.0 Brazil 55.4 56.3 66.0 0.7 0.8 0.2 8.3 9.0 10.0 Chile 1.4 1.4 1.3 1.4 1.5 1.5 - - - Colombia 1.6 1.7 1.8 3.1 3.3 3.3 - - - Peru 1.5 1.5 1.5 1.5 1.8 1.8 - - - Venezuela 2.3 2.4 2.5 1.4 1.8 1.8 - - -
NORTH AMERICA 329.2 324.6 356.6 2.3 1.8 1.5 48.9 42.8 47.3 Canada 10.6 10.7 11.6 1.9 1.3 1.2 0.6 0.3 0.3 United States of America 318.6 313.9 345.0 0.4 0.5 0.3 48.3 42.5 47.0
EUROPE 87.1 108.2 105.4 5.4 4.5 6.0 8.6 18.4 18.0 European Union 59.4 66.6 64.0 4.6 4.0 5.5 1.4 2.0 2.0 Russian Federation 4.7 7.0 6.8 0.2 - - 0.6 1.2 1.2 Serbia 6.7 6.5 6.1 - - - 1.5 1.5 1.0 Ukraine 11.0 22.5 22.5 - - - 5.1 13.5 13.5
OCEANIA 0.5 0.5 0.6 - - - - - 0.1
WORLD 833.0 880.0 916.4 89.5 94.8 99.0 89.1 95.0 99.0Developing countries 401.7 433.8 440.3 64.4 71.1 74.0 29.4 31.5 31.4 Developed countries 431.3 446.2 476.1 25.1 23.6 25.0 59.7 63.5 67.6 LIFDCs 103.5 111.6 109.7 12.9 13.9 14.7 4.7 6.0 5.6 LDCs 33.4 36.8 35.6 1.9 1.8 1.8 2.0 2.7 2.4
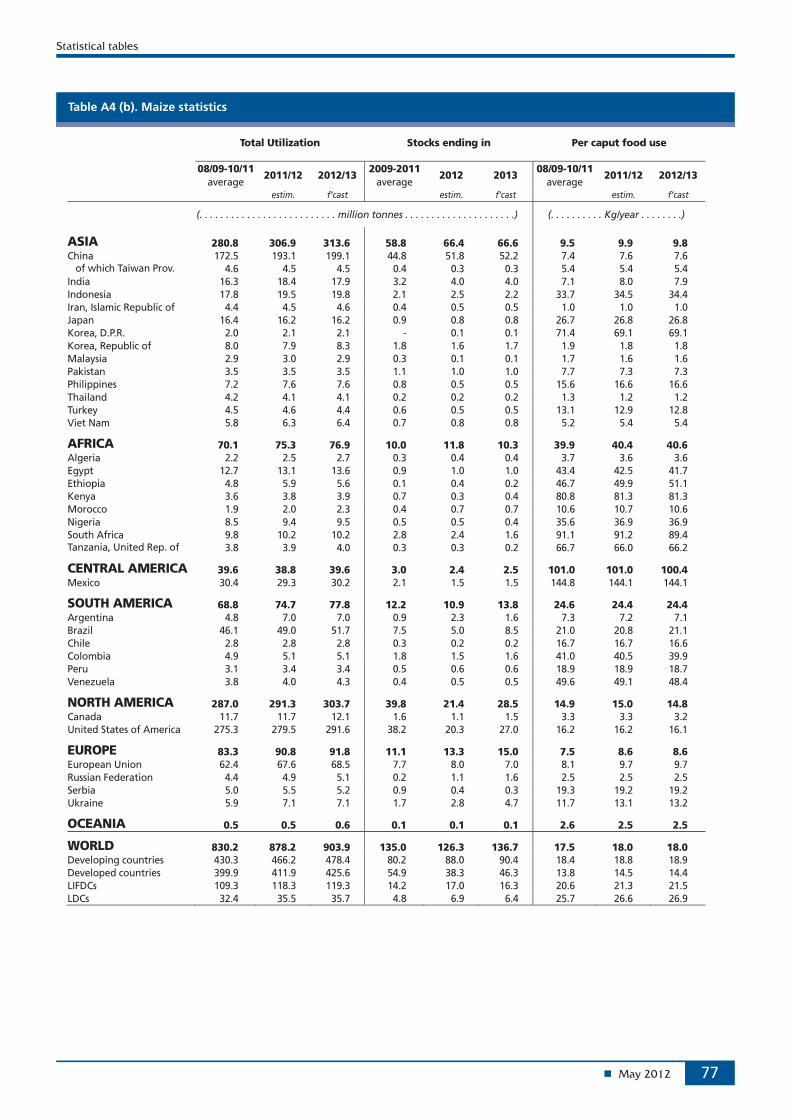
Statistical tables
May 2012 77
Table A4 (b). Maize statistics
Total Utilization Stocks ending in Per caput food use
08/09-10/11 2011/12 2012/13
2009-20112012 2013
08/09-10/11 2011/12 2012/13
average average average estim. f’cast estim. f’cast estim. f’cast
(. . . . . . . . . . . . . . . . . . . . . . . . . . million tonnes . . . . . . . . . . . . . . . . . . . . .) (. . . . . . . . . . Kg/year . . . . . . . .)
ASIA 280.8 306.9 313.6 58.8 66.4 66.6 9.5 9.9 9.8 China 172.5 193.1 199.1 44.8 51.8 52.2 7.4 7.6 7.6 of which Taiwan Prov. 4.6 4.5 4.5 0.4 0.3 0.3 5.4 5.4 5.4 India 16.3 18.4 17.9 3.2 4.0 4.0 7.1 8.0 7.9 Indonesia 17.8 19.5 19.8 2.1 2.5 2.2 33.7 34.5 34.4 Iran, Islamic Republic of 4.4 4.5 4.6 0.4 0.5 0.5 1.0 1.0 1.0 Japan 16.4 16.2 16.2 0.9 0.8 0.8 26.7 26.8 26.8 Korea, D.P.R. 2.0 2.1 2.1 - 0.1 0.1 71.4 69.1 69.1 Korea, Republic of 8.0 7.9 8.3 1.8 1.6 1.7 1.9 1.8 1.8 Malaysia 2.9 3.0 2.9 0.3 0.1 0.1 1.7 1.6 1.6 Pakistan 3.5 3.5 3.5 1.1 1.0 1.0 7.7 7.3 7.3 Philippines 7.2 7.6 7.6 0.8 0.5 0.5 15.6 16.6 16.6 Thailand 4.2 4.1 4.1 0.2 0.2 0.2 1.3 1.2 1.2 Turkey 4.5 4.6 4.4 0.6 0.5 0.5 13.1 12.9 12.8 Viet Nam 5.8 6.3 6.4 0.7 0.8 0.8 5.2 5.4 5.4
AFRICA 70.1 75.3 76.9 10.0 11.8 10.3 39.9 40.4 40.6Algeria 2.2 2.5 2.7 0.3 0.4 0.4 3.7 3.6 3.6 Egypt 12.7 13.1 13.6 0.9 1.0 1.0 43.4 42.5 41.7 Ethiopia 4.8 5.9 5.6 0.1 0.4 0.2 46.7 49.9 51.1 Kenya 3.6 3.8 3.9 0.7 0.3 0.4 80.8 81.3 81.3 Morocco 1.9 2.0 2.3 0.4 0.7 0.7 10.6 10.7 10.6 Nigeria 8.5 9.4 9.5 0.5 0.5 0.4 35.6 36.9 36.9 South Africa 9.8 10.2 10.2 2.8 2.4 1.6 91.1 91.2 89.4 Tanzania, United Rep. of 3.8 3.9 4.0 0.3 0.3 0.2 66.7 66.0 66.2
CENTRAL AMERICA 39.6 38.8 39.6 3.0 2.4 2.5 101.0 101.0 100.4 Mexico 30.4 29.3 30.2 2.1 1.5 1.5 144.8 144.1 144.1
SOUTH AMERICA 68.8 74.7 77.8 12.2 10.9 13.8 24.6 24.4 24.4 Argentina 4.8 7.0 7.0 0.9 2.3 1.6 7.3 7.2 7.1 Brazil 46.1 49.0 51.7 7.5 5.0 8.5 21.0 20.8 21.1 Chile 2.8 2.8 2.8 0.3 0.2 0.2 16.7 16.7 16.6 Colombia 4.9 5.1 5.1 1.8 1.5 1.6 41.0 40.5 39.9 Peru 3.1 3.4 3.4 0.5 0.6 0.6 18.9 18.9 18.7 Venezuela 3.8 4.0 4.3 0.4 0.5 0.5 49.6 49.1 48.4
NORTH AMERICA 287.0 291.3 303.7 39.8 21.4 28.5 14.9 15.0 14.8 Canada 11.7 11.7 12.1 1.6 1.1 1.5 3.3 3.3 3.2 United States of America 275.3 279.5 291.6 38.2 20.3 27.0 16.2 16.2 16.1
EUROPE 83.3 90.8 91.8 11.1 13.3 15.0 7.5 8.6 8.6 European Union 62.4 67.6 68.5 7.7 8.0 7.0 8.1 9.7 9.7 Russian Federation 4.4 4.9 5.1 0.2 1.1 1.6 2.5 2.5 2.5 Serbia 5.0 5.5 5.2 0.9 0.4 0.3 19.3 19.2 19.2 Ukraine 5.9 7.1 7.1 1.7 2.8 4.7 11.7 13.1 13.2
OCEANIA 0.5 0.5 0.6 0.1 0.1 0.1 2.6 2.5 2.5
WORLD 830.2 878.2 903.9 135.0 126.3 136.7 17.5 18.0 18.0Developing countries 430.3 466.2 478.4 80.2 88.0 90.4 18.4 18.8 18.9 Developed countries 399.9 411.9 425.6 54.9 38.3 46.3 13.8 14.5 14.4 LIFDCs 109.3 118.3 119.3 14.2 17.0 16.3 20.6 21.3 21.5 LDCs 32.4 35.5 35.7 4.8 6.9 6.4 25.7 26.6 26.9
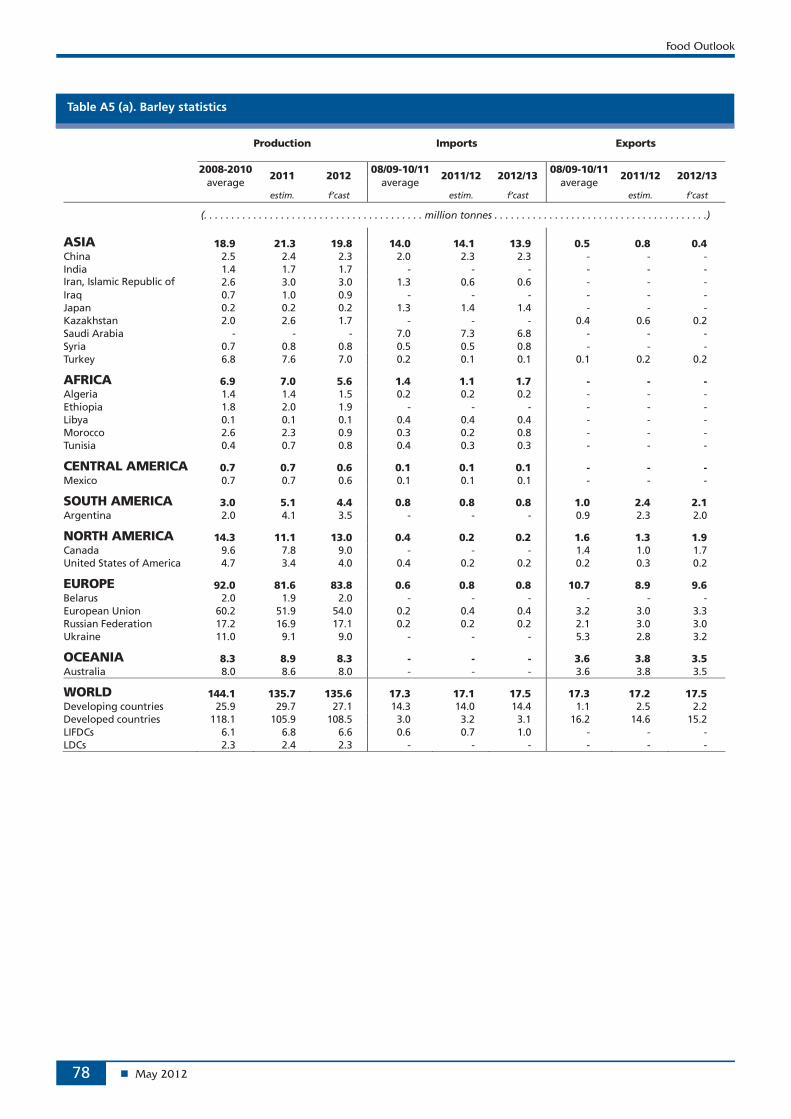
Food Outlook
May 201278
Table A5 (a). Barley statistics
Production Imports Exports
2008-2010 2011 2012
08/09-10/112011/12 2012/13
08/09-10/11 2011/12 2012/13
average average average estim. f’cast estim. f’cast estim. f’cast
(. . . . . . . . . . . . . . . . . . . . . . . . . . . . . . . . . . . . . . . . million tonnes . . . . . . . . . . . . . . . . . . . . . . . . . . . . . . . . . . . . . . .)
ASIA 18.9 21.3 19.8 14.0 14.1 13.9 0.5 0.8 0.4 China 2.5 2.4 2.3 2.0 2.3 2.3 - - - India 1.4 1.7 1.7 - - - - - - Iran, Islamic Republic of 2.6 3.0 3.0 1.3 0.6 0.6 - - - Iraq 0.7 1.0 0.9 - - - - - - Japan 0.2 0.2 0.2 1.3 1.4 1.4 - - - Kazakhstan 2.0 2.6 1.7 - - - 0.4 0.6 0.2 Saudi Arabia - - - 7.0 7.3 6.8 - - - Syria 0.7 0.8 0.8 0.5 0.5 0.8 - - - Turkey 6.8 7.6 7.0 0.2 0.1 0.1 0.1 0.2 0.2
AFRICA 6.9 7.0 5.6 1.4 1.1 1.7 - - -Algeria 1.4 1.4 1.5 0.2 0.2 0.2 - - - Ethiopia 1.8 2.0 1.9 - - - - - - Libya 0.1 0.1 0.1 0.4 0.4 0.4 - - - Morocco 2.6 2.3 0.9 0.3 0.2 0.8 - - - Tunisia 0.4 0.7 0.8 0.4 0.3 0.3 - - -
CENTRAL AMERICA 0.7 0.7 0.6 0.1 0.1 0.1 - - - Mexico 0.7 0.7 0.6 0.1 0.1 0.1 - - -
SOUTH AMERICA 3.0 5.1 4.4 0.8 0.8 0.8 1.0 2.4 2.1 Argentina 2.0 4.1 3.5 - - - 0.9 2.3 2.0
NORTH AMERICA 14.3 11.1 13.0 0.4 0.2 0.2 1.6 1.3 1.9Canada 9.6 7.8 9.0 - - - 1.4 1.0 1.7 United States of America 4.7 3.4 4.0 0.4 0.2 0.2 0.2 0.3 0.2
EUROPE 92.0 81.6 83.8 0.6 0.8 0.8 10.7 8.9 9.6 Belarus 2.0 1.9 2.0 - - - - - - European Union 60.2 51.9 54.0 0.2 0.4 0.4 3.2 3.0 3.3 Russian Federation 17.2 16.9 17.1 0.2 0.2 0.2 2.1 3.0 3.0 Ukraine 11.0 9.1 9.0 - - - 5.3 2.8 3.2
OCEANIA 8.3 8.9 8.3 - - - 3.6 3.8 3.5 Australia 8.0 8.6 8.0 - - - 3.6 3.8 3.5
WORLD 144.1 135.7 135.6 17.3 17.1 17.5 17.3 17.2 17.5Developing countries 25.9 29.7 27.1 14.3 14.0 14.4 1.1 2.5 2.2 Developed countries 118.1 105.9 108.5 3.0 3.2 3.1 16.2 14.6 15.2 LIFDCs 6.1 6.8 6.6 0.6 0.7 1.0 - - - LDCs 2.3 2.4 2.3 - - - - - -

Statistical tables
May 2012 79
Table A5 (b). Barley statistics
Total Utilization Stocks ending in Per caput food use
08/09-10/11 2011/12 2012/13
2009-20112012 2013
08/09-10/11 2011/12 2012/13
average average average estim. f’cast estim. f’cast estim. f’cast
(. . . . . . . . . . . . . . . . . . . . . . . . . . million tonnes . . . . . . . . . . . . . . . . . . . . .) (. . . . . . . . . . Kg/year . . . . . . . .)
ASIA 33.4 34.8 33.6 7.3 6.2 5.9 0.6 0.7 0.7 China 4.4 4.7 4.7 1.4 1.5 1.4 0.1 0.1 0.1 India 1.4 1.6 1.7 - - - 1.0 1.2 1.2 Iran, Islamic Republic of 3.8 3.9 3.6 0.6 0.2 0.2 0.4 0.4 0.4 Iraq 0.7 1.0 0.9 - 0.1 - 3.9 3.8 3.7 Japan 1.5 1.6 1.5 0.5 0.4 0.4 2.4 2.4 2.4 Kazakhstan 1.7 1.7 1.7 0.1 0.4 0.1 1.2 1.2 1.2 Saudi Arabia 7.2 7.3 6.9 1.6 1.3 1.2 1.1 1.0 1.0 Syria 1.5 1.6 1.6 1.2 0.5 0.5 12.4 12.2 12.2 Turkey 7.3 7.6 7.0 1.3 1.2 1.2 1.1 1.1 1.1
AFRICA 8.1 8.4 7.9 1.9 1.7 1.1 3.6 3.6 3.6Algeria 1.6 1.7 1.6 0.5 0.3 0.3 16.3 16.1 15.9 Ethiopia 1.8 2.0 1.9 0.2 0.2 0.1 18.3 19.0 18.7 Libya 0.5 0.5 0.5 - - - 12.8 12.3 12.0 Morocco 2.6 2.7 2.2 0.7 0.8 0.3 42.2 42.7 42.2 Tunisia 1.0 0.9 1.1 0.3 0.2 0.2 8.8 8.6 8.5
CENTRAL AMERICA 0.8 0.7 0.7 0.2 0.1 0.1 - - - Mexico 0.8 0.7 0.7 0.2 0.1 0.1 - - -
SOUTH AMERICA 2.6 3.0 2.9 0.3 0.6 0.6 0.5 0.5 0.5 Argentina 0.9 1.2 1.2 0.3 0.5 0.5 - - -
NORTH AMERICA 12.3 11.0 10.9 4.4 1.8 2.2 0.5 0.5 0.5Canada 7.5 6.6 6.8 2.3 0.8 1.2 0.4 0.3 0.3 United States of America 4.8 4.4 4.0 2.1 1.0 1.0 0.6 0.5 0.5
EUROPE 80.7 74.0 75.2 18.2 13.3 13.0 1.6 1.5 1.5 Belarus 2.0 1.9 1.9 0.3 0.1 0.1 - - - European Union 56.2 50.0 51.4 13.3 10.3 10.0 0.8 0.8 0.8 Russian Federation 15.1 14.4 14.4 3.1 1.5 1.3 0.4 0.3 0.3 Ukraine 5.7 5.9 5.7 1.2 1.2 1.3 14.5 13.6 13.6
OCEANIA 4.3 4.4 4.5 2.1 2.4 2.3 0.2 0.2 0.2 Australia 3.9 4.0 4.1 2.1 2.4 2.3 0.3 0.3 0.3
WORLD 142.1 136.3 135.6 34.4 26.1 25.1 1.1 1.2 1.2Developing countries 39.7 41.6 39.7 8.8 7.2 6.5 1.1 1.2 1.1 Developed countries 102.4 94.7 95.9 25.6 18.8 18.6 1.3 1.2 1.2 LIFDCs 7.1 7.8 7.7 1.7 1.2 1.1 1.2 1.3 1.3 LDCs 2.4 2.4 2.4 0.2 0.3 0.2 1.9 2.0 1.9

Food Outlook
May 201280
Table A6 (a). Sorghum statistics
Production Imports Exports
2008-2010 2011 2012
08/09-10/112011/12 2012/13
08/09-10/11 2011/12 2012/13
average average average estim. f’cast estim. f’cast estim. f’cast
(. . . . . . . . . . . . . . . . . . . . . . . . . . . . . . . . . . . . . . . . million tonnes . . . . . . . . . . . . . . . . . . . . . . . . . . . . . . . . . . . . . . .)
ASIA 9.9 9.1 10.1 1.8 1.6 1.8 0.1 0.1 0.1 China 2.0 2.1 2.1 0.1 0.1 0.1 - - - India 7.0 6.1 7.0 - - - - - - Japan - - - 1.5 1.3 1.5 - - -
AFRICA 26.4 24.3 26.7 1.0 1.3 1.1 0.8 0.8 0.6Burkina Faso 1.8 1.6 1.7 - - - 0.1 0.2 0.2 Ethiopia 3.4 4.1 3.8 0.2 - - 0.2 0.3 0.1 Nigeria 9.0 8.9 9.1 - - - 0.1 0.1 0.1 Sudan 3.8 1.9 3.6 0.3 0.8 0.4 0.1 - -
CENTRAL AMERICA 7.0 7.1 6.8 2.4 1.6 1.8 - - - Mexico 6.6 6.7 6.4 2.4 1.6 1.8 - - -
SOUTH AMERICA 5.6 7.5 6.6 0.7 0.9 0.9 1.4 2.0 1.9 Argentina 2.7 4.4 3.9 - - - 1.4 2.0 1.9 Brazil 1.8 1.9 1.5 - - - - - - Venezuela 0.4 0.5 0.5 - - - - - -
NORTH AMERICA 10.2 5.4 8.1 - - - 3.9 1.6 2.8United States of America 10.2 5.4 8.1 - - - 3.9 1.6 2.8
EUROPE 0.6 0.7 0.7 0.5 0.2 0.3 - - - European Union 0.6 0.7 0.7 0.4 0.1 0.2 - - -
OCEANIA 2.7 2.1 2.3 0.1 0.1 0.1 0.8 1.0 0.7 Australia 2.7 2.1 2.3 - - - 0.8 1.0 0.7
WORLD 62.3 56.2 61.2 6.6 5.7 6.0 7.0 5.5 6.0Developing countries 48.6 47.9 50.0 4.3 4.0 4.0 2.2 2.9 2.5 Developed countries 13.7 8.4 11.2 2.3 1.7 2.0 4.7 2.6 3.5 LIFDCs 33.6 30.8 34.1 1.0 1.2 0.9 0.8 0.8 0.6 LDCs 15.6 13.9 16.0 0.8 1.1 0.7 0.7 0.7 0.5
Table A7 (a). Other coarse grain statistics - millet, rye, oats and other grains
Production Imports Exports
2008-2010 2011 2012
08/09-10/112011/12 2012/13
08/09-10/11 2011/12 2012/13
average average average estim. f’cast estim. f’cast estim. f’cast
(. . . . . . . . . . . . . . . . . . . . . . . . . . . . . . . . . . . . . . . . million tonnes . . . . . . . . . . . . . . . . . . . . . . . . . . . . . . . . . . . . . . .)
ASIA 18.1 19.9 18.9 0.5 0.6 0.6 - - -
AFRICA 19.1 18.6 19.5 0.1 0.1 0.1 0.5 0.9 0.7
CENTRAL AMERICA 0.1 0.2 0.1 0.1 0.1 0.1 - - -
SOUTH AMERICA 1.4 1.4 1.4 0.2 0.2 0.2 0.1 0.1 0.1
NORTH AMERICA 5.7 4.7 5.7 1.8 2.0 1.9 1.7 1.9 2.0
EUROPE 48.6 44.8 46.5 0.3 0.5 0.5 0.4 0.5 0.5
OCEANIA 1.8 2.4 2.0 0.1 0.1 0.1 0.2 0.2 0.2
WORLD 94.7 92.0 94.1 3.1 3.5 3.5 2.9 3.7 3.5

Statistical tables
May 2012 81
Table A6 (b). Sorghum statistics
Total Utilization Stocks ending in Per caput food use
08/09-10/11 2011/12 2012/13
2009-20112012 2013
08/09-10/11 2011/12 2012/13
average average average estim. f’cast estim. f’cast estim. f’cast
(. . . . . . . . . . . . . . . . . . . . . . . . . . million tonnes . . . . . . . . . . . . . . . . . . . . .) (. . . . . . . . . . Kg/year . . . . . . . .)
ASIA 11.7 10.7 11.8 1.5 1.6 1.6 1.8 1.5 1.7 China 2.1 2.2 2.2 0.8 0.7 0.7 0.4 0.4 0.4 India 7.2 5.9 6.9 0.2 0.4 0.5 5.4 4.2 5.0 Japan 1.4 1.5 1.5 0.3 0.2 0.2 - - -
AFRICA 26.5 26.1 27.2 2.5 1.4 1.4 20.1 19.8 20.0Burkina Faso 1.6 1.6 1.6 0.2 0.1 0.1 85.8 80.5 73.8 Ethiopia 3.3 3.9 3.6 0.2 0.2 0.3 32.7 34.6 35.0 Nigeria 9.0 8.9 9.1 0.1 0.1 0.1 43.9 43.4 43.5 Sudan 4.1 3.1 3.9 0.4 - 0.1 75.1 66.7 71.1
CENTRAL AMERICA 9.3 9.3 8.6 0.7 0.3 0.3 0.9 0.9 0.9 Mexico 8.8 8.8 8.2 0.7 0.3 0.3 - - -
SOUTH AMERICA 4.9 5.6 5.5 0.7 1.1 1.1 0.1 0.1 0.1 Argentina 1.3 1.9 1.9 0.3 0.6 0.7 - - - Brazil 1.8 1.7 1.6 0.2 0.3 0.2 - - - Venezuela 0.5 0.5 0.5 - 0.1 0.1 - - -
NORTH AMERICA 6.5 3.9 5.0 1.0 0.7 1.0 - - -United States of America 6.5 3.9 5.0 1.0 0.7 1.0 - - -
EUROPE 1.2 1.1 1.0 0.4 0.2 0.2 0.3 0.3 0.3 European Union 1.1 1.0 0.9 0.4 0.2 0.2 0.4 0.4 0.4
OCEANIA 1.9 1.8 1.9 0.7 0.4 0.3 0.2 0.2 0.2 Australia 1.7 1.7 1.7 0.7 0.4 0.3 - - -
WORLD 62.0 58.5 61.0 7.6 5.7 5.9 4.1 4.0 4.2Developing countries 50.7 49.9 51.4 5.1 4.2 4.2 5.1 4.9 5.1 Developed countries 11.3 8.6 9.6 2.5 1.5 1.7 0.3 0.3 0.3 LIFDCs 33.9 32.3 34.4 2.7 1.9 2.0 9.6 9.1 9.6 LDCs 15.6 15.5 16.2 2.1 1.2 1.3 14.7 14.5 14.9
Table A7 (b). Other coarse grain statistics - millet, rye, oats and other grains
Total Utilization Stocks ending in Per caput food use
08/09-10/11 2011/12 2012/13
2009-20112012 2013
08/09-10/11 2011/12 2012/13
average average average estim. f’cast estim. f’cast estim. f’cast
(. . . . . . . . . . . . . . . . . . . . . . . . . . million tonnes . . . . . . . . . . . . . . . . . . . . .) (. . . . . . . . . . Kg/year . . . . . . . .)
ASIA 18.7 20.6 19.4 1.2 1.1 1.1 3.7 4.0 3.8
AFRICA 18.3 18.5 19.4 2.0 2.1 1.6 14.2 14.0 14.4
CENTRAL AMERICA 0.2 0.3 0.2 - - - 0.2 0.3 0.3
SOUTH AMERICA 1.5 1.5 1.5 0.1 0.1 0.1 0.9 0.8 0.8
NORTH AMERICA 5.1 4.6 4.8 2.5 1.6 1.8 2.7 2.6 2.6
EUROPE 48.5 45.0 45.9 6.1 3.7 4.3 13.2 12.6 12.6
OCEANIA 1.7 2.1 1.9 0.2 0.5 0.4 5.2 5.2 5.2
WORLD 93.9 92.6 93.1 12.0 9.1 9.4 6.0 6.1 6.0

Food Outlook
May 201282
Table A8 (a). Rice statistics
Production Imports Exports
08/09-10/11 2011/12 2012/13
2008-20102011 2012
2008-2010 2011 2012
average average average estim. f’cast estim. f’cast estim. f’cast
(. . . . . . . . . . . . . . . . . . . . . . . . . . . . . . . . million tonnes, milled equivalent . . . . . . . . . . . . . . . . . . . . . . . . . . . . . . .)
ASIA 416.7 434.9 443.8 14.3 17.5 15.8 23.6 27.5 27.2 Bangladesh 32.4 33.7 34.5 0.8 1.5 0.6 - - - China 134.2 138.7 139.5 1.0 1.2 1.6 0.9 0.6 0.5 of which Taiwan Prov. 1.1 1.1 1.1 0.3 0.2 0.2 0.1 - 0.1 India 94.8 103.4 105.0 0.1 0.1 0.1 2.6 4.0 6.3 Indonesia 40.2 41.2 42.8 0.5 2.8 1.5 - - - Iran, Islamic Republic of 1.4 1.5 1.5 1.2 1.1 1.1 - - - Iraq 0.1 0.1 0.1 1.0 1.2 1.3 - - - Japan 7.8 7.6 7.6 0.6 0.7 0.7 0.2 0.1 0.2 Korea, D.P.R. 1.5 1.6 1.6 0.1 0.2 0.3 - - - Korea, Republic of 4.7 4.2 4.1 0.3 0.3 0.4 - - - Malaysia 1.6 1.7 1.7 1.1 1.0 1.1 - - - Myanmar 19.4 18.9 19.5 - - - 0.7 0.8 0.7 Pakistan 6.2 6.9 7.2 - 0.1 - 3.1 3.1 3.5 Philippines 10.8 11.1 11.5 2.2 1.2 0.9 - - - Saudi Arabia - - - 1.0 1.3 1.3 - - - Sri Lanka 2.7 2.6 3.1 0.1 - - - - - Thailand 21.9 20.9 23.2 0.3 0.4 0.4 9.2 10.6 7.5 Viet Nam 26.2 28.2 28.3 0.4 0.6 0.6 5.9 7.1 7.2
AFRICA 15.9 16.6 17.1 9.7 11.1 11.4 0.7 0.3 0.4Cote d’Ívoire 0.4 0.4 0.4 0.8 1.0 1.0 - - - Egypt 4.1 4.0 4.1 - 0.4 0.4 0.5 0.2 0.3 Madagascar 3.0 2.9 2.7 0.1 0.2 0.3 - - - Nigeria 2.2 2.7 2.8 2.0 2.2 2.0 - - - Senegal 0.4 0.3 0.4 0.8 0.8 0.9 - - - South Africa - - - 0.8 0.9 1.0 - - - Tanzania, United Rep. of 0.9 0.9 0.9 0.1 0.1 0.1 - - -
CENTRAL AMERICA 1.8 1.8 1.8 2.1 2.2 2.3 - 0.1 0.1 Cuba 0.3 0.3 0.3 0.5 0.5 0.5 - - - Mexico 0.2 0.1 0.1 0.6 0.7 0.7 - - -
SOUTH AMERICA 16.4 17.7 16.4 1.1 1.3 1.6 2.3 3.5 2.6 Argentina 0.9 1.2 1.0 - - - 0.4 0.6 0.6 Brazil 8.1 9.1 7.8 0.6 0.6 0.9 0.5 1.3 0.6 Peru 1.9 1.8 1.8 0.1 0.2 0.2 - - - Uruguay 0.9 1.2 1.1 - - - 0.8 0.9 0.9
NORTH AMERICA 7.1 5.9 5.7 1.0 1.0 1.1 3.4 3.2 3.1Canada - - - 0.3 0.3 0.3 - - - United States of America 7.1 5.9 5.7 0.6 0.6 0.7 3.4 3.2 3.1
EUROPE 2.5 2.8 2.7 1.7 1.6 1.7 0.3 0.5 0.6 European Union 1.8 1.8 1.8 1.2 1.2 1.3 0.2 0.3 0.3 Russian Federation 0.6 0.8 0.8 0.2 0.2 0.2 0.1 0.2 0.3
OCEANIA 0.1 0.5 0.6 0.5 0.4 0.4 0.1 0.3 0.4 Australia 0.1 0.5 0.6 0.2 0.1 0.1 0.1 0.3 0.4
WORLD 460.5 480.1 488.2 30.4 35.2 34.3 30.3 35.2 34.3Developing countries 442.6 462.8 470.9 25.7 30.5 29.4 26.4 31.2 30.0 Developed countries 17.9 17.3 17.3 4.7 4.7 4.9 4.0 4.1 4.3 LIFDCs 208.9 222.3 227.6 14.9 18.5 16.3 4.3 5.4 8.0 LDCs 71.0 73.3 75.0 6.4 7.4 6.8 1.8 2.0 2.1

Statistical tables
May 2012 83
Table A8 (b). Rice statistics
Total Utilization Stocks ending in Per caput food use
07/08-09/10 2010/11 2011/12
2008-20102011 2012
07/08-09/10 2010/11 2011/12
average average average estim. f’cast estim. f’cast estim. f’cast
(. . . . . . . . . . . . . . . . . million tonnes, milled equivalent . . . . . . . . . . . . .) (. . . . . . . . . . Kg/year . . . . . . . .)
ASIA 390.8 405.2 412.8 119.2 134.2 146.2 81.6 81.7 82.3 Bangladesh 31.2 33.5 34.1 5.1 6.8 7.0 149.0 153.0 154.2 China 127.3 130.8 132.1 64.3 75.6 83.2 77.1 76.8 76.7 of which Taiwan Prov. 1.3 1.3 1.3 0.2 0.2 0.1 51.1 54.0 53.3 India 90.0 91.6 94.2 21.1 21.5 24.5 72.5 71.3 72.0 Indonesia 38.1 42.1 43.3 3.6 5.3 6.0 157.2 162.0 165.7 Iran, Islamic Republic of 2.7 2.5 2.6 0.3 0.3 0.3 32.3 29.7 30.0 Iraq 1.2 1.3 1.4 - 0.1 0.1 39.5 40.4 42.6 Japan 8.3 8.0 8.1 2.3 2.7 2.7 59.8 58.7 58.4 Korea, D.P.R. 1.5 1.7 2.0 - 0.1 0.1 57.7 64.0 72.3 Korea, Republic of 4.8 4.7 4.6 1.0 1.4 1.3 74.2 72.2 71.7 Malaysia 2.5 2.6 2.7 0.2 0.2 0.2 83.1 85.6 85.9 Myanmar 19.0 19.2 19.1 5.5 4.8 3.9 237.9 240.0 239.0 Pakistan 3.2 2.6 3.1 0.8 0.3 0.6 15.2 13.1 13.6 Philippines 12.3 12.4 12.7 2.8 3.0 2.4 119.7 119.4 119.5 Saudi Arabia 1.1 1.2 1.3 0.2 0.2 0.2 39.4 43.2 45.0 Sri Lanka 2.5 2.8 2.8 0.2 0.4 0.3 110.9 118.1 118.1 Thailand 11.8 12.8 12.6 5.0 6.2 7.4 128.7 133.5 136.8 Viet Nam 20.2 20.8 21.3 4.0 2.7 3.1 186.2 186.9 187.4
AFRICA 24.1 26.9 27.3 3.0 3.2 3.3 21.4 22.4 22.6Cote d’Ívoire 1.3 1.4 1.4 - - - 58.3 61.5 60.2 Egypt 3.8 3.8 3.9 1.3 1.1 1.3 38.4 38.3 38.5 Madagascar 2.8 3.3 3.1 0.1 0.2 0.2 124.5 128.2 126.6 Nigeria 4.1 4.6 4.7 0.3 0.4 0.4 23.8 25.1 25.1 Senegal 1.1 1.1 1.2 0.1 0.1 0.1 79.2 79.4 79.9 South Africa 0.9 0.8 0.9 0.1 - - 17.0 15.9 16.5 Tanzania, United Rep. of 0.9 1.0 1.0 - - - 18.2 17.5 17.4
CENTRAL AMERICA 3.8 4.0 4.0 0.4 0.4 0.4 18.7 19.1 19.1 Cuba 0.8 0.8 0.8 - - - 68.8 65.4 66.2 Mexico 0.8 0.9 0.9 - - - 7.0 7.6 7.5
SOUTH AMERICA 15.2 15.2 15.6 1.3 1.1 1.1 36.1 35.8 35.7 Argentina 0.4 0.4 0.5 0.1 - 0.1 9.0 7.7 9.5 Brazil 8.3 8.2 8.4 0.2 0.3 0.3 41.3 40.3 40.2 Peru 1.9 2.1 2.1 0.3 0.3 0.3 60.2 63.3 63.3 Uruguay 0.1 0.1 0.1 0.1 - 0.1 7.5 7.4 7.6
NORTH AMERICA 4.3 5.0 4.1 1.1 1.6 1.3 10.7 12.0 10.3Canada 0.3 0.3 0.3 - - - 10.5 10.0 10.1 United States of America 3.9 4.7 3.8 1.0 1.5 1.2 10.7 12.2 10.4
EUROPE 3.7 3.9 4.0 0.5 0.6 0.5 4.7 4.9 5.0 European Union 2.7 2.9 2.9 0.5 0.5 0.5 5.0 5.3 5.3 Russian Federation 0.6 0.7 0.7 - - - 4.3 4.5 4.7
OCEANIA 0.5 0.6 0.6 - - 0.1 13.9 14.9 14.9 Australia 0.2 0.2 0.3 - - 0.1 8.7 8.9 9.1
WORLD 442.4 460.8 468.4 125.6 141.0 152.8 56.1 56.4 56.6Developing countries 424.3 441.9 450.1 121.5 136.2 148.2 67.2 67.2 67.6 Developed countries 18.1 18.9 18.3 4.1 4.9 4.6 12.1 12.5 12.1 LIFDCs 210.5 222.8 228.6 37.9 42.7 45.9 68.4 68.7 69.4 LDCs 72.4 77.6 78.6 14.0 15.3 14.6 65.9 66.6 66.8

Food Outlook
May 201284
Table A9. Cereal supply and utilization in selected exporters (million tonnes)
Wheat1 Coarse Grains2 Rice (milled basis)
2010/11 2011/12 2012/13 2010/11 2011/12 2012/13 2010/11 2011/12 2012/13 estim. f’cast estim. f’cast estim. f’cast
UNITED STATES (June/May) UNITED STATES UNITED STATES (Aug./July) Opening stocks 26.6 23.5 21.6 48.1 32.3 22.9 1.2 1.5 1.2 Production 60.1 54.4 59.0 330.6 324.0 358.6 7.6 5.9 5.7 Imports 2.6 3.3 3.0 2.5 2.8 2.3 0.6 0.6 0.7 Total Supply 89.3 81.1 83.6 381.2 359.1 383.8 9.4 8.0 7.6 Domestic use 30.7 32.3 31.6 298.2 291.1 304.0 4.0 4.4 3.9 Exports 35.1 27.2 28.5 50.7 45.0 50.0 3.5 3.5 2.9 Closing stocks 23.5 21.6 23.5 32.3 22.9 29.8 1.5 1.2 1.0
CANADA (August/July) CANADA THAILAND (Nov./Oct.)3 Opening stocks 7.8 7.2 6.5 5.7 3.6 2.6 5.6 6.2 7.4 Production 23.2 25.3 26.1 22.4 21.9 24.8 23.6 20.9 23.2 Imports 0.1 0.0 0.0 1.3 1.3 1.2 0.4 0.4 0.3 Total Supply 31.1 32.5 32.6 29.5 26.8 28.5 29.6 27.5 30.9Domestic use 7.7 8.8 8.3 19.9 19.7 20.4 12.8 12.6 13.8 Exports 16.2 17.2 17.8 6.0 4.6 4.5 10.6 7.5 8.0 Closing stocks 7.2 6.5 6.5 3.6 2.6 3.7 6.2 7.4 9.1
ARGENTINA (Dec./Nov.) ARGENTINA INDIA (Oct./Sept.)3 Opening stocks 1.3 3.6 3.7 0.8 1.6 3.4 21.0 21.5 24.5 Production 15.8 13.4 13.0 30.0 31.9 28.2 96.0 103.4 105.0 Imports 0.0 0.0 0.0 0.0 0.0 0.0 0.1 0.1 0.1 Total Supply 17.1 17.0 16.7 30.9 33.5 31.6 117.1 125.0 129.5Domestic use 5.1 5.1 5.1 9.1 10.6 10.6 91.6 94.2 96.5 Exports 8.4 8.2 8.5 20.2 19.5 18.2 4.0 6.3 6.0 Closing stocks 3.6 3.7 3.1 1.6 3.4 2.8 21.5 24.5 27.0
AUSTRALIA (Oct./Sept.) AUSTRALIA PAKISTAN (Nov./Oct.)3 Opening stocks 3.6 5.7 6.4 3.0 3.3 3.3 1.0 0.3 0.6 Production 27.9 29.5 26.0 11.9 13.4 12.7 4.8 6.9 7.2 Imports 0.0 0.0 0.0 0.0 0.0 0.0 0.1 0.0 0.0 Total Supply 31.5 35.2 32.4 14.8 16.7 15.9 5.9 7.2 7.8 Domestic use 7.2 7.8 7.9 6.8 8.0 8.0 2.6 3.1 3.2 Exports 18.6 21.0 19.0 4.8 5.4 5.0 3.1 3.5 3.7 Closing stocks 5.7 6.4 5.5 3.3 3.3 3.0 0.3 0.6 0.9
EU (July/June) EU VIET NAM (Nov./Oct.)3 Opening stocks 15.5 10.7 11.4 28.0 21.3 20.9 3.4 2.7 3.1 Production 136.5 137.9 135.0 140.4 148.5 149.1 26.7 28.2 28.3 Imports 4.7 7.5 8.0 8.7 4.8 6.4 0.6 0.6 0.6 Total Supply 156.7 156.1 154.4 177.0 174.6 176.4 30.6 31.6 32.0Domestic use 123.5 128.2 127.4 149.5 148.5 151.3 20.8 21.3 21.5 Exports 22.5 16.5 15.5 6.2 5.2 5.5 7.1 7.2 7.0 Closing stocks 10.7 11.4 11.5 21.3 20.9 19.6 2.7 3.1 3.5
TOTAL OF ABOVE TOTAL OF ABOVE TOTAL OF ABOVE Opening stocks 54.8 50.6 49.6 85.6 62.1 53.0 32.2 32.1 36.8 Production 263.4 260.5 259.1 535.3 539.7 573.3 158.6 165.4 169.5 Imports 7.4 10.8 11.1 12.6 8.9 9.9 1.8 1.8 1.7 Total Supply 325.6 322.0 319.7 633.4 610.7 636.3 192.6 199.3 208.0Domestic use 174.2 182.3 180.3 483.4 477.9 494.2 132.5 134.8 138.8 Exports 100.8 90.1 89.3 87.9 79.7 83.3 28.0 27.6 27.7 Closing stocks 50.6 49.6 50.1 62.1 53.0 58.8 32.1 36.8 41.5
1 Trade data include wheat flour in wheat grain equivalent. For the EU semolina is also included. 2 Argentina (December/November) for rye, barley and oats, (March/February) for maize and sorghum; Australia (November/October) for rye, barley and oats, (March/February) for maize and sorghum; Canada (August/July); EU (July/June); United States (June/May) for rye, barley and oats, (September/August) for maize and sorghum. 3 Rice trade data refer to the calendar year of the second year shown.

Statistical tables
May 2012 85
Table A10. Total oilcrops statistics (million tonnes)
Production1 Imports Exports
07/08-09/10 2010/11 2011/12
07/08-09/102010/11 2011/12
07/08-09/10 2010/11 2011/12
average average average estim. f’cast estim. f’cast estim. f’cast
ASIA 124.9 128.8 131.8 67.4 77.8 80.9 2.3 2.4 2.1China 57.5 59.0 59.3 47.8 56.8 60.1 1.3 1.1 0.9 of which Taiwan Prov. 0.1 0.1 0.1 2.3 2.5 2.4 - - - India 35.3 37.3 37.4 0.2 0.2 0.4 0.5 0.7 0.6 Indonesia 8.4 9.2 9.7 1.7 2.2 2.0 0.1 0.1 0.1 Iran, Islamic Republic of 0.7 0.7 0.9 0.8 0.8 0.8 - - - Japan 0.3 0.3 0.3 6.2 5.7 5.7 - - - Korea, Republic of 0.2 0.2 0.2 1.4 1.5 1.4 - - - Malaysia 4.6 4.9 4.9 0.7 0.7 0.6 - - - Pakistan 4.8 4.7 5.6 1.1 1.3 1.5 - 0.1 - Thailand 0.7 0.8 0.8 1.7 2.2 2.0 - - - Turkey 2.1 2.3 2.4 2.2 2.3 2.4 - 0.1 0.1
AFRICA 16.7 17.3 17.2 2.7 3.3 3.2 0.9 0.8 1.0Nigeria 4.7 4.7 4.9 - - - 0.2 0.2 0.2
CENTRAL AMERICA 1.2 1.3 1.2 5.9 6.0 5.8 0.1 0.2 0.2 Mexico 0.7 0.8 0.8 5.2 5.4 5.2 - - -
SOUTH AMERICA 124.7 147.2 127.9 2.7 1.3 1.1 45.3 48.2 52.1Argentina 48.8 54.1 49.1 1.5 - - 11.3 9.8 11.7 Brazil 64.9 79.2 69.6 0.1 - - 28.0 31.1 35.6 Paraguay 6.5 8.7 4.0 - - - 4.5 5.5 3.0
NORTH AMERICA 106.8 119.2 111.4 2.1 1.9 1.9 46.8 52.6 48.5Canada 16.1 18.4 19.6 0.7 0.7 0.5 10.0 11.1 12.0 United States of America 90.7 100.9 91.7 1.4 1.3 1.4 36.9 41.5 36.4
EUROPE 46.7 50.1 56.3 19.5 19.6 18.3 3.7 3.8 4.9 European Union 27.3 29.1 29.6 18.0 17.7 16.7 0.8 0.9 1.1 Russian Federation 8.0 7.6 12.2 0.9 1.2 0.9 0.3 0.1 0.8 Ukraine 9.3 11.3 12.3 - - - 2.4 2.6 2.8
OCEANIA 2.6 4.2 5.2 0.1 0.1 0.1 1.1 2.1 2.7 Australia 2.2 3.8 4.8 0.1 0.1 0.1 1.0 2.0 2.7
WORLD 423.5 468.0 450.9 100.4 110.0 111.4 100.2 110.0 111.4 Developing countries 262.1 289.2 272.5 71.4 81.7 84.2 48.4 51.4 55.0 Developed countries 161.3 178.8 178.4 28.9 28.4 27.2 51.8 58.6 56.4 LIFDCs 128.9 132.6 135.3 52.2 62.0 65.4 2.9 3.1 2.8 LDCs 10.2 10.7 10.4 0.5 0.4 0.4 0.4 0.4 0.4
1 The split years bring together northern hemisphere annual crops harvested in the latter part of the first year shown, with southern hemisphere annual crops harvested in the early part of the second year shown; for tree crops which are produced throughout the year, calendar year production for the second year shown is used.

Food Outlook
May 201286
Table A11. Total oils and fats statistics 1 (million tonnes)
Imports Exports Utilization
07/08-09/10 2010/11 2011/12
07/08-09/102010/11 2011/12
07/08-09/10 2010/11 2011/12
average average average estim. f’cast estim. f’cast estim. f’cast
ASIA 34.5 38.0 40.5 39.5 43.3 45.7 80.0 87.5 93.3Bangladesh 1.2 1.4 1.4 - - - 1.5 1.6 1.7 China 10.6 10.6 11.4 0.5 0.5 0.5 30.1 33.3 35.7 of which Taiwan Prov. 0.4 0.4 0.4 - - - 0.8 0.9 0.9 India 8.0 8.7 9.5 0.5 0.5 0.5 17.3 18.6 19.7 Indonesia 0.1 0.1 0.1 17.9 19.9 21.0 5.7 6.9 7.9 Iran 1.2 1.6 1.3 0.2 0.3 0.1 1.6 1.8 1.8 Japan 1.1 1.2 1.2 - - - 3.1 3.1 3.1 Korea, Republic of 0.9 1.0 1.0 - - - 1.2 1.4 1.4 Malaysia 1.5 2.2 2.5 17.2 18.9 20.0 3.8 3.3 3.7 Pakistan 2.1 2.3 2.4 0.1 0.1 0.1 3.6 4.0 4.1 Philippines 0.5 0.6 0.7 1.1 1.0 1.1 1.0 1.2 1.1 Singapore 0.6 0.8 1.0 0.3 0.3 0.3 0.3 0.6 0.7 Turkey 1.2 1.3 1.5 0.3 0.4 0.5 2.3 2.3 2.6
AFRICA 7.5 8.2 8.4 1.2 1.3 1.4 13.1 14.2 14.5Algeria 0.6 0.5 0.6 0.1 - - 0.7 0.7 0.8 Egypt 1.6 1.6 1.9 0.1 - 0.1 2.0 2.1 2.2 Nigeria 0.8 1.1 1.1 0.1 0.1 0.1 2.5 2.8 2.9 South Africa 0.7 0.8 0.8 0.1 0.1 0.1 1.1 1.2 1.2
CENTRAL AMERICA 2.3 2.3 2.4 0.8 0.7 0.8 4.5 4.7 4.6 Mexico 1.2 1.2 1.3 0.2 0.1 0.1 2.9 3.0 3.0
SOUTH AMERICA 2.3 2.6 2.7 9.7 9.1 8.8 12.0 14.5 15.7Argentina 0.1 0.1 0.1 6.2 5.8 5.9 2.0 3.1 3.5Brazil 0.4 0.5 0.6 2.1 1.9 1.5 6.4 7.4 7.9
NORTH AMERICA 4.0 4.5 4.8 6.1 7.0 6.5 17.2 18.4 19.0Canada 0.5 0.5 0.6 2.3 3.2 3.2 0.9 1.0 1.1 United States of America 3.5 4.0 4.2 3.8 3.8 3.2 16.4 17.5 18.0
EUROPE 13.4 13.1 13.1 5.4 6.0 7.4 34.3 36.4 36.9 European Union 10.7 10.5 10.6 2.1 2.4 2.5 28.5 29.9 30.3 Russian Federation 1.2 1.2 1.1 0.8 0.5 1.4 3.6 4.0 4.1 Ukraine 0.5 0.4 0.4 2.2 2.8 3.1 0.9 1.0 1.0
OCEANIA 0.5 0.6 0.6 1.7 1.8 1.9 1.0 1.1 1.1 Australia 0.4 0.4 0.4 0.6 0.7 0.7 0.7 0.7 0.7
WORLD 64.5 69.1 72.4 64.5 69.2 72.5 162.2 176.7 185.3 Developing countries 44.4 48.6 51.6 51.7 54.9 57.2 104.5 115.6 123.0 Developed countries 20.1 20.5 20.9 12.8 14.3 15.2 57.7 61.1 62.3 LIFDCs 30.2 32.4 34.4 21.8 23.8 25.1 73.0 80.6 85.7 LDCs 4.3 5.0 5.0 0.4 0.5 0.5 7.3 7.9 8.0
1 Includes oils and fats of vegetable, marine and animal origin.

Statistical tables
May 2012 87
Table A12. Total meals and cakes statistics1 (million tonnes)
Imports Exports Utilization
07/08-09/10 2010/11 2011/12
07/08-09/102010/11 2011/12
07/08-09/10 2010/11 2011/12
average average average estim. f’cast estim. f’cast estim. f’cast
ASIA 25.9 30.4 30.6 13.8 14.7 14.7 106.9 126.4 130.6China 3.0 4.1 4.0 1.6 0.9 0.7 54.5 69.8 72.9 of which Taiwan Prov. 0.5 0.4 0.4 - - - 2.3 2.3 2.4 India 0.1 0.2 0.1 5.1 6.0 5.9 11.4 12.0 12.6 Indonesia 2.7 3.3 3.4 2.8 3.3 3.4 3.1 3.5 3.7 Japan 2.5 2.7 2.8 - - - 7.1 6.9 6.7 Korea, Republic of 3.5 3.3 3.4 - - - 4.6 4.5 4.5 Malaysia 1.0 1.1 1.2 2.3 2.4 2.5 1.8 2.0 1.9 Pakistan 0.5 0.6 0.5 0.1 0.2 0.2 2.8 3.3 3.4 Philippines 1.7 2.0 2.1 0.5 0.5 0.5 2.3 2.5 2.5 Saudi Arabia 0.5 0.5 0.5 - - - 0.6 0.5 0.5 Thailand 2.7 2.8 3.0 0.1 0.1 0.2 4.6 5.0 5.2 Turkey 0.9 1.1 1.2 - 0.1 0.1 3.2 3.5 3.7 Viet Nam 2.8 3.5 3.1 0.1 0.1 0.1 2.9 3.9 3.6
AFRICA 3.6 4.1 4.3 0.9 0.9 0.9 9.4 10.7 10.8Egypt 0.5 0.7 0.8 - - - 1.8 2.2 2.3 South Africa 1.1 1.2 1.2 0.1 0.1 0.1 1.8 1.9 1.9
CENTRAL AMERICA 3.3 3.4 3.5 0.2 0.2 0.2 8.0 8.0 8.1 Mexico 1.8 1.8 1.9 0.1 0.1 0.1 6.0 5.9 6.0
SOUTH AMERICA 4.5 4.6 4.9 42.7 46.4 46.3 22.6 23.0 23.5Argentina - - - 26.1 28.6 28.3 2.9 2.2 2.2 Bolivia - - - 1.1 1.1 1.3 0.2 0.2 0.3 Brazil 0.3 0.1 0.1 12.5 14.0 13.7 14.0 14.5 14.5 Chile 0.9 1.0 1.0 0.5 0.3 0.4 1.3 1.4 1.4 Paraguay - - - 0.8 1.0 1.0 0.3 0.4 0.5 Peru 0.7 0.8 0.9 1.4 1.3 1.3 0.9 1.0 1.0 Venezuela 1.2 1.2 1.2 - - - 1.3 1.4 1.4
NORTH AMERICA 3.3 3.7 3.6 11.8 12.5 12.5 34.5 33.7 34.1Canada 1.4 1.2 1.2 2.7 3.9 4.0 2.3 2.0 2.0 United States of America 1.9 2.5 2.4 9.1 8.6 8.5 32.2 31.7 32.1
EUROPE 31.5 31.7 31.7 4.5 5.3 6.3 60.8 62.0 62.1 European Union 29.1 29.1 29.1 1.0 1.2 1.3 54.6 54.5 54.2 Russian Federation 0.6 0.6 0.5 1.0 0.8 1.5 3.1 4.0 4.3 Ukraine 0.1 0.1 - 1.9 2.8 2.9 0.7 0.8 0.7
OCEANIA 2.0 2.4 2.5 0.2 0.2 0.2 2.6 3.2 3.3Australia 0.8 0.8 0.9 - 0.1 - 1.4 1.6 1.7
WORLD 74.0 80.3 81.1 74.1 80.3 81.1 244.9 267.0 272.6Developing countries 33.2 38.1 38.8 57.4 62.1 61.9 136.3 157.3 162.5 Developed countries 40.8 42.2 42.3 16.7 18.2 19.2 108.6 109.7 110.1 LIFDCs 10.8 14.0 14.2 11.2 12.0 11.9 82.5 100.4 104.7 LDCs 0.5 0.5 0.6 0.4 0.4 0.4 3.5 3.7 3.7
1 Expressed in product weight; includes meals and cakes derived from oilcrops as well as fish meal and other meals from animal origin.

Food Outlook
May 201288
Table A13. Sugar statistics (million tonnes, raw value)
Production Imports Exports Utilization
2010/11 2011/12 2010/11 2011/12 2010/11 2011/12 2010/11 2011/12 estim. f’cast estim. f’cast estim. f’cast estim. f’cast
ASIA 62.9 65.9 25.8 26.5 12.0 12.6 75.6 77.3China 11.5 11.0 3.1 4.5 0.1 0.1 15.5 15.4 India 26.0 28.1 0.4 - 2.2 3.0 23.4 23.6 Indonesia 2.5 2.7 3.1 3.2 - - 5.6 5.9 Japan 0.7 0.8 1.6 1.5 - - 2.3 2.3 Malaysia - - 1.6 1.6 0.1 0.1 1.5 1.5 Pakistan 4.4 5.2 0.7 0.1 0.1 0.3 4.8 4.9 Philippines 2.5 2.4 - - 0.2 0.1 2.2 2.2 Thailand 10.1 10.2 - - 6.4 7.2 2.7 2.8 Turkey 2.5 2.5 - - 0.1 - 2.3 2.5 Viet Nam 1.2 1.5 0.2 - - 0.1 1.3 1.3
AFRICA 10.8 11.2 9.9 9.7 2.7 2.0 18.0 18.4Egypt 2.1 2.1 1.1 1.1 0.1 - 3.1 3.2 Ethiopia 0.3 0.4 0.2 0.1 - - 0.5 0.5 Kenya 0.6 0.6 0.4 0.3 - - 0.9 0.9 Mauritius 0.5 0.4 - - 0.5 0.4 - 0.1 Mozambique 0.4 0.4 - - 0.1 0.2 0.2 0.2 South Africa 2.1 2.1 0.4 0.3 0.4 0.3 2.0 2.1 Sudan 0.8 1.1 0.6 0.4 - - 1.4 1.4 Swaziland 0.7 0.7 - - 0.6 0.6 0.1 0.1 Tanzania, United Rep. of 0.3 0.3 0.2 0.2 0.1 0.1 0.5 0.5
CENTRAL AMERICA 12.0 12.4 0.8 0.8 5.1 5.1 7.7 7.7 Cuba 1.5 1.6 - - 0.8 0.9 0.7 0.7 Dominican Republic 0.6 0.6 0.1 - 0.2 0.3 0.3 0.4 Guatemala 2.2 2.5 - 0.1 1.5 1.7 0.7 0.7 Mexico 5.5 5.3 0.3 0.3 1.5 1.3 4.3 4.2
SOUTH AMERICA 46.1 44.0 1.6 1.6 28.5 24.1 20.9 21.3Argentina 2.0 2.0 - - 0.1 0.1 1.9 1.9 Brazil 38.4 36.2 - - 27.1 22.8 13.0 13.3 Colombia 2.4 2.5 0.1 - 0.9 0.8 1.7 1.7 Peru 1.1 1.1 0.2 0.2 - - 1.2 1.3 Venezuela 0.6 0.6 0.6 0.6 - - 1.1 1.1
NORTH AMERICA 7.2 7.3 4.7 4.8 0.3 0.2 11.7 11.8United States of America 7.1 7.2 3.4 3.4 0.2 0.2 10.3 10.3
EUROPE 22.0 27.7 8.5 5.3 1.9 3.1 28.6 29.6 European Union 15.7 17.9 4.3 3.4 1.1 2.0 18.9 19.0 Russian Federation 2.9 5.5 2.8 0.8 0.1 0.2 5.9 6.0 Ukraine 1.7 2.5 0.4 0.2 - 0.3 2.0 2.1
OCEANIA 4.0 4.2 0.3 0.2 2.7 3.1 1.3 1.3Australia 3.8 4.0 - - 2.6 3.0 1.0 1.0 Fiji 0.2 0.2 - - 0.1 0.1 - -
WORLD 165.1 172.8 51.6 49.0 53.0 50.3 163.7 167.4Developing countries 129.3 130.8 33.7 34.3 47.7 43.7 115.5 117.9 Developed countries 35.8 42.0 17.9 14.6 5.4 6.6 48.2 49.5 LIFDCs 57.3 60.5 20.5 20.9 5.3 5.5 72.6 73.8 LDCs 3.8 4.2 5.3 5.2 0.7 0.5 8.4 8.6
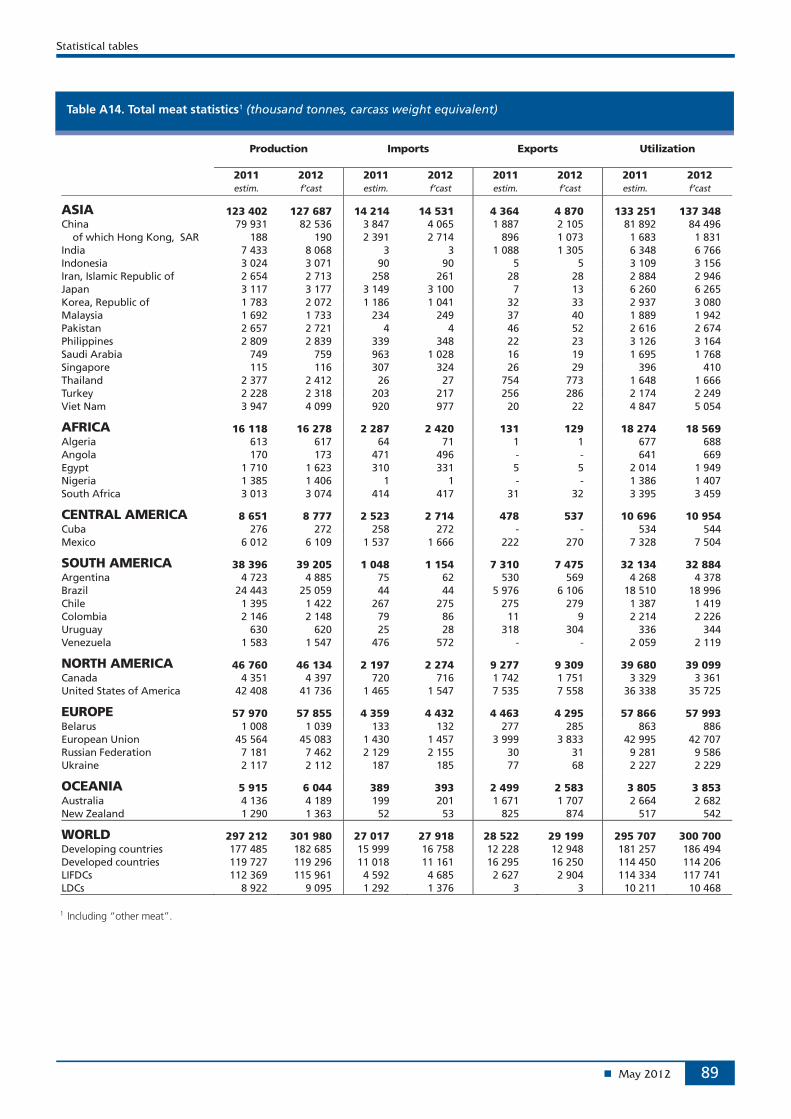
Statistical tables
May 2012 89
Table A14. Total meat statistics1 (thousand tonnes, carcass weight equivalent)
Production Imports Exports Utilization
2011 2012 2011 2012 2011 2012 2011 2012 estim. f’cast estim. f’cast estim. f’cast estim. f’cast
ASIA 123 402 127 687 14 214 14 531 4 364 4 870 133 251 137 348China 79 931 82 536 3 847 4 065 1 887 2 105 81 892 84 496 of which Hong Kong, SAR 188 190 2 391 2 714 896 1 073 1 683 1 831 India 7 433 8 068 3 3 1 088 1 305 6 348 6 766 Indonesia 3 024 3 071 90 90 5 5 3 109 3 156 Iran, Islamic Republic of 2 654 2 713 258 261 28 28 2 884 2 946 Japan 3 117 3 177 3 149 3 100 7 13 6 260 6 265 Korea, Republic of 1 783 2 072 1 186 1 041 32 33 2 937 3 080 Malaysia 1 692 1 733 234 249 37 40 1 889 1 942 Pakistan 2 657 2 721 4 4 46 52 2 616 2 674 Philippines 2 809 2 839 339 348 22 23 3 126 3 164 Saudi Arabia 749 759 963 1 028 16 19 1 695 1 768 Singapore 115 116 307 324 26 29 396 410 Thailand 2 377 2 412 26 27 754 773 1 648 1 666 Turkey 2 228 2 318 203 217 256 286 2 174 2 249 Viet Nam 3 947 4 099 920 977 20 22 4 847 5 054
AFRICA 16 118 16 278 2 287 2 420 131 129 18 274 18 569Algeria 613 617 64 71 1 1 677 688 Angola 170 173 471 496 - - 641 669 Egypt 1 710 1 623 310 331 5 5 2 014 1 949 Nigeria 1 385 1 406 1 1 - - 1 386 1 407 South Africa 3 013 3 074 414 417 31 32 3 395 3 459
CENTRAL AMERICA 8 651 8 777 2 523 2 714 478 537 10 696 10 954 Cuba 276 272 258 272 - - 534 544 Mexico 6 012 6 109 1 537 1 666 222 270 7 328 7 504
SOUTH AMERICA 38 396 39 205 1 048 1 154 7 310 7 475 32 134 32 884Argentina 4 723 4 885 75 62 530 569 4 268 4 378 Brazil 24 443 25 059 44 44 5 976 6 106 18 510 18 996 Chile 1 395 1 422 267 275 275 279 1 387 1 419 Colombia 2 146 2 148 79 86 11 9 2 214 2 226 Uruguay 630 620 25 28 318 304 336 344 Venezuela 1 583 1 547 476 572 - - 2 059 2 119
NORTH AMERICA 46 760 46 134 2 197 2 274 9 277 9 309 39 680 39 099Canada 4 351 4 397 720 716 1 742 1 751 3 329 3 361 United States of America 42 408 41 736 1 465 1 547 7 535 7 558 36 338 35 725
EUROPE 57 970 57 855 4 359 4 432 4 463 4 295 57 866 57 993 Belarus 1 008 1 039 133 132 277 285 863 886 European Union 45 564 45 083 1 430 1 457 3 999 3 833 42 995 42 707 Russian Federation 7 181 7 462 2 129 2 155 30 31 9 281 9 586 Ukraine 2 117 2 112 187 185 77 68 2 227 2 229
OCEANIA 5 915 6 044 389 393 2 499 2 583 3 805 3 853 Australia 4 136 4 189 199 201 1 671 1 707 2 664 2 682 New Zealand 1 290 1 363 52 53 825 874 517 542
WORLD 297 212 301 980 27 017 27 918 28 522 29 199 295 707 300 700Developing countries 177 485 182 685 15 999 16 758 12 228 12 948 181 257 186 494 Developed countries 119 727 119 296 11 018 11 161 16 295 16 250 114 450 114 206 LIFDCs 112 369 115 961 4 592 4 685 2 627 2 904 114 334 117 741 LDCs 8 922 9 095 1 292 1 376 3 3 10 211 10 468
1 Including “other meat”.

Food Outlook
May 201290
Table A15. Bovine meat statistics (thousand tonnes, carcass weight equivalent)
Production Imports Exports Utilization
2011 2012 2011 2012 2011 2012 2011 2012 estim. f’cast estim. f’cast estim. f’cast estim. f’cast
ASIA 17 108 17 625 3 300 3 364 1 406 1 628 18 952 19 321China 6 488 6 487 401 400 167 179 6 722 6 708 India 3 172 3 505 1 1 1 077 1 293 2 096 2 213 Indonesia 480 482 84 84 1 1 563 565 Iran, Islamic Republic of 415 420 194 195 1 1 608 614 Japan 505 500 740 740 2 2 1 222 1 247 Korea, Republic of 349 443 382 367 4 4 696 754 Malaysia 30 31 157 174 9 10 178 195 Pakistan 1 450 1 470 2 2 30 35 1 422 1 437 Philippines 300 310 118 122 5 5 413 427
AFRICA 5 823 5 811 520 546 71 70 6 272 6 286Algeria 135 137 60 65 - - 195 202 Angola 106 107 80 80 - - 186 187 Egypt 714 628 235 250 1 1 948 877 South Africa 920 950 13 15 11 13 923 952
CENTRAL AMERICA 2 548 2 567 438 466 313 366 2 673 2 667 Mexico 1 820 1 825 272 316 111 155 1 981 1 986
SOUTH AMERICA 15 054 15 269 411 475 2 018 2 075 13 447 13 668Argentina 2 530 2 600 2 2 220 231 2 312 2 371 Brazil 9 400 9 600 35 35 1 300 1 350 8 136 8 285 Chile 190 190 167 165 11 10 346 345 Colombia 930 930 2 2 6 4 926 928 Uruguay 505 500 - - 290 280 215 220 Venezuela 450 380 188 254 - - 638 634
NORTH AMERICA 13 170 12 672 1 114 1 185 1 675 1 693 12 640 12 162Canada 1 170 1 200 264 262 379 410 1 055 1 052 United States of America 12 000 11 472 848 922 1 296 1 283 11 583 11 109
EUROPE 11 065 10 736 1 223 1 308 544 447 11 744 11 597 European Union 8 253 7 948 320 352 327 232 8 246 8 068 Russian Federation 1 622 1 598 785 824 8 8 2 399 2 414 Ukraine 385 380 8 8 10 5 383 383
OCEANIA 2 753 2 815 57 59 1 756 1 814 1 018 1 045Australia 2 133 2 145 13 14 1 295 1 315 817 829 New Zealand 600 650 11 12 460 497 151 165
WORLD 67 522 67 494 7 063 7 403 7 784 8 092 66 747 66 747Developing countries 37 456 38 140 3 788 3 959 3 795 4 123 37 421 37 927 Developed countries 30 065 29 354 3 275 3 444 3 988 3 970 29 326 28 820 LIFDCs 18 899 19 268 805 830 1 548 1 784 18 156 18 314 LDCs 3 271 3 324 164 172 1 1 3 434 3 495
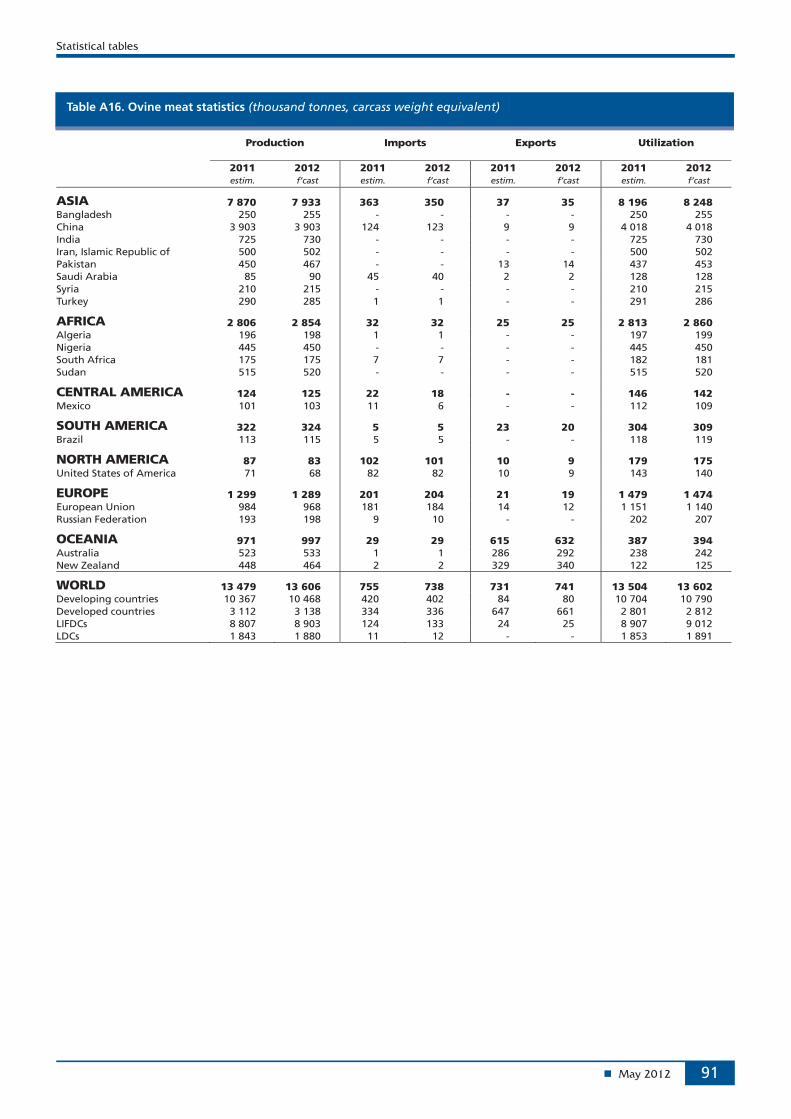
Statistical tables
May 2012 91
Table A16. Ovine meat statistics (thousand tonnes, carcass weight equivalent)
Production Imports Exports Utilization
2011 2012 2011 2012 2011 2012 2011 2012 estim. f’cast estim. f’cast estim. f’cast estim. f’cast
ASIA 7 870 7 933 363 350 37 35 8 196 8 248Bangladesh 250 255 - - - - 250 255 China 3 903 3 903 124 123 9 9 4 018 4 018 India 725 730 - - - - 725 730 Iran, Islamic Republic of 500 502 - - - - 500 502 Pakistan 450 467 - - 13 14 437 453 Saudi Arabia 85 90 45 40 2 2 128 128 Syria 210 215 - - - - 210 215 Turkey 290 285 1 1 - - 291 286
AFRICA 2 806 2 854 32 32 25 25 2 813 2 860Algeria 196 198 1 1 - - 197 199 Nigeria 445 450 - - - - 445 450 South Africa 175 175 7 7 - - 182 181 Sudan 515 520 - - - - 515 520
CENTRAL AMERICA 124 125 22 18 - - 146 142 Mexico 101 103 11 6 - - 112 109
SOUTH AMERICA 322 324 5 5 23 20 304 309Brazil 113 115 5 5 - - 118 119
NORTH AMERICA 87 83 102 101 10 9 179 175United States of America 71 68 82 82 10 9 143 140
EUROPE 1 299 1 289 201 204 21 19 1 479 1 474 European Union 984 968 181 184 14 12 1 151 1 140 Russian Federation 193 198 9 10 - - 202 207
OCEANIA 971 997 29 29 615 632 387 394Australia 523 533 1 1 286 292 238 242 New Zealand 448 464 2 2 329 340 122 125
WORLD 13 479 13 606 755 738 731 741 13 504 13 602Developing countries 10 367 10 468 420 402 84 80 10 704 10 790 Developed countries 3 112 3 138 334 336 647 661 2 801 2 812 LIFDCs 8 807 8 903 124 133 24 25 8 907 9 012 LDCs 1 843 1 880 11 12 - - 1 853 1 891

Food Outlook
May 201292
Table A17. Pigmeat statistics (thousand tonnes, carcass weight equivalent)
Production Imports Exports Utilization
2011 2012 2011 2012 2011 2012 2011 2012 estim. f’cast estim. f’cast estim. f’cast estim. f’cast
ASIA 60 335 62 780 3 577 3 394 365 364 63 569 65 827China 50 232 52 309 1 265 1 193 306 301 51 191 53 201 of which Hong Kong, SAR 126 128 618 625 44 38 700 715 India 490 487 1 1 1 1 490 487 Indonesia 680 690 1 1 - - 681 691 Japan 1 255 1 280 1 275 1 270 1 1 2 546 2 549 Korea, D.P.R. 110 110 2 2 - - 112 112 Korea, Republic of 823 988 646 530 1 1 1 478 1 536 Malaysia 240 250 17 17 3 3 254 264 Philippines 1 630 1 626 96 95 3 3 1 723 1 718 Thailand 850 850 2 2 22 23 830 829 Viet Nam 3 040 3 192 43 45 20 22 3 059 3 214
AFRICA 1 277 1 321 225 237 8 8 1 494 1 550Madagascar 56 56 - - - - 56 56 Nigeria 235 240 - - - - 235 240 South Africa 358 376 42 45 3 3 397 419 Uganda 115 117 1 1 - - 116 118
CENTRAL AMERICA 1 683 1 718 692 752 111 114 2 264 2 356 Cuba 168 166 38 42 - - 206 208 Mexico 1 192 1 225 505 548 90 91 1 607 1 682
SOUTH AMERICA 5 123 5 233 146 142 787 790 4 483 4 585Argentina 290 305 58 45 1 1 347 349 Brazil 3 258 3 323 1 1 648 648 2 611 2 676 Chile 528 535 19 20 137 141 410 414 Colombia 181 182 20 25 - - 201 207 Venezuela 174 178 8 8 - - 182 186
NORTH AMERICA 12 256 12 477 662 668 3 440 3 440 9 451 9 700Canada 1 923 1 929 224 220 1 161 1 140 985 1 009 United States of America 10 333 10 548 433 443 2 279 2 300 8 460 8 686
EUROPE 27 796 27 712 1 253 1 226 2 343 2 283 26 706 26 655 Belarus 410 420 115 115 55 55 470 480 European Union 23 210 22 978 19 18 2 242 2 188 20 988 20 808 Russian Federation 2 400 2 527 862 835 2 2 3 260 3 360 Serbia 480 514 10 12 8 9 482 517 Ukraine 680 640 115 116 17 13 778 743
OCEANIA 482 489 231 232 40 43 673 681Australia 342 347 176 176 39 42 479 483 Papua New Guinea 68 68 7 6 - - 75 74
WORLD 108 951 111 731 6 787 6 652 7 092 7 042 108 640 111 354Developing countries 66 607 69 196 3 293 3 177 1 266 1 272 68 639 71 118 Developed countries 42 345 42 534 3 494 3 475 5 826 5 770 40 001 40 236 LIFDCs 53 907 56 020 1 090 1 018 327 330 54 670 56 707 LDCs 1 261 1 285 161 169 1 1 1 421 1 453

Statistical tables
May 2012 93
Table A18. Poultry meat statistics (thousand tonnes, carcass weight equivalent)
Production Imports Exports Utilization
2011 2012 2011 2012 2011 2012 2011 2012 estim. f’cast estim. f’cast estim. f’cast estim. f’cast
ASIA 36 128 37 374 6 921 7 309 2 524 2 798 40 514 41 883China 17 858 18 378 2 052 2 344 1 390 1 600 18 520 19 121 of which Hong Kong, SAR 46 47 1 501 1 800 777 954 770 893 India 2 900 3 200 2 1 9 10 2 893 3 191 Indonesia 1 728 1 760 1 1 - - 1 729 1 761 Iran, Islamic Republic of 1 723 1 775 63 65 26 26 1 760 1 814 Japan 1 345 1 385 1 098 1 054 4 10 2 429 2 429 Korea, Republic of 600 630 145 130 27 28 718 731 Kuwait 47 49 200 200 1 1 246 248 Malaysia 1 420 1 450 41 42 24 27 1 437 1 465 Saudi Arabia 580 585 750 800 3 5 1 327 1 380 Singapore 95 95 137 145 11 12 221 228 Thailand 1 260 1 300 2 3 695 715 568 588 Turkey 1 620 1 720 90 95 242 270 1 468 1 545 Yemen 147 149 105 100 - - 252 249
AFRICA 4 813 4 882 1 479 1 569 20 19 6 271 6 433Angola 8 8 280 300 - - 288 308 South Africa 1 537 1 550 351 350 11 10 1 876 1 890
CENTRAL AMERICA 4 175 4 247 1 354 1 438 52 56 5 477 5 629 Cuba 34 35 185 190 - - 219 224 Mexico 2 798 2 854 739 782 19 23 3 517 3 613
SOUTH AMERICA 17 572 18 071 484 531 4 415 4 522 13 642 14 080Argentina 1 724 1 800 14 15 271 300 1 467 1 515 Brazil 11 641 11 990 2 3 4 004 4 084 7 639 7 909 Chile 650 670 81 90 117 118 614 642 Venezuela 950 980 280 310 - - 1 230 1 290
NORTH AMERICA 21 000 20 654 309 308 4 114 4 129 17 236 16 831Canada 1 220 1 230 209 211 182 182 1 248 1 259 United States of America 19 780 19 424 94 92 3 931 3 947 15 983 15 567
EUROPE 16 615 16 922 1 520 1 529 1 472 1 461 16 663 16 990 European Union 12 075 12 147 809 803 1 335 1 319 11 550 11 631 Russian Federation 2 876 3 048 429 440 19 20 3 286 3 468 Ukraine 1 001 1 041 63 60 50 50 1 014 1 051
OCEANIA 1 292 1 322 67 68 46 54 1 310 1 339Australia 1 117 1 142 8 8 39 45 1 084 1 108 New Zealand 150 155 1 1 7 9 143 147
WORLD 101 594 103 473 12 133 12 752 12 643 13 039 101 113 103 184 Developing countries 59 029 60 845 8 411 9 041 6 980 7 360 60 460 62 526 Developed countries 42 566 42 627 3 722 3 711 5 663 5 680 40 653 40 658 LIFDCs 27 474 28 463 2 534 2 664 697 735 29 310 30 392 LDCs 1 922 1 975 932 998 - 1 2 853 2 973
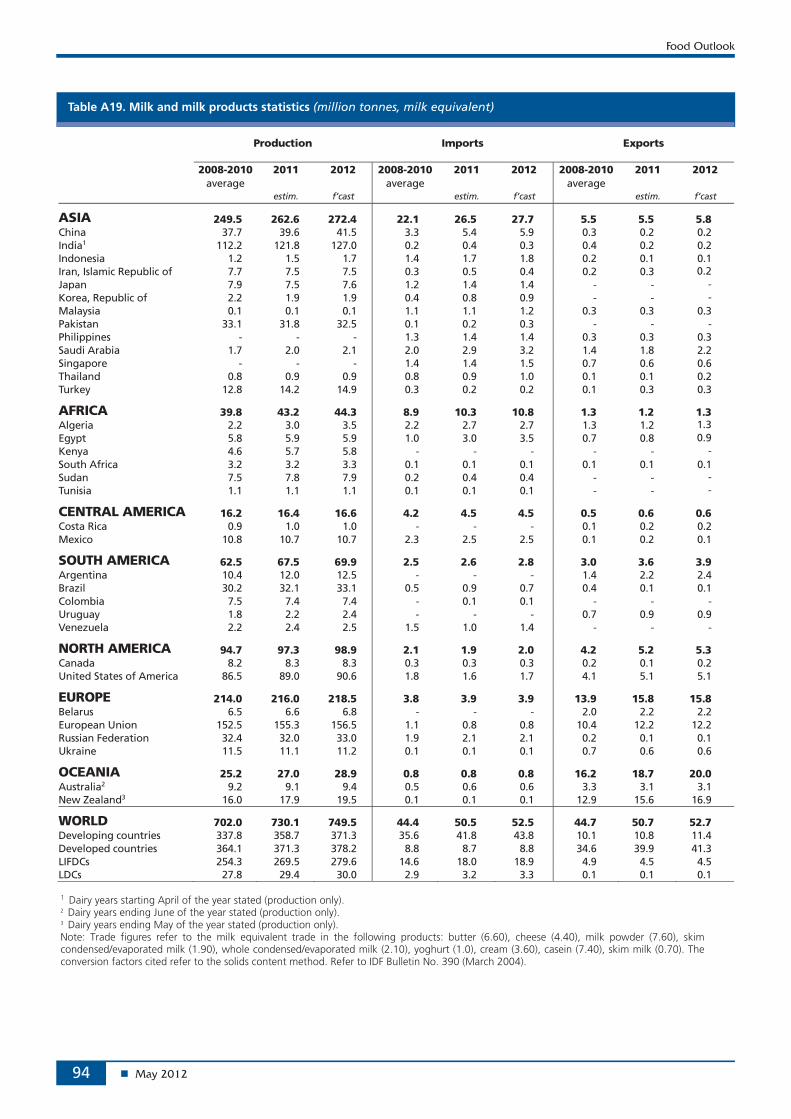
Food Outlook
May 201294
Table A19. Milk and milk products statistics (million tonnes, milk equivalent)
Production Imports Exports
2008-2010 2011 2012 2008-2010 2011 2012 2008-2010 2011 2012
average average average
estim. f’cast estim. f’cast estim. f’cast
ASIA 249.5 262.6 272.4 22.1 26.5 27.7 5.5 5.5 5.8China 37.7 39.6 41.5 3.3 5.4 5.9 0.3 0.2 0.2 India1 112.2 121.8 127.0 0.2 0.4 0.3 0.4 0.2 0.2 Indonesia 1.2 1.5 1.7 1.4 1.7 1.8 0.2 0.1 0.1 Iran, Islamic Republic of 7.7 7.5 7.5 0.3 0.5 0.4 0.2 0.3 0.2 Japan 7.9 7.5 7.6 1.2 1.4 1.4 - - - Korea, Republic of 2.2 1.9 1.9 0.4 0.8 0.9 - - - Malaysia 0.1 0.1 0.1 1.1 1.1 1.2 0.3 0.3 0.3 Pakistan 33.1 31.8 32.5 0.1 0.2 0.3 - - - Philippines - - - 1.3 1.4 1.4 0.3 0.3 0.3 Saudi Arabia 1.7 2.0 2.1 2.0 2.9 3.2 1.4 1.8 2.2 Singapore - - - 1.4 1.4 1.5 0.7 0.6 0.6 Thailand 0.8 0.9 0.9 0.8 0.9 1.0 0.1 0.1 0.2 Turkey 12.8 14.2 14.9 0.3 0.2 0.2 0.1 0.3 0.3
AFRICA 39.8 43.2 44.3 8.9 10.3 10.8 1.3 1.2 1.3Algeria 2.2 3.0 3.5 2.2 2.7 2.7 1.3 1.2 1.3Egypt 5.8 5.9 5.9 1.0 3.0 3.5 0.7 0.8 0.9 Kenya 4.6 5.7 5.8 - - - - - - South Africa 3.2 3.2 3.3 0.1 0.1 0.1 0.1 0.1 0.1 Sudan 7.5 7.8 7.9 0.2 0.4 0.4 - - -Tunisia 1.1 1.1 1.1 0.1 0.1 0.1 - - -
CENTRAL AMERICA 16.2 16.4 16.6 4.2 4.5 4.5 0.5 0.6 0.6 Costa Rica 0.9 1.0 1.0 - - - 0.1 0.2 0.2 Mexico 10.8 10.7 10.7 2.3 2.5 2.5 0.1 0.2 0.1
SOUTH AMERICA 62.5 67.5 69.9 2.5 2.6 2.8 3.0 3.6 3.9Argentina 10.4 12.0 12.5 - - - 1.4 2.2 2.4 Brazil 30.2 32.1 33.1 0.5 0.9 0.7 0.4 0.1 0.1 Colombia 7.5 7.4 7.4 - 0.1 0.1 - - - Uruguay 1.8 2.2 2.4 - - - 0.7 0.9 0.9 Venezuela 2.2 2.4 2.5 1.5 1.0 1.4 - - -
NORTH AMERICA 94.7 97.3 98.9 2.1 1.9 2.0 4.2 5.2 5.3Canada 8.2 8.3 8.3 0.3 0.3 0.3 0.2 0.1 0.2 United States of America 86.5 89.0 90.6 1.8 1.6 1.7 4.1 5.1 5.1
EUROPE 214.0 216.0 218.5 3.8 3.9 3.9 13.9 15.8 15.8 Belarus 6.5 6.6 6.8 - - - 2.0 2.2 2.2 European Union 152.5 155.3 156.5 1.1 0.8 0.8 10.4 12.2 12.2 Russian Federation 32.4 32.0 33.0 1.9 2.1 2.1 0.2 0.1 0.1 Ukraine 11.5 11.1 11.2 0.1 0.1 0.1 0.7 0.6 0.6
OCEANIA 25.2 27.0 28.9 0.8 0.8 0.8 16.2 18.7 20.0Australia2 9.2 9.1 9.4 0.5 0.6 0.6 3.3 3.1 3.1 New Zealand3 16.0 17.9 19.5 0.1 0.1 0.1 12.9 15.6 16.9
WORLD 702.0 730.1 749.5 44.4 50.5 52.5 44.7 50.7 52.7Developing countries 337.8 358.7 371.3 35.6 41.8 43.8 10.1 10.8 11.4 Developed countries 364.1 371.3 378.2 8.8 8.7 8.8 34.6 39.9 41.3 LIFDCs 254.3 269.5 279.6 14.6 18.0 18.9 4.9 4.5 4.5 LDCs 27.8 29.4 30.0 2.9 3.2 3.3 0.1 0.1 0.1
1 Dairy years starting April of the year stated (production only). 2 Dairy years ending June of the year stated (production only).
3 Dairy years ending May of the year stated (production only). Note: Trade figures refer to the milk equivalent trade in the following products: butter (6.60), cheese (4.40), milk powder (7.60), skim condensed/evaporated milk (1.90), whole condensed/evaporated milk (2.10), yoghurt (1.0), cream (3.60), casein (7.40), skim milk (0.70). The conversion factors cited refer to the solids content method. Refer to IDF Bulletin No. 390 (March 2004).

Statistical tables
May 2012 95
Table A20. Fish and fishery products statistics 1
Capture fisheries production
Aquaculture fisheries production Exports Imports
2009 2010 2009 2010 2009 2010 2011 2009 2010 2011 estim. estim. estim. estim.
Million tonnes (live weight equivalent) USD billion USD billion
ASIA 46.9 48.7 49.5 53.3 34.1 40.6 49.0 30.6 35.6 42.3 China2 15.8 16.4 35.1 37.0 12.2 15.2 19.4 8.4 10.2 12.1 of which: Hong Kong SAR 0.2 0.2 - - 0.4 0.5 0.5 2.5 3.1 3.5 Taiwan Prov. 0.8 0.9 0.3 0.3 1.6 1.5 1.8 0.8 0.9 1.0 India 4.1 4.7 3.8 4.6 2.0 2.4 3.1 0.1 0.1 0.1 Indonesia 5.1 5.4 1.7 2.3 2.2 2.6 3.2 0.2 0.3 0.4 Japan 4.1 4.0 0.8 0.7 1.6 2.0 1.9 13.3 15.0 17.4 Korea, Rep. of 1.9 1.7 0.5 0.5 1.3 1.6 2.0 2.7 3.2 3.9 Philippines 2.6 2.6 0.7 0.7 0.6 0.6 0.6 0.2 0.2 0.2 Thailand 1.9 1.8 1.4 1.3 6.2 7.1 8.5 2.0 2.1 2.7 Viet Nam 2.3 2.4 2.6 2.7 4.3 5.1 6.2 0.4 0.5 0.7
AFRICA 7.4 7.6 1.0 1.3 4.8 4.7 4.8 3.3 3.5 3.9 Ghana 0.3 0.4 - - 0.1 - - 0.1 0.1 0.3 Morocco 1.2 1.1 - - 1.5 1.5 1.4 0.1 0.1 0.1 Namibia 0.4 0.4 - - 0.6 0.6 0.5 - - - Nigeria 0.6 0.6 0.2 0.2 0.4 0.3 0.6 0.8 1.0 1.0 Senegal 0.4 0.4 - - 0.2 0.2 0.3 - - - South Africa 0.5 0.6 - - 0.4 0.6 0.6 0.3 0.2 0.3
CENTRAL AMERICA 2.1 2.2 0.3 0.3 2.0 1.8 2.0 1.0 1.2 1.3Mexico 1.6 1.5 0.2 0.1 0.8 0.8 1.1 0.4 0.5 0.6 Panama 0.2 0.2 - - 0.4 0.2 0.1 - - -
SOUTH AMERICA 13.2 9.5 1.6 1.6 9.4 9.8 12.4 1.9 2.3 2.8Argentina 0.9 0.8 - - 1.1 1.3 1.5 0.1 0.1 0.2 Brazil 0.8 0.8 0.4 0.5 0.2 0.2 0.2 0.7 1.0 1.3 Chile 3.5 2.7 0.8 0.7 3.6 3.4 4.5 0.1 0.3 0.4 Ecuador 0.5 0.4 0.2 0.3 1.6 1.8 2.5 0.2 0.2 0.3 Peru 6.9 4.3 - 0.1 2.2 2.5 3.1 0.1 0.2 0.1
NORTH AMERICA 5.4 5.5 0.6 0.7 7.7 8.8 10.3 15.9 17.8 20.1 Canada 1.0 0.9 0.2 0.2 3.2 3.8 4.2 2.0 2.3 2.6 United States of America 4.2 4.4 0.5 0.5 4.1 4.7 5.8 13.9 15.5 17.5
EUROPE 13.3 13.8 2.5 2.5 36.1 40.4 45.0 45.7 49.9 56.0 European Union2 5.2 5.3 1.3 1.3 23.9 26.5 29.7 40.7 44.6 50.0 of which Extra -EU 3.8 4.5 5.2 21.4 23.7 26.5 Iceland 1.1 1.1 - - 1.7 1.8 2.2 0.1 0.1 0.1 Norway 2.5 2.7 1.0 1.0 7.1 8.8 9.4 1.2 1.1 1.3 Russian Federation 3.8 4.1 0.1 0.1 2.3 2.2 2.7 2.0 2.2 2.7
OCEANIA 1.2 1.2 0.2 0.2 2.2 2.5 2.7 1.3 1.5 1.7Australia 0.2 0.2 0.1 0.1 0.8 0.9 1.1 1.1 1.3 1.4 New Zealand 0.4 0.4 0.1 0.1 0.9 1.1 1.2 0.1 0.1 0.1
WORLD3 89.6 88.6 55.7 59.9 96.2 108.6 126.1 99.7 111.8 128.1 Excl. Intra-EU 76.1 86.6 101.7 80.4 90.8 104.6 Developing countries 66.0 64.6 51.6 55.8 49.1 55.4 66.7 23.7 27.7 33.0 Developed countries 23.4 24.0 4.1 4.1 47.1 53.2 59.4 76.0 84.0 95.1 LIFDCs 19.9 21.0 8.6 10.6 7.8 8.4 9.9 3.3 3.5 4.0 LDCs 8.7 9.0 2.1 2.5 2.2 2.2 2.1 0.5 0.5 0.5
1 Production and trade data exclude whales, seals, other aquatic mammals and aquatic plants. Trade data include fish meal and fish oil. 2 Including intra-trade. Cyprus is included in the European Union as well as in Asia. 3 For capture fisheries production, the aggregate includes also 168 754 tonnes in 2009 and 59 142 tonnes in 2010 of not identified countries, data not included in any other aggregates.

Food Outlook
May 201296
Table A21. Selected international prices for wheat and coarse grains (USD/tonne)
Wheat Maize Barley Sorghum
Period US No. 2 Hard Red
Winter Ord. Prot. 1
US Soft Red Winter No.
2 2
Argentina Trigo Pan 3
US No. 2 Yellow 2
Argentina 3 France feed Rouen
Australia feed Eastern
States
US No. 2 Yellow 2
Annual (July/June)
2004/05 154 138 123 97 90 132 123 99
2005/06 175 138 138 104 101 133 128 109
2006/07 212 176 188 150 145 185 185 155
2007/08 361 311 322 200 192 319 300 206
2008/09 270 201 234 188 180 178 179 170
2009/10 209 185 224 160 168 146 154 165
2010/11 316 289 311 254 260 274 247 248
2011 – April 364 318 352 321 314 276 250 302
2011 – May 362 309 351 309 303 277 247 277
2011 – June 333 282 341 308 306 285 265 285
2011 – July 307 264 310 304 300 270 259 279
2011 – August 336 280 292 313 312 287 265 304
2011 – September 334 302 348 300 295 279 254 285
2011 – October 301 255 260 275 276 266 237 265
2011 – November 299 256 239 275 271 260 238 275
2011 – December 290 246 223 259 241 274 233 261
2012 – January 298 257 249 275 258 296 251 271
2012 – February 297 262 263 279 267 294 273 268
2012 - March 294 259 260 280 270 272 254 266
2012 – April 279 255 252 273 256 280 236 242
1 Delivered United States f.o.b. Gulf2 Delivered United States Gulf3 Up River f.o.b. Sources: International Grain Council and USDA
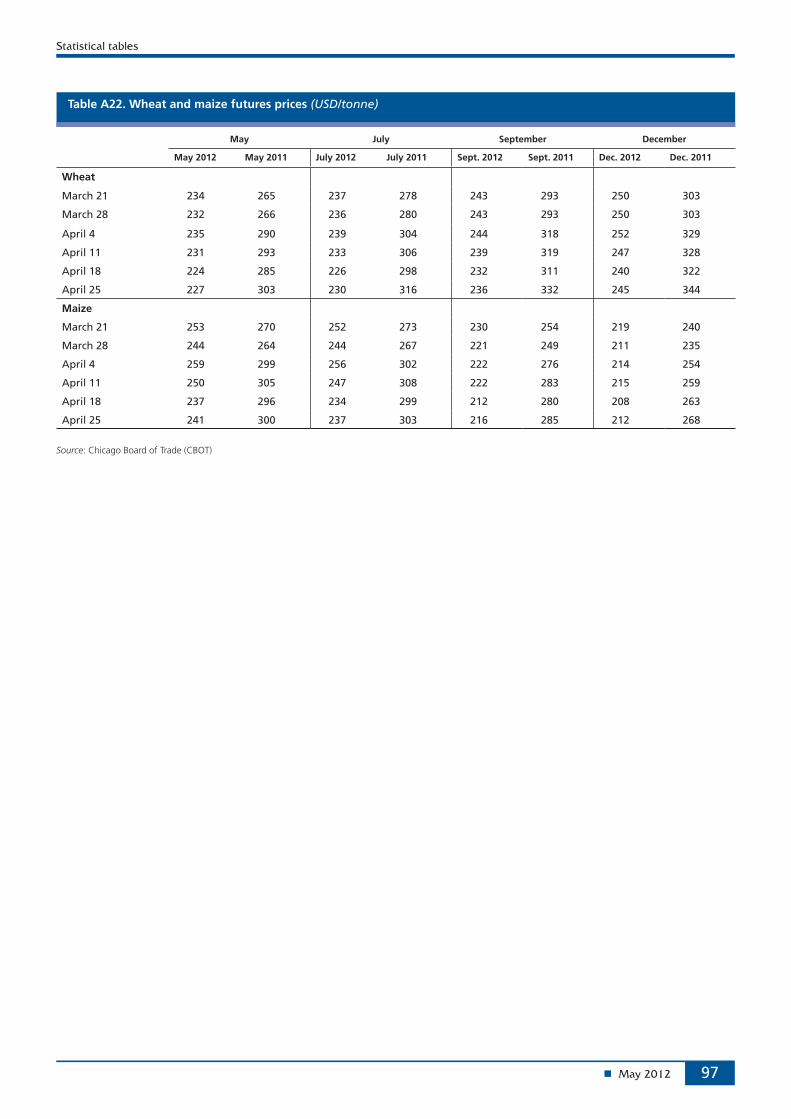
Statistical tables
May 2012 97
Table A22. Wheat and maize futures prices (USD/tonne)
May July September December
May 2012 May 2011 July 2012 July 2011 Sept. 2012 Sept. 2011 Dec. 2012 Dec. 2011
Wheat
March 21 234 265 237 278 243 293 250 303
March 28 232 266 236 280 243 293 250 303
April 4 235 290 239 304 244 318 252 329
April 11 231 293 233 306 239 319 247 328
April 18 224 285 226 298 232 311 240 322
April 25 227 303 230 316 236 332 245 344
Maize
March 21 253 270 252 273 230 254 219 240
March 28 244 264 244 267 221 249 211 235
April 4 259 299 256 302 222 276 214 254
April 11 250 305 247 308 222 283 215 259
April 18 237 296 234 299 212 280 208 263
April 25 241 300 237 303 216 285 212 268
Source: Chicago Board of Trade (CBOT)

Food Outlook
May 201298
Table A23. Selected international prices for rice and price indices
International prices (USD per tonne) FAO indices (2002-2004=100)
Indica
Period Thai 100% B1 Thai broken 2
US long grain 3
Pakisan Basmati4
Total High quality
Low quality
Japonica Aromatic
Annual (Jan/Dec)
2006 311 217 394 516 138 135 132 153 117
2007 335 275 436 677 161 156 160 168 157
2008 695 506 782 1077 294 296 287 314 251
2009 587 329 545 937 253 229 196 341 232
2010 518 386 510 881 229 211 212 264 231
2011 565 464 577 1008 251 237 250 274 227
Monthly
2011 – April 507 423 528 1150 245 218 235 284 235
2011 – May 500 419 518 1025 242 219 239 273 225
2011 – June 519 421 529 938 247 222 242 288 218
2011 – July 548 445 549 910 251 232 255 276 220
2011 – August 582 471 605 875 260 249 272 273 220
2011 – September 618 497 650 950 260 256 266 268 226
2011 – October 620 505 639 963 253 255 261 252 229
2011 – November 649 553 597 950 254 252 262 256 225
2011 – December 620 560 569 890 242 238 253 248 210
2012 – January 548 515 546 950 235 221 238 252 215
2012 – February 563 530 535 950 229 223 239 230 214
2012 – March 567 543 524 950 235 229 242 242 214
2012 – April 569 546 514 825 234 227 242 244 204
1 White rice, 100 percent second grade, f.o.b. Bangkok.2 A1 super, f.o.b. Bangkok.3 United States No.2, 4 percent brokens f.o.b.4 Basmati: ordinary, f.o.b. Karachi.Note: The FAO Rice Price Index is based on 16 rice export quotations. ‘Quality’ is defined by the percentage of broken kernels, with high (low) quality referring to rice with less (equal to or more) than 20 percent brokens. The sub-index for Aromatic Rice follows movements in prices of Basmati and Fragrant rice.Sources: FAO for indices. Rice prices: Jackson Son & Co. (London) Ltd., Thai Department of Foreign Trade (DFT) and other public sources.

Statistical tables
May 2012 99
Table A24. Selected international prices for oilcrop products and price indices
International prices (USD per tonne) FAO indices (2002-2004=100)
Period Soybeans 1 Soybean oil 2 Palm oil 3 Soybean cake 4
Rapeseed meal5
Oilseeds Edible/soap fats/oils
Oilcakes/meals
Annual (Oct/Sept)
2003/04 322 632 488 257 178 121 114 116
2004/05 275 545 419 212 130 105 104 105
2005/06 259 572 451 202 130 100 125 107
2006/07 335 772 684 264 184 129 148 153
2007/08 549 1 325 1 050 445 296 217 245 202
2008/09 422 826 627 385 196 156 145 180
2009/10 429 924 806 388 220 162 174 215
2010/11 549 1 308 1 147 418 279 215 256 221
Monthly
2010 - April 412 900 826 378 205 157 174 224
2010 - May 406 864 813 353 226 153 171 214
2010 - June 408 860 794 342 194 154 169 206
2010 - July 426 911 811 361 225 162 176 211
2010 - August 457 1 002 901 389 245 175 194 213
2010 - September 468 1 036 910 398 277 180 199 218
2010 - October 496 1 165 998 415 285 193 222 227
2010 - November 526 1 248 1 117 430 292 205 245 225
2010 - December 550 1 321 1 229 437 289 216 264 222
2011 - January 572 1 384 1 279 454 313 225 279 234
2011 - February 569 1 366 1 286 447 290 224 281 241
2011 - March 552 1 305 1 172 423 264 217 262 234
2011 - April 553 1 310 1 148 406 277 219 261 227
2011 - May 556 1 291 1 155 403 280 218 261 220
2011 - June 559 1 321 1 137 396 289 219 259 211
2011 - July 558 1 345 1 100 405 262 217 253 209
2011 - August 557 1 327 1 080 402 248 214 245 206
2011 - September 546 1 310 1 065 396 255 209 239 200
2011 - October 502 1 216 995 378 243 194 224 194
2011 - November 491 1 228 1 054 353 224 191 235 186
2011 - December 476 1 163 1 026 346 227 185 227 182
2012 - January 500 1 223 1 062 371 234 193 234 189
2012 - February 512 1 245 1 100 385 255 199 239 192
2012 - March 542 1 283 1 152 426 287 209 245 205
2012 - April 575 1 308 1 182 474 335 221 251 225
1 Soybeans: US, No.2 yellow, c.i.f. Rotterdam.2 Soybean oil: Dutch, fob ex-mill.3 Palm oil: Crude, c.i.f. Northwest Europe.4 Soybean cake: Pellets, 44/45 percent, Argentina, c.i.f. Rotterdam.5 Rapeseed meal: 34 percent, Hamburg, f.o.b. ex-mill. Note: The FAO indices are calculated using the Laspeyres formula; the weights used are the average export values of each commodity for the 2002-2004 period. The indices are based on the international prices of twelve selected seeds, ten selected oils and fats and seven selected cakes and meals.Sources: FAO and Oil World.
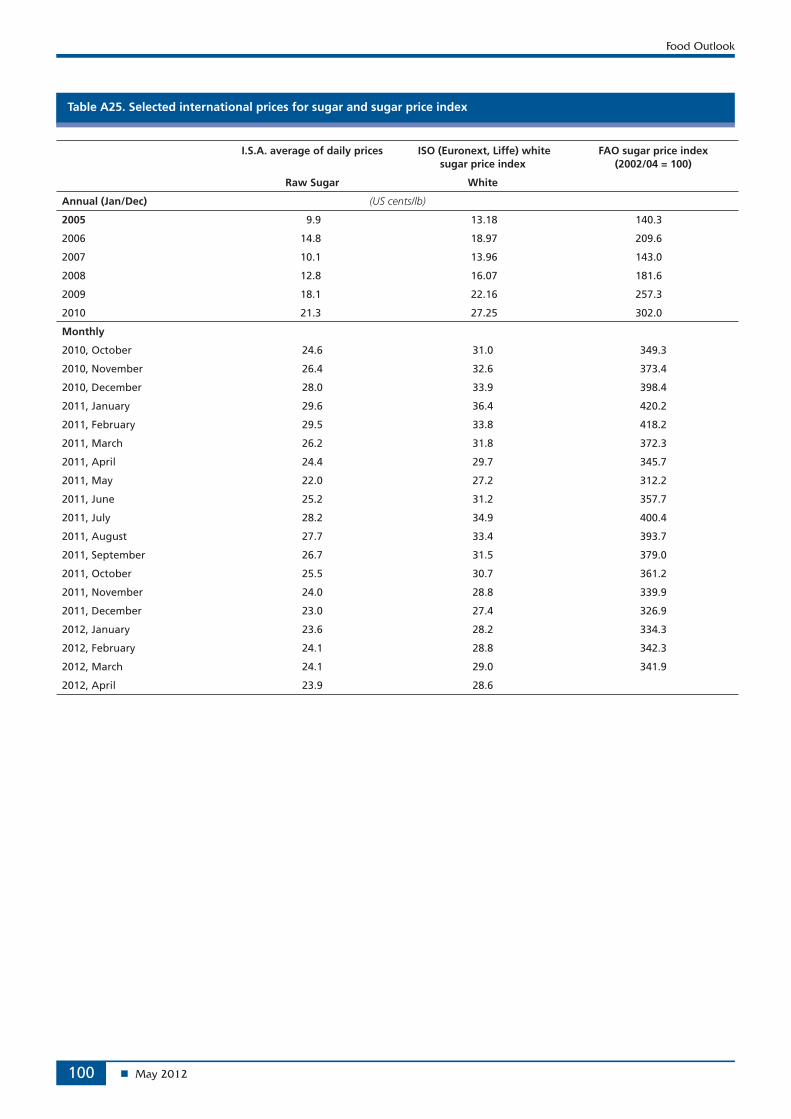
Food Outlook
May 2012100
Table A25. Selected international prices for sugar and sugar price index
I.S.A. average of daily prices ISO (Euronext, Liffe) white sugar price index
FAO sugar price index (2002/04 = 100)
Raw Sugar White
Annual (Jan/Dec) (US cents/lb)
2005 9.9 13.18 140.3
2006 14.8 18.97 209.6
2007 10.1 13.96 143.0
2008 12.8 16.07 181.6
2009 18.1 22.16 257.3
2010 21.3 27.25 302.0
Monthly
2010, October 24.6 31.0 349.3
2010, November 26.4 32.6 373.4
2010, December 28.0 33.9 398.4
2011, January 29.6 36.4 420.2
2011, February 29.5 33.8 418.2
2011, March 26.2 31.8 372.3
2011, April 24.4 29.7 345.7
2011, May 22.0 27.2 312.2
2011, June 25.2 31.2 357.7
2011, July 28.2 34.9 400.4
2011, August 27.7 33.4 393.7
2011, September 26.7 31.5 379.0
2011, October 25.5 30.7 361.2
2011, November 24.0 28.8 339.9
2011, December 23.0 27.4 326.9
2012, January 23.6 28.2 334.3
2012, February 24.1 28.8 342.3
2012, March 24.1 29.0 341.9
2012, April 23.9 28.6

Statistical tables
May 2012 101
Table A26. Selected international prices for milk products and dairy price index
International prices (USD per tonne) FAO dairy price index
(2002-2004=100)
Period Butter 1 Skim milk powder 2 Whole milk powder 3 Cheddar cheese 4
Annual (Jan/Dec)
2005 2 128 2 223 2 261 2 838 135
2006 1 774 2 218 2 193 2 681 128
2007 2 959 4 291 4 185 4 055 212
2008 3 607 3 278 3 846 4 633 220
2009 2 335 2 255 2 400 2 957 142
2010 4 043 3 127 3 464 4 010 200
2011 4 473 3 657 3 860 4 310 221
Monthly
2011 - April 4 750 3 769 4 088 4 425 229
2011 - May 4 750 3 807 4 075 4 500 231
2011 - June 4 763 4 000 3 938 4 488 232
2011 - July 4 675 3 853 3 825 4 462 228
2011 - August 4 500 3 622 3 585 4 405 221
2011 - September 4 225 3 476 3 522 4 332 215
2011 - October 4 075 3 346 3 475 4 029 204
2011 - November 3 825 3 400 3 588 3 944 201
2011 - December 3 784 3 433 3 658 3 946 202
2012 - January 3 912 3 425 3 619 4 113 207
2012 - February 3 825 3 322 3 563 4 019 202
2012 - March 3 650 3 200 3 481 3 950 197
2012 - April 3 500 3 025 3 294 3 700 186
1 Butter, 82 percent butterfat, f.o.b. Oceania; indicative traded prices2 Skim Milk Powder, 1.25 percent butterfat, f.o.b. Oceania, indicative traded prices3 Whole Milk Powder, 26 percent butterfat, f.o.b. Oceania, indicative traded prices4 Cheddar Cheese, 39 percent maximum moisture, f.o.b. Oceania, indicative traded prices
Note: The FAO Dairy Price Index is derived from a trade-weighted average of a selection of representative internationally-traded dairy productsSources: FAO for indices. Product prices: Mid-point of price ranges reported by Dairy Market News (USDA)

Food Outlook
May 2012102
Table A27. Selected international meat prices and FAO meat price indices
Bovine meat prices (USD per tonne)
Ovine meat price
(USD per tonne)
Pig meat prices
(USD per tonne)
Period Australia United States Brazil New Zealand United States Brazil Germany
Annual (Jan/Dec)
2005 2 617 3 919 1 967 4 439 2 161 2 094 1 830
2006 2 547 3 803 2 219 4 033 1 986 2 134 1 935
2007 2 603 4 023 2 367 4 120 2 117 2 200 1 907
2008 3 138 4 325 3 785 4 585 2 270 3 000 2 364
2009 2 636 3 897 3 118 4 276 2 202 2 223 2 035
2010 3 351 4 378 3 919 5 045 2 454 2 747 1 913
2011 4 041 4 516 4 816 6 631 2 648 3 023 2 169
Monthly
2011 - February 4 050 4 528 4 719 6 414 2 493 2 820 1 977
2011 - March 4 140 4 594 4 746 6 424 2 561 2 927 2 120
2010 - April 4 250 4 452 4 857 6 622 2 694 3 085 2 305
2010 - May 4 030 4 438 5 006 6 660 2 701 3 033 2 300
2010 - June 3 900 4 508 4 791 6 772 2 717 3 124 2 299
2011 - July 3 950 4 263 4 852 6 907 2 611 2 836 2 296
2011 - August 3 990 4 508 4 997 6 995 2 679 2 865 2 267
2011 - September 3 870 4 528 4 927 6 692 2 749 2 971 2 173
2011 - October 3 860 4 490 4 768 6 663 2 729 3 165 2 170
2011 - November 4 165 4 716 4 824 6 636 2 693 3 304 2 233
2011 - December 4 192 4 835 4 642 6 507 2 749 3 148 2 144
2012 - January 4 196 4 910 4 598 6 426 2 658 2 817 1 992
2012 - February 4 277 5 050 4 649 6 456 2 772 2 802 2 149
Bovine meat prices:Australia: up to Oct02 : cow forequarters frozen boneless, 85% chemical lean, cif US port (East Coast) ex-dock; from Nov02: chucks and cow forequartersUSA: Frozen beef, export unit valueBrazil: Frozen beef, export unit value
Ovine meat pricesNew Zealand: Lamb, frozen whole carcasses,wholesale price Smithfield Mkt. London
Pig meat prices:USA: Frozen pigmeat, export unit valueBrazil: Frozen pigmeat, export unit valueGermany: Monthly market price for pig carcase grade E

Statistical tables
May 2012 103
Poultry meat prices (USD per tonne)
FAO indices(2002-2004=100)
Period United States Brazil Total meat Bovine meat Ovine meat Pig meat Poultry meat
Annual (Jan/Dec)
2005 847 1 228 120 118 113 122 132
2006 734 1 180 119 119 103 123 122
2007 935 1 443 125 125 105 125 151
2008 997 1 896 153 157 117 152 184
2009 989 1 552 133 134 109 131 162
2010 1 032 1 781 152 163 128 138 177
2011 1 147 2 083 177 189 169 153 206
Monthly
2011 - February 1 066 1 983 171 188 163 141 194
2011 - March 1 102 2 023 175 190 163 148 199
2011 - April 1 182 2 120 180 192 169 159 210
2011 - May 1 177 2 194 180 190 170 158 215
2011 - June 1 143 2 115 178 186 172 159 207
2011 - July 1 133 2 154 177 185 176 154 209
2011 - August 1 144 2 008 179 190 178 155 201
2011 - September 1 177 2 150 177 188 170 154 212
2011 - October 1 201 2 067 176 185 170 156 208
2011 - November 1 200 2 108 181 193 169 159 211
2011 - December 1 172 2 088 179 193 166 155 208
2012 - January 1 201 1 889 174 193 164 145 196
2012 - February 1 196 1 873 178 197 164 152 195
Poultry meat prices:USA: Broiler cuts, export unit valueBrazil: Export unit value for chicken (f.o.b.)
The FAO Meat Price Indices consist of 3 poultry meat product quotations (the average weighted by assumed fixed trade weights), 4 bovine meat product quotations (average weighted by assumed fixed trade weights), 2 pig meat product quotations (average weighted by assumed fixed trade weights), 1 ovine meat product quotation (average weighted by assumed fixed trade weights): the four meat group average prices are weighted by world average export trade shares for 2002/2004.
Table A28. Selected international meat prices and FAO meat price indices

Food Outlook
May 2012104
Table A29. Fish price indices (2002 - 2004 = 100)
Period Total Aquaculture Capture White fish Salmon Shrimp Pelagic e/tuna Tuna Other fish
Annual (Jan/Dec)
2006 117 114 119 128 144 100 124 118 120
2007 124 115 132 139 147 102 130 135 126
2008 136 120 148 151 151 109 148 162 133
2009 126 119 131 132 159 98 140 147 128
2010 137 137 136 138 187 109 144 146 136
2011 154 149 156 151 203 124 173 175 166
Monthly
2011 - April 155 161 150 149 225 119 173 163 171
2011 - May 153 160 148 153 222 116 133 167 169
2011 - June 152 153 151 153 204 122 165 166 162
2011 - July 152 148 155 153 194 121 157 178 167
2011 - August 158 148 167 153 187 128 170 203 175
2011 - September 155 144 165 150 177 129 185 204 158
2011 - October 154 145 161 156 168 135 186 179 155
2011 - November 155 137 165 154 169 130 216 175 167
2011 - December 154 136 165 154 170 123 209 182 174
2012 - January 155 135 166 155 168 125 208 185 175
2012 - February 157 136 168 154 172 125 206 191 172
2012 - March 158 137 170 155 178 123 205 191 170
2012 - April 158 136 169 156 180 120 204 186 169
Source= Norwegian Seafood CouncilNote: The FAO Fish Price Index is based on nominal import values expressed in CIF in the three major import markets; Japan, USA and EU. Separate indexes exist for products from aquaculture and from capture fisheries. Additional sub-indexes exist for the major commodity groups based on species.
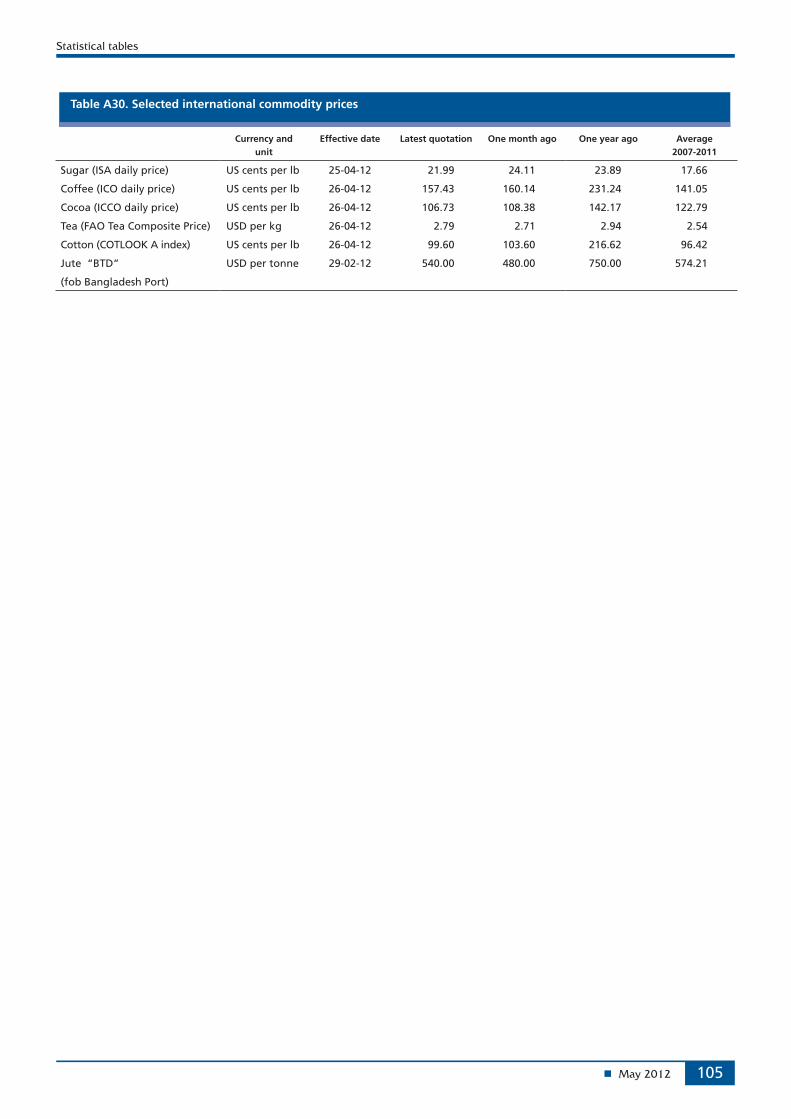
Statistical tables
May 2012 105
Table A30. Selected international commodity prices
Currency and unit
Effective date Latest quotation One month ago One year ago Average 2007-2011
Sugar (ISA daily price) US cents per lb 25-04-12 21.99 24.11 23.89 17.66
Coffee (ICO daily price) US cents per lb 26-04-12 157.43 160.14 231.24 141.05
Cocoa (ICCO daily price) US cents per lb 26-04-12 106.73 108.38 142.17 122.79
Tea (FAO Tea Composite Price) USD per kg 26-04-12 2.79 2.71 2.94 2.54
Cotton (COTLOOK A index) US cents per lb 26-04-12 99.60 103.60 216.62 96.42
Jute “BTD” USD per tonne 29-02-12 540.00 480.00 750.00 574.21
(fob Bangladesh Port)

May 2012106
Market indicatorsMarket indicators
HISTORICAL AND IMPLIED PRICE VOLATILITY (APRIL 2011-APRIL 2012): CBOT WHEAT, MAIZE AND SOYBEANS
(Frank S. Rose, College of Business, Lewis University, Romeoville, Illinois, United States)
Recent reports concerning plantings, inventories, weather impacts and the global economy have reflected considerable uncertainty in the grain and oilseed markets. Many expect significant price volatility in the coming months. To provide a basis for thinking about how prices might develop in the spring and summer, this analysis examines historical and implied volatilities in the Chicago Board of Trade (CBOT) wheat, maize and soybean futures markets.
Two perspectives on historical volatility are provided. First, quarterly high – low cash price ranges (dollars per metric ton) are examined in the nearby futures contracts between the first quarter 2011 and the first quarter 2012. By this measure, volatility of wheat and corn prices was relatively low in the first quarter of 2012, while volatility of soybean prices was relatively high:
0
20
40
60
80
AMFJDNOSAJJMA
Wheat
2011 2012
Maize Soybeans
Percent
0
20
40
60
AMFJDNOSAJJMA
Wheat
2011 2012
Maize Soybeans
Percent
Historical volatility
Implied volatility
Wheat Corn Soybeans
USD
Quarter 1, 2012 31.96 35.03 91.12
Quarter 4, 2011 31.23 31.88 59.52
Quarter 3, 2011 58.42 71.26 96.99
Quarter 2, 2011 66.50 59.45 39.68
Quarter 1, 2011 68.34 55.51 36.01
A second perspective on historical volatility is given by annualized standard deviations of daily prices in the futures markets. The Chicago Mercantile Exchange provides quarterly data on 30-day historical volatilities over the past one- and three-year periods. The median volatilities (50th percentiles) over the past four quarters (Quarter 2, 2011 – Quarter 1, 2012) for wheat, corn and soybean futures are 39.5%, 31.4%, and 19.7%, respectively. The accompanying chart shows that historical volatilities in the recent period are significantly lower than year ago levels. Indeed, historical volatilities reached exceptionally low levels in the February-March 2012 timeframe. Although there were upticks in historical volatilities in early April, they were still well below median levels for the past year.
Looking forward, implied volatilities show the level of expected future volatility embedded in the option premiums observed in the CBOT’s options on futures markets. They give the markets’ estimates of the volatility of futures prices, on an annualized basis, over the next 30 days. All else equal, the more liquid and active the option markets, the better the implied volatility numbers. In the first quarter, 2012, year-to-date trading volume in wheat, corn and soybean options was -0.2%, -17.2% and +7.9%, respectively.
As shown in the accompanying chart, the trends in implied volatilities have been down (in wheat and maize) or flat (in soybeans) over the April 2011-April 2012 period. The numbers for the most recent period do not indicate a market expectation for greater price volatility in the near term.
Source: Barchart.com; Bloomberg; CME Group

May 2012 107
Market indicatorsMarket indicators
-60
-40
-20
0
20
40
201220112010200920082007
Percent
Commercial Managedmoney
Swapdealers
CME maize net - length as % of open interest (March 2007 - March 2012)
-60
-40
-20
0
20
40
60
201220112010200920082007
Percent
Commercial Managedmoney
Swapdealers
CME wheat net - length as % of open interest (March 2007 - March 2012)
-60
-40
-20
0
20
40
201220112010200920082007
Percent
Commercial Managedmoney
Swapdealers
CME soybeans net - length as % of open interest (March 2007 - March 2012)
AN ANALYSIS OF MARKET PARTICIPATION: CBOT WHEAT, MAIZE AND SOYBEANS
(Frank S. Rose, College of Business, Lewis University, Romeoville, Illinois, United States)
As prices have risen between mid-December and early April, there have been a number of changes in the market shares of commercials, swap dealers and money managers in the Chicago Board of Trade’s wheat, maize and soybean futures markets. Examination of open interest data from the Commodity Futures Trading Commission’s Commitments of Traders reports reveals higher total open interest levels in all markets, particularly in soybeans where the price rise has been the most pronounced. In terms of shares of total long open interest in April, commercials, swaps dealers and money managers held 9%, 47% and 29%, respectively, in the case of wheat; 18%, 28% and 32% in maize; and 19%, 21% and 37% in soybeans.
Between December and April, commercials increased their net short positions by 45% in wheat and 37% in maize, and tripled their net short positions in soybeans. Swap dealers maintained net long positions in all the markets. Participation patterns of the money managers have varied by market. In wheat, they reduced their net short positions by 20%, and in maize they increased their net long positions by 70%. In soybeans, money managers had nearly equal long and short positions in mid-December before the recent sharp price rise began, but by early April had accumulated exceptionally large net long positions. Their net long position in early April 2012, 209 000 contracts, was nearly double that of April 2011.
As the accompanying charts show, over the April 2007 – April 2012 period, commercials have been consistently net short and swap dealers, consistently net long. Money managers have generally been net long in maize and soybeans, but have vacillated between net long and net short in wheat. Focusing specifically on money managers in April each year over this period, it is observed that their share of long open interest was the highest in 2012 – 29% in wheat, 32% in maize and 37% in soybeans. In the wheat market, their net positions have varied significantly over the years. They were net short over 31 000 contracts in 2012, substantially less than their 2010 net short position of 53 000 contracts, but opposite to their 2011 net long position of 23 000 contracts. In maize, money
Source: Barchart.com; Commodity Futures Trading Commission

May 2012108
Market indicatorsMarket indicators
managers have normally been long in April – the exception being 2010 – but while their net long position was relatively high in 2012 at 212 000 contracts, it was 35% lower than their 2011 net long position of 327 000 contracts.
Of the three markets, the 2012 share of money managers in the soybean futures market is perhaps the most notable, by historical standards. Money managers have been net long in early April every year. However, the size of their long and net long positions has varied significantly. Their 37% share
of long open interest in 2012 contrasts with shares of 28% in 2011, 23% in 2010, and 31% in 2009. Their net long position in 2012, as noted, was nearly double their 2011 net long position and over seven times their 2010 net long position.
Going forward, the money managers continue to be the participant group to watch. Their current positions are at relatively high levels and, history has shown that abrupt changes in those positions are possible.

May 2012 109
Market indicatorsMarket indicators
FORWARD CURVES INDICATE STRONG DEMAND FOR MAIZE AND SOYBEANS
(Ann Berg, Senior Commodity Analyst)
Forward curves (Fig. 1-3), which track the price structure of spot and deferred contract months for any futures contract, are behaving mostly as expected following the official USDA Report on planting intentions and March 1 stocks for maize, soybeans and wheat (issued March 30, 2012).
As background, just prior to the 2008 food crisis, forward curves in all three commodities were upward sloping, or in contango, indicating adequate supplies for the crop year. Prices in 2007 were also approximately one quarter (wheat), one third (maize) and one half (soybeans) of this year’s price levels. In general, low prices and contango go together as upward sloping prices signal producers and warehouses to store surpluses and buyers to take advantage of cheap nearby grain availability. In contrast, high priced markets, experienced in most years since 2008, except 2009-2010, are usually downward sloping or in backwardation. These markets encourage inventory liquidation and deferral of purchases.
The USDA Report indicated total wheat stocks, including soft red wheat (listed on the CME), hard red wheat, hard red spring, white wheat and durum were in adequate supply. In addition, wheat usage was 9% below last year’s levels. The CME forward curve displays a fairly standard contango market that reflects a carrying charge two years out. This upward slope is reinforced by the very large wheat stocks carried in the delivery market itself of 1.5 million MT, equal to almost two months soft red wheat usage.
Soybeans, as indicated by USDA, showed higher level of stocks and a 3% drop in demand from a year ago, due to a slowing of current year demand by China – the largest soybean consumer. Intended planted acres, however, were below estimates and these stocks and acres numbers predictably eased the market backwardation. The old crop/new crop spread – the numeric difference between the July 2012 and the November 2012 – fell over 20% following the report (Fig. 4), but since reversed, supported by strong cash values and further deterioration of South American production.
Maize, as reported by the USDA, revealed the biggest variance from average estimates collected prior to the report for both stocks and planting intentions. March 1 maize stocks were lower than last year – which was also a tight stock-to-use situation – and intended acres were the largest in 70 years.
100
150
200
250
300
MayMarDecSeptJulyMay
USD per tonne
Contract prices as of Apr 2nd 2012Contract prices as of Dec 15th 2011 Contract prices as of Apr 13th 2007
Figure 1. Forward Curves - May through May comparison-Maize
150
200
250
300
MayMarDecSeptJulyMay
USD per tonne
Contract prices as of Apr 2nd 2012Contract prices as of Dec 15th 2011 Contract prices as of Apr 13th 2007
Figure 2. Forward Curves - May through May comparison-Wheat
250
350
450
550
MayMarJanNovSeptAugJulyMay
USD per tonne
Contract prices as of Apr 2nd 2012Contract prices as of Dec 15th 2011 Contract prices as of Apr 13th 2007
Figure 3. Forward Curves - May through May comparison-Soybeans
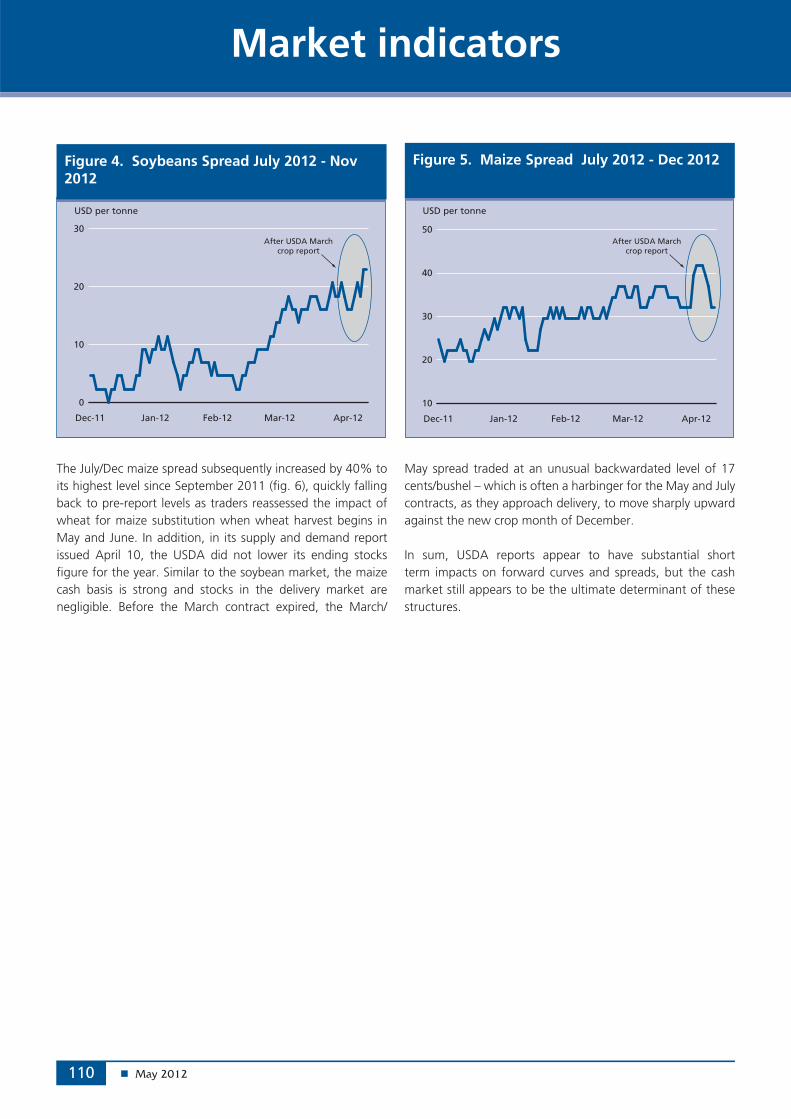
May 2012110
Market indicatorsMarket indicators
The July/Dec maize spread subsequently increased by 40% to its highest level since September 2011 (fig. 6), quickly falling back to pre-report levels as traders reassessed the impact of wheat for maize substitution when wheat harvest begins in May and June. In addition, in its supply and demand report issued April 10, the USDA did not lower its ending stocks figure for the year. Similar to the soybean market, the maize cash basis is strong and stocks in the delivery market are negligible. Before the March contract expired, the March/
0
10
20
30
Apr-12Mar-12Feb-12Jan-12Dec-11
USD per tonne
After USDA Marchcrop report
Figure 4. Soybeans Spread July 2012 - Nov 2012
10
20
30
40
50
Apr-12Mar-12Feb-12Jan-12Dec-11
USD per tonne
After USDA Marchcrop report
Figure 5. Maize Spread July 2012 - Dec 2012
May spread traded at an unusual backwardated level of 17 cents/bushel – which is often a harbinger for the May and July contracts, as they approach delivery, to move sharply upward against the new crop month of December.
In sum, USDA reports appear to have substantial short term impacts on forward curves and spreads, but the cash market still appears to be the ultimate determinant of these structures.

May 2012 111
Market indicatorsMarket indicators
OCEAN FREIGHT MARKET (March 2011 - March 2012)
After peaking in October last year, dry bulk ocean freight rates in the grain-carrying sectors fell to three-year lows in February 2012, before regaining some strength. Much of the fall was attributed to a collapse in the non-grain Capesize sector in the first weeks of 2012, following a spell of sustained strength in the second half of last year. Surplus tonnage, weaker demand for minerals, as economic growth slowed, and interruptions caused by bad weather in Brazil and Western Australia, were among several influences. The most important negative factor, affecting the entire dry bulk market, remained the growth in fleet capacity which, by the end of 2011, had reached 610 mt. deadweight, up from 534 mt. one year earlier. Approximately 190m. tons of dry cargo tonnage (representing nearly one-third of the existing fleet) remained on order, with some 115m. due for delivery in 2012.
Among the grain-carrying categories, the biggest declines were registered in Atlantic Panamax rates, with more ballasters entering from the Pacific and Indian Oceans, mostly for cargoes from South America. In February, however, rates began to firm on the back of improved demand for commodities, notably on routes from South America and the US Gulf. In Europe, severe winter conditions interrupted shipments, especially out of the Black Sea. Moreover, piracy
OCEAN FREIGHT RATES
BDI and average of Baltic Indices (March 2011 – March 2012)
500
1000
1500
2000
2500
MFJDNOSAJJMAM
2011 2012
Baltic dry index
Average of grain-carrying indices
threats pushed insurance premiums higher on routes along Africa’s east coast, the Arabian Sea and the Indian Ocean. Nevertheless, the average of the three grain-carrying indices still registered a net fall of 37% over the five months to end-March. The Baltic Dry Index (BDI) dropped by as much as 51%, reflecting the steep decline in Capesize values, which showed few signs of recovery after January.
SELECTED ROUTES (monthly averages) USD/tonne
Brazil/EU ARAH US Gulf/EU ARAH US Gulf/Japan US Gulf/S. Korea
Vessel size Handysize Panamax Panamax Panamax
Origin Brazil US (Gulf) US (Gulf) US (Gulf)
Destination EU (ARAH) EU (ARAH) Japan South Korea
March 2011 41 28 57 58
April 2011 44 26 57 58
May 2011 43 26 58 59
June 2011 42 28 55 56
July 2011 42 28 54 55
August 2011 43 28 53 54
September 2011 42 27 53 54
October 2011 45 29 55 56
November 2011 46 28 57 58
December 2011 44 26 57 58
January 2012 42 25 55 56
February 2012 36 21 49 50
March 2012 35 21 49 50
(Contributed by the International Grains Council (IGC) www.igc.org.uk)

May 2012112
Market indicatorsMarket indicators
The Panamax market fell heavily in January in both basins due to sluggish demand for raw materials and surplus tonnage, notably in the US Gulf. February and March saw an increase in grain shipments from South America to Far East Asia, lifting rates, but only partly offsetting the earlier steep decline. Overall, transatlantic rates dipped by 42% between November and March, to about USD 7 800 daily.
Handysize/Supramax rates fell by nearly two-thirds between November and January due to tonnage overcapacity and a downturn in demand, with owners running the fleet close to break-even levels. In South America, particular problems occurred in January, when a long dry spell caused reduced draught levels in the Parana River, grounding vessels and leaving a long queue. Increased grain shipments in
March from the US Gulf and South America to Far East Asia underpinned rates, but they remained much lower than in early-November. The Pacific Supramax sector was supported in February by seasonal nickel ore shipments.
Growing fleet overcapacity and a sharp drop in mineral demand triggered a dramatic slide in the Capesize sector in January, with rates falling close to operating costs and mostly remaining close to these levels in subsequent months The situation was exacerbated by weather interruptions to key iron ore supplies and, in March, by the process of port de-congestion in China, effectively releasing some 60 additional ships back onto the market. The fall was reflected in the Baltic Exchange Capesize index (BCI), which lost as much as half of its value between November and March.
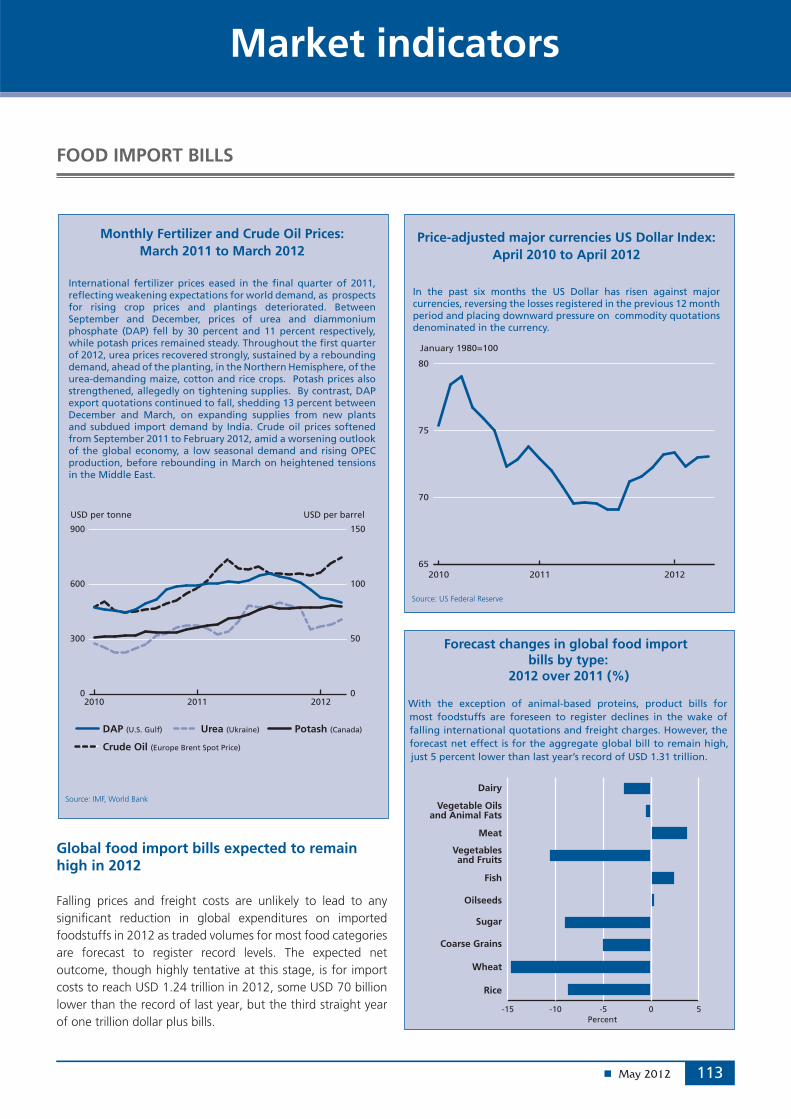
May 2012 113
Market indicatorsMarket indicators
FOOD IMPORT BILLS
Monthly Fertilizer and Crude Oil Prices: March 2011 to March 2012
International fertilizer prices eased in the final quarter of 2011, reflecting weakening expectations for world demand, as prospects for rising crop prices and plantings deteriorated. Between September and December, prices of urea and diammonium phosphate (DAP) fell by 30 percent and 11 percent respectively, while potash prices remained steady. Throughout the first quarter of 2012, urea prices recovered strongly, sustained by a rebounding demand, ahead of the planting, in the Northern Hemisphere, of the urea-demanding maize, cotton and rice crops. Potash prices also strengthened, allegedly on tightening supplies. By contrast, DAP export quotations continued to fall, shedding 13 percent between December and March, on expanding supplies from new plants and subdued import demand by India. Crude oil prices softened from September 2011 to February 2012, amid a worsening outlook of the global economy, a low seasonal demand and rising OPEC production, before rebounding in March on heightened tensions in the Middle East.
0
50
100
150
0
300
600
900
201220112010
USD per tonne USD per barrel
DAP (U.S. Gulf) Urea (Ukraine)
Crude Oil (Europe Brent Spot Price)
Potash (Canada)
Source: IMF, World Bank
Global food import bills expected to remain high in 2012
Falling prices and freight costs are unlikely to lead to any significant reduction in global expenditures on imported foodstuffs in 2012 as traded volumes for most food categories are forecast to register record levels. The expected net outcome, though highly tentative at this stage, is for import costs to reach USD 1.24 trillion in 2012, some USD 70 billion lower than the record of last year, but the third straight year of one trillion dollar plus bills.
Forecast changes in global food import bills by type:
2012 over 2011 (%)
With the exception of animal-based proteins, product bills for most foodstuffs are foreseen to register declines in the wake of falling international quotations and freight charges. However, the forecast net effect is for the aggregate global bill to remain high, just 5 percent lower than last year’s record of USD 1.31 trillion.
-15 -10 -5 0 5Percent
Dairy
Meat
Wheat
Rice
Vegetablesand Fruits
Vegetable Oilsand Animal Fats
Oilseeds
Fish
Sugar
Coarse Grains
Price-adjusted major currencies US Dollar Index: April 2010 to April 2012
In the past six months the US Dollar has risen against major currencies, reversing the losses registered in the previous 12 month period and placing downward pressure on commodity quotations denominated in the currency.
65
70
75
80
201220112010
January 1980=100
Source: US Federal Reserve

May 2012114
Market indicatorsMarket indicators
Forecast import bills of total food and major foodstuffs (USD billion)
World Developed Developing LDC LIFDC Sub-Saharan
Africa
2011 2012 2011 2012 2011 2012 2011 2012 2011 2012 2011 2012
TOTAL FOOD 1 312 772 1 243 278 824 986 777 493 487 787 465 786 35 138 32 852 212 641 204 439 39 051 35 433
Vegetable and Fruits 218 415 195 736 169 584 151 976 48 831 43 760 2 963 2 655 19 276 17 275 2 608 2 338
Cereals 201 172 184 933 88 743 81 722 112 429 103 211 12 873 11 786 41 839 37 464 16 066 14 558
Meat 118 266 133 308 89 187 96 408 29 079 36 900 1 671 1 873 6 895 8 724 1 875 2 003
Fish 121 874 124 513 93 021 96 509 28 853 28 004 604 587 8 462 8 213 3 277 3 181
Dairy 85 113 82 844 56 590 54 420 28 523 28 425 1 891 1 827 12 816 13 030 1 711 1 681
Vegetable, Oils and Animal Fats 110 550 110 141 50 916 50 363 59 634 59 778 5 939 5 795 38 387 38 403 4 420 4 190
Oilseeds 77 941 78 043 26 385 25 341 51 556 52 702 354 359 38 817 40 505 373 368
Sugar 60 644 55 298 33 960 30 637 26 684 24 662 4 552 4 159 14 113 13 067 3 659 2 525
Contact:
The global food import bill is likely be marked by strong to moderate falls in the cost of importing vegetables and fruits, tropical beverages, sugar and cereals, while import expenditures on vegetable oils and fats, which had on average been rising at around 17 percent per year in the past decade, are likely to stall to USD 110 billion. Against the trend of either moderating or stabilizing product expenditures are higher bills for animal-based proteins, notably meat and fish, which driven by higher prices are expected to rise to a combined total of USD 271 billion.
The composition of high-valued products foreseen in the imported food baskets of many countries is on the back of sustained income growth, even among the most economically vulnerable. With improved domestic production prospects for 2012, rising import volumes at lower costs for many LDCs and LIFDCs should result in increased food availabilities.
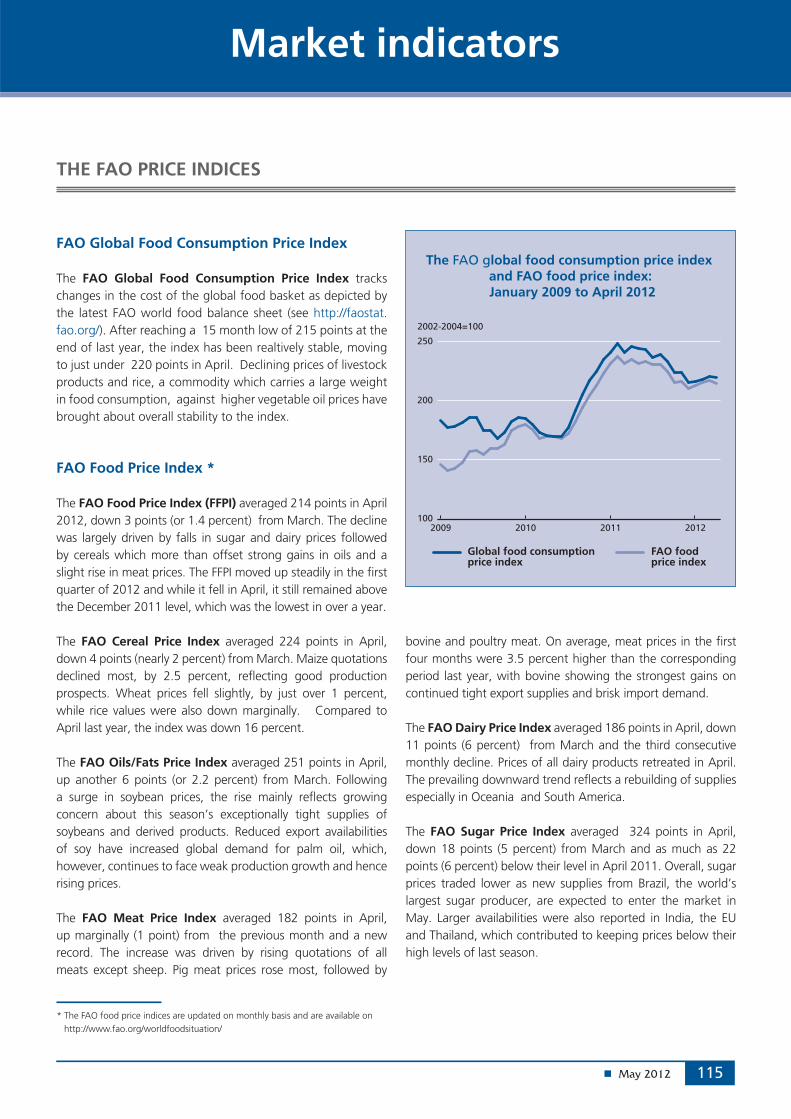
May 2012 115
Market indicatorsMarket indicators
100
150
200
250
2012201120102009
2002-2004=100
Global food consumptionprice index
FAO foodprice index
The FAO global food consumption price index and FAO food price index: January 2009 to April 2012
THE FAO PRICE INDICES
FAO Global Food Consumption Price Index
The FAO Global Food Consumption Price Index tracks changes in the cost of the global food basket as depicted by the latest FAO world food balance sheet (see http://faostat.fao.org/). After reaching a 15 month low of 215 points at the end of last year, the index has been realtively stable, moving to just under 220 points in April. Declining prices of livestock products and rice, a commodity which carries a large weight in food consumption, against higher vegetable oil prices have brought about overall stability to the index.
FAO Food Price Index *
The FAO Food Price Index (FFPI) averaged 214 points in April 2012, down 3 points (or 1.4 percent) from March. The decline was largely driven by falls in sugar and dairy prices followed by cereals which more than offset strong gains in oils and a slight rise in meat prices. The FFPI moved up steadily in the first quarter of 2012 and while it fell in April, it still remained above the December 2011 level, which was the lowest in over a year.
The FAO Cereal Price Index averaged 224 points in April, down 4 points (nearly 2 percent) from March. Maize quotations declined most, by 2.5 percent, reflecting good production prospects. Wheat prices fell slightly, by just over 1 percent, while rice values were also down marginally. Compared to April last year, the index was down 16 percent.
The FAO Oils/Fats Price Index averaged 251 points in April, up another 6 points (or 2.2 percent) from March. Following a surge in soybean prices, the rise mainly reflects growing concern about this season’s exceptionally tight supplies of soybeans and derived products. Reduced export availabilities of soy have increased global demand for palm oil, which, however, continues to face weak production growth and hence rising prices.
The FAO Meat Price Index averaged 182 points in April, up marginally (1 point) from the previous month and a new record. The increase was driven by rising quotations of all meats except sheep. Pig meat prices rose most, followed by
bovine and poultry meat. On average, meat prices in the first four months were 3.5 percent higher than the corresponding period last year, with bovine showing the strongest gains on continued tight export supplies and brisk import demand.
The FAO Dairy Price Index averaged 186 points in April, down 11 points (6 percent) from March and the third consecutive monthly decline. Prices of all dairy products retreated in April. The prevailing downward trend reflects a rebuilding of supplies especially in Oceania and South America.
The FAO Sugar Price Index averaged 324 points in April, down 18 points (5 percent) from March and as much as 22 points (6 percent) below their level in April 2011. Overall, sugar prices traded lower as new supplies from Brazil, the world’s largest sugar producer, are expected to enter the market in May. Larger availabilities were also reported in India, the EU and Thailand, which contributed to keeping prices below their high levels of last season.
* The FAO food price indices are updated on monthly basis and are available on http://www.fao.org/worldfoodsituation/
May 2012116
Market indicatorsMarket indicators
The FAO Food Price Index is a measure of the monthly change in international prices of a basket of food commodities.
The FAO Food Commodity Price Indices show changes in monthly international prices of major food commodities.
130
160
190
220
2502002-2004=100
2011
2010
2009
20082012
FAO Food Price Index
DNOSAJJMAMFJ125
200
275
350
425
20122011
2002-2004=100
Dairy
Oils & FatsCereals
Sugar
Meat
Food Commodity Price Indices
AMFJDNOSAJJMA

May 2012 117
Market indicatorsMarket indicators
Food Price Index1 Meat2 Dairy3 Cereals4 Oils and Fats5 Sugar6
2000 90 96 95 85 68 116
2001 93 96 107 86 68 123
2002 90 90 82 95 87 98
2003 98 97 95 98 101 101
2004 112 114 123 107 112 102
2005 117 120 135 103 104 140
2006 127 119 128 121 112 210
2007 159 125 212 167 169 143
2008 200 153 220 238 225 182
2009 157 133 142 174 150 257
2010 185 152 200 183 193 302
2011 228 177 221 247 252 369
2011 April 235 180 229 265 261 346
May 232 180 231 261 261 312
June 233 178 232 259 259 358
July 231 177 228 247 253 400
August 231 179 221 252 245 394
September 225 177 215 244 239 379
October 216 176 204 231 224 361
November 216 181 201 229 235 340
December 211 179 202 218 227 327
2012 January 213 174 207 223 234 334
February 216 178 202 226 239 342
March 217 181 197 228 245 342
April 214 182 186 224 251 324
FAO Food Price Index
1 Food Price Index: Consists of the average of five commodity group price indices mentioned above weighted with the average export shares of each of the groups
for 2002-2004: in total 55 commodity quotations considered by FAO Commodity Specialists as representing the international prices of the food commodities noted are
included in the overall index.
2 Meat Price Index: Computed from average prices of four types of meat, weighted by world average export trade shares for 2002-2004. Quotations include two poultry
products, three bovine meat products, three pig meat products, and one ovine meat product. Where more than one quotation exists for a given meat type, they are
weighted by assumed fixed trade shares. Prices for the two most recent months may be estimates and subject to revision.
3 Dairy Price Index: Consists of butter, SMP, WMP, cheese, casein price quotations; the average is weighted by world average export trade shares for 2002-2004.
4 Cereals Price Index: This index is compiled using the grains and rice price indices weighted by their average trade share for 2002-2004. The grains Price Index consists
of International Grains Council (IGC) wheat price index, itself average of nine different wheat price quotations, and one maize export quotation; after expressing the
maize price into its index form and converting the base of the IGC index to 2002-2004. The Rice Price Index consists of three components containing average prices
of 16 rice quotations: the components are Indica, Japonica and Aromatic rice varieties and the weights for combining the three components are assumed (fixed) trade
shares of the three varieties.
5 Oil and Fat Price Index: Consists of an average of 11 different oils (including animal and fish oils) weighted with average export value shares of each oil product for
2002-2004.
6 Sugar Price Index: Index form of the International Sugar Agreement prices with 2002-2004 as base.

http://www.fao.org/economic/ess/syb/en/
For enquiries or further information contact:
Abdolreza Abbassian
Trade and market Division
Food and Agriculture Organization of the United Nations
Via delle Terme di Caracalla
00153 Rome - Italy
Telephone: 0039-06-5705-3264
Facsimile: 0039-06-5705-4495
E-mail: [email protected] or [email protected]
Disclaimer
The designations employed and the presentation of material in this report do
not imply the expression of any opinion whatsoever on the part of the Food and
Agriculture Organization of the United Nations concerning the legal status of any
country, territory, city or area or of its authorities, or concerning the delimitation of
its frontiers or boundaries.
Food Outlook is published by the Trade and Market Division of FAO under Global Information and Early Warning System (GIEWS). It is a biannual publication focusing on developments affecting global food and feed markets. Each report provides comprehensive assessments and short term forecasts for production, utilization, trade, stocks and prices on a commodity by commodity basis and includes feature articles on topical issues. Food Outlook maintains a close synergy with another major GIEWS publication, Crop Prospects and Food Situation, especially with regard to the coverage of cereals. Food outlook is available in English, French, Spanish and Chinese.
Food Outlook and other GIEWS reports are available on the internet as part of the FAO world wide web (http://www.fao.org/) at the following URL address: http://www.fao.org/giews/. Other relevant studies on markets and global food situation can be found at http://www.fao.org/worldfoodsituation.
This report is based on information available up to late April 2012. The next Food Outlook report will be published in November 2012.