global market review of juices and nectars – forecasts to 2011 · global market review of juices...
TRANSCRIPT
Global market review of juices and nectars –
forecasts to 2011
2005 edition
Page i
Global market review of juices and nectars – forecasts to 2011 1st edition by Michael Mayers
June 2005
Published by
Aroq Limited Seneca House
Buntsford Park Road
Bromsgrove
Worcestershire
B60 3DX
United Kingdom
Tel: +44 (0)1527 573 600
Fax: +44 (0)1527 577 423
Web: www.just-drinks.com
Registered in England no: 4307068
© 2005 All content copyright Aroq Ltd. All rights reserved.

Page ii
Single-user licence edition
This report is provided for individual use only. If you would like to share this
report with your colleagues, please order additional copies or sign up for a
multi-user licence by contacting.
Rebecca Rice Research manager, just-drinks.com
Tel: +44 (0)1527 573 605
Fax: +44 (0)1527 577 423
Email: [email protected]
Copyright statement
© 2005 All content copyright Aroq Limited. All rights reserved.
This publication, nor any part of it, may be copied, reproduced, stored in a
retrieval system, or be transmitted in any form by any means electronic,
mechanical, photocopying, recording or otherwise without the prior permission
of Aroq Limited.
This report is the product of extensive research work. It is protected by
copyright under the Copyright, Designs and Patents Act 1988.
Aroq Limited offers a reward of £1,000 for information leading to the successful prosecution for illegal copying of this document.
The authors of Aroq Limited research reports are drawn from a wide range of
professional and academic disciplines. The facts within this report are believed
to be correct at the time of publication but cannot be guaranteed. All
information within this study has been reasonably verified to the author’s and
publisher’s ability, but neither accept responsibility for loss arising from
decisions based on this report.
© 2005 All content copyright Aroq Ltd. All rights reserved.
Page iii
Table of contents
Single-user licence edition............................................................................................................. ii Copyright statement .................................................................................................................. ii
Table of contents ........................................................................................................................... iii
List of tables ................................................................................................................................... vi
List of figures ............................................................................................................................... viii
just-drinks.com membership ........................................................................................................ ix
About the author ............................................................................................................................. 1
Chapter 1 - Executive summary..................................................................................................... 2 Definition ................................................................................................................................... 2 Key findings............................................................................................................................... 2
Chapter 2 - Market definitions of juices and nectars................................................................. 10 Fruit juices............................................................................................................................... 10 Nectar...................................................................................................................................... 11 Vegetable juice........................................................................................................................ 11 Distribution of juices & nectars................................................................................................ 11
Chapter 3 - The leading international companies...................................................................... 12 Introduction ............................................................................................................................. 12 Company profiles .................................................................................................................... 13
Nestle SA........................................................................................................................ 13 Kraft Foods Inc ............................................................................................................... 15 PepsiCo Inc ....................................................................................................................17 Coca-Cola Inc................................................................................................................. 19 Cadbury Schweppes Plc ................................................................................................ 20 H.J. Heinz Company....................................................................................................... 22 Campbell Soup Company............................................................................................... 23 Del Monte Foods Company............................................................................................ 23 Ocean Spray Cranberries Inc ......................................................................................... 24 Gerber Foods Soft Drinks Limited .................................................................................. 25
Major companies’ marketing strategies .................................................................................. 25
Chapter 4 - The global market...................................................................................................... 27 Total market value 2004 ......................................................................................................... 27 Trends in sales by volume 2000-2004 .................................................................................... 27 Global market structure 2004.................................................................................................. 28
© 2005 All content copyright Aroq Ltd. All rights reserved.
Juices v nectars.............................................................................................................. 28 Off-trade versus on-trade ............................................................................................... 29
Page iv
Flavours.......................................................................................................................... 29 Packaging....................................................................................................................... 30
Estimated sales of juice and nectar by region ........................................................................ 30 Regional market shares of combined off- and on-trade volume sales 2004 .................. 31 Regional sales trends 2000-2004................................................................................... 32
Major regional markets............................................................................................................ 35 North America................................................................................................................. 35 Western Europe.............................................................................................................. 35 Asia Pacific ..................................................................................................................... 35 Eastern Europe............................................................................................................... 36 Africa & Middle East ....................................................................................................... 37 Latin America & the Caribbean....................................................................................... 37 Australasia...................................................................................................................... 38
The top ten countries .............................................................................................................. 38 United States ..................................................................................................................39 China .............................................................................................................................. 41 Germany......................................................................................................................... 42 Japan.............................................................................................................................. 44 Russia............................................................................................................................. 44 France ............................................................................................................................ 46 Canada ........................................................................................................................... 46 The UK ........................................................................................................................... 47 Mexico ............................................................................................................................ 47 Poland ............................................................................................................................ 48
Chapter 5 - Consumers................................................................................................................. 49 Demographic profiles .............................................................................................................. 49 Consumer motivation .............................................................................................................. 49
Chapter 6 - Product innovations.................................................................................................. 51
Chapter 7 - Factors that influence demand ................................................................................ 54 Population ............................................................................................................................... 54 The global economy................................................................................................................ 55 Climate and nature.................................................................................................................. 56 Consumer trends..................................................................................................................... 56
Chapter 8 - The global market for juices and nectars – forecasts to 2011.............................. 59 Introduction ............................................................................................................................. 59 Global sales forecasts by region 2004 to 2011....................................................................... 59
North America................................................................................................................. 59 Western Europe.............................................................................................................. 60 Asia Pacific ..................................................................................................................... 61 Eastern Europe............................................................................................................... 62 Africa & Middle East ....................................................................................................... 62 Latin America & the Caribbean....................................................................................... 63 Australasia...................................................................................................................... 64
© 2005 All content copyright Aroq Ltd. All rights reserved.
Global regional structure in 2011 ............................................................................................ 65 The total global market forecast 2004 - 2011 ......................................................................... 67

Page v
Online sources of information ..................................................................................................... 68 Free email newsletters ............................................................................................................ 68 Other research reports ............................................................................................................ 68 Global news and feature articles............................................................................................. 68 Search the web ....................................................................................................................... 68
Your feedback ............................................................................................................................... 69
© 2005 All content copyright Aroq Ltd. All rights reserved.
Page vi
List of tables
Table 1: Financial summary of major international juice and nectar producing companies........... 12
Table 2: Nestle SA financial performance 2000-2004.................................................................... 13
Table 3: Structure of Nestle SA business activities 2004............................................................... 14
Table 4: Nestle SA sales by geographic area 2004....................................................................... 14
Table 5: Kraft Foods Inc financial performance 2001-2004 ........................................................... 15
Table 6: Kraft Foods Inc geographical operations 2004 ................................................................ 16
Table 7: Kraft Foods Inc beverages sales by geographical area 2004.......................................... 17
Table 8: PepsiCo Inc.'s financial performance 2001-2004............................................................. 18
Table 9: Sales percentage split of PepsiCo divisions 2004 ........................................................... 18
Table 10: Coca-Cola Inc. financial performance 2001-2004.......................................................... 19
Table 11: Coca-Cola Inc.'s geographical sales 2004..................................................................... 20
Table 12: Cadbury Schweppes Plc financial performance 2001-2004 .......................................... 21
Table 13: Regional distribution of Cadbury Schweppes Plc sales 2003........................................ 22
Table 14: HJ Heinz Company financial performance 2001-2004................................................... 22
Table 15: Campbell Soup Company financial performance 2001-2004 ........................................ 23
Table 16: Del Monte Foods Company financial performance 2001-2004...................................... 24
Table 17: Trends in total global sales of juices and nectars by volume 2000-2004....................... 28
Table 18: The estimated global and regional markets for total consumption of juices v nectars, %
share 2004................................................................................................................ 29
Table 19: The estimated global sales of juices and nectars - off-trade v on-trade, % share 2004 29
Table 20: Estimated regional market shares of total juice and nectar sales by volume 2004 ....... 32
Table 21: Trends in total regional estimated sales of juices and nectars by volume 2000-2004
(litres bn)................................................................................................................... 33
© 2005 All content copyright Aroq Ltd. All rights reserved.
Page vii
Table 22: Regional markets that drove total global sales of juices and nectars between 2000 and
2004.......................................................................................................................... 34
Table 23: The top juice and nectar markets of Western Europe, 2004 (litres bn and % share of
total regional sales)................................................................................................... 35
Table 24: The top juice and nectar markets of Asia Pacific, 2004 (litres bn and % share of total
regional sales) .......................................................................................................... 36
Table 25: The top juice and nectar markets of Eastern Europe, 2004 (litres bn and % share of
total regional sales)................................................................................................... 36
Table 26: The top juice and nectar markets of Africa and the Middle East, 2004 (litres bn and %
share of total regional sales) .................................................................................... 37
Table 27: The top juice and nectar markets of Latin America and the Caribbean, 2004 (litres bn
and % share of total regional sales) ......................................................................... 37
Table 28: The world's top ten national markets for juices and nectars, 2004 (litres bn total sales
and % global share).................................................................................................. 39
Table 29: The US fruit juice market by value 2000-2004 (total sales US$bn) ............................... 40
Table 30: US Florida orange crop 2000-2004 and 2005 estimate ................................................. 40
Table 31: Estimated company shares of the US juice and nectar market 2003 (% total volume
share)........................................................................................................................ 41
Table 32: Rankings (by value) of the top juice and nectar companies in Germany 2003.............. 43
Table 33: The German juice and nectar market by product type 2003 (% of total sales volume) .43
Table 34: Segmentation of the Russian juice and nectar market by product type, 2003 (% of total
sales volume)............................................................................................................ 45
Table 35: Russian juice and nectar market shares, 2003 (% of total sales volume) ..................... 45
Table 36: Ranking of juice and nectar companies in Mexico by total volume sales 2003 ............. 48
Table 37: Global population trends 1980, 2000, 2050 (bn's of people) ......................................... 55
Table 38: Regional markets for juice and nectar, total sales by volume 2000-2011 (litres bn)...... 65
Table 39: Regional market shares of global juices and nectars, 2011 v 2004 (% of total sales
volume) ..................................................................................................................... 67
Table 40: Global market for juice and nectar, total sales by volume 2000-2011 (litres bn) ........... 67
© 2005 All content copyright Aroq Ltd. All rights reserved.

Page viii
List of figures
Figure 1: Packaging for Tropicana’s Essentials range................................................................... 52
© 2005 All content copyright Aroq Ltd. All rights reserved.

Page ix
just-drinks.com membership
As a 'consumer' of drinks industry research, just-drinks.com site membership
will be especially valuable to you. For just £125 a year (approx* $195/€175)
you will gain access to a growing portfolio of exclusive management briefing
reports, and also receive at least 12 new reports for each year you are a
member.
* Exchange rate correct at time of writing, subject to fluctuation. GBP price
correct at time of writing.
These reports are between 5,000 and 10,000 words and give you fresh insight
into diverse sectors such as FAB’s, wine, beer and soft drinks.
As well as this impressive list of members' only reports, you also gain one
year’s access to a constantly updated stream of news, feature articles and
analysis at www.just-drinks.com. Established in 1999, just-drinks.com has
rapidly evolved into the premier source of global drinks industry news, analysis
and data for busy senior executives.
In addition, membership gives you full access to four years of news and
feature archives, key news headlines from around the web and your own email
alerting tool – AMANDA. In short, a one-stop shop for global drinks industry
intelligence.
For further details of this month’s special joining offer visit:
www.just-drinks.com/offer
© 2005 All content copyright Aroq Ltd. All rights reserved.
About the author Page 1
About the author
Michael Mayers has run his own market research and marketing consultancy
for over 20 years. He is a full member of the Market Research Society (MRS),
an accredited consultant on the Government’s National Consultants Database,
a member of the Independent Consultants Group (ICG) and a member of the
London Chamber of Commerce. Over the years he has worked as a consultant
and managed projects for numerous private clients in the drinks and food
industries as well as market research publishers, right up to the present day.
He is the author of the just-drinks reports: ‘Global market review of premium
beer - with forecasts to 2010’, ‘Global market review of malt whisky - with
forecasts to 2010’ that were published in 2004 and ‘Global market review of
packaged water - with forecasts to 2010’ published in 2005.
Michael wishes to thank Cadbury Schweppes Plc, Coca-Cola Inc and Rodgers
& Rodgers Ltd on behalf of Tropicana of PepsiCo Inc.
© 2005 All content copyright Aroq Ltd. All rights reserved.
Chapter 1 - Executive summary
Chapter 1 - Executive summary
Page 2
© 2005 All content copyright Aroq Ltd. All rights reserved.
Definition
The products included in this report are fruit juices, fruit nectars and vegetable
juices. The juices are extracted from fruit or vegetables and sold in
concentrated or unconcentrated form.
Nectar is made by combining fruit juice with water. It may have added sugar
and/or honey and/or sweeteners.
Vegetable juice is extracted by pressing fresh vegetables that have been
cooked or concentrated. They can be drunk as juices or they can act as
natural flavours or used to enhance the total food system.
Juices and nectars are mainly sold through the retail trade, or off-trade,
throughout the world. However, the global market has a smaller but significant
on-trade, i.e. sales through restaurants, hotels, pubs and clubs, and this sector
is included in the definition of the market in this report.
Key findings
The information in this report has been obtained from a number of different
sources. These include interviews with two leading companies in the juice and
nectar industry, additional information provided by another leading company in
the industry and data that is available in the public domain including major
business reference libraries, company annual reports and the internet.
The main findings contained in the following chapters of the report are
summarised as follows:
○ The leading multinational companies that compete in the global market
for juice and nectar are PepsiCo Inc, Coca-Cola Inc, Cadbury Schweppes
Plc, Del Monte Food Inc, Nestle SA and Kraft Foods Inc.
○ H.J. Heinz Inc is also present but only through its subsidiary company
ABC in Indonesia.
Chapter 2 - Market definitions of juices and nectars
Chapter 2 - Market definitions of juices and nectars
Page 10
© 2005 All content copyright Aroq Ltd. All rights reserved.
This report looks at fruit juices, fruit nectars and vegetable juices. Juices as
such are extracted from fruit or vegetables and sold in concentrated or
unconcentrated forms.
Fruit juices
The latest European Union Directive on fruit juices, ‘The Fruit Juices & Nectars
Regulations 2003,’ implements Council Directive 2001/112/EC. It is designed
to provide legislation to assist consumers by requiring a clearer distinction
between juice obtained directly from fruit and that obtained by the
reconstitution of fruit concentrate. The directive states that:
“This is achieved [i.e. assisting consumers understand the distinction between
juice obtained directly from fruit and fruit concentrate: ed.], by the use of the
product name ‘fruit juice’ for juice produced directly from fruit; and the use of
the name ‘fruit juice from concentrate’ for that made by reconstituting fruit juice
concentrate. The wording ‘from concentrate’ must now be an integral part of
the product name, thus drawing the attention of consumers more readily to the
method of production. Juices made by mixing fruit juice and fruit juice from
concentrate should be labelled as ‘fruit juice’ with the additional wording
‘partially made from concentrate’.”
○ The directive specifies that the proportion of water content removed
from concentrated fruit juice must be at least 50%.
○ Producing juice in concentrate form involves extracting water from the
juice, thereby radically reducing its weight. This makes its transportation
much cheaper, which can offer significant cost savings, given that many
fruits are grown in hot climates, but their juices are consumed in many
countries with cold climates.
○ The EC directive also allows the addition of vitamins and minerals to
fruit juice and this must be shown on the labelling. However, the previous
Chapter 3 - The leading international companies Page 12
Chapter 3 - The leading international companies
Introduction
The global juice and nectar market comprises several famous, mostly
American-owned, multinational companies from the global beverages and food
industries. Though they all market juice and nectar brands, it seems that the
truly global players with international brands are PepsiCo Inc, Coca-Cola Inc,
Cadbury Schweppes Plc and Del Monte Food Inc. Nestle has an important
brand in Libby’s, especially in the US. Kraft Foods Inc juice brands are also
strong in the US. H.J. Heinz Company owns ABC, which is the market leader
in Indonesia (but is not present anywhere else). Campbell Soup Company
specialises in the vegetable juice sector with its V8 brand, again mainly in the
US.
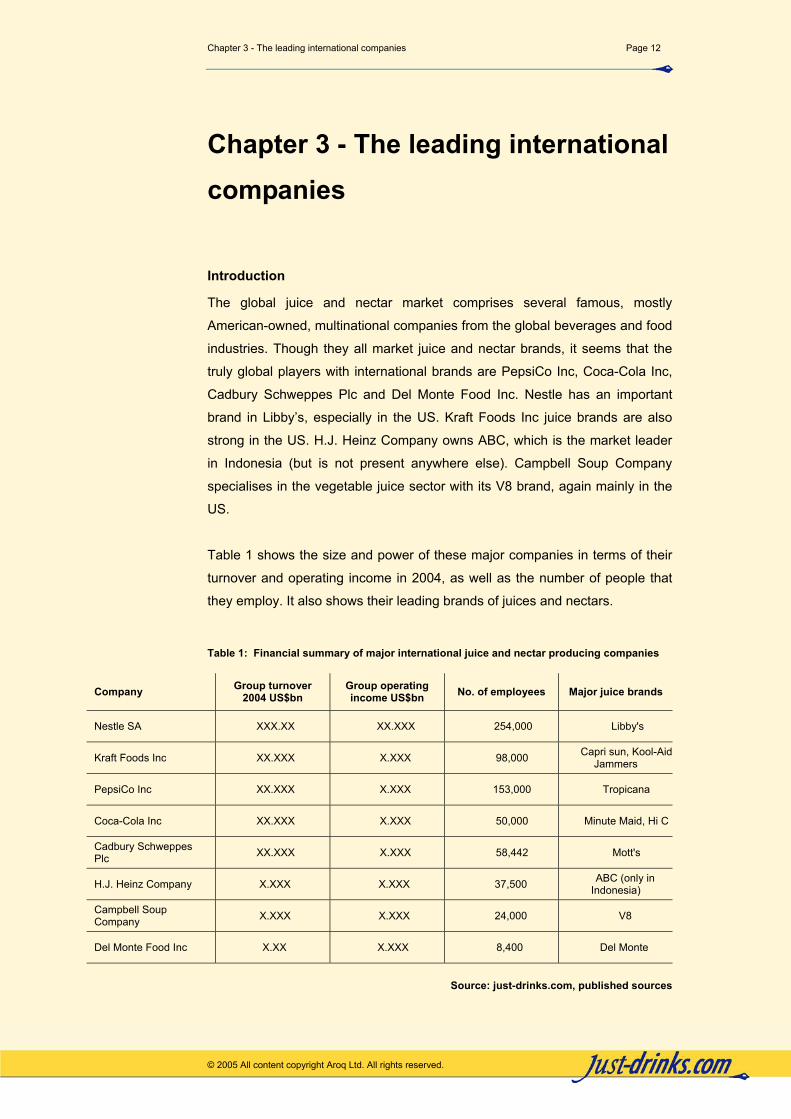
Table 1 shows the size and power of these major companies in terms of their
turnover and operating income in 2004, as well as the number of people that
they employ. It also shows their leading brands of juices and nectars.
Table 1: Financial summary of major international juice and nectar producing companies
Company Group turnover 2004 US$bn
Group operating income US$bn No. of employees Major juice brands
Nestle SA XXX.XX XX.XXX 254,000 Libby's
Kraft Foods Inc XX.XXX X.XXX 98,000 Capri sun, Kool-Aid Jammers
PepsiCo Inc XX.XXX X.XXX 153,000 Tropicana
Coca-Cola Inc XX.XXX X.XXX 50,000 Minute Maid, Hi C
Cadbury Schweppes Plc XX.XXX X.XXX 58,442 Mott's
H.J. Heinz Company X.XXX X.XXX 37,500 ABC (only in Indonesia)
Campbell Soup Company X.XXX X.XXX 24,000 V8
Del Monte Food Inc X.XX X.XXX 8,400 Del Monte
© 2005 All content copyright Aroq Ltd. All rights reserved.
Source: just-drinks.com, published sources
Chapter 4 - The global market
Chapter 4 - The global market
Page 27
© 2005 All content copyright Aroq Ltd. All rights reserved.
Total market value 2004
just-drinks has reviewed a number of published estimates of the value of the
global market for juices and nectars. These estimates depend on how the
market for these products is defined in terms of what has or has not been
included. Available Euromonitor data, for example, shows an estimate of the
global sales of fruit and vegetable juice to be worth nearly US$XXbn in 2004.
However, this represents the value of sales only at the retail level. It is also not
clear whether nectars have been included.
This report shows, further on, that there is a significant on-trade sector for
juices and nectars, especially in the US, France and other Western European
countries. As well as including the off- and on-trade, the just-drinks definition of
the global market also includes nectars.
On this basis, just-drinks estimates that the global market for juice and nectar
was worth in the region of US$XXbn in 2004.
However, since it is important to show trends in sales over a five-year period,
in order to convey consumer demand, just-drinks has used volume figures
expressed in litres. Volume gives a better indication of the true direction in
demand. Value is much more variable since it is dependent on currency
exchange rates and wholesalers and retailers price mark-ups.
Trends in sales by volume 2000-2004
Foodanddrink.com stated in its news release dated 17 February 2004, under
the heading ‘Plenty of juice left in global market:’ “Global consumption of juice
and nectar has risen steadily in recent years, fuelled by a healthy image. And
producers have no intention of taking their foot off the gas, it seems, with a raft
of product innovations to keep consumer interest high.”
More than a year later, just-drinks believes that the latest evidence supports
this assessment of the global market trend. If anything, growth appears to
have been quite strong, not just steady, as we estimate that, in volume terms,
Chapter 5 - Consumers
Chapter 5 - Consumers
Page 49
© 2005 All content copyright Aroq Ltd. All rights reserved.
Demographic profiles
just-drinks asked Coca-Cola what it regards as the consumer demographic
profile for juice and nectar, and whether this profile varies by region. Coke’s
response was short but none-the-less enlightening:
“Juice [and nectar] consumption skews to young kids and older consumers”.
(Coca-Cola Inc)
We put the same question to Cadbury Schweppes. Its response was that the
demographic profiles vary by brand (e.g. Mott’s: mums with kids; Nantucket
Nectars: male/female (50:50), middle-age, upscale income bracket). But these
examples do coincide well with Coca-Cola’s perception, that the consumer
market tends to be polarised between the very young, i.e. children at one end,
and older consumers at the other. What is clear is that neither of these major
players mentions juice and nectar as a big teenage or young adult market.
Consumer motivation
Research conducted by Mintel International Group (Chicago) in the US led the
company to conclude that: “The flavour of juices used at home is highly
dependent upon the presence of children, with grape, fruit punch, mixed
blends and tropical flavours being more popular among households with kids.
Kids clearly have a preference for the sweeter flavours, although Mintel found
that their preferences change as they enter their teens.” The research showed
that, whereas XX% of children aged 6-11 years consumed orange juice, 94%
have consumed other fruit juice/lemonade. Only XX% have consumed tomato
or vegetable juice.
In the same report, Mintel found that parents have concerns over the dangers
of tooth decay in their children. Manufacturers have responded to this concern
by introducing ‘lighter’, i.e. low calorie/low sugar varieties and more ‘natural
lines’.
Chapter 6 – Product innovations Page 51
Chapter 6 - Product innovations
In the competitive global market for juice and nectar, containing some of the
world’s largest multinational beverages and food companies, it is not surprising
that new innovative products or re-launches of existing brands and products
are now a common feature. This is a necessary part of the companies’
respective marketing strategies in order to maintain their competitive edges.
just-drinks asked Coca-Cola to provide information on any new juice and
nectar brands or products that the group has launched in the last 12 months,
i.e. 2004/2005. Its response was as follows:
“We have launched Minute Maid Fruit coolers in over 26 countries. The brand
was recently launched in China and Korea. In the US, we recently launched
Minute Maid Heartwise and Light.” (Coca-Cola Inc)
In its response to this question, Cadbury Schweppes listed the following
launches:
○ “Mott’s, available in 64oz [packaging]
○ Mott’s Plus for Kids, 100% Apple Punch Juice
○ Mott’s Plus for Kids, 100% Apple Grape Juice
○ Mott’s Plus Light Apple Juice Beverage
○ Nantucket Nectars Organics, available in 15 oz and 32 oz”
(Cadbury Schweppes)
Tropicana has launched its new product concept, called Tropicana Essentials.
A company press release described Tropicana Essentials, and the campaign
designed to support its launch, as follows:
“To support the launch of new Tropicana Essentials, Tropicana has announced
details of a £1.5m support programme for 2005 that includes a press
campaign, sponsorship and sampling.
© 2005 All content copyright Aroq Ltd. All rights reserved.
Chapter 7 - Factors that influence demand
Chapter 7 - Factors that influence demand
Page 54
© 2005 All content copyright Aroq Ltd. All rights reserved.
Population
Like all mass markets, the demand for juice and nectar is subject to a number
of major influences, which are examined in this section. There is a clear
correlation between population and the size of any national market for juice
and nectar. This is shown by the fact that the US, China, Germany, Russia and
Japan are the top five largest markets in the world, all having very large
populations. Even when demand for juice and nectar appears to be static or
declining slowly, as in the case of Japan, a country’s large population
maintains its position as a major market.
The regional consumption patterns shown in this report reveal that demand in
the more developed markets of North America and Western Europe is growing
rather slowly. Certainly, in these regions, growth is well below the global
average. In the less developed or emerging economies of Eastern Europe and
Asia Pacific, demand for juice and nectar is very dynamic with annual growth
rates well above the global average. While African countries do have large
populations, some have populations that are actually declining due to the
ravages of disease, notably HIV, as well as periodic famine. Australia and New
Zealand, which form Australasia, are of course developed nations. Like North
America and Western Europe, demand growth rate is below average, but
these two countries have relatively small populations in any case and their
respective juice and nectar markets are also small.
Given the correlation between population size and market size for juice and
nectar, it is possible to look at the likely global pattern over the next few
decades. The United Nations has produced forecasts of global population
trends up to 2050. These predict that the world’s population will grow by XX.X%
between 2000 and 2050, when it will reach X.Xbn. All this growth will take
place in the less developed countries where their combined populations will
rise to X.Xbn. This represents an increase of XX.X% over the first 50 years of
the 21st century. This means that, by 2050, less developed countries will
account for over 88% of the total world population, which is X% higher than in
Chapter 8 - The global market for juices and nectars – forecasts to 2011
Chapter 8 - The global market for juices and nectars – forecasts to 2011
Page 59
© 2005 All content copyright Aroq Ltd. All rights reserved.
Introduction
The forecasts shown in this section take account of the global and regional
trends in sales volumes for the period 2000 to 2004 inclusive. This has been
done principally by regression analyses that project the trends of the last five
years forward to 2011. This statistical approach is, of course, based on the
assumption that all the factors that influenced these past trends will continue to
operate in precisely the same manner for the next seven years. Since such an
assumption is unrealistic, just-drinks has considered all the factors that are
currently influencing demand and has attempted to consider the extent, and in
what manner, they are likely to influence future demand. just-drinks has also
attempted to take into account possible new influencing factors that have yet to
present themselves.
Global sales forecasts by region 2004 to 2011
just-drinks has started by looking at the seven regional forecasts, before
discussing the total global market forecast. This is because the total figures
are a product of the regional figures. Table 38 shows the total each year for all
seven regions.
North America This region is clearly a mature market for juice and nectar. Most consumers
have consumed these products over the years. As reported earlier, XX% of
children in the US aged 6 to 11 have consumed orange juice, and XX% have
consumed other fruit juice/lemonade. The situation is that the market has
reached its peak level in terms of volume consumption, and is dependent upon
new consumers, i.e. children, to replace old consumers who leave the market
through death or other reasons. There are very few potential first-time ‘tryers’
in this region. The region's population is growing but only at a fairly slow rate.
Online sources of information Page 68
Online sources of information
Free email newsletters
Experience just-drinks.com via our free newsletters:
○ Daily industry headlines The most important headlines direct to your inbox daily.
○ Chris Brook-Carter's 'Editors weekly highlights' Chris's unique take on the most important industry events each week.
○ Rebecca Rice's 'Research Update' A monthly synopsis of new, important and reduced-price research.
Sign up at www.just-drinks.com/newsletter
Other research reports
Search for related research reports from over 20 leading research suppliers in
the just-drinks.com store.
Global news and feature articles
Search for related news items and feature articles from just-drinks’s news and feature archives, going back more than four years.
Search the web
Try www.google.com to search for related web sites and pages.
© 2005 All content copyright Aroq Ltd. All rights reserved.

Your feedback Page 69
Your feedback
Your feedback is greatly valued. Please complete the form below with your
positive and negative comments, along with any questions or queries, and fax
it to us on +44 (0)1527 577 423. Thank you.
Name ________________________ Job title ________________________
Company ________________________ Phone ________________________
Email ________________________
Study title _________________________________________________________________
Things I liked about this study...
_________________________________________________________________________
_________________________________________________________________________
_________________________________________________________________________
_________________________________________________________________________
Things I disliked about this study...
_________________________________________________________________________
_________________________________________________________________________
_________________________________________________________________________
_________________________________________________________________________
My questions regarding the content...
_________________________________________________________________________
_________________________________________________________________________
_________________________________________________________________________
_________________________________________________________________________
I would like to see more information on...
_________________________________________________________________________
_________________________________________________________________________
_________________________________________________________________________
_________________________________________________________________________
Other subject areas of interest to me include...
_________________________________________________________________________
_________________________________________________________________________
_________________________________________________________________________
_________________________________________________________________________
© 2005 All content copyright Aroq Ltd. All rights reserved.