global monthly september 2017 - world bankpubdocs.worldbank.org/.../global-monthly-sep17.pdf ·...
TRANSCRIPT

Global Monthly September 2017
Sources: Federal Reserve Economic Data.
Note: Last observation is September 27, 2017.
Metals prices
Overview
• Global growth picked up to 3.6 percent in 17Q2 (q/q saar),
the strongest quarterly performance since 2010.
• The 17Q2 performance reflects an acceleration in advanced
economies and continued recovery in major commodity-
exporting emerging markets and developing economies
(EMDEs).
• Global financing conditions remain favorable, despite
prospects of further monetary policy normalization in major
advanced economies.
• Oil prices rose to $52/bbl in September, with inventories
dropping in a sign of gradual market rebalancing.
Chart of the Month
• Metals prices rose 19 percent from June to September,
continuing a recovery that started in early 2016.
• The recent uptick was driven by expectations of tightening
supplies.
• This was in part due to China’s reforms to reduce over-
capacity, improve operating efficiency of state-owned
enterprises, and reduce pollution.
• China is the single largest consumer of metals but also
produces half of the world’s refined metal output and steel.
Special Focus: New Fiscal Space Database
• Fiscal space measures a government’s ability to implement effective fiscal policy.
• The World Bank released in August 2017 a new database providing a comprehensive picture of fiscal space in 200
economies over 1990-2016.
• The database documents the recent improvement of fiscal positions in advanced economies and deterioration in
EMDEs, especially commodity exporters.
:e Global Monthly is a publication of the Global Macroeconomics Team of the Prospects Group in the Development Economics Vice Presidency. :is edition was prepared by Marc Stocker and Dana Vorisek, based on contributions from John Ba=es, Mai Anh Bui, Sinem Celik, Ishita Dugar, Gerard Kambou, Eung Ju Kim, Seong Tae Kim, Csilla Lakatos, Yoki Okawa, Shane Streifel, Temel Taskin, Ekaterine Vashakmadze, and Collette Wheeler. :is Global Monthly reBects information available as of September 28. For more information, visit: http://www.worldbank.org/en/research/brief/economic-monitoring
Table of Contents
Monthly Highlights .............................................. 2
Special Focus ....................................................... 6
Recent Prospects Group Publications ...................... 8
Recent World Bank Working Papers....................... 8
Recent World Bank Reports .................................. 8
Table A: Major Data Releases ............................... 8
Table B: Activity and Inflation.............................. 9
Table C: Trade and Finance ................................. 9
Table D: Financial Markets ............................... 10
Table E: Commodity Prices ................................. 10

2
September 2017
Global growth: strongest since end-2010. Global growth picked
up in 17Q2, reaching 3.6 percent (q/q saar), the strongest reading
since 10Q4 (Figure 1A). :e uptick mainly reBects an
acceleration of activity in the United States, the Euro Area, and
Japan, continued robust growth in East Asia and PaciGc, and
strengthening growth in Eastern Europe and Central Asia. Global
manufacturing PMIs remained Grmly in expansionary territory in
July and August, suggesting continued momentum in 17Q3. :e
ongoing recovery in advanced economies and diminishing
obstacles to activity among commodity-exporting emerging
market and developing economies (EMDEs) continue to be key
drivers of the pickup in global activity in 2017. Global median
inBation edged up in July and August, reaching 2.4 percent, its
highest level since March 2017.
Global trade: broad-based recovery in exports. Global goods
trade growth, which began to recover in mid-2016 after two years
of pronounced weakness, remained robust in recent months. :e
beneGts of the recovery in global trade have been broad based,
with export growth trending upwards in advanced economies and
remaining Grm in EMDEs (Figure 1B). Across EMDE regions,
export growth was robust in Asia and Eastern Europe, but
remained soft in Africa and the Middle East. PMI surveys point
to sustained gains in global export orders during 17Q3.
United States: ongoing momentum. Growth recovered in 17Q2
to 3.1 percent (q/q saar), supported by renewed strength in
consumer spending. High-frequency indicators point to sustained
albeit slightly weaker growth in 17Q3. :e landfalls in Texas and
Florida of two major hurricanes in August and September caused
regional economic disruptions, but the dampening e=ect on
activity should be short-lived. :e pace of job creation moderated
in recent months, partly reBecting increasingly tight labor market
conditions (Figure 1C). :e unemployment rate was 4.4 percent
in August, a touch above the post-crisis low of 4.3 percent;
however, hourly wage growth remained subdued. :e U.S.
Federal Reserve kept policy interest rates unchanged in
September, but suggested the possibility of an additional hike by
year-end, followed by three more in 2018. A gradual reduction in
the size of central bank’s balance sheet will start in October.
Proposals to cut and simplify corporate and personal income taxes
were presented, but important details still need to be Beshed out.
Monthly Highlights
FIGURE 1B Goods export growth
FIGURE 1C U.S. job creation
Sources: CPB Netherlands Bureau for Economic Policy Analysis, Federal
Reserve Bank of St. Louis, World Bank.
A. Last observation is 2017Q2.
B. Data are 3-month on 3-month moving averages. Last observation is July 2017.
C. Data show average monthly changes in thousands of persons on nonfarm
payroll. Last observation is August 2017.
FIGURE 1A Global GDP growth

3
September 2017
Euro Area: continued strength. Growth in 17Q2 reached 2.6
percent (q/q saar), up from 2.2 percent in 17Q1, and surveys
point to continued robust activity in 17Q3. :e pickup reBects a
broad-based improvement in activity across countries, with
increases in household spending and gross Gxed capital formation.
:e unemployment rate, at 9.1 percent (sa) in June and July, was
at the lowest level since March 2009. Labor shortages have
jumped in some countries, including Germany and the
Netherlands, reaching their highest levels since 2000 (Figure 2A).
:e European Central Bank (ECB) kept interest rates and its
bond-purchase program unchanged in September.
Japan: stronger domestic demand. Growth picked up
signiGcantly in 17Q2, reaching 2.5 percent (q/q saar), supported
by strengthening private consumption, robust private investment,
and a boost to public investment from last year’s supplementary
budget. Manufacturing and services PMIs in August suggest
continued momentum in Q3. :e Bank of Japan kept its policy
stance unchanged in September, as core inBation (excluding fresh
food and energy) remains close to zero.
China: steady growth. While GDP growth was stable in 17Q2,
at 6.9 percent (y/y), it is shifting from state-driven investment to
exports amid robust consumption growth. Despite monetary and
regulatory tightening, credit growth continues to outpace
nominal GDP growth (Figure 2B). :e total stock of non-
Gnancial sector debt, estimated at around 260 percent of GDP in
16Q4, is still expanding. Citing risks associated with rising debt,
Standard and Poor’s cut China’s sovereign credit rating in
September. Incoming data for 17Q3 have been mixed. :e
Caixin composite PMI rose in August to the highest level since
February, but contraction of mining production in August, and
house price growth in major cities continued to slow on tighter
regulations. In September, the renminbi reversed some of its
previous appreciation against the U.S. dollar, following the
removal of reserve requirements for foreign currency trading.
Tighter enforcement of capital-Bow management measures
continue to limit capital outBow pressures.
Commodity-exporting EMDEs: ongoing recovery. Growth
recovered further in large commodity exporting EMDEs in
17Q2, while inBation moderated, allowing some central banks to
ease policy (Figure 2C). In Brazil, GDP expanded 0.3 percent (y/
y) in 17Q2—the Grst positive annual reading since 14Q1—
FIGURE 2B Credit and nominal GDP growth in
China
FIGURE 2A Euro Area labor shortages
FIGURE 2C Inflation in major EMDE commodity
exporters
Source: European Commission, Haver Analytics, World Bank.
A. Data based on business sentiment surveys. Last observation is 2017Q3.
B. Non-financial enterprises include both public and private enterprises.

4
September 2017
supported by a rebound in private consumption. Retail sales and
industrial production data in early Q3 suggest continued
improvement. Growth in Russia accelerated strongly in 17Q2, to
2.5 percent (y/y), from 0.5 percent in Q1. High-frequency data
suggest that both industrial and services sectors are recovering.
:e tightening of U.S. sanctions on Russia in July and extension
of EU sanctions in September may weigh on sentiment, however.
Growth was stable in Indonesia in 17Q2, at 5 percent (y/y). After
a recession in 2016 and 17Q1, Nigeria’s GDP expanded 0.6
percent (y/y) in 17Q2, following Gve quarters of negative y/y
growth, on a recovery in the oil sector. PMI readings in July and
August suggest continued expansion in 17Q3. Growth in South
Africa edged up in 17Q2, to 1.1 percent (y/y), led by an uptick
in agricultural activity. Moderating mining production growth
and a manufacturing output contraction of 1.4 percent (y/y) in
July suggest softening activity at the start of 17Q3.
Commodity-importing EMDEs: continued robust growth.
Growth in commodity-importing EMDEs remained robust in
17Q2, though at a slightly slower pace than in 17Q1 (Figure 3A).
In India, GDP growth moderated for the Gfth consecutive
quarter, to a still strong 5.7 percent (y/y) in 17Q2, amid
temporary disruptions due to uncertainty leading up to the
implementation of the new Goods and Services Tax in July. :e
manufacturing PMI bounced back in August, however, to 51.2.
Growth in Mexico decelerated to 1.8 percent (y/y) in 17Q2, in
line with market expectations. Growth continues to be supported
by solid services sector activity. :e incidence of two powerful
earthquakes in September will likely disrupt activity in the short-
term. Growth in Turkey was strong in 17Q2, at 5.1 percent (y/y)
amid Gscal support and further easing of policy uncertainty.
Robust export growth in Turkey is being supported by
strengthening demand from the Euro Area, and manufacturing
PMI in August and consumer conGdence in September suggest
continued momentum in Q3. .ailand’s GDP growth
accelerated to 3.7 percent (y/y) in 17Q2, driven by a rebound in
exports and stock-building, which o=set a deceleration in Gxed
investment.
Global /nancing conditions: benign. Global Gnancing
conditions remained benign in September, and equity and bond
market volatility fell, following a short-lived increase in August.
:e U.S. 10-year Treasury yield hovered around 2.2 percent in
FIGURE 3B Longer-term forecast of U.S. policy
interest rate by FOMC members
FIGURE 3A GDP growth in commodity-exporting
and commodity-importing EMDEs
FIGURE 3C U.S. dollar exchange rate
Sources: Board of Governors of the Federal Reserve System, Federal Reserve
Bank of St. Louis, World Bank.
A. Last observation is 2017Q2.
B. Median forecast of U.S. federal funds rate by FOMC members. Last
observation is September 20, 2017.
C. An increase indicates an appreciation. Last observation is September 22,
2017.

5
September 2017
September, close to the level prevailing before the start of the
tightening cycle in December 2015, despite a 100 basis-point
increase in policy interest rates over the same period. Low long-
term yields reBected subdued inBation expectations and prospects
of persistently low equilibrium rates. In September, Federal
Open Market Committee (FOMC) participants downgraded
their longer-term forecasts for policy interest rates (Figure 3B).
Downward pressure on the U.S. dollar continued in September,
particularly against the euro (Figure 3C).
EMDE /nancing conditions: broadly favorable. EMDE assets in
September continued to be buoyed by strong demand from
international investors. Bond spreads have narrowed to levels last
seen in June 2014, before the collapse of oil prices, with
borrowing conditions improved most for investment-grade
borrowers (Figure 4A). Net capital inBows to EMDE bond and
equity mutual funds were stable in September, with the weakness
in the U.S. dollar helping to sustain inBows. International bond
issuance across EMDE regions in September was strong (Figure
4B). Bahrain, Russia, Saudi Arabia, South Africa, Tajikistan,
Turkey, and Ukraine raised a combined $26.7 billion of
sovereign debt, and a number of other sovereign borrowers—
including Angola, China, Indonesia, Jordan, Nigeria, and
Pakistan—plan to issue debt in the near future.
Commodity prices: slightly up. Oil prices averaged $53/bbl in
September, up from $50/bbl in August. :e market continues to
rebalance, with OPEC countries’ improved compliance in August
with previously agreed production cuts and falling production in
Libya both contributing to the recent uptick in prices (Figure
4C). Inventories continued to fall from record high levels, while
the Brent futures-price curve steepened, indicating a tightening
market. Hurricane Harvey impacted up to one-third of U.S. oil
reGnery capacity, resulting in a temporary spike in U.S. gasoline
prices that disappeared by mid-September, as reGneries recover.
Metals prices have risen 19 percent over the last three months, on
expectations of tightening supplies. :is was partly driven by
reforms in China aimed at reducing overcapacity and combatting
pollution. Agricultural prices fell in August amid ample global
supplies. China is the single largest consumer of metals but also
produces half of the world’s reGned metal output and steel.
FIGURE 4B EMDE bond issuance by regions
FIGURE 4A EMDE bond spreads
FIGURE 4C OPEC compliance rate
Sources: Dealogic, International Energy Agency, J.P. Morgan, World Bank.
A. Data excludes Venezuela. Last observation is September 22, 2017.
B. Last observation is September 2017.
C. Last observation is August 2017.

6
September 2017
FIGURE 5B Basic attributes of the new database
FIGURE 5A Concept of fiscal space
FIGURE 5C Sustainability gaps under different conditions, advanced economies
Source: Kose et al. (2017).
B. The red dot represents a new database by Kose et al. (2017), while select
studies on fiscal databases are shown as blue dots.
C. Period average sustainability gaps in respective country groups. Lines in gray
show the interquartile range. Refer to Kose et al. (2017) for descriptions of
assumed conditions.
Fiscal space at the center of policy debate. :e importance of a
government’s ability to implement e=ective Gscal policy in the
face of unexpected economic shocks was prominently displayed
during and after the global Gnancial crisis. :is ability is based on
budgetary resources available for governments to stimulate
activity when needed. :e availability of Gscal space has been at
the center of various debates on the e=ective use of counter-
cyclical Gscal policy in both advanced economies and EMDEs.
Concept of /scal space. Fiscal space is a complex concept, with
multiple deGnitions and measures used in the literature. :e core
aspect of Gscal space is the ability of a government to service its
debt. Unless debt service capacity is maintained, a government
cannot indeGnitely Gnance its operations in a sound manner.
Debt service capacity has multiple dimensions—for example,
Gnancing needs related to budget positions, currency and
maturity structure, contingent liabilities, and access to liquid
markets. :e availability of Gscal space is, therefore, a=ected not
only by government debt and balances, but also by three other
aspects of Gscal space: the composition of government balance
sheet, external and private sector debt, and market perception of
sovereign risks (Figure 5A).
New database. :e World Bank’s new cross-country database of
Gscal space, released in August 2017, brings together measures of
di=erent dimensions of Gscal space for a large number of
countries (Figure 5B). :e database includes 28 indicators
coming from the four aspects of Gscal space and, for most
indicators, relies on multiple cross-country sources. It also covers
data for up to 200 economies over the period 1990–2016.
Sustainability gap. :e new database provides a summary metric
of government debt dynamics—namely, the sustainability gap.
:e sustainability gap compares a country’s Gscal balance with
Special Focus: New Database on Fiscal
Space

7
September 2017
the balance that stabilizes government debt at a level under
di=erent assumptions of output growth, long-term interest rates,
and target debt ratio. :e sustainability gap indicator provides a
simple snapshot of the adjustments that may be needed to reach
debt targets under di=erent conditions. A positive (negative) gap
indicates that a Gscal balance would diminish (increase)
government debt below (above) the target level, if sustained. :e
database presents Gve sustainability gap estimates, each based on
primary balance, and each computed under di=erent assumptions
of growth, interest rates, and target debt ratio (Figures 5C, 6A).
:e indicators are available for 107 countries—35 advanced
economies and 72 EMDEs.
Advanced economies and EMDEs. Prior to the global Gnancial
crisis, the evolution of sustainability gaps displayed notable
synchronicity between advanced economies and EMDEs (Figure
6B). From 2003 to the eve of the global Gnancial crisis,
sustainability gaps in both sets of economies improved as rapid
growth reduced deGcits, and both groups faced debt-reducing
Gscal positions. After the crisis, Gscal positions deteriorated
sharply in EMDEs as activity slowed, while debt clearly increased.
In contrast, following a severe deterioration in 2009, Gscal
positions in advanced economies improved, returning to mid-
2000s levels by 2016.
EMDE commodity exporters and importers. Among EMDEs,
commodity exporters experienced more pronounced pre-crisis
improvements and post-crisis deteriorations in Gscal positions,
consistent with commodity price movements (Figure 6C). In
these economies, the sharp deterioration in 2009 was reversed
within a year. However, since the beginning of commodity price
slide in 2011, Gscal positions have steadily deteriorated, and since
2014 they have been materially below those of EMDE
commodity importers. In the latter group, the post-crisis
deterioration in Gscal positions has been more gradual than in
commodity exporters.
FIGURE 6B Sustainability gaps
FIGURE 6A Sustainability gaps under different
conditions, EMDEs
FIGURE 6C Sustainability gaps, EMDEs
Source: Kose et al. (2017).
A. Period average in respective country groups under five different assumptions
for GDP growth rates, interest rates, and target debt ratio. “Country-specific” uses
country-specific median values; “Historical” refers to country-specific median
growth and interest rates and median debt ratio by country group; “Current”
conditions use contemporaneous growth and interest rates, with country-group
median debt ratio; “Stress” conditions are defined as median GDP growth minus
one standard deviation, country-specific median interest rate plus one standard
deviation, and median debt ratio; “Benign” means maximum GDP growth and
minimum interest rates based on 10-year moving averages and country-group
median debt ratio. Lines in gray show the interquartile range. B.C. Simple
averages. Sustainability gaps are measured under current conditions. The year of
global recession (2009) is shaded in gray.
8
September 2017
Recent Prospects Group Publications Global Economic Prospects - June 2017: A Fragile Recovery
Commodity Markets Outlook - April 2017
Global Economic Prospects - January 2017: Weak Investment in Uncertain Times
Recent World Bank Working Papers A Cross-Country Database of Fiscal Space
Which Emerging Markets and Developing Economies Face Corporate Balance Sheet Vulnerabilities? A Novel Monitoring Framework
Export Quality in Advanced and Developing Economies: Evidence from a New Data Set
Financial Globalization: A Glass Half Empty?
Short-term Impact of Brexit on the United Kingdom's Export of Goods
Optimal Targeting under Budget Constraints in a Humanitarian Context
Preferential Trade Agreements and Global Value Chains: Theory, Evidence, and Open Questions
A Bit Far? Geography, International Economic Agreements, and Foreign Direct Investment: Evidence from Emerging Markets
The Nature of Trade and Growth Linkages
Online Exports and the Wage Gap
Evidence for a Presource Curse? Oil Discoveries, Elevated Expectations, and Growth Disappointments
Services Trade and Global Value Chains
Recent World Bank Reports Trouble in the Making? The Future of Manufacturing-Led Development
Doing Business 2017: Equal Opportunity for All
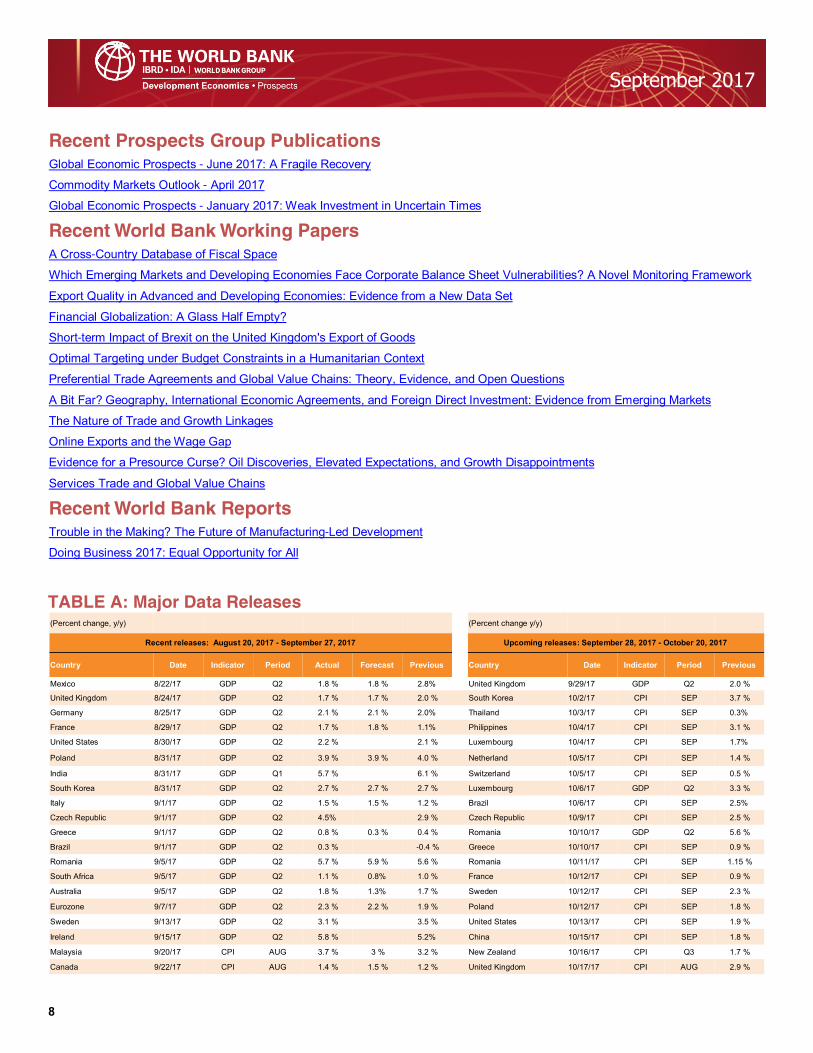
TABLE A: Major Data Releases (Percent change, y/y)
(Percent change y/y)
Recent releases: August 20, 2017 - September 27, 2017 Upcoming releases: September 28, 2017 - October 20, 2017
Country Date Indicator Period Actual Forecast Previous Country Date Indicator Period Previous
Mexico 8/22/17 GDP Q2 1.8 % 1.8 % 2.8% United Kingdom 9/29/17 GDP Q2 2.0 %
United Kingdom 8/24/17 GDP Q2 1.7 % 1.7 % 2.0 % South Korea 10/2/17 CPI SEP 3.7 %
Germany 8/25/17 GDP Q2 2.1 % 2.1 % 2.0% Thailand 10/3/17 CPI SEP 0.3%
France 8/29/17 GDP Q2 1.7 % 1.8 % 1.1% Philippines 10/4/17 CPI SEP 3.1 %
United States 8/30/17 GDP Q2 2.2 % 2.1 % Luxembourg 10/4/17 CPI SEP 1.7%
Poland 8/31/17 GDP Q2 3.9 % 3.9 % 4.0 % Netherland 10/5/17 CPI SEP 1.4 %
India 8/31/17 GDP Q1 5.7 % 6.1 % Switzerland 10/5/17 CPI SEP 0.5 %
South Korea 8/31/17 GDP Q2 2.7 % 2.7 % 2.7 % Luxembourg 10/6/17 GDP Q2 3.3 %
Italy 9/1/17 GDP Q2 1.5 % 1.5 % 1.2 % Brazil 10/6/17 CPI SEP 2.5%
Czech Republic 9/1/17 GDP Q2 4.5% 2.9 % Czech Republic 10/9/17 CPI SEP 2.5 %
Greece 9/1/17 GDP Q2 0.8 % 0.3 % 0.4 % Romania 10/10/17 GDP Q2 5.6 %
Brazil 9/1/17 GDP Q2 0.3 % -0.4 % Greece 10/10/17 CPI SEP 0.9 %
Romania 9/5/17 GDP Q2 5.7 % 5.9 % 5.6 % Romania 10/11/17 CPI SEP 1.15 %
South Africa 9/5/17 GDP Q2 1.1 % 0.8% 1.0 % France 10/12/17 CPI SEP 0.9 %
Australia 9/5/17 GDP Q2 1.8 % 1.3% 1.7 % Sweden 10/12/17 CPI SEP 2.3 %
Eurozone 9/7/17 GDP Q2 2.3 % 2.2 % 1.9 % Poland 10/12/17 CPI SEP 1.8 %
Sweden 9/13/17 GDP Q2 3.1 % 3.5 % United States 10/13/17 CPI SEP 1.9 %
Ireland 9/15/17 GDP Q2 5.8 % 5.2% China 10/15/17 CPI SEP 1.8 %
Malaysia 9/20/17 CPI AUG 3.7 % 3 % 3.2 % New Zealand 10/16/17 CPI Q3 1.7 %
Canada 9/22/17 CPI AUG 1.4 % 1.5 % 1.2 % United Kingdom 10/17/17 CPI AUG 2.9 %
9
September 2017
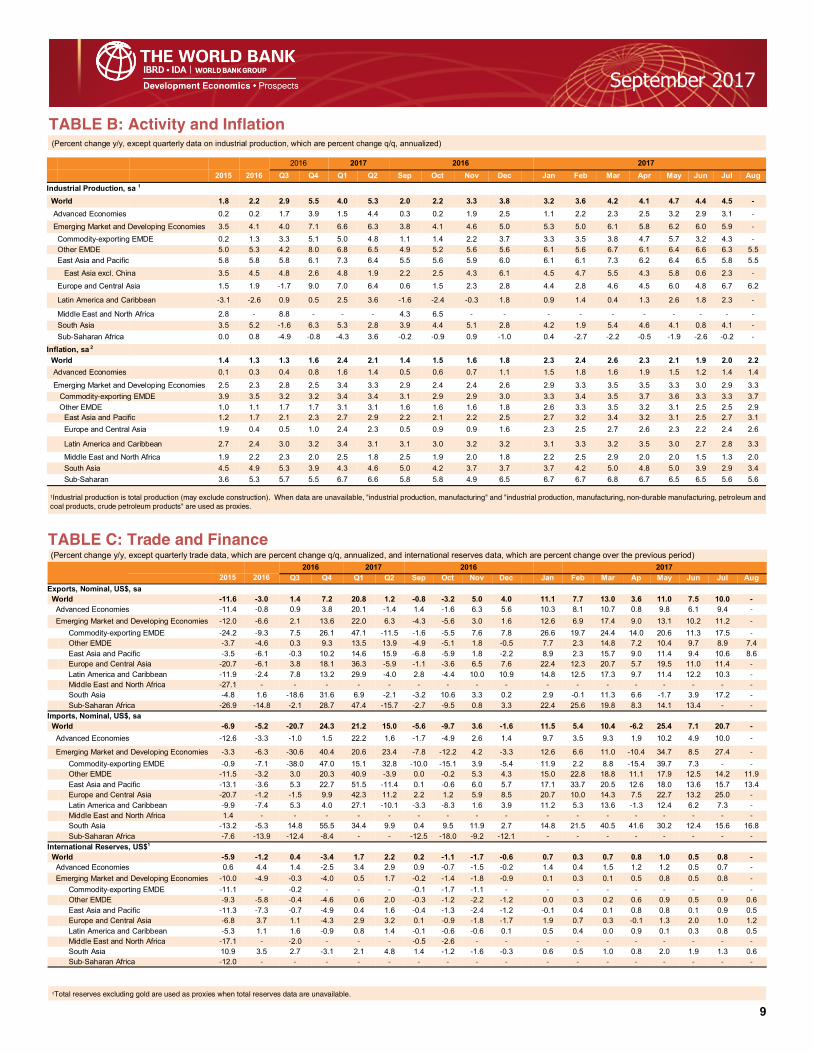
TABLE B: Activity and Inflation (Percent change y/y, except quarterly data on industrial production, which are percent change q/q, annualized)
1Industrial production is total production (may exclude construction). When data are unavailable, "industrial production, manufacturing" and "industrial production, manufacturing, non-durable manufacturing, petroleum and
coal products, crude petroleum products" are used as proxies.
TABLE C: Trade and Finance (Percent change y/y, except quarterly trade data, which are percent change q/q, annualized, and international reserves data, which are percent change over the previous period)
1Total reserves excluding gold are used as proxies when total reserves data are unavailable.
2016 2017 2016 2017
2015 2016 Q3 Q4 Q1 Q2 Sep Oct Nov Dec Jan Feb Mar Apr May Jun Jul Aug
Industrial Production, sa 1
World 1.8 2.2 2.9 5.5 4.0 5.3 2.0 2.2 3.3 3.8 3.2 3.6 4.2 4.1 4.7 4.4 4.5 -
Advanced Economies 0.2 0.2 1.7 3.9 1.5 4.4 0.3 0.2 1.9 2.5 1.1 2.2 2.3 2.5 3.2 2.9 3.1 -
Emerging Market and Developing Economies 3.5 4.1 4.0 7.1 6.6 6.3 3.8 4.1 4.6 5.0 5.3 5.0 6.1 5.8 6.2 6.0 5.9 -
Commodity-exporting EMDE 0.2 1.3 3.3 5.1 5.0 4.8 1.1 1.4 2.2 3.7 3.3 3.5 3.8 4.7 5.7 3.2 4.3 -
Other EMDE 5.0 5.3 4.2 8.0 6.8 6.5 4.9 5.2 5.6 5.6 6.1 5.6 6.7 6.1 6.4 6.6 6.3 5.5
East Asia and Pacific 5.8 5.8 5.8 6.1 7.3 6.4 5.5 5.6 5.9 6.0 6.1 6.1 7.3 6.2 6.4 6.5 5.8 5.5
East Asia excl. China 3.5 4.5 4.8 2.6 4.8 1.9 2.2 2.5 4.3 6.1 4.5 4.7 5.5 4.3 5.8 0.6 2.3 -
Europe and Central Asia 1.5 1.9 -1.7 9.0 7.0 6.4 0.6 1.5 2.3 2.8 4.4 2.8 4.6 4.5 6.0 4.8 6.7 6.2
Latin America and Caribbean -3.1 -2.6 0.9 0.5 2.5 3.6 -1.6 -2.4 -0.3 1.8 0.9 1.4 0.4 1.3 2.6 1.8 2.3 -
Middle East and North Africa 2.8 - 8.8 - - - 4.3 6.5 - - - - - - - - - -
South Asia 3.5 5.2 -1.6 6.3 5.3 2.8 3.9 4.4 5.1 2.8 4.2 1.9 5.4 4.6 4.1 0.8 4.1 -
Sub-Saharan Africa 0.0 0.8 -4.9 -0.8 -4.3 3.6 -0.2 -0.9 0.9 -1.0 0.4 -2.7 -2.2 -0.5 -1.9 -2.6 -0.2 -
Inflation, sa 2
World 1.4 1.3 1.3 1.6 2.4 2.1 1.4 1.5 1.6 1.8 2.3 2.4 2.6 2.3 2.1 1.9 2.0 2.2
Advanced Economies 0.1 0.3 0.4 0.8 1.6 1.4 0.5 0.6 0.7 1.1 1.5 1.8 1.6 1.9 1.5 1.2 1.4 1.4
Emerging Market and Developing Economies 2.5 2.3 2.8 2.5 3.4 3.3 2.9 2.4 2.4 2.6 2.9 3.3 3.5 3.5 3.3 3.0 2.9 3.3
Commodity-exporting EMDE 3.9 3.5 3.2 3.2 3.4 3.4 3.1 2.9 2.9 3.0 3.3 3.4 3.5 3.7 3.6 3.3 3.3 3.7
Other EMDE 1.0 1.1 1.7 1.7 3.1 3.1 1.6 1.6 1.6 1.8 2.6 3.3 3.5 3.2 3.1 2.5 2.5 2.9
East Asia and Pacific 1.2 1.7 2.1 2.3 2.7 2.9 2.2 2.1 2.2 2.5 2.7 3.2 3.4 3.2 3.1 2.5 2.7 3.1
Europe and Central Asia 1.9 0.4 0.5 1.0 2.4 2.3 0.5 0.9 0.9 1.6 2.3 2.5 2.7 2.6 2.3 2.2 2.4 2.6
Latin America and Caribbean 2.7 2.4 3.0 3.2 3.4 3.1 3.1 3.0 3.2 3.2 3.1 3.3 3.2 3.5 3.0 2.7 2.8 3.3
Middle East and North Africa 1.9 2.2 2.3 2.0 2.5 1.8 2.5 1.9 2.0 1.8 2.2 2.5 2.9 2.0 2.0 1.5 1.3 2.0
South Asia 4.5 4.9 5.3 3.9 4.3 4.6 5.0 4.2 3.7 3.7 3.7 4.2 5.0 4.8 5.0 3.9 2.9 3.4
Sub-Saharan 3.6 5.3 5.7 5.5 6.7 6.6 5.8 5.8 4.9 6.5 6.7 6.7 6.8 6.7 6.5 6.5 5.6 5.6
2016 2017
2017
2015 2016 Q3 Q4 Q1 Q2 Sep Oct Nov Dec Jan Feb Mar Ap May Jun Jul Aug
Exports, Nominal, US$, sa
World -11.6 -3.0 1.4 7.2 20.8 1.2 -0.8 -3.2 5.0 4.0 11.1 7.7 13.0 3.6 11.0 7.5 10.0 -
Advanced Economies -11.4 -0.8 0.9 3.8 20.1 -1.4 1.4 -1.6 6.3 5.6 10.3 8.1 10.7 0.8 9.8 6.1 9.4 -
Emerging Market and Developing Economies -12.0 -6.6 2.1 13.6 22.0 6.3 -4.3 -5.6 3.0 1.6 12.6 6.9 17.4 9.0 13.1 10.2 11.2 -
Commodity-exporting EMDE -24.2 -9.3 7.5 26.1 47.1 -11.5 -1.6 -5.5 7.6 7.8 26.6 19.7 24.4 14.0 20.6 11.3 17.5 -
Other EMDE -3.7 -4.6 0.3 9.3 13.5 13.9 -4.9 -5.1 1.8 -0.5 7.7 2.3 14.8 7.2 10.4 9.7 8.9 7.4
East Asia and Pacific -3.5 -6.1 -0.3 10.2 14.6 15.9 -6.8 -5.9 1.8 -2.2 8.9 2.3 15.7 9.0 11.4 9.4 10.6 8.6
Europe and Central Asia -20.7 -6.1 3.8 18.1 36.3 -5.9 -1.1 -3.6 6.5 7.6 22.4 12.3 20.7 5.7 19.5 11.0 11.4 -
Latin America and Caribbean -11.9 -2.4 7.8 13.2 29.9 -4.0 2.8 -4.4 10.0 10.9 14.8 12.5 17.3 9.7 11.4 12.2 10.3 -
Middle East and North Africa -27.1 - - - - - - - - - - - - - - - - -
South Asia -4.8 1.6 -18.6 31.6 6.9 -2.1 -3.2 10.6 3.3 0.2 2.9 -0.1 11.3 6.6 -1.7 3.9 17.2 -
Sub-Saharan Africa -26.9 -14.8 -2.1 28.7 47.4 -15.7 -2.7 -9.5 0.8 3.3 22.4 25.6 19.8 8.3 14.1 13.4 - -
Imports, Nominal, US$, sa
World -6.9 -5.2 -20.7 24.3 21.2 15.0 -5.6 -9.7 3.6 -1.6 11.5 5.4 10.4 -6.2 25.4 7.1 20.7 -
Advanced Economies -12.6 -3.3 -1.0 1.5 22.2 1.6 -1.7 -4.9 2.6 1.4 9.7 3.5 9.3 1.9 10.2 4.9 10.0 -
Emerging Market and Developing Economies -3.3 -6.3 -30.6 40.4 20.6 23.4 -7.8 -12.2 4.2 -3.3 12.6 6.6 11.0 -10.4 34.7 8.5 27.4 -
Commodity-exporting EMDE -0.9 -7.1 -38.0 47.0 15.1 32.8 -10.0 -15.1 3.9 -5.4 11.9 2.2 8.8 -15.4 39.7 7.3 - -
Other EMDE -11.5 -3.2 3.0 20.3 40.9 -3.9 0.0 -0.2 5.3 4.3 15.0 22.8 18.8 11.1 17.9 12.5 14.2 11.9
East Asia and Pacific -13.1 -3.6 5.3 22.7 51.5 -11.4 0.1 -0.6 6.0 5.7 17.1 33.7 20.5 12.6 18.0 13.6 15.7 13.4
Europe and Central Asia -20.7 -1.2 -1.5 9.9 42.3 11.2 2.2 1.2 5.9 8.5 20.7 10.0 14.3 7.5 22.7 13.2 25.0 -
Latin America and Caribbean -9.9 -7.4 5.3 4.0 27.1 -10.1 -3.3 -8.3 1.6 3.9 11.2 5.3 13.6 -1.3 12.4 6.2 7.3 -
Middle East and North Africa 1.4 - - - - - - - - - - - - - - - - -
South Asia -13.2 -5.3 14.8 55.5 34.4 9.9 0.4 9.5 11.9 2.7 14.8 21.5 40.5 41.6 30.2 12.4 15.6 16.8
Sub-Saharan Africa -7.6 -13.9 -12.4 -8.4 - - -12.5 -18.0 -9.2 -12.1 - - - - - - - -
International Reserves, US$1
World -5.9 -1.2 0.4 -3.4 1.7 2.2 0.2 -1.1 -1.7 -0.6 0.7 0.3 0.7 0.8 1.0 0.5 0.8 -
Advanced Economies 0.6 4.4 1.4 -2.5 3.4 2.9 0.9 -0.7 -1.5 -0.2 1.4 0.4 1.5 1.2 1.2 0.5 0.7 -
Emerging Market and Developing Economies -10.0 -4.9 -0.3 -4.0 0.5 1.7 -0.2 -1.4 -1.8 -0.9 0.1 0.3 0.1 0.5 0.8 0.5 0.8 -
Commodity-exporting EMDE -11.1 - -0.2 - - - -0.1 -1.7 -1.1 - - - - - - - - -
Other EMDE -9.3 -5.8 -0.4 -4.6 0.6 2.0 -0.3 -1.2 -2.2 -1.2 0.0 0.3 0.2 0.6 0.9 0.5 0.9 0.6
East Asia and Pacific -11.3 -7.3 -0.7 -4.9 0.4 1.6 -0.4 -1.3 -2.4 -1.2 -0.1 0.4 0.1 0.8 0.8 0.1 0.9 0.5
Europe and Central Asia -6.8 3.7 1.1 -4.3 2.9 3.2 0.1 -0.9 -1.8 -1.7 1.9 0.7 0.3 -0.1 1.3 2.0 1.0 1.2
Latin America and Caribbean -5.3 1.1 1.6 -0.9 0.8 1.4 -0.1 -0.6 -0.6 0.1 0.5 0.4 0.0 0.9 0.1 0.3 0.8 0.5
Middle East and North Africa -17.1 - -2.0 - - - -0.5 -2.6 - - - - - - - - - -
South Asia 10.9 3.5 2.7 -3.1 2.1 4.8 1.4 -1.2 -1.6 -0.3 0.6 0.5 1.0 0.8 2.0 1.9 1.3 0.6
Sub-Saharan Africa -12.0 - - - - - - - - - - - - - - - - -
2016
10
September 2017
© 2017 International Bank for Reconstruction and Development / :e World Bank
1818 H Street NW, Washington, DC 20433
Telephone: 202-473-1000; Internet: www.worldbank.org
Some rights reserved
:is work is a product of the sta= of :e World Bank with external contributions. :e Gndings, interpretations, and conclusions expressed in this work do not necessarily reBect the views of :e World Bank, its
Board of Executive Directors, or the governments they represent. :e maps were produced by the Map Design Unit of :e World Bank. :e World Bank does not guarantee the accuracy of the data included in this
work. :e boundaries, colors, denominations, and other information shown on these maps do not imply, on the part of :e World Bank Group, any judgment on the legal status of any territory, or any endorse-
ment or acceptance of such boundaries. Nothing herein shall constitute or be considered to be a limitation upon or waiver of the privileges and immunities of :e World Bank, all of which are speciGcally reserved.
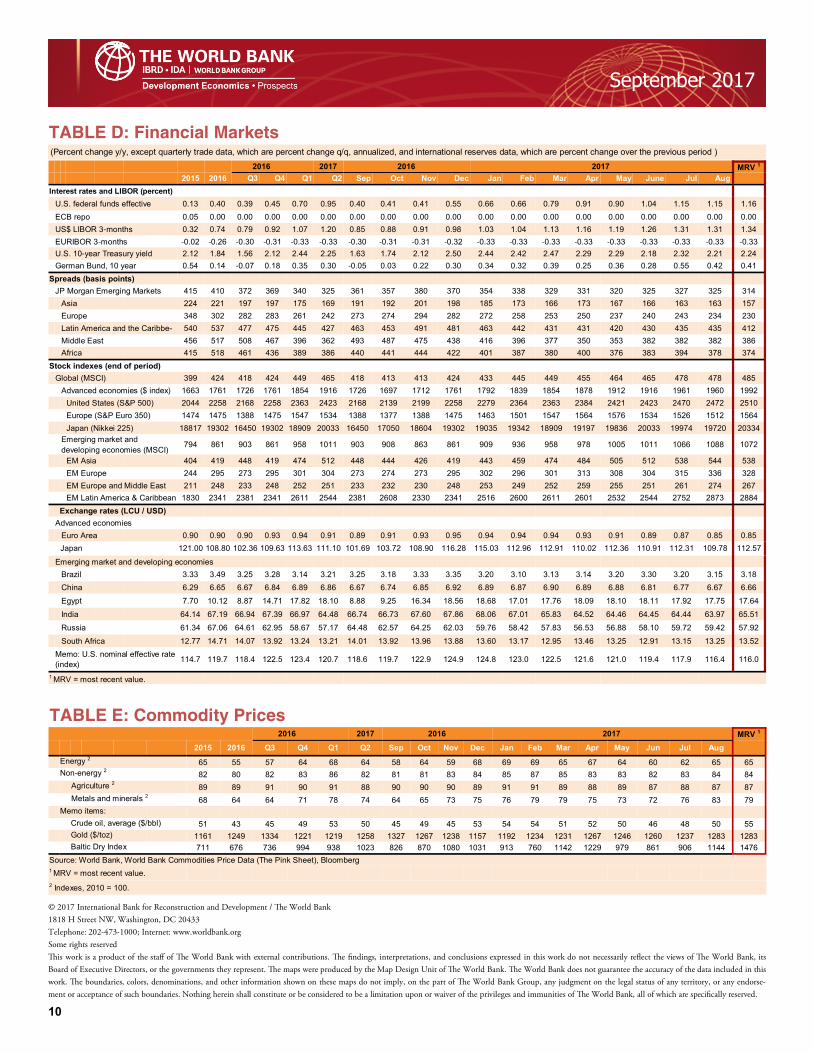
TABLE D: Financial Markets (Percent change y/y, except quarterly trade data, which are percent change q/q, annualized, and international reserves data, which are percent change over the previous period )
TABLE E: Commodity Prices
2016 2017 2016 MRV 1
2015 2016 Q3 Q4 Q1 Q2 Sep Oct Nov Dec Jan Feb Mar Apr May June Jul Aug
Interest rates and LIBOR (percent)
U.S. federal funds effective 0.13 0.40 0.39 0.45 0.70 0.95 0.40 0.41 0.41 0.55 0.66 0.66 0.79 0.91 0.90 1.04 1.15 1.15 1.16
ECB repo 0.05 0.00 0.00 0.00 0.00 0.00 0.00 0.00 0.00 0.00 0.00 0.00 0.00 0.00 0.00 0.00 0.00 0.00 0.00
US$ LIBOR 3-months 0.32 0.74 0.79 0.92 1.07 1.20 0.85 0.88 0.91 0.98 1.03 1.04 1.13 1.16 1.19 1.26 1.31 1.31 1.34
EURIBOR 3-months -0.02 -0.26 -0.30 -0.31 -0.33 -0.33 -0.30 -0.31 -0.31 -0.32 -0.33 -0.33 -0.33 -0.33 -0.33 -0.33 -0.33 -0.33 -0.33
U.S. 10-year Treasury yield 2.12 1.84 1.56 2.12 2.44 2.25 1.63 1.74 2.12 2.50 2.44 2.42 2.47 2.29 2.29 2.18 2.32 2.21 2.24
German Bund, 10 year 0.54 0.14 -0.07 0.18 0.35 0.30 -0.05 0.03 0.22 0.30 0.34 0.32 0.39 0.25 0.36 0.28 0.55 0.42 0.41
Spreads (basis points)
JP Morgan Emerging Markets 415 410 372 369 340 325 361 357 380 370 354 338 329 331 320 325 327 325 314
Asia 224 221 197 197 175 169 191 192 201 198 185 173 166 173 167 166 163 163 157
Europe 348 302 282 283 261 242 273 274 294 282 272 258 253 250 237 240 243 234 230
Latin America and the Caribbe- 540 537 477 475 445 427 463 453 491 481 463 442 431 431 420 430 435 435 412
Middle East 456 517 508 467 396 362 493 487 475 438 416 396 377 350 353 382 382 382 386
Africa 415 518 461 436 389 386 440 441 444 422 401 387 380 400 376 383 394 378 374
Stock indexes (end of period)
Global (MSCI) 399 424 418 424 449 465 418 413 413 424 433 445 449 455 464 465 478 478 485
Advanced economies ($ index) 1663 1761 1726 1761 1854 1916 1726 1697 1712 1761 1792 1839 1854 1878 1912 1916 1961 1960 1992
United States (S&P 500) 2044 2258 2168 2258 2363 2423 2168 2139 2199 2258 2279 2364 2363 2384 2421 2423 2470 2472 2510
Europe (S&P Euro 350) 1474 1475 1388 1475 1547 1534 1388 1377 1388 1475 1463 1501 1547 1564 1576 1534 1526 1512 1564
Japan (Nikkei 225) 18817 19302 16450 19302 18909 20033 16450 17050 18604 19302 19035 19342 18909 19197 19836 20033 19974 19720 20334
Emerging market and
developing economies (MSCI) 794 861 903 861 958 1011 903 908 863 861 909 936 958 978 1005 1011 1066 1088 1072
EM Asia 404 419 448 419 474 512 448 444 426 419 443 459 474 484 505 512 538 544 538
EM Europe 244 295 273 295 301 304 273 274 273 295 302 296 301 313 308 304 315 336 328
EM Europe and Middle East 211 248 233 248 252 251 233 232 230 248 253 249 252 259 255 251 261 274 267
EM Latin America & Caribbean 1830 2341 2381 2341 2611 2544 2381 2608 2330 2341 2516 2600 2611 2601 2532 2544 2752 2873 2884
Exchange rates (LCU / USD)
Advanced economies
Euro Area 0.90 0.90 0.90 0.93 0.94 0.91 0.89 0.91 0.93 0.95 0.94 0.94 0.94 0.93 0.91 0.89 0.87 0.85 0.85
Japan 121.00 108.80 102.36 109.63 113.63 111.10 101.69 103.72 108.90 116.28 115.03 112.96 112.91 110.02 112.36 110.91 112.31 109.78 112.57
Emerging market and developing economies
Brazil 3.33 3.49 3.25 3.28 3.14 3.21 3.25 3.18 3.33 3.35 3.20 3.10 3.13 3.14 3.20 3.30 3.20 3.15 3.18
China 6.29 6.65 6.67 6.84 6.89 6.86 6.67 6.74 6.85 6.92 6.89 6.87 6.90 6.89 6.88 6.81 6.77 6.67 6.66
Egypt 7.70 10.12 8.87 14.71 17.82 18.10 8.88 9.25 16.34 18.56 18.68 17.01 17.76 18.09 18.10 18.11 17.92 17.75 17.64
India 64.14 67.19 66.94 67.39 66.97 64.48 66.74 66.73 67.60 67.86 68.06 67.01 65.83 64.52 64.46 64.45 64.44 63.97 65.51
Russia 61.34 67.06 64.61 62.95 58.67 57.17 64.48 62.57 64.25 62.03 59.76 58.42 57.83 56.53 56.88 58.10 59.72 59.42 57.92
South Africa 12.77 14.71 14.07 13.92 13.24 13.21 14.01 13.92 13.96 13.88 13.60 13.17 12.95 13.46 13.25 12.91 13.15 13.25 13.52
Memo: U.S. nominal effective rate
(index) 114.7 119.7 118.4 122.5 123.4 120.7 118.6 119.7 122.9 124.9 124.8 123.0 122.5 121.6 121.0 119.4 117.9 116.4 116.0
1 MRV = most recent value.
2017
2016 2017 2016 MRV 1
2015 2016 Q3 Q4 Q1 Q2 Sep Oct Nov Dec Jan Feb Mar Apr May Jun Jul Aug
Energy 2
65 55 57 64 68 64 58 64 59 68 69 69 65 67 64 60 62 65 65
Non-energy 2
82 80 82 83 86 82 81 81 83 84 85 87 85 83 83 82 83 84 84
Agriculture 2
89 89 91 90 91 88 90 90 90 89 91 91 89 88 89 87 88 87 87
Metals and minerals 2
68 64 64 71 78 74 64 65 73 75 76 79 79 75 73 72 76 83 79
Memo items:
Crude oil, average ($/bbl) 51 43 45 49 53 50 45 49 45 53 54 54 51 52 50 46 48 50 55
Gold ($/toz) 1161 1249 1334 1221 1219 1258 1327 1267 1238 1157 1192 1234 1231 1267 1246 1260 1237 1283 1283
Baltic Dry Index 711 676 736 994 938 1023 826 870 1080 1031 913 760 1142 1229 979 861 906 1144 1476
Source: World Bank, World Bank Commodities Price Data (The Pink Sheet), Bloomberg
1 MRV = most recent value.
2 Indexes, 2010 = 100.
2017