global natural resources conference
TRANSCRIPT

Global Natural Resources Conference
November 10, 2021

Caution Regarding Forward-Looking Statements
2
Both these slides and the accompanying oral presentations contain certain forward-looking statements within the meaning of the United States Private Securities Litigation Reform Act of 1995 and forward-looking information within the meaning of theSecurities Act (Ontario) and comparable legislation in other provinces (collectively referred to herein as forward-looking statements). Forward-looking statements can be identified by the use of words such as “plans”, “expects” or “does not expect”, “isexpected”, “budget”, “scheduled”, “estimates”, “forecasts”, “intends”, “anticipates” or “does not anticipate”, or “believes”, or variation of such words and phrases or state that certain actions, events or results “may”, “could”, “should”, “would”, “might” or“will” be taken, occur or be achieved. Forward-looking statements involve known and unknown risks, uncertainties and other factors which may cause the actual results, performance or achievements of Teck to be materially different from any futureresults, performance or achievements expressed or implied by the forward-looking statements. These statements speak only as of the original date of this presentation.These forward-looking statements include, but are not limited to, statements concerning: the potential impact of the COVID-19 on our business and operations, including our ability to continue operations at our sites; our ability to manage challengespresented by COVID-19; our long-term strategy, including but not limited to copper growth strategy; the statement Teck is poised for growth; doubling of copper production by 2023 through QB2; expectations regarding future seaborne steelmakingcoals supply and demand and supply gap; our copper growth strategy and the components of that strategy, including but not limited to accelerating growth in copper, and maximizing cash flow from operations to fund copper growth; our climateaction strategy and goals; Teck’s strategy ensuring we are well-positioned for changes in demand for commodities; expectation that Teck is well positioned for the low-carbon economy; projected copper production growth and projected consolidatedcopper equivalent production; timing of first production from QB2; reserves and resources; Teck’s illustrative cash flows; liquidity and availability of borrowings under our credit facilities and the QB2 project finance facility; objectives and componentsof Teck's capital allocation framework, including a base dividend and potential supplemental shareholder distribution and maintenance of solid investment grade metrics; all guidance appearing in this document including but not limited to theproduction, sales, cost, unit cost, capital expenditure, water treatment, cost reduction and other guidance; our climate action strategy and goals; all projections and forecasts about QB2 and QB3 or based on QB2 or QB3, including but not limited tolife of the deposit, copper growth, C1 cash costs and AISC costs, strip ratio, throughput rate and potential to become a top five global copper producer, reserve and resource estimates, first production expectation, and all other projections included inthe “Near-Term Copper Growth – QB2 Project” Appendix; all economic and other projections for our copper growth projects, including but not limited to IRR, payback period, construction period, capex and mine life; impact of commodity price changeon annualized EBITDA and annualized profit; the statement that Teck is positioned to realize value from copper projects; the statement that Teck seeks to maximize shareholder returns and maintain a strong balance sheet, and maintain investmentgrade metrics to support strong liquidity; expected benefits and impact of our RACE21TM program; illustrative EBITDA from base metals with QB2; illustrative QB2 EBITDA, expectations for Red Dog mine life extension; the statement that Teck hasseveral of the top next generation zinc assets; long-term sustaining capex projections for our commodities and business units; Red Dog extension project potential; expectations and forecasts for our products, business units and individual operationsand projects; and forecasts for supply and demand for copper, zinc, steelmaking coal and oil; climate action goals and the expectation that we will achieve these goals; water management and treatment goals and expectation that we will achievethose goals; long term annual steelmaking coal production of 26 to 27 million tonnes, and expectations of stable long term strip ratio; the statement that steelmaking coal production is focused to capture high margins and maximize free cash flow; thestatement that our steelmaking coal business unit has strong EBITDA and EBITDA margin generation potential through all cycles; the statement that steelmaking coal is competitively positioned to continue to deliver strong returns; the statement thatsteelmaking coal has strong margins in any market with exceptional cash generating potential; anticipated sustaining capital and average spend in steelmaking coal, and the projected long term run rate for sustaining capital in coal of $11-13 pertonne; expected benefits of the haul truck rebuild strategy, including but not limited to the anticipated capex reduction, NPV and payback period; Neptune expected run rate and timing; anticipated benefits of the Neptune facility upgrade; expectationthat Teck’s coal is optimally positioned for a decarbonizing future; Fort Hills resource estimates; expectation that operational problems are being addressed and will be resolved; expectation that Fort Hills can be a Best-in-class mineable oil sandsasset; expectations and projections regarding Fort Hills financial outlook and EBITDA potential; the statement regarding Fort Hills significant EBITDA upside potential, and strong and steady cash flow for decades; Fort Hills debottlenecking andregional synergies potential and associated benefits; and all other estimates and projections associated with our business and operations.The forward-looking statements are based on and involve numerous assumptions, risks and uncertainties and actual results may vary materially. These statements are based on assumptions, including, but not limited to, general business andeconomic conditions, interest rates, the supply and demand for, deliveries of, and the level and volatility of prices of, zinc, copper, coal, blended bitumen, and other primary metals, minerals and products as well as steel, oil, natural gas, petroleum,and related products, the timing of the receipt of regulatory and governmental approvals for our development projects and other operations and new technologies, our costs of production and production and productivity levels, as well as those of ourcompetitors, power prices, continuing availability of water and power resources for our operations, market competition, the accuracy of our reserve estimates (including with respect to size, grade and recoverability) and the geological, operationaland price assumptions on which these are based, conditions in financial markets, the future financial performance of the company, our ability to successfully implement our technology and innovation strategy, the performance of new technologies inaccordance with our expectations, our ability to attract and retain skilled staff, our ability to procure equipment and operating supplies, positive results from the studies on our expansion projects, our coal and other product inventories, our ability tosecure adequate transportation for our products, our ability to obtain permits for our operations and expansions, our ongoing relations with our employees and business partners and joint venturers, our expectations with respect to the carbonintensity of our operations, assumptions regarding returns of cash to shareholders include assumptions regarding our future business and prospects, other uses for cash or retaining cash. Our sustainability goals are based on a number of additionalassumptions, including regarding the availability and effectiveness of technologies needed to achieve our sustainability goals and priorities; the availability of clean energy sources and zero-emissions alternatives for transportation on reasonableterms; our ability to implement new source control or mine design strategies and transition to seawater or low-quality water on commercially reasonable terms without impacting production objectives; our ability to successfully implement ourtechnology and innovation strategy; and the performance of new technologies in accordance with our expectations. In addition, assumptions regarding the Elk Valley Water Quality Plan include assumptions that additional treatment will be effective atscale, and that the technology and facilities operate as expected. Reserve and resource life estimates assume the mine life of longest lived resource in the relevant commodity is achieved, assumes production at planned rates and in some casesdevelopment of as yet undeveloped projects. Capital allocation decisions, and decisions regarding the payment of dividends and return of capital to shareholders, are in the discretion of the board of directors. Assumptions regarding QB2 includeassumption of completion based on current project assumptions and assumptions regarding the final feasibility study; assumptions regarding QB3 include assumptions regarding the receipt of permits. Assumptions regarding QB2 include currentproject assumptions and assumptions regarding the final feasibility study, as well as there being no unexpected material and negative impact to the various contractors, suppliers and subcontractors for the QB2 project relating to COVID-19 or

Caution Regarding Forward-Looking Statements
3
otherwise that would impair their ability to provide goods and services as anticipated during the suspension period or ramp-up of construction activities. Assumptions regarding the benefits of the Neptune Bulk Terminals expansion includeassumptions that the project is operated in accordance with current expectations, and upstream infrastructure is in place to support the additional capacity. Statements regarding the availability of our credit facilities and project financing facility arebased on assumptions that we will be able to satisfy the conditions for borrowing at the time of a borrowing request and that the facilities are not otherwise terminated or accelerated due to an event of default. Statements concerning future productioncosts or volumes are based on numerous assumptions of management regarding operating matters and on assumptions that demand for products develops as anticipated, that customers and other counterparties perform their contractualobligations, that operating and capital plans will not be disrupted by issues such as mechanical failure, unavailability of parts and supplies, labour disturbances, interruption in transportation or utilities, adverse weather conditions, and that there areno material unanticipated variations in the cost of energy or supplies. Statements regarding anticipated steelmaking coal sales volumes and average steelmaking coal prices depend on, among other things, timely arrival of vessels and performanceof our steelmaking coal-loading facilities, as well as the level of spot pricing sales. The foregoing list of assumptions is not exhaustive. Events or circumstances could cause actual results to vary materially. Assumptions are also included in thefootnotes to the slides.Factors that may cause actual results to vary materially include, but are not limited to: extended COVID-19 related suspension of activities and negative impacts on our suppliers, contractors, employees and customers; extended delays in return tonormal operations due to COVID-19 related challenges; changes in commodity and power prices, changes in market demand for our products; changes in interest and currency exchange rates; acts of governments and the outcome of legalproceedings; inaccurate geological and metallurgical assumptions (including with respect to the size, grade and recoverability of mineral reserves and resources); unanticipated operational difficulties (including failure of plant, equipment orprocesses to operate in accordance with specifications or expectations, cost escalation, unavailability of materials and equipment, government action or delays in the receipt of government approvals, industrial disturbances or other job action,adverse weather conditions and unanticipated events related to health, safety and environmental matters); union labour disputes; political risk; social unrest; failure of customers or counterparties (including logistics suppliers) to perform theircontractual obligations; changes in our credit ratings; unanticipated increases in costs to construct our development projects, difficulty in obtaining or retaining permits; inability to address concerns regarding permits or environmental impactassessments; current and new technologies relating to our Elk Valley water treatment efforts and other sustainability goals and targets may not perform as anticipated or may not be available, and ongoing monitoring may reveal unexpectedenvironmental conditions requiring additional remedial measures; and changes or further deterioration in general economic conditions. Development of future reserves and resources is dependent on, among other factors, receipt of permits. Currentand new technologies relating to our Elk Valley water treatment efforts may not perform as anticipated, and ongoing monitoring may reveal unexpected environmental conditions requiring additional remedial measures. QB2 construction progressand timing of first production is dependent on, among other matters, our continued ability to successfully manage through the impacts of COVID-19. Red Dog production may also be impacted by water levels at site.The forward-looking statements in this presentation and actual results will also be impacted by the effects of COVID-19 and related matters. The overall effects of COVID-19 related matters on our business and operations and projects will depend onhow the ability of our sites to maintain normal operations, and on the duration of impacts on our suppliers, customers and markets for our products, all of which are unknown at this time. Continuing operating activities is highly dependent on theprogression of the pandemic and the success of measures taken to prevent transmission, which will influence when health and government authorities remove various restrictions on business activities.We assume no obligation to update forward-looking statements except as required under securities laws. Further information concerning risks and uncertainties associated with these forward-looking statements and our business can be found in ourAnnual Information Form for the year ended December 31, 2020, filed under our profile on SEDAR (www.sedar.com) and on EDGAR (www.sec.gov) under cover of Form 40-F, as well as subsequent filings, including but not limited to our quarterlyreports.
QB2 Project DisclosureAll economic analysis with respect to the QB2 project based on a development case which includes inferred resources within the life of mine plan, referred to as the Sanction Case, which is the case on which Teck based its development decision forthe QB2 project. Inferred resources are considered too speculative geologically to have the economic considerations applied to them that would enable them to be categorized as mineral reserves. Inferred resources are subject to greater uncertaintythan measured or indicated resources and it cannot be assumed that they will be successfully upgraded to measured and indicated through further drilling. Nonetheless, based on the nature of the mineralization, Teck has used a mine plan includinginferred resources as the development mine plan for the QB2 project.The economic analysis of the Sanction Case, which includes inferred resources, may be compared to economic analysis regarding a hypothetical mine plan which does not include the use of inferred resources as mill feed, referred to as the ReserveCase, and which is set out in Appendix slides “QB2 Project Economics Comparison” and “QB2 Reserves and Resources Comparison”.The scientific and technical information regarding the QB2 project and Teck's other material properties was prepared under the supervision of Rodrigo Marinho, P. Geo, who is an employee of Teck. Mr. Marinho is a qualified person, as defined underNational Instrument 43-101.

4
Right Opportunities• Strong demand for our metals and minerals,
led by growth and decarbonization
Right Assets • Industry leading copper growth, strengthening
existing high-quality, low carbon assets
Right Approach• Highest standards of safety, sustainability and
operational excellence in everything we do, RACE21TM
Right Team • Our people deliver the optimal mix of industry
leading technical, digital, sustainability, commercial and financial leadership
Teck is Poised for GrowthProviding essential metals and minerals for a low-carbon world
Photo: QB2 concentrator, September 2021.

WaterHealth & Safety ClimateInclusion & DiversityA core value for Teck
80% reduction in HPIF from 2016 to June 2021
38% lower HPIF YTD26% lower LTIF YTD
Rebalancing to low-carbon metals
Carbon neutral operations by 2050
33% reduction in carbon intensity by 2030
88% green power at operations today
Protecting water quality and reducing use
Tripling water treatment capacity in Elk Valley in 2021
Achieved 13% reduction in freshwater use at Chilean operations; desalinated water at QB2
Enhancing representation and diversity
28% women in senior management
One-third of all new hires are women
CommunitiesServing the needs of communities and Indigenous Peoples
72 active agreements with Indigenous Peoples
24% of procurement spend with local suppliers
5
Health & Safety and Sustainability

• Strong demand for metals and minerals driven by decarbonization, population growth and a rising middle class
• Unprecedented pandemic monetary and fiscal stimulus
• Economic recovery continues as vaccines are rolled out
• Current stockpiles of essential minerals remain at low levels
Accelerated Need for Essential Metals And Minerals for a Low-Carbon World
6
Copper Demand1 (kt)
Teck is positioned to double copper production by 20232
Generation and Grid Infrastructure
2020 2025 2030
40 170 536
30% CAGR
Grid Storage
2020 2025 2030
24 86 180
22% CAGR
Charging Infrastructure
2020 2025 2030
23 115 392
33% CAGR
Non-ICEVehicles
2020 2025 2030
304 1068 2972
26% CAGR
Total
2020 2025 2030
391 1439 4080
26% CAGR

7
• The magnitude of steelmaking coal demand will be ultimately driven by the pace of decarbonization
• Long-term demand for seaborne steelmaking coal will remain robust
• At the same time, supply growth is constrained
High-Quality Steelmaking Coal Is Required for the Low-Carbon TransitionSeaborne Steelmaking Coal Supply Changes With All Projects Through 20501 (Mt)
Without the addition of confirmed and unconfirmed greenfield and brownfield projects, there will be a significant gap to steelmaking coal demand between 2025 and 2030
2030 2040 2050
Seaborne Steelmaking Coal Supply/Demand Gap (Mt)
235 222 188
CurrentDepletions Addition2Annual demand Additions from low
likelihood projects XX Cumulative low
likelihood projects
147
216185
(Mt)Net Capacity
2030Net Capacity
2040Net Capacity
2050Gap with high likelihood projects -22 -65 -70
Gap with high and low likelihood projects -19 -37 -41
118
15(53)
157213
191
(38) 60 3 (64) 8 25

Teck and the Low-Carbon Transition
8
We believe Teck’s strategy will ensure we are well-positioned for changes in demand for mining commodities driven by the transition to a low-carbon world
• Build on our low carbon head start‒ Among the world’s lowest carbon
intensities for our copper, refined zinc and lead, and steelmaking coal production1
• Transition to renewable power = ~1 Mtpa GHG reduction‒ Sourcing 100% renewable energy
at Carmen de Andacollo from 2020‒ Sourcing >50% of operational energy
at QB2 from renewable sources• Completion of QB2, which will double our
consolidated copper production by 2023• Explore options to realize value from our
oil sands assets
• Continue to produce the high-quality steelmaking coal required for the low-carbon transition
• Reduce carbon as a proportion of our total business
• Meet our milestone goals for 2030, in support of our carbon neutrality goal:‒ Source 100% of all power needs
in Chile from renewable power ‒ Reduce the carbon intensity
of our operations by 33%‒ Shift to low-emissions mining fleets
• Work with our customers and transportation providers to reduce downstream emissions
Carbon neutrality by 2050
1TodayFocus on copper growth to transition our portfolio
210+ YearsPrudently growing our copper business as an area essential to the transition to a low-carbon world
320+ YearsLeading copper producer supplying essential metals for a low-carbon world

Prudent Copper Growth Strategy
9
Canada156 kt
Peru86 kt
Chile227 kt
Photo: QB2 concentrator, August 2021.
Accelerate capital efficient growth in copper
Maximize cash flows from operations
to fund copper growth and shareholder returns
Strengthenexisting high-quality assets through RACE21TM
Discipline in capital allocation, maximizing shareholder returns
Leadershipin sustainability
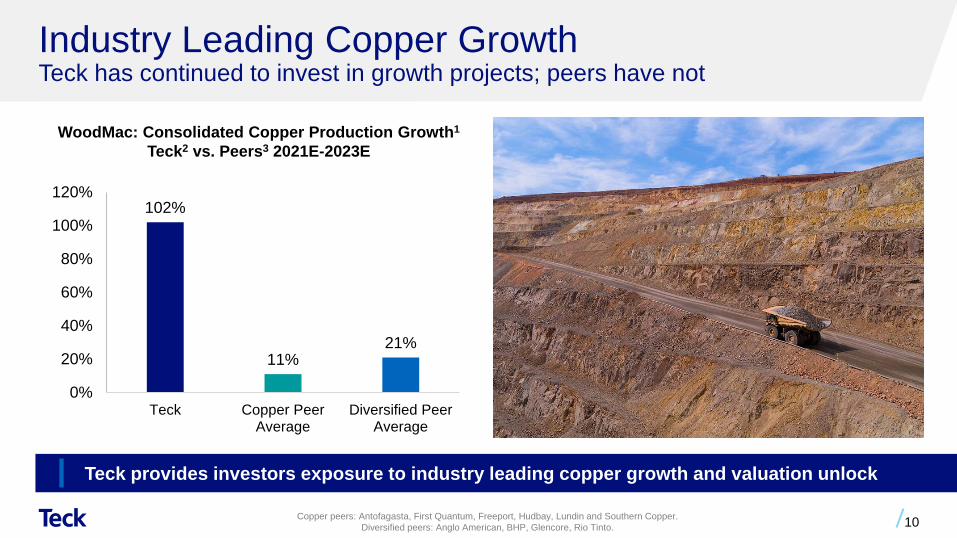
Industry Leading Copper GrowthTeck has continued to invest in growth projects; peers have not
10
WoodMac: Consolidated Copper Production Growth1
Teck2 vs. Peers3 2021E-2023E
Peru86 kt
Copper peers: Antofagasta, First Quantum, Freeport, Hudbay, Lundin and Southern Copper.Diversified peers: Anglo American, BHP, Glencore, Rio Tinto.
Teck provides investors exposure to industry leading copper growth and valuation unlock
102%
11%21%
0%
20%
40%
60%
80%
100%
120%
Teck Copper PeerAverage
Diversified PeerAverage

Portfolio of Copper Growth OptionsWell understood resource base creates multiple options
11
• High quality resources in very attractive mineral districts including Canada, the U.S., Mexico, Chile, and Peru‒ Including ~22 million ounces1 of measured
and indicated gold resources, and ~10 million ounces1 in inferred gold resources in our copper growth options1
• Prudent investment to further define path to value, e.g. conversion of resources to reserves
• Leveraging exploration, development and commercial expertise
• Sustainability and community focus
Teck’s Consolidated Copper Asset Reserves and Resources (CuEq Mt)2
7
8
16
3113
15
29
56
18
12
1848
Copper Operations QB Copper GrowthOptions
Total
Proven and Probable ReservesMeasured & Indicated ResourcesInferred Resources
1
Continued investment has resulted in a robust pipeline of copper growth options

C1 Cost2
(US$/lb Cu) $1.28 $1.16 $1.21 $1.33 $1.14 $1.14
Enterprise Value3 (C$B) $29.9 $27.3
Significant Base Metals GrowthBase Metals business growth rivals leading copper peers
12
Consolidated Copper Equivalent Production 1 (kt CuEq)
Teck AntofagastaFirst Quantum11%
62%0%
528
855 887988
832 828
Teck2020A
Teck2023E
First Quantum2020A
First Quantum2023E
Antofagasta2020A
Antofagasta2023E
Copper Zinc (CuEq) Other (CuEq) Attributable (CuEq)
Source: Production and C1 costs for 2020 are sourced from company disclosures. Production for 2023 is sourced from Wood Mackenzie asset models. C1 costs for 2023 are sourced from S&P Global Market Intelligence, Metals & Mining.

QB2 is Delivering to Key Milestones and Positioning for Start-Up
13
World class COVID-19 protocols deliver results• Surpassed 2/3 completion• Vaccinations, COVID-19 protocols and testing key enablers• Continued ramp-up of construction workforce
Focus on delivering to key milestones• Critical path through the grinding circuit remains on track• Focus on port to pond infrastructure for first water delivery• Delivering early systems for commissioning• Working creatively with Bechtel and contractors for successful
delivery
Driving value by linking people, process, and workplace design• Focus to ensure a seamless transition to operations• Operations leadership in place and ramping up workforce
Photo: QB2 truck shop – nearing completion, September 2021.
First production at QB2 continues to be expected in H2 2022

14
Illustrative QB2 EBITDA1 ScenariosAt Full Production
Teck is Nearing an Inflection PointTransitioning from cash outflows to potential for significant EBITDA1 generation
Illustrative Proforma; includes QB2 on a 100% consolidation basis; QB2 EBITDA assumes 290ktpy copper sales and US$1.28/lb C1 cash cost. For further details and various scenario assumptions, refer to the “Teck Illustrative Cash Flows - QB2 Full Production” slides in the appendix.
US$4.50/lb Copper US$4.00/lb Copper US$3.50/lb Copper
C$2.6B
(C$2.5B)
2021 QB2 Capex Guidance2
C$2.2BC$1.8B

Solid Track Record of Cash Returns to Shareholders>C$3.0 billion of dividends and C$1.7 billion of share buybacks 2011-2020
15
$0
$200
$400
$600
$800
2011 2012 2013 2014 2015 2016 2017 2018 2019 2020 2021 YTD
Total Dividend Paid Share Buybacks
1
Significant EBITDA2 generation potential from QB2 could drive incremental funds available for supplemental distributions to shareholders
Teck’s Dividends and Buybacks (C$M)

Industry leading copper growth, strengthening existing high-quality, low carbon assets
RightApproachHighest standards of sustainability in everything we do, operational excellence, RACE21TM
Our people deliver the optimal mix of industry leading technical, digital, sustainability, commercial and financial leadership
RightOpportunitiesStrong demand for our metals and minerals, led by growth and decarbonization
RightAssets
Teck is Poised for Growth
16
Providing essential metals and minerals for a low-carbon world
RightTeam

Appendix

Endnotes
Slide 6: Accelerated Need for Essential Metals and Minerals for a Low-Carbon World 1. Source: CRU Mobility and Energy Futures – Perspectives towards 2035. Approximate figures; total copper demand from CRU’s Copper Market Outlook.2. Consolidated basis.Slide 7: High-Quality Steelmaking Coal Is Required for the Low-Carbon Transition1. Source: MineSpans. All production volumes included in the forecast are based on a 93% utilization rate of capacity. Includes ramp up of current capacity and projects considered to have a high certainty or probability of completion.2. Low likelihood projects are assumed to come online based on increasing prices surpassing the incentive price required for individual projects at a return on investment of 15%.Slide 8: Teck and the Low-Carbon Transition1. Barclays Research; Teck. 2017.Slide 10: Industry Leading Copper Growth1. Source: Wood Mackenzie base case (attributable) copper production dataset. Consolidated production estimates were derived based on accounting standards for consolidation for Teck and its peers.2. Teck growth estimate uses 2020 actual production and Wood Mackenzie data for 2023.3. Copper peers: Antofagasta, First Quantum, Freeport, Hudbay, Lundin, Southern Copper. Diversified peers: Anglo American, BHP, Glencore, Rio Tinto. Peer production metrics for 2020 and 2023 are from Wood Mackenzie. Peer production
metrics for 2020 and 2023 are from Wood Mackenzie. Peer averages are the simple averages. Slide 11: Portfolio of Copper Growth Options1. Contained equivalent copper metal at 100% basis for all projects. Copper growth assets are: Zafranal, San Nicolás, NuevaUnión, Mesaba, Schaft Creek, Galore Creek. See Teck’s 2020 AIF for further information, including the grade and
quantity, regarding the gold reserves and resources for these projects and the grade of the other metals used to determine the copper equivalent.2. Contained equivalent copper metal at 100% basis for all projects. CuEq calculated with price assumptions: US$3.50/lb Cu; US$1.15/lb Zn; US$6.90/lb Ni; US$21/lb Co; US$10/lb Mo; US$1,400/oz Au; US$18/oz Ag; US$1,300/oz Pd;
US$1,200/oz Pt.Slide 12: Significant Base Metals Growth1. Production for 2020 reflects actuals sourced from company disclosures. Production for 2023 is sourced from Wood Mackenzie asset models, considering assets included in Wood Mackenzie’s base case for each company. Production is shown
on a consolidated reporting basis, except where noted as attributable for ownership. Copper equivalent production for 2020 is calculated using annual average prices of: US$2.83/lb Cu, US$1.05/lb Zn, US$0.85/lb Pb, US$8.68/lb Mo, US$US$1,779/oz Au, US$20.70/oz Ag, US$6.43/lb Ni. Copper equivalent production for 2023 is calculated using the following prices: US$3.50/lb Cu, US$1.15/lb Zn, US$0.90/lb Pb, US$10.50/lb Mo, US$1,650/oz Au, US$22.50/oz Ag, US$6.90/lb Ni.
2. 2020 C1 cash cost data is sourced from company disclosures and are for copper operations only. Expected 2023 C1 cash cost data is sourced from S&P Global Market Intelligence (formerly SNL Metals & Mining) cost curve database considering primary copper mines and total cash costs on a by-product basis for Teck and peers, and weighted on a consolidated production basis.
3. Enterprise Value, or Total Enterprise Value is as of market close on August 30, 2021 and is sourced from S&P Capital IQ.Slide 13: QB2 is Delivering to Key Milestones and Positioning for Start-Up1. On a 100% go forward basis from January 1, 2019 including escalation and excluding working capital or interest during construction using actual realized exchange rates until March 30, 2020 and assuming a CLP/USD exchange rate of 775
from April 1, 2020. Includes approximately US$400 million in contingency. 2. Based on the assumptions and impacts to construction productivity under COVID-19 protocols. Assumes a CLP/USD rate of 775 over the remainder of the project. Slide 14: Teck is Nearing an Inflection Point1. EBITDA is a non-GAAP financial measures. See “Non-GAAP Financial Measures” slides.2. Guidance for QB2 capital expenditures as at October 26, 2021.
Slide 15: Solid Track Record of Cash Returns to Shareholders1. As at September 30, 2021.2. EBITDA is a non-GAAP financial measures. See “Non-GAAP Financial Measures” slides.
18

Overview and Financial Strategy

High-quality assets in the Americas
Proven operational excellence underpinning cost competitiveness
Doubling of copper production by 2023 through QB21
Significant value potential from a portfolio of copper growth options
Recognized industry leader in ESG performance
Strong balance sheet and rigorous capital allocation framework
20
Strong safety performance with stringent COVID-19 prevention protocols in place across the business
Among the world’s lowest carbon intensity producersof copper, zinc and steelmaking coal
Experienced leadership team with proven track record of project execution and operational excellence
One of Canada’s leading mining companies, headquartered in Vancouver, British Columbia
Operations & Major Projects
Copper
Zinc
Energy
Steelmaking Coal
Operation Project
About Teck

Global Customer Base Revenue contribution from diverse markets
21
2020 Revenue by Business Unit
Copper 27%
Zinc 30%Steelmaking coal 38%
Energy 5%
2020 Gross Profit Before Depreciation and Amortization1
by Business Unit
Copper 44%
Zinc 29%Steelmaking coal 35%
Energy -8%
2020 Revenue by Geography
India 6%
China 21%
Asia (ex. China/India)
33%
North America 25%
Latin America 2%
Europe 13%

Strong Financial Position
22
Balance Sheet• Rated investment grade by all four agencies• No significant note maturities prior to 20301
Liquidity• C$5.4 billion2 of liquidity available• Converted our US$4 billion committed credit facility into a
Sustainability-Linked facility in support of Teck’s sustainability strategy goals and extended its maturity to October 2026; facility undrawn as of October 26, 2021
• Cancelled our US$1 billion credit facility maturing June 2022

23
US$4.50/lb Copper Scenario US$4.00/lb Copper Scenario US$3.50/lb Copper Scenario$5.73/share $4.93/share $4.13/share
Illustrative Cash Flows - QB2 Full ProductionScenarios indicate potential Available Cash Flow of C$4–6/share
For further details please see Teck Illustrative Cash Flows – QB2 Full Production slides in the appendix of this presentation. For this purpose, we define available cash flow as cash flow from operating activities after interest and finance charges, lease payments and distributions to non-controlling interests less: (i) sustaining capital and capitalized stripping; (ii) committed growth capital; (iii) any cash required to adjust the capital structure to maintain solid investment grade credit metrics; and (iv) our base $0.20 per share annual dividend. Proceeds from any asset sales may also be used to supplement available cash flow. Any additional cash returns will be made through share repurchases and/or supplemental dividends depending on market conditions at the relevant time.

Teck Illustrative Cash Flows - QB2 Full ProductionScenarios indicate potential Available Cash Flow of C$4–6/share
24
Illustrative Proforma; includes QB2 on a 100% consolidation basis; QB2 EBITDA assumes 290ktpy copper sales and US$1.28/lb C1 cash cost. For this purpose, we define available cash flow as cash flow from operating activities after interest and finance charges, lease payments and distributions to non-controlling interests less: (i) sustaining capital and capitalized stripping; (ii) committed growth capital; (iii) any cash required to adjust the capital structure to maintain solid investment grade credit metrics; and (iv) our base $0.20 per share annual dividend. Proceeds from any asset sales may also be used to supplement available cash flow. Any additional cash returns will be made through share repurchases and/or supplemental dividends depending on market conditions at the relevant time.
US$4.50/lb Copper C$/share9
US$4.00/lb Copper C$/share9
US$3.50/lb Copper C$/share9
Adjusted EBITDA1 $6.0 $5.6 $5.3QB2 EBITDA (100%)2 2.6 2.2 1.8 Less: cash taxes (100%)3 (1.9) (1.7) (1.5)Less: cash interest paid4 (0.4) (0.4) (0.4)Less: lease payments5 (0.1) (0.1) (0.1)Operating cash flow $6.2 $5.6 $5.0 Less: capital spending6 (1.8) (1.8) (1.8)Less: base dividends7 (0.1) (0.1) (0.1)Less: QB2 project finance repayment (100%)8 (0.4) (0.4) (0.4)Illustrative Available Cash Flow (100%) $3.9 $3.4 $2.8 Illustrative Available Cash Flow (Teck's share) 3.1 $5.73 2.6 $4.93 2.2 $4.13 30% of Teck's Available Cash Flow for supplemental distribution (0.9) (1.72) (0.8) (1.48) (0.7) (1.24)
Balance available for Teck's growth and shareholders $2.1 $4.01 $ 1.8 $3.45 $1.5 $2.89
Gross Debt/EBITDA (Teck's share; assumes June 30, 2021 reported gross debt) 0.96x 1.04x 1.13x
Illustrative Available Cash Flow (C$B)

Capital Allocation FrameworkShareholder distributions of 30-100% of Available Cash Flow1
CASH FLOW FROM OPERATIONS after interest and finance charges, lease payments and distributions to non-controlling interests
25
1. For this purpose, we define available cash flow as cash flow from operating activities after interest and finance charges, lease payments and distributions to non-controlling interests less: (i) sustaining capital and capitalized stripping; (ii) committed growth capital; (iii) any cash required to adjust the capital structure to maintain solid investment grade credit metrics; and (iv) our base $0.20 per share annual dividend. Proceeds from any asset sales may also be used to supplement available cash flow. Any additional cash returns will be made through share repurchases and/or supplemental dividends depending on market conditions at the relevant time.
GROWTHRETURNS
BASE DIVIDEND
COMMITTED GROWTH CAPITAL
CAPITAL STRUCTURE
SUSTAINING CAPITAL
(including stripping)
SUPPLEMENTAL SHAREHOLDER DISTRIBUTIONS
Plus at Least 30%Available Cash Flow1
Solid track record of cash returns to shareholders

Disciplined Approach to M&A
26
CdA Gold Stream1, $206M Project Corridor
/Nueva Union, $0
Antamina Silver Stream2
$795M
Osisko Royalty
Package, $28M
Sandstorm Royalty
Package3
$32M
HVC Minority, ($33M)
Teena Minority4, ($11M)
AQM Copper, ($25M)
Wintering Hills, $59M
San Nic Minority5, ($65M)
IMSA’s stake in QB, ($208M)
Waneta Dam, $1,200M6
QB2 Divestment (30%)7
$1,072M
($500)
$0
$500
$1,000
$1,500
July
10
Aug
27
Oct
7
Oct
25
Jan
19
July
5
Oct
18
Nov
21
Jan
26
Oct
18
Apr 4
Jul 2
6
Mar
29
2015 2016 2017 2018 2019
Total net proceeds of C$3.1B:• Balance sheet strengthened by divestment of non-core assets at high EBITDA8 multiples• Modest ‘prudent housekeeping’ acquisitions to consolidate control of attractive copper
and zinc development assets
Recent Transaction History
Net
Pro
ceed
s (C
ost)
(C$M
)

Production Guidance
27
Units in 000’s tonnes (excluding steelmaking coal, molybdenum, and bitumen)
2020 2021 Guidance1 3-Year Guidance1
(2022-2024) Copper2,3,4
Highland Valley 119.3 128-133 135-165Antamina 85.6 91-95 90Carmen de Andecollo 57.4 46-51 50-60 Quebrada Blanca6 13.4 10-11 -Total copper 275.7 275-290 275-315
Zinc2,3,5
Red Dog 490.7 510-530 510-550Antamina 96.3 95-100 80-100Total zinc 587.0 605-630 590-650
Refined zincTrail 305.1 285-290 305-315
Steelmaking coal (Mt) 21.1 25.0-26.0 26.0-27.0Bitumen3 (Mbbl)
Fort Hills 8.4 6.6-8.1 14Lead2
Red Dog 97.5 90-100 80-90Molybdenum2,3 (Mlbs)
Highland Valley 3.8 1.2-1.8 3.0-4.5Antamina 1.5 1.0-1.4 2.0-3.0Total molybdenum 5.1 2.2-3.2 5.0-7.5

Sales and Unit Cost Guidance
28
Unit Costs 2020 2021 Guidance1
Copper3
Total cash unit costs7 (US$/lb) $1.57 $1.65-1.75Net cash unit costs4,7 (US$/lb) $1.28 $1.30-1.40
Zinc5
Total cash unit costs7 (US$/lb) $0.53 $0.54-0.59Net cash unit costs4,7 (US$/lb) $0.36 $0.35-0.40
Steelmaking coal6Adjusted site cash cost of sales7 $64 $59-64Transportation costs $41 $39-42Inventory write-down $3 -Unit costs7 (C$/tonne) $108 $98-108
BitumenAdjusted operating costs7 (C$/barrel) C$31.96 C$40-44
Sales Q3 2021 Q4 2021 Guidance1
Zinc2
Red Dog (kt) 162 140-155Steelmaking coal (Mt) 5.9 6.4-6.8

Water Treatment Guidance
There is no change to our 2021 guidance on water-related spending. We expect capital spending of approximately $255 million in 2021 on water treatment (AWTFsand SRFs) and water management (source control, calcite management and tributary management). By the end of 2021, we expect to increase total treatmentcapacity to more than 50 million litres per day. From 2022 to 2024, capital investment in water management and water treatment is expected to be approximately $400to $500 million. The investment in water treatment will further increase treatment capacity to 90 million litres per day.
In addition to the capital set out above and as previously announced, the aggregate cost of the incremental measures required under the October 2020 Directionissued by Environment and Climate Change Canada (the Direction) is preliminarily estimated at $350 to $400 million between 2021 and 2030.
Operating costs associated with water treatment were approximately $0.75 per tonne in 2020 and, as previously disclosed, are projected to increase gradually overthe long term to approximately $3 per tonne as additional water treatment becomes operational. Long-term capital costs for construction of additional treatmentfacilities are expected to average approximately $2 per tonne annually.
Final costs of implementing the Plan and the Direction for managing water quality will depend in part on the technologies applied, on regulatory developments and onthe results of ongoing environmental monitoring and modelling. The timing of expenditures will depend on resolution of technical issues, permitting timelines and otherfactors. Certain cost estimates are based on limited engineering and the feasibility of certain measures has not yet been confirmed. Implementation of the Plan alsorequires additional operating permits. We expect that, in order to maintain water quality, some form of water treatment will continue for an indefinite period after miningoperations end. The Plan contemplates ongoing monitoring to ensure that the water quality targets set out in the Plan are in fact protective of the environment andhuman health, and provides for adjustments if warranted by monitoring results. This ongoing monitoring, as well as our continued research into treatmenttechnologies, could reveal unexpected environmental impacts, technical issues or advances associated with potential treatment technologies that could substantiallyincrease or decrease both capital and operating costs associated with water quality management, or that could materially affect our ability to permit mine lifeextensions in new mining areas.
29
Excerpt from Teck’s Q3 2021 Press Release

Capital Expenditures Guidance
30
(Teck’s share in CAD$ millions)
2020 2021 Guidance1
SustainingCopper $ 161 $ 160Zinc 188 155Steelmaking coal2 571 430Energy 91 85Corporate 12 -Total sustaining $ 1,023 $ 830
Growth3
Copper4 $ 41 $ 125Zinc 7 25Steelmaking coal 411 460Corporate 4 5
$ 463 $ 615Total
Copper $ 202 $ 285Zinc 195 180Steelmaking coal 982 890Energy 91 85Corporate 16 5
$ 1,486 $ 1,445
(Teck’s share in CAD$ millions)
2020 2021 Guidance1
QB2 capital expenditures $ 1,643 $ 2,500Total before SMM/SC contributions 3,129 3,945Estimated SMM/SC contributions (660) (440)Estimated QB2 project financing draw to capex (983) (1,425)Total, net of partner contributions and project financing $ 1,486 $ 2,080
QB2
(Teck’s share in CAD$ millions)
2020 2021 Guidance1
Capitalized StrippingCopper $ 145 $ 205Zinc 51 70Steelmaking coal 303 400
$ 499 $ 675
Capitalized Stripping
Sustaining and Growth Capital

Commodity Price Leverage1
31
2021 Mid-Range Production Estimates2,5 Change
Estimated Effect on Annualized Profit3 ($M)
Estimated Effect on Annualized EBITDA3 ($M)
US$ exchange C$0.01 $ 78 $ 123
Copper (kt) 282.5 US$0.01/lb 4 7
Zinc4 (kt) 905.0 US$0.01/lb 9 12
Steelmaking coal (Mt) 25.5 US$1/tonne 18 29
WCS5 (Mbbl) 7.4 US$1/bbl 6 8
WTI6 US$1/bbl 2 3

Tax-Efficient Earnings in Canada and Chile
32
Canada: ~C$4.5 billion in available tax pools at December 31, 2020 • Includes:
‒ $3.8 billion in Canadian federal net operating loss carryforwards‒ $0.3 billion in Canadian Development Expenses (30% declining balance p.a.)‒ $0.4 billion in allowable capital loss carryforwards
• Applies to cash income taxes in Canada• Does not apply to:
‒ Resource taxes in Canada ‒ Cash taxes in foreign jurisdictions
Chile: ~C$800 million in available tax pools at December 31, 2020 • Chilean net operating loss carryforwards• Applies to cash income taxes for QB2

Share Structure & Principal Shareholders
33
Shares Held Percent Voting Rights
Class A ShareholdingsTemagami Mining Company Limited 4,300,000 55.4%SMM Resources Inc (Sumitomo) 1,469,000 18.9%Other 1,996,503 25.7%
7,765,503 100.0%Class B ShareholdingsTemagami Mining Company Limited 725,000 0.1%SMM Resources Inc (Sumitomo) 295,800 0.1%China Investment Corporation (Fullbloom) 59,304,474 11.3%Other 463,056,146 88.5%
523,381,420 100.0%Total ShareholdingsTemagami Mining Company Limited 5,025,000 0.9% 33.1%SMM Resources Inc (Sumitomo) 1,764,800 0.3% 11.3%China Investment Corporation (Fullbloom) 59,304,474 11.2% 4.6%Other 465,052,649 87.6% 51.0%
531,146,923 100.0% 100.0%
Teck Resources Limited at December 31, 2020

Collective Agreements
Operation Expiry Dates
Antamina July 31, 2021
Highland Valley Copper September 30, 2021
Trail Operations May 31, 2022
Cardinal River June 30, 2022
Quebrada BlancaJanuary 31, 2022
March 31, 2022November 20, 2022
Carmen de Andacollo September 30, 2022December 31, 2022
Line Creek May 31, 2024
Elkview October 31, 2026
Fording River April 30, 2027
34

Endnotes: Overview and Financial Strategy
Slide 21: Global Customer Base1. Gross profit before depreciation and amortization is a non-GAAP financial measure. See “Non-GAAP Financial Measures” slides.Slide 22: Strong Financial Position1. As at September 30, 2021.2. As at October 26, 2021.Slide 24: Teck Illustrative Cash Flows – QB2 Full Production1. Adjusted EBITDA is H1 2021 Adjusted EBITDA annualized and price adjusted assuming copper prices of US$4.50, US$4.00, and US$3.50 per pound, and a hard coking coal (HCC) price of US$199/t FOB Australia. All other commodity prices
are at H1 2021 actual average prices of copper US$4.13 per pound, zinc US$1.29 per pound, steelmaking coal US$137.50 per tonne realized price, Western Canadian Select (WCS) US$49.78 per barrel, West Texas Intermediate (WTI)US$62.16 per barrel and a Canadian/U.S. dollar exchange rate of $1.25. The sensitivity of our EBITDA to changes in the Canadian/U.S. dollar exchange rate and commodity prices are: C$0.01 change in US$ FX = C$87 million EBITDA; US$0.01/lb change in copper price = C$7 million EBITDA; US$ 0.01/lb change in zinc price = C$12 million EBITDA; US$1/tonne change in steelmaking coal price = C$29 million EBITDA; US$1/bbl change in WCS price = C$8 million EBITDA;US$1/bbl change in WTI price = C$3 million EBITDA. EBITDA and Adjusted EBITDA are non-GAAP financial measures. See “Non-GAAP Financial Measures” slides.
2. QB2 EBITDA assumes a C1 cash cost of US$1.28/lb, a Canadian/U.S. dollar exchange rate of $1.25, and annual copper sales of 290,000 tonnes. EBITDA is a non-GAAP financial measures. See “Non-GAAP Financial Measures” slides.3. Annualized H1 2021 cash taxes adjusted for future Canadian cash taxability on the basis of spot HCC prices, and future QB2 taxability, post-QB2 ramp up and post QB2 accelerated tax depreciation period. QB2 cash taxes are calculated on a
post-financing basis.4. Annualized H1 2021 cash interest paid.5. Lease payments are annualized H1 2021 lease payments (C$130 million/year).6. Guidance for capital expenditures as at September 20, 2021.7. Base dividend of C$0.20/share, paid quarterly.8. QB2 project finance repayments are two semi-annual principal repayments of US$147 million each.9. Per share amounts assume 532.4 million shares outstanding as at June 30, 2021.Slide 26: Disciplined Approach to M&A1. Carmen de Andacollo gold stream transaction occurred in USD at US$162 million.2. Antamina silver stream transaction occurred in USD at US$610 million.3. Sandstorm royalty transaction occurred in USD at US$22 million.4. Teena transaction occurred in AUD at A$10.6 million.5. San Nicolàs transaction occurred in USD at US$50 million.6. Waneta Dam transaction closed July 26, 2018 for C$1.2 billion. 7. QB2 Partnership (sale of 30% interest of project to Sumitomo; SMM and SC) for total consideration of US$1.2 billion, including US$800 million earn-in and US$400 million matching contribution; converted at FX of 1.34 on March 29, 2019.8. EBITDA is a non-GAAP financial measure. See “Non-GAAP Financial Measures” slides.
35

Endnotes: Overview and Financial Strategy
Slide 26: Production Guidance1. As at October 26, 2021. See Teck’s Q3 2021 press release for further details.2. Metal contained in concentrate. 3. We include 100% of production and sales from our Quebrada Blanca and Carmen de Andacollo mines in our production and sales volumes, even though we do not own 100% of these operations, because we fully consolidate their results in our
financial statements. We include 22.5% and 21.3% of production and sales from Antamina and Fort Hills, respectively, representing our proportionate ownership interest in these operations.4. Copper production includes cathode production at Quebrada Blanca and Carmen de Andacollo.5. Total zinc includes co-product zinc production from our 22.5% proportionate interest in Antamina. 6. Three-year guidance 2022-2024 excludes production from QB2.Slide 27: Sales and Unit Cost Guidance1. As at October 26, 2021. See Teck’s Q3 2021 press release for further details.2. Metal contained in concentrate. 3. Copper unit costs are reported in U.S. dollars per payable pound of metal contained in concentrate. Copper net cash unit costs include adjusted cash cost of sales and smelter processing charges, less cash margins for by-products including
co-products. Guidance for 2021 assumes a zinc price of US$1.30 per pound, a molybdenum price of US$14.00 per pound, a silver price of US$25 per ounce, a gold price of US$1,800 per ounce and a Canadian/U.S. dollar exchange rate of $1.24.
4. After co-product and by-product margins.5. Zinc unit costs are reported in U.S. dollars per payable pound of metal contained in concentrate. Zinc net cash unit costs are mine costs including adjusted cash cost of sales and smelter processing charges, less cash margins for by-products.
Guidance for 2021 assumes a lead price of US$1.00 per pound, a silver price of US$25 per ounce and a Canadian/U.S. dollar exchange rate of $1.24. By-products include both by-products and co-products. 6. Steelmaking coal unit costs are reported in Canadian dollars per tonne.7. Non-GAAP financial measure. See “Non-GAAP Financial Measures” slides.Slide 29: Capital Expenditures Guidance1. As at October 26, 2021. See Teck’s Q3 2021 press release for further details.2. Steelmaking coal sustaining capital guidance for 2021 includes $245 million of water treatment capital. 2020 includes $267 million of water treatment capital. 3. Growth expenditures include RACE21TM capital expenditures for 2021 of $150 million, of which $30 million relates to copper, $5 million relates to zinc, $110 million relates to steelmaking coal, and $5 million relates to corporate projects.4. Copper growth guidance for 2021 includes studies for HVC 2040, Antamina, QB3, Zafranal, San Nicolás and Galore Creek.Slide 30: Commodity Price Leverage1. As at October 26, 2021. The sensitivity of our annual profit attributable to shareholders and EBITDA to changes in the Canadian/U.S. dollar exchange rate and commodity prices, before pricing adjustments, based on our current balance sheet,
our 2021 mid-range production estimates, current commodity prices and a Canadian/U.S. dollar exchange rate of $1.25. See Teck’s Q3 2021 press release for further details.2. All production estimates are subject to change based on market and operating conditions.3. The effect on our profit attributable to shareholders and on EBITDA of commodity price and exchange rate movements will vary from quarter to quarter depending on sales volumes. Our estimate of the sensitivity of profit and EBITDA to changes
in the U.S. dollar exchange rate is sensitive to commodity price assumptions.4. Zinc includes 287,500 tonnes of refined zinc and 617,500 tonnes of zinc contained in concentrate. 5. Bitumen volumes from our energy business unit. 6. Our WTI oil price sensitivity takes into account our interest in Fort Hills for respective change in revenue, partially offset by the effect of the change in diluent purchase costs as well as the effect on the change in operating costs across our
business units, as our operations use a significant amount of diesel fuel.
36

ESG Leadership

Responding to COVID-19―Five Pillar Approach
38
Prevention Employee Support
Communities & Public Health
Business Continuity
Communication
Prioritizing the health and safety of our people and communities
Health, Safety, Environment and Communities Performance

0.00
0.10
0.20
0.30
0.40
0.50
0.60
0.70
2016 2017 2018 2019 2020 Jun-21
High-Potential Incident FrequencySerious High-Potential Incident FrequencyPotentially Fatal Occurrence Frequency
Teck Operated Incident Frequency(per 200,000 hours worked)
Health, Safety, Environment and Communities Performance• Safety performance in H1 2021 vs. FY 2020
- 38% reduction in High-Potential Incidents- 26% decrease in Lost-Time Injury Frequency
• Continued implementation of High Potential Risk Program to reduce the most significant risks
• 1 fatality in January 2021 following a fatality-free year in 2020. Carried out in-depth investigation to identify measures to prevent reoccurrence
39
Overall, 80% reduction in High-Potential Incident Frequency from 2016 to June 2021

Health, Safety, Environment and Communities Performance
Communities
Engaging throughout the mining life-cycle to create lasting benefits
• $10.8 billion in economic benefits generated in 2020
• 72% local employment at operations
• Dedicated $20 million COVID-19 fund to support local communities
• Global citizenship initiatives Copper & Health and Zinc & Health
40
IndigenousPeoples
Respect for culture and heritage; early engagement and focus on working to achieve Free, Prior and Informed Consent (FPIC)
• 72 active Indigenous agreements covering all operations
• $192 million spent with Indigenous businesses in 2020
• Support for reconciliation: Reconciliation Canada, Indian Residential School Society, Indspire youth bursary

Health, Safety, Environment and Communities Performance
41
Tailings
Meeting global best practices for safety at our tailings facilities throughout their life-cycle
• Fully applying GISTM by August 2023
• All active and closed tailings facilities meet or exceed regulatory requirements
• 0 significant tailings-related environmental incidents in 2020 and to-date in 2021
• 100% of facilities evaluated annually by a third-party Engineer of Record
Water
Working to protect water quality and reducing use in water-scarce regions.
• Tripling Elk Valley treatment capacity in 2021. Commissioned 20 M l/day Elkview SRF
• Achieved 13% reduction in freshwater use at Chilean operations
• Reused and recycled water at mining operations 3.3 times
• Constructing dedicated desalination plant at QB2
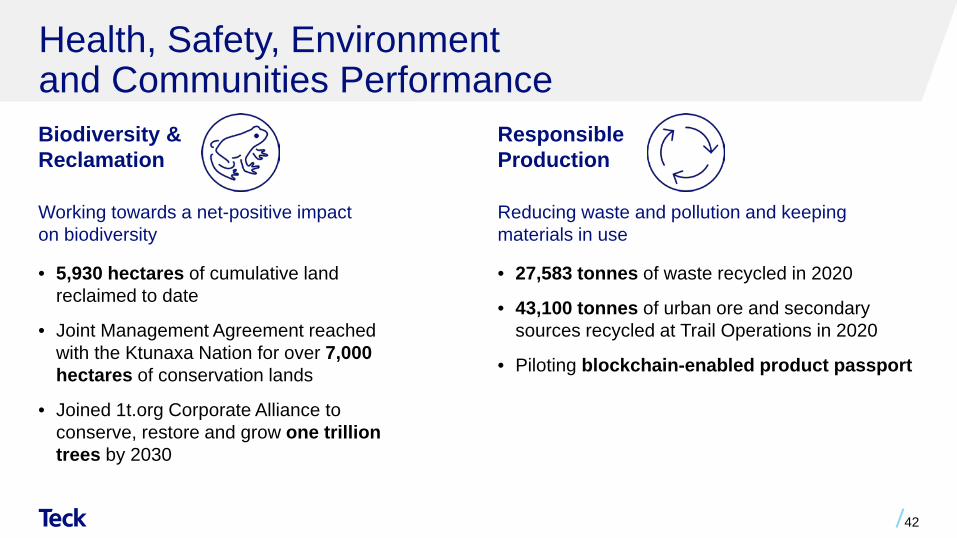
Health, Safety, Environment and Communities PerformanceBiodiversity & Reclamation
Working towards a net-positive impact on biodiversity
• 5,930 hectares of cumulative land reclaimed to date
• Joint Management Agreement reached with the Ktunaxa Nation for over 7,000 hectares of conservation lands
• Joined 1t.org Corporate Alliance to conserve, restore and grow one trillion trees by 2030
42
ResponsibleProduction
Reducing waste and pollution and keeping materials in use
• 27,583 tonnes of waste recycled in 2020
• 43,100 tonnes of urban ore and secondary sources recycled at Trail Operations in 2020
• Piloting blockchain-enabled product passport

Health, Safety, Environment and Communities PerformanceInclusion, Equity & Diversity
Fostering a workplace where everyone is included, valued and equipped for today and the future
• Named to Forbes World’s Best Employers 2020
• 20% women in total Teck workforce, vs Bloomberg 2019 industry average of 15.7%
• 28% women in senior management
• One-third of all new hires are women
43
Governance
Transparency and accountability to drive results for all our stakeholders
• 25% of Teck’s board of directors are women, above the Osler 2020 industry average in Canada of 16%
• Executive remuneration linked to HSEC performance through integration into corporate, business unit and personal components

Focus on Sustainability Leadership Ambitious sustainability goals in eight strategic themes
44
Climate Change Responsible Production
Water Tailings Management Biodiversity and Reclamation
Health and Safety Our People
Communities and Indigenous Peoples

Climate ChangeStarting from a strong position
45
Low-quartile CO2 emissions per tonne of copper, zinc and steelmaking coal production1
Teck
Carbon pricing already built into majority of business
CO2 Coal Intensity Curve (2020), t CO2e/t saleable coal
Cumulative production (Million tonnes)
Steelmaking CoalZinc
Cumulative production (Million tonnes)
Among lowest carbon intensity miners globally
CO2 Zinc Intensity Curve (2020), t CO2e/t Zinc equivalentCO2 Copper Intensity Curve (2020), t CO2e/t Copper equivalent
5 10
Copper
Teck
Well-positionedfor a Low-Carbon Economy
Cumulative production (Million tonnes)5 10 15
Teck
50 150100 200 250
Source: Skarn Associates, Q2 2021 update to 2020 dataset for global carbon intensity performance of steelmaking coal assets. Includes Scope 1 and 2 emissions.

Climate ChangeOur climate strategy
46
Positioning Teck for a low-carbon economy• Producing metals and
minerals required for transition to a low-carbon economy
• Rebalancing portfolio towards copper
• Efficient, low-cost and low-carbon operations will keep Teck competitive
Support for appropriate carbon pricing policies• We support broad-based
effective carbon pricing• Best method to encourage
global action on climate change
• Work with associations/ government on policy solutions to limit climate change to 1.5◦C
Reducing our carbon footprintLong-term targets:• Carbon neutral by 2050• Reduce carbon intensity
of operations by 33% by 2030
• Work with customers and transportation providers to reduce downstream emissions
Adapting to the physical impacts of climate change• Increase resilience
of operations• Incorporate climate
scenarios into project design and mine closure planning

Climate ChangeOur pathway to net zero
Renewable energy
Electrification & alternative material handling
Electrification & low-carbon fuels
Methane recovery& abatement Offsets
Power supply
2020‒2030: Target readily available; cost-competitive technologies in these areas
AbatementOptions
Emissionssources
Mobile equipment Stationary combustion & process
Fugitive methane
2020 2030 2040 2050 2020 2030 2040 2050 2020 2030 2040 2050 2020 2030 2040 2050 2020 2030 2040 2050
Projected timeframe
for delivery
47

Sustainability Reporting and Rankings
48
Top-ranked mining company World & North American Indices
Gold Class Award 2021
“AA” rating
Performance in top 10% of subindustry
Top ranked diversified metals mining company
Top ranked North American company
Top percentile, mining subsector
Ranked among the top 10% of Metals & Mining companies
Our Reporting Frameworks
GRI Standards
SASB Standards
Task Force on Climate Related Financial Disclosures (TCFD)
ESG Rankings
Industry Groups

ESG Resources for InvestorsHolistic reporting suite
Please see our Disclosure Portal and Sustainability Information for Investors
49
• Sustainability reporting for 20 years in Core accordance with the Global Reporting Initiative (GRI) Standards and G4 Mining and Metals Sector Disclosures
• Sustainability Report is aligned with Sustainability Accounting Standards Board (SASB)
• Task Force for Climate-Related Financial Disclosure (TCFD) aligned report “Climate Change Outlook 2021”
• Separate data download with ESG data of interest to investment community

Near-Term Copper Growth - QB2 Project
Photo: Concentrator, August 2021

Large, long-life deposit
Very low strip ratio
Low all-in sustaining costs (AISC)1
Potential to be a top 20 producer
High grade, clean concentrates
Significant brownfield development
Community agreements in place and strong local relationships
Project has passed the two-thirds complete mark
Expansion potential to be a top 5 producer
HighlightsChile Peru
Bolivia
Tarapacá Region
Arica y Parinacota
Region
Antofagasta Region
Arica
IquiqueQB2Teck, SMM, SC, ENAMI
CollahuasiAnglo American,Glencore, Mitsui
El AbraFreeport-McMoRan,
CodelcoRadomiro TomicCodelco Chuquicamata
Codelco
Ministro HalesCodelco
Cerro ColoradoBHP
SpenceBHP
CentinelaAntofagasta, Marubeni
Gabriela MistralCodelcoEscondida
BHP, Rio Tinto, Mitsubishi Argentina
Sierra GordaKGHM, SMM, SC
Location
QB2 Project Executing on a world class development asset
51

QB2’s Competitive Cost Position
Competitive Operating Cost & Capital Intensity Low Cash Cost Position
52
Based on Sanction Case (Including 199 Mt Inferred Resources) Refer to “QB2 Project Economics Comparison” and “QB2 Reserves and Resources Comparison” slides for Reserve Case (Excluding Inferred Resources)The description of the QB2 project Sanction Case includes inferred resources that are considered too speculative geologically to have the economic considerations applied to them that would enable them to be categorized as mineral reserves. Inferred resources are subject to greater uncertainty than measured or indicated resources and it cannot be assumed that they will be successfully upgraded to measured and indicated through further drilling.
C1 Cash Cost2 & AISC3 Curve1 (US$/lb, 2023E)• Given the exceptionally low strip ratio, consistent grade profile, compact site layout, and high level of automation, QB2 is expected to have attractive and relatively stable operating costs
• Exceptional strip ratio of 0.70 LOM, meaning for every one tonne of ore mined, only 0.70 tonnes of waste need to be mined (0.44 over first 5 full years)− Compares to other world class asset strip ratios of 2.6
for Escondida, 3.0 for Antamina, and 3.7 for Collahuasi1
− Major benefit to sustaining capital since it reduces mobile fleet size and replacement costs
Antamina
Escondida
Collahuasi
-
0.50
1.00
1.50
2.00
2.50
3.00
3.50
- 25% 50% 75% 100%
US$/
lb
Cumulative Paid Metal (%)
AISC C1 Cash Cost
QB2(first 5 full years)
US$1.38/lb
QB2(first 5 full years)
US$1.28/lb

Large, Long Life Deposit at Quebrada Blanca
Significant extension potential• QB2 uses only ~18% of the 2020 reserve and resource tonnage1
• Deposit is capable of supporting a very long mine life based on throughput rate of 143 ktpd2
by utilizing further tailings capacity at already identified sites
• Actively evaluating potential options to exploit value of full resource through mill expansion and / or mine life extension
• Beyond the extensive upside included in the defined QB deposit, the district geology is highly prospective for exploration discovery and resource addition; mineralization is open in multiple directions
53.
1,259 1,202 1,401 1,432
1,325 1,4721,891
3,6212,141
3,3933,492
3,119
2017 AIF 2018 ResourceUpdate
2019 AIF 2020 AIF
Inferred
M&I (Exclusive)
P&P
Resources (excluding reserves) +94%3
Reserve and Resource Tonnage (Mt)
1
Based on Sanction Case (Including 199 Mt Inferred Resources) Refer to “QB2 Project Economics Comparison” and “QB2 Reserves and Resources Comparison” slides for Reserve Case (Excluding Inferred Resources)The description of the QB2 project Sanction Case includes inferred resources that are considered too speculative geologically to have the economic considerations applied to them that would enable them to be categorized as mineral reserves. Inferred resources are subject to greater uncertainty than measured or indicated resources and it cannot be assumed that they will be successfully upgraded to measured and indicated through further drilling.

QB2 Funding Model Minimized Teck execution funding through partnership and project finance
54
QB2 Funding Model - Post January 2019 (US$B)
2.1
1.1
1.3
1.8
1.1
0.3
0.1
1.30.3
0.3
0.70.0
1.0
2.0
3.0
4.0
5.0
6.0
Project Spend Project Finance SMM & SC Teck
Ownership – 0%Funding – 48%
Ownership – 30%Funding – 37%
Ownership – 60%Funding – 15%
US$5.2 billion
4
2021 2,3 2022 2,32019/20 1,3

QB2 Project Finance Facility
55
• Senior debt will continue to be drawn pro-rata under a pre-determined Senior Debt-to-Shareholder funding ratio until US$2.5 billion is drawn
• Pre-completion, senior debt is guaranteed on a pro-rata basis (after consideration of ENAMI’s 10% carried interest)‒ Teck 66.67% / SMM 27.77% / SC 5.56%
• Senior debt becomes non-recourse after successfully achieving operational completion tests
• Semi-annual amortization payments of US$147 million will begin no later than June 15, 2023; facility matures in 2031
• The facility requires partial debt repayment upon dividend distribution to equity partners
Photo: QB2 concentrator, September 2021.

ENAMI Interest in Quebrada Blanca
Organizational Chart• The government of Chile owns a 10% non-funding
interest in Compañía Minera Teck Quebrada Blanca S.A. (CMTQB) through its state-run minerals company, Empresa Nacional de Minería (ENAMI)
• ENAMI has been a partner at QB since 1989 and is a 10% shareholder of Carmen de Andacollo
• ENAMI is not required to fund QB2 development costs• Project equity funding in form of:
‒ 25% Series A Shares‒ 75% Shareholder Loans
• Until shareholder loans are fully repaid, ENAMI is entitled to a minimum dividend, based on net income, that approximates 2.0-2.5% of free cash flow‒ Thereafter, ENAMI receives 10% of dividends /
free cash flow
56.
CMTQB
TRCL
ENAMI
Teck
10%(Series B)
100%
90%(Series A)
JVCo
SMM
66.67%
100%
33.33%
SC
83.33% 16.67%
Chile HoldCo
QB1 / QB2 / QB3

Quebrada Blanca Accounting Treatment
Balance Sheet Cash Flow• 100% of project spending included in property, plant and
equipment• Debt includes 100% of project financing• Total shareholder funding to be split between loans and
equity approximately 75%/25% over the life of the project• Sumitomo (SMM/SC)1 contributions will be shown as
advances as a non-current liability and non-controlling interest as part of equity
• Teck contributions, whether debt or equity, eliminated on consolidation
• 100% of project spending included in capital expenditures
• Sumitomo1 contribution recorded within financing activities and split approximately 75%/25% as:‒ Loans recorded as “Advances from Sumitomo” ‒ Equity recorded as “Contributions from
Non-Controlling Interests”• 100% of draws on project financing included in financing
activities• After start-up of operations
‒ 100% of profit in cash flow from operations‒ Sumitomo’s1 30% and ENAMI’s 10% share of
distributions included in non-controlling interest
57
Income Statement• Teck’s income statement will include 100% of QB’s
revenues and expenses• Sumitomo’s1 30% and ENAMI’s 10% share of profit will
show as profit attributable to non-controlling interests

QB2 Project Economics Comparison
58The description of the QB2 project Sanction Case includes inferred resources that are considered too speculative geologically to have the economic considerations applied to them that would enable them to be categorized as mineral reserves. Inferred resources are subject to greater uncertainty than measured or indicated resources and it cannot be assumed that theywill be successfully upgraded to measured and indicated through further drilling.
7 8
Reserve Case1
Sanction Case2
Mine Life Years 28 28Strip Ratio
First 5 Full Years 0.16 0.44LOM3 0.41 0.70
C1 Cash Cost4
First 5 Full Years US$/lb $1.29 $1.28LOM3 US$/lb $1.47 $1.37
AISC5
First 5 Full Years US$/lb $1.40 $1.38LOM3 US$/lb $1.53 $1.42

QB2 Reserves and Resources Comparison
Reserve Case (as at Nov. 30, 2018)1,2 Sanction Case (as at Nov. 30, 2018)2,4
59
Reserves Mt Cu Grade %
Mo Grade %
Silver Grade ppm
Proven 409 0.54 0.019 1.47
Probable 793 0.51 0.021 1.34
Reserves 1,202 0.52 0.020 1.38
Resources(Exclusive of Reserves)5
Mt Cu Grade %
Mo Grade %
Silver Grade ppm
Measured 36 0.42 0.014 1.23
Indicated 1,436 0.40 0.016 1.13
M&I (Exclusive) 1,472 0.40 0.016 1.14
Inferred 3,194 0.37 0.017 1.13
+ Inferred in SC pit 199 0.53 0.022 1.21
Reserves Mt Cu Grade %
Mo Grade %
Silver Grade ppm
Proven 476 0.51 0.018 1.40
Probable 924 0.47 0.019 1.25
Reserves 1,400 0.48 0.018 1.30
Resources(Exclusive of Reserves)3
Mt Cu Grade %
Mo Grade %
Silver Grade ppm
Measured 36 0.42 0.014 1.23
Indicated 1,558 0.40 0.016 1.14
M&I (Exclusive) 1,594 0.40 0.016 1.14
Inferred 3,125 0.38 0.018 1.15

Endnotes: Near-Term Copper Growth - QB2 Project
Slide 51: QB2 Project1. All-in sustaining costs (AISC) are net cash unit costs (also known as C1 cash costs) plus sustaining capital expenditures. Net cash unit costs are calculated after cash margin by-product credits assuming US$10.00/lb molybdenum and
US$18.00/oz silver. Net cash unit costs for QB2 include stripping costs during operations. AISC, Net cash unit cost and cash margins for by-products are non-GAAP financial measures which do not have a standardized meanings prescribed by International Financial Reporting Standards (IFRS) or Generally Accepted Accounting Principles in the United States. These measures may differ from those used by other issuers and may not be comparable to such measures as reported by others. These measures are meant to provide further information about our financial expectations to investors. These measures should not be considered in isolation or used in substitute for other measures of performance prepared in accordance with IFRS. For more information on our calculation of non-GAAP financial measures please see our Management’s Discussion and Analysis for the year ended December 31, 2018, which can be found under our profile on SEDAR at www.sedar.com.
Slide 52: QB2’s Competitive Cost Position1. Source: Wood Mackenzie. Average 2021-2040.2. C1 cash costs (also known as net cash unit costs) are presented after by-product credits assuming US$10.00/lb molybdenum and US$18.00/oz silver. C1 cash costs for QB2 include stripping costs during operations. Net cash unit costs and C1
cash costs are non-GAAP financial measures. See “Non-GAAP Financial Measures” slides. 3. All-in sustaining costs (AISC) are net cash unit costs (also known as C1 cash costs) plus sustaining capital expenditures. Net cash unit costs are calculated after cash margin by-product credits assuming US$10.00/lb molybdenum and
US$18.00/oz silver. Net cash unit costs for QB2 include stripping costs during operations. AISC, net cash unit cost and cash margins for by-products are non-GAAP financial measures. See “Non-GAAP Financial Measures” slides.Slide 53: Large, Long Life Deposit at Quebrada Blanca1. Reserves and resources as at December 31, 2020. 2. Based on Sanction Case mine plan tonnage. 3. Resources are reported separately from, and do not include that portion of resources classified as reserves. Slide 54: QB2 Funding Model1. Excludes working capital, interest, and COVID-19 capital, includes escalation and contingency, at actual CLP exchange rate.2. Excludes working capital, interest, and COVID-19 capital, includes escalation and contingency, at 775 CLP exchange rate.3. Assumes 100% of project finance and partner funding is attributed towards capital spend versus working capital, interest and COVID-19 costs.4. 2019-2021.Slide 57: Quebrada Blanca Accounting Treatment1. Sumitomo Metal Mining Co. Ltd. and Sumitomo Corporation are collectively referred to as Sumitomo.
Slide 58: QB2 Project Economics Comparison1. Based on go-forward cash flow from January 1, 2017. Based on all equity funding structure.2. Based on go-forward cash flow from January 1, 2019. Based on optimized funding structure.3. Life of Mine annual average figures exclude the first and last partial years of operations.4. C1 cash costs are presented after by-product credits assuming US$10.00/lb molybdenum and US$18.00/oz silver. Net cash unit costs are consistent with C1 cash costs. C1 cash costs for QB2 include stripping costs during operations. Net cash
unit costs and C1 cash costs are non-GAAP financial measures. See “Non-GAAP Financial Measures” slides.5. All-in sustaining costs (AISC) are net cash unit costs (also known as C1 cash costs) plus sustaining capital expenditures. Net cash unit costs are calculated after cash margin by-product credits assuming US$10.00/lb molybdenum and
US$18.00/oz silver. Net cash unit costs for QB2 include stripping costs during operations. AISC, net cash unit cost and cash margins for by-products are non-GAAP financial measures. See “Non-GAAP Financial Measures” slides.
60
Endnotes: Near-Term Copper Growth - QB2 Project
Slide 59: QB2 Reserves and Resources Comparison1. Mineral reserves are constrained within an optimized pit shell and scheduled using a variable grade cut-off approach based on NSR cut-off US$13.39/t over the planned life of mine. The life-of-mine strip ratio is 0.41.2. Both mineral resource and mineral reserve estimates assume long-term commodity prices of US$3.00/lb Cu, US$9.40/lb Mo and US$18.00/oz Ag and other assumptions that include: pit slope angles of 30–44º, variable metallurgical recoveries
that average approximately 91% for Cu and 74% for Mo and operational costs supported by the Feasibility Study as revised and updated.3. Mineral resources are reported using a NSR cut-off of US$11.00/t and include 23.8 million tonnes of hypogene material grading 0.54% copper that has been mined and stockpiled during existing supergene operations.4. Mineral reserves are constrained within an optimized pit shell and scheduled using a variable grade cut-off approach based on NSR cut-off US$18.95/t over the planned life of mine. The life-of-mine strip ratio is 0.70.5. Mineral resources are reported using a NSR cut-off of US$11.00/t outside of the reserves pit. Mineral resources include inferred resources within the reserves pit at a US$ 18.95/t NSR cut-off and also include 23.8 million tonnes of hypogene
material grading 0.54% copper that has been mined and stockpiled during existing supergene operations.
61

Copper Growth Strategy

Right Approach: Portfolio of Copper Growth OptionsValue realization through production or M&A
Teck is positioned to realize value from a robust pipeline of copper projects• Investment in exploration and strategic M&A over the last
20 years has secured quality opportunities• Focus on integrated technical, social, environmental and
commercial de-risking of opportunities • Leadership, experience and systems in place to fulfill strategy
We seek to maximize shareholder returns and maintain a strong balance sheet• Reduce Teck’s equity requirements through partnering, streams,
infrastructure carve-outs and project financing• Maintain investment grade metrics to support strong liquidity • Rigorous capital allocation framework to balance growth and
cash returns
63
QB2 Case StudyDe-risked at project sanction:• ~80% engineered and >70% procured• Key permits approved
Reduced equity requirements:• US$1.2B transaction payment received• Partnership further reduced Teck’s funding• US$2.5B project finance
Right sized balance sheet:• Repaid US$4B in debt1 and regained investment grade
rating
Return of capital to shareholders:• C$1.2B of share buy backs and ~C$700M in dividends2
Total Capex Partner Project Finance Teck

64
Near Term
Medium
TermFuture Potential
Right Approach: Actively Strengthening our PortfolioPrudent investments in near-term, medium-term, and future growth options
ZafranalCu-Au Prefeasibility Feasibility (Q2 2019)
SEIA submission in H2 2021
San NicolásCu-Zn-Au-Ag Scoping Prefeasibility (Q1 2021)
EIA submission-ready
QB3Cu-Mo-Ag
Identifying resource upside
Preparing for Prefeasibility94% growth in QB Resource
Galore CreekCu-Au-Ag Asset management Initiated Prefeasibility
Leveraging existing permits
NuevaUniónCu-Au-Mo Prefeasibility Feasibility completed (2020)
EIA submission-ready
MesabaCu-Ni-PGM
Scoping and concept studies
Preparing for PrefeasibilityEnvironmental BaselineDistrict Assessment
Schaft CreekCu-Mo-Au-Ag
Feasibility (2013 Copper Fox) Scoping update (2020)
Teck’s copper growth portfolio is supported by recent and extensive studies
Holistic portfolio approach to capital allocation
Continue to increase the quality of our medium-term and future potential growth options
Teck is positioned to maximize value from copper demand growth well beyond the ramp-up of QB2
2017 2021

QB2Zafranal
San Nicolás
QB3Galore Creek
MesabaSchaft Creek
NuevaUnión
-5.0%
50.0%
105.0%
1.5 3.5 5.5
Right Assets: Portfolio of Copper Growth OptionsValue optionality guided by commercial discipline
65
Medium-term OptionsFraming Options Near-term Options Delivering Value
Deliberate risk-adjusted capital allocation process
Valu
e C
reat
ion
Pote
ntia
l
Early Stage Options Investment | Execution
Bubble size reflects LOM average annual CuEq production1 (shown on a 100% project basis). QB3 presented as different sizes to reflect expansion options.
150ktpa
300ktpa
CuEq Production Legend

Zafranal Cu-Au Porphyry (80%)Feasibility complete, SEIA submission in H2 20211
Path to Value Realization:• Continue prudent investments to de-risk the project
improving capital and operating costs• SEIA submission in H2 2021
66
Peru
After-Tax NPV8
US$1.0BAfter-Tax IRR
23.3%Initial CapexUS$1.23B
Payback Period2.3 Years
Avg 1st 5 year3
C1 Cash Cost2
US$1.18/lb
Avg 1st 5 year3
Head Grade0.57% Cu
Avg 1st 5 year3
Production125 kt Cu42 koz Au
Avg 1st 5 year3
EBITDA2
US$0.6B
Q1 Q2 Q3 Q4 Q1 Q2 Q3 Q4 Q1 Q2 Q3 Q4 Q1 Q2 Q3 Q42021 2022 2023 2026
SEIASubmitted
Evaluation Process
Virtual Public Hearings
Final Review Process
SEIAApproval
Sanction
Construction 3 years
Production
Pre-sanction Engineering
0%
25%
50%
75%
100%
- 25 50 75
100 125 150 175 200 225
2026
2027
2028
2029
2030
2031
2032
2033
2034
2035
2036
2037
2038
2039
2040
2041
2042
2043
2044
Payable Cu (kt) Payable CuEq (kt) EBITDA Margin (RHS)
Feasibility Study Production ProfileLong Life Asset• 19 year mine life with mine life extension
opportunities though pit expansion and district resource development
Quality Investment• Attractive front-end grade profile• Mid cost curve forecast LOM C1 cash costs2
• Competitive capital intensity
Mining Jurisdiction• Strong support from Peruvian regulators
including MINEM and SENACE• Engaged with all communities
Illustrative TimelineMetal price assumptions: US$3.50/lb Cu; US$1,400/oz Au

67
Prefeasibility Study Production ProfileLong Life Asset• One of the world’s most significant
undeveloped VHMS deposits• Updated Resources Statement
Quality Investment• Expect C1 cash costs2 in the 1st quartile • Competitive capital intensity• Co-product Zn and Au & Ag credits
Mining Jurisdiction• Well-established mining district in Mexico• Community engagement well underway
0%
25%
50%
75%
100%
- 25 50 75
100 125 150
2026
2027
2028
2029
2030
2031
2032
2033
2034
2035
2036
2037
2038
2039
Payable Cu (kt) Payable CuEq (kt) EBITDA Margin (RHS)
San Nicolás Cu-Zn (Ag-Au) VHMS (100%)Prefeasibility and Environmental Impact Assessment completed1
Path to Value Realization:• Prefeasibility and EIA completed in Q1 2021 and Q3 2021• Assessing partnering and development options
Mexico
After-Tax NPV8
US$1.5B After-Tax IRR
32.5%Initial CapexUS$842M
Payback Period2.6 Years
Avg 1st 5 year3
C1 Cash Cost2
US$(0.13)/lb
Avg 1st 5 year3
Head Grade1.07% Cu
Avg 1st 5 year3
Production63 kt Cu, 147 kt Zn, 31 koz Au
Avg 1st 5 year3
EBITDA2
US$0.5B
Illustrative Timeline
Q2 Q3 Q4 Q1 Q2 Q3 Q4 Q1 Q2 Q3 Q4 Q1 Q2 Q3 Q42021 2022 2023 2025
EIA Submission EIA Approval
Sanction
Construction 2 years
Production
Commissioning
Start FS
ETJ Submission ETJ Approval
FS Complete
Early Works
Q2Q12026
Site prep. & Adv. Eng.
Metal price assumptions: US$3.50/lb Cu, US$1.15/lb Zn, US$1,400/oz Au and US$18/oz Ag

68
Preparing for prefeasibility and leveraging QB2 ESG Platform Initiating prefeasibility and reducing access cost and risk
Production Potential • Evaluating 50% to
200% increase in addition to QB2
Permitting• Environmental, social
and regulatory programs in place
Resources3,4
• M&I 3.6 Bt 0.37% Cu, 0.016% Mo, 1.1g/t Ag
• Inf 3.1Bt 0.35% Cu, 0.017% Mo, 1.1g/t Ag
Timetable• Right-size expansion
and preparing for prefeasibility
Capital Intensity• Low to medium due
to brownfield• Reduced execution /
operational risk
Production Potential5• 179 ktpa Cu• 224 koz/pa Au and
4.01 Moz/pa Ag
Permitting• Leveraging existing
permits• Tahltan / regulator
engagement
Capital Intensity• Low to medium due
to high grade resource & significant past investment
Cost Position2
• LOM C1 CostUS$0.65-0.75/lb Cu
• Notable Au and Ag by-product credits
Resources6,7,8
• M&I 1.1 Bt 0.47% Cu, 0.26 g/t Au, 4.2 g/t Ag
• Inf 0.2 Bt 0.27% Cu, 0.21 g/t Au, 2.7 g/t Ag
Timetable• Complete
prefeasibility in H1 2023
Medium-Term Development OptionsPartnerships reduce capital needs | Options allow more flexible capital allocation
Chile and Canada
Cu%
Cost Position• Highly competitive
500mGalore Creek Resources, Teck AIF 2020
Resource Pit
Long section looking west
Surface
QB Hypogene Reserves1 and Resources, Teck AIF 2020
Long section looking north
Resource Pit
QB2 Sanction Case Pit
Surface
QB3 Cu-Mo-Ag (60% Interest)
500m
0.15
0.8
0.5
0.3
0.05
Galore Creek Cu-Au-Ag (50% Interest)

3
4
2
1
5
6
7
Right Assets: Portfolio of Copper Growth OptionsMultiple high quality copper options
Near Term Options1 Zafranal (Cu-Au), Peru1,2 Teck 80% | MMC 20%
Feasibility Study complete; SEIA submission in H2 2021First five years: 133 ktpa CuEq; C1 Costs US$1.18/lb Cu. US$1.2B capex; NPV8 US$1,026M; IRR 23.3%
2 San Nicolás (Cu-Zn-Au-Ag), Mexico1,2 Teck 100%Prefeasibility Study complete Q1 2021First five years: 125 ktpa CuEq; C1 Costs (US$0.18)/lb Cu. US$0.8B capex; NPV8 US$1,499M; IRR 34.0%
Medium Term Options3 QB3 (Cu-Ag-Mo), Chile1,3 Teck 60% | SMM/SC 30%| ENAMI 10%
Prefeasibility Study stage; Various scenarios: Potential 348 - 624ktpa CuEq; Highly competitive C1 costs4 Galore Creek (Cu-Au-Ag), BC, Canada1 Teck 50% | Newmont 50%
Prefeasibility Study stage; Potential 230 ktpa CuEq; C1 Costs of US$0.65-0.75/lb Cu
Future Potential5 NuevaUnión (Cu-Au-Ag-Mo), Chile1 Teck 50% | Newmont 50%
Feasibility Study being optimized; Potential 254 ktpa CuEq; C1 Costs of US$1.00-1.10/lb Cu6 Mesaba (Cu-Ni, PGM-Co), Minnesota, USA1 Teck 100%
Scoping study complete; Potential 239 ktpa CuEq; C1 Costs US$0.80-0.90/lb Cu7 Schaft Creek (Cu-Mo-Au-Ag), BC, Canada1 Teck 75% | Copper Fox 25%
Scoping Study being updated; Potential 161 ktpa CuEq; C1 Costs US$0.60-0.70/lb CuThis slide discloses the results of economic analysis of mineral resources. Mineral resources that are not mineral reserves and do not have demonstrated economic viability.Projections for QB3, Galore Creek, Mesaba and Schaft Creek include inferred resources that are considered too speculative geologically to have the economic considerations applied to them that would enable them to be categorized as mineral reserves. Inferred resources are subject to greater uncertainty than measured or indicated resources and it cannot be assumed that they will be successfully upgraded to measured and indicated through further drilling.
Teck Greenfield Discovery
Teck Greenfield Discovery

Endnotes: Copper Growth Strategy
Slide 63: Right Approach: Portfolio of Copper Growth Options - Value realization through production or M&A1. Total debt repayment between Q4 2015 and Q3 2019.2. Share buybacks and dividends since Q4 2017 (one year prior to project sanction).Slide 65: Right Assets: Portfolio of Copper Growth Options - Value optionality guided by commercial discipline1. CuEq calculated with price assumptions: US$3.50/lb Cu; US$1.15/lb Zn; US$6.90/lb Ni; US$21/lb Co; US$10/lb Mo; US$1,400/oz Au; US$18/oz Ag; US$1,300/oz Pd; $1,200/oz Pt. Averages exclude first and last partial years of production.Slide 66: Zafranal Cu-Au Porphyry (80%)1. Financial summary based on At-Sanction Economic Assessment using: US$3.50/lb Cu and US$1,400/oz Au. Detailed Engineering, Permitting and Project Set-up costs not included. All calendar dates and timeline are preliminary potential
estimates. 2. EBITDA and C1 cash cost are non-GAAP financial measures. See “Non-GAAP Financial Measures” slides.3. First five full years of production.Slide 67: San Nicolás Cu-Zn (Ag-Au) VHMS (100%)1. Financial summary based on At-Sanction Economic Assessment using: US$3.50/lb Cu, US$1.15/lb Zn, US$1,400/oz Au and US$18/oz Ag. Go-forward costs of Prefeasibility, Detailed Engineering, Permitting and Project Set-up costs not
included. All calendar dates and timeline are preliminary potential estimates.2. EBITDA and C1 cash cost are non-GAAP financial measures. See “Non-GAAP Financial Measures” slides.3. First five full years of production (Year 2 – Year 6).Slide 68: Medium Term Development Options1. QB Hypogene Reserves: 1,432Mt at 0.51% Cu, 0.021% Mo, 1.4 g/t Ag.2. C1 cash cost is a non-GAAP financial measure. See “Non-GAAP Financial Measures” slides. C1 cash cost are shown net of by-product credits. All averages exclude first and last partial years of production.3. QB Hypogene Mineral Resources (exclusive of reserves) from Teck’s 2020 AIF. Estimates were prepared assuming metal prices of US$3.00/lb Cu and US$ 9.4/lb Mo, pit slope angles of 30 – 42 degrees and variable metallurgical recoveries. 4. QB Hypogene Mineral Resources are constrained by a pit shell developed using Whittle™ software considering similar assumptions as for Reserves. Resources are reported at Net Smelter Return cut-off of US$ 8.35/t.5. Galore Creek Production potential was calculated with price assumptions: US$3.50/lb Cu; US$1,400/oz Au; US$18/oz Ag. 6. Galore Creek Mineral Resources are estimated using metal price assumptions of US$3.00/lb copper, US$1,200/oz gold and US$20/oz silver using a US$8.84/t Net Smelter Return cut-off.7. Galore Creek Mineral Resources are reported within a constraining pit shell developed using Whittle™ software. Inputs to the pit optimization include the following assumptions: metal prices; pit slope angles of 36.3 – 51.9 degrees; variable
metallurgical recoveries averaging 90.6% for copper, 73.1% for gold and 64.5% for silver.8. Galore Creek Mineral Resources have been estimated using a US$8.84/t Net Smelter Return cut-off, which are based on cost estimates from a 2011 Prefeasibility Study. Assumptions consider that major portions of the Galore Creek Project are
amenable for open pit extraction.Slide 69: Right Assets: Portfolio of Copper Growth Options - Multiple high quality copper options1. Financials and CuEq calculated with price assumptions: US$3.50/lb Cu; US$1.15/lb Zn; US$6.90/lb Ni; US$21/lb Co; US$10/lb Mo; US$1,400/oz Au; US$18/oz Ag; US$1,300/oz Pd; US$1,200/oz Pt. C1 cash costs are shown net of by-product
credits. All averages exclude first and last partial years of production.2. Financial summary based on At-Sanction Economic Assessment. Go-forward costs of Prefeasibility, Detailed Engineering, Permitting and Project Set-up costs not included.3. Various paths to expansion including 50% increase, doubling and tripling of throughput.
70

RACE21TM Technology and Innovation ProgramPlease see the video of the RACE21TM
presentation at our Investor & Analyst Day here, starting at ~1:28

RACE - Teck’s Path to TransformationA journey kickstarted in 2019 to unlock the potential of technology and our people
… to reduce operating cost and significantly improve safety, sustainability, and productivity
Renewthe technology and data infrastructure
Automateoperations
Connectsystems across the value chain
Empower Teck’s workforce through digital
72

Strengthen Existing High-Quality Assets Through RACE21TM
73
Transformationalsafety impact
Step-change impact to operational efficiency
Increased productivity through technology and innovation
Increased margins
Advanced data analytics and artificial intelligence to reduce risk of heavy vehicle / light vehicle interactions
Increased copper throughput by ~7% and recovery by ~2% at Highland Valley Copper
Record haul truck productivities at our coal sites, up 0.5% versus same period last year
Improved zinc feed margins by $5 per tonne processed at our Trail Operations
RACE21TM is driving operational improvements and transforming our business through technology and innovation
Focu
sE
xam
ples

Base Metals Business Units –Copper and Zinc

75
• High-quality operating assets with strong margins
• Substantial near-term growth from QB2
• Operational excellence underpins cost competitiveness
• Driving improved performance with RACE21TM
Building on our foundation of quality assets and operating discipline
Near-term copperproduction growth1
~100%Per year copper
equivalent production by 20232
>850kt
Gross Profit Margin before Depreciation
& Amortization3
>50%Illustrative EBITDA from Base Metals
with QB24,5
$3.8B
Significant Base Metals GrowthExpanding our high-quality Base Metals business
Illustrative Copper and Zinc Proforma: includes QB2 on a 100% consolidation basis; QB2 EBITDA assumes 290ktpy copper sales and US$1.28/lb C1 cash cost. Illustrative EBITDA assumes a copper price of US$3.50/lb and zinc price of US$1.15/lb.

Reserves2
M&I Res.2Inferred Res.2(CuEq Mt)
34.156.850.3
36.210.813.1
21.658.157.9
Operating Jurisdictions
Canada, USA, Chile, Peru
Zambia, Mauritania, Panama, Spain, Turkey,
FinlandChile
Significant Base Metals GrowthTeck’s Base Metals business rivals leading copper peers
76
Consolidated Copper Equivalent Production 1 (kt CuEq)
Teck AntofagastaFirst Quantum11%
62%0%
528
855 887988
832 828
Teck2020A
Teck2023E
First Quantum2020A
First Quantum2023E
Antofagasta2020A
Antofagasta2023E
Copper Zinc (CuEq) Other (CuEq)
Source: Production for 2020 is sourced from company disclosures. Production for 2023 is sourced from Wood Mackenzie asset models.

C1 Cost2
(US$/lb Cu) $1.28 $1.16 $1.21 $1.33 $1.14 $1.14
Enterprise Value3 (C$B) $29.9 $27.3
Significant Base Metals GrowthTeck’s Base Metals business rivals leading copper peers
77
Consolidated Copper Equivalent Production 1 (kt CuEq)
Teck AntofagastaFirst Quantum11%
62%0%
528
855 887988
832 828
Teck2020A
Teck2023E
First Quantum2020A
First Quantum2023E
Antofagasta2020A
Antofagasta2023E
Copper Zinc (CuEq) Other (CuEq) Attributable (CuEq)
Source: Production and C1 costs for 2020 are sourced from company disclosures. Production for 2023 is sourced from Wood Mackenzie asset models. C1 costs for 2023 are sourced from S&P Global Market Intelligence, Metals & Mining.

78
Quality assets with strong margins• Antamina, Highland Valley and Carmen de Andacollo
provide a stable, low-cost operating foundation• QB2 has low strip ratio and AISC3 in second quartile• Continuous improvement is core to operating
philosophy
Significant near-term growth and options• QB2 first production in the second half of 2022• Teck is positioned to realize value from a robust
pipeline of copper projects• Multiple high-quality near-term (San Nicolas and
Zafranal), medium-term (QB3 and Galore Creek) and mine life extension (HVC and Antamina) options
Industry Leading Copper GrowthBuilding on our foundation of quality assets and operating discipline
Continue to prudently advance the growth portfolio to increase the value and certainty of options
Teck Consolidated Copper Production2 (kt Cu)
276 276
290
2020A ProForma
QB2 Consolidated (100%) Teck 2020 Actual
~100%
40%
50%
60%
70%
2017 2018 2019 2020 H1 2021
Gross Profit Margin Before Depreciation & Amortization from Operations Consistently ~45-55%1

79
Quality assets with strong margins• Red Dog is a first quartile cash cost operation• Trail produces refined zinc, lead, and other products
with clean, renewable power and strong recycling capabilities
Integrated business model• Unique position as largest net zinc miner• Exposure to price increases and market changes
Attractive development opportunities• Significant potential mine life extension in Red Dog
district, with large, high grade mineralized system• Several of the top next generation zinc assets
World Class Zinc BusinessLarge scale, low-cost integrated business
Maximizing cash flows from quality assets
Gross Profit Margin before Depreciation & Amortization from Mining Operations Consistently >50%1
Teck Has Several Large Undeveloped Zinc Assets2
05101520253035
05
101520253035
Con
tain
ed Z
n +
Pb (M
t)
Gra
de Z
n +
Pb (%
)
40%
50%
60%
70%
2017 2018 2019 2020 H1 2021
Bar height = size of the deposit. Yellow marker = estimated grade.

RACE21TM – Processing Analytics JourneySignificant improvements realized within our processing plants
80
Red Dog Operations• Advanced grinding control has realized a ~9% increase
in production rates1
Highland Valley Copper• Deployed real-time optimization models have realized
a ~7% increase in copper production2
Flotation Optimization
Red Dog Grinding Circuit
Highland Valley Copper IPM Flotation Recommendations

81
• High quality, growing copper business
• World class zinc business
• Focus on operating discipline
• Significant improvements driven by RACE21TM
Significant Base Metals Cash FlowExpanding our high-quality Base Metals business
Building on our foundation of quality assets and operating discipline
Photo: QB2 concentrator, September 2021.

Operations Improvement and Cash Flow Focus in Copper
Productivity & Cost Management• Focus on reliability and maintenance
and cross site sharing • RACE21TM and continuous
improvement pipeline driving benefits across sites – a key driver of margins
• Cost reductions embedded in plans
82
Focused Investment Priorities• Key water, tailings and regulatory projects
drive sustaining capital requirements • Near-term higher sustaining spending
from tailings facility costs at Antamina• Long-term sustaining capex (2024+)
in copper expected at $125 million, excluding QB2 and life extension projects

Copper Unit Costs
83
Operating Cost1 Breakdown in 2020
Labour 30%
Contractors and Consultants 11%
Operating Supplies 16%
Repairs and Maintenance Parts 16%
Energy 20%
Other 6%
Total 100%
Operating Costs47%
Unit Costs1 in 2020
Royalties 2%
Depreciation and
Amortization 24%
Transportation 6%
Operating Costs68%

Operations Improvement and Cash Flow Focus in Zinc
Productivity• Focus on asset management and cross
site sharing • RACE21TM and continuous
improvement pipeline driving benefits across sites – a key driver of margins
• Cost reductions embedded in plans
84
Focused Investment Priorities• Key water, tailings and regulatory projects
drive sustaining capital requirements • Near term higher sustaining spending from
tailings related projects at Red Dog and air quality and asset renewal at Trail Operations
• Long-term sustaining capex (2024+) in zinc expected at $150 million, excluding life extension projects

Zinc Unit Costs
85
Operating Cost1 Breakdown in 2020
Labour 35%
Contractors and Consultants 10%
Operating Supplies 11%
Repairs and Maintenance Parts 9%
Energy 18%
Other 17%
Total 100%
Operating Costs47%
Unit Costs1 in 2020
Depreciation and
Amortization 24% Operating Costs
68%
Depreciation and Amortization
13%
Operating Costs38%
Transportation 12%
ConcentratePurchases
26%
Royalties 11%

Red Dog Sales Seasonality
• Operates 12 months • Ships ~ 4 months• Shipments to inventory in Canada
and Europe; Direct sales to Asia• ~65% of zinc sales in second half
of year • ~100% of lead sales in second half
of year• Sales seasonality causes net cash
unit cost seasonality
86
Zinc Sales 1 (%)
Lead Sales1 (%)
21%16%
31% 32%
0%10%20%30%40%
Q1 Q2 Q3 Q4
0% 1%
66%
33%
0%
20%
40%
60%
80%
Q1 Q2 Q3 Q4

Red Dog Net Cash Unit Cost Seasonality
Five-Year Average Red Dog Net Cash Unit Costs1 (US$/lb)
87
• Seasonality of Red Dog unit costs largely due to lead sales during the shipping season• Higher net cash unit costs expected in 2021 compared to 2020 due primarily to lower
production volumes in 2020, as well as lower contribution from silver by-products
-
0.20
0.40
0.60
Q1 Q2 Q3 Q4

Red Dog in Bottom Quartile of Zinc Cost CurvesHigher zinc prices illustrate continuing tight market
Total Cash + Capex Cost Curve 20211 (US¢/lb)
88
0
20
40
60
80
100
120
140
160
180
0% 25% 50% 75% 100%
2021 Costs Based on Current Prices Current Spot LME Price
RED DOG

Red Dog Extension Project
Long Life Asset• Aktigiruq exploration target of 80-150 Mt
@ 16-18% Zn + Pb1
• Anarraaq Inferred Resource2: 19.4 Mt @14.4% Zn, 4.2% Pb
Quality Project• Premier zinc district• Significant mineralized system • High gradeStable Jurisdiction• Operating history• ~12 km from Red Dog operations
89
Qanaiyaq
AktigiruqAnarraaq
Paalaaq
Su-Lik
AqqalukMain
Looking Northwest

Endnotes: Base Metals Business Units
Slide 75: Significant Base Metals Growth - Expanding our high-quality Base Metals business1. Source: Wood Mackenzie base case copper production dataset. Consolidated production estimate was derived based on accounting standards for consolidation. Copper production growth estimate uses 2020 actual production and Wood
Mackenzie data for 2023.2. Production for 2023 is sourced from Wood Mackenzie asset models and is shown on a consolidated reporting basis. Copper equivalent production includes copper, zinc, molybdenum, lead and gold, considering production from Teck’s Copper
and Zinc mining assets only. Copper equivalent production is calculated using the following prices: US$3.50/lb Cu, US$1.15/lb Zn, US$0.90/lb Pb, US$10.50/lb Mo, US$1,650/oz Au. 3. Mining operations only, and therefore excludes Trail. Calculated as Gross Profit Before Depreciation & Amortization divided by reported Revenue, sourced from Teck’s public disclosures for the period of 2017 through the first half of 2021. Gross
Profit Before Depreciation & Amortization Margin from Mining Operations is a non-GAAP financial measure.4. Illustrative Base Metals EBITDA is H1 2021 Adjusted EBITDA for our Copper and Zinc Business Units annualized and price adjusted assuming prices of US$3.50/lb Cu and US$1.15/lb Zn. All other commodity prices are at H1 2021 actual
average prices with a Canadian / U.S. dollar exchange rate of $1.25. The sensitivity of our EBITDA to changes in commodity prices are: US$0.01/lb change in copper price = C$7 million EBITDA; US$ 0.01/lb change in zinc price = C$12 millionEBITDA. EBITDA and Adjusted EBITDA are non-GAAP financial measures. See “Non-GAAP Financial Measures” slides.
5. QB2 EBITDA assumes a C1 cash cost of US$1.28/lb, a Canadian/U.S. dollar exchange rate of 1.25 and annual copper sales of 290,000 tonnes. EBITDA is a non-GAAP financial measure. See “Non-GAAP Financial Measures” slides.Slide 76: Significant Base Metals Growth - Teck’s Base Metals business rivals leading copper peers1. Production for 2020 reflects actuals sourced from company disclosures. Production for 2023 is sourced from Wood Mackenzie asset models, considering assets included in Wood Mackenzie’s base case for each company. Production is shown
on a consolidated reporting basis. Copper equivalent production for 2020 is calculated using annual average prices of: US$2.83/lb Cu, US$1.05/lb Zn, US$0.85/lb Pb, US$8.68/lb Mo, US$US$1,779/oz Au, US$20.70/oz Ag, US$6.43/lb Ni. Copper equivalent production for 2023 is calculated using the following prices: US$3.50/lb Cu, US$1.15/lb Zn, US$0.90/lb Pb, US$10.50/lb Mo, US$1,650/oz Au, US$22.50/oz Ag, US$6.90/lb Ni.
2. Teck’s contained equivalent copper metal at 100% basis for all Copper and Zinc assets. See Teck’s 2020 AIF for further information, including the grade and quantity of reserves and resources for these assets and the grade of the other metals used to determine the copper equivalent. Contained equivalent copper metal for peers are sourced from SNL Financial – S&P Global Market Intelligence. Copper equivalent is calculated using prices of: US$3.50/lb Cu; US$1.15/lb Zn; US$6.90/lb Ni; US$21/lb Co; US$10/lb Mo; US$1,400/oz Au; US$18/oz Ag; US$1,300/oz Pd; US$1,200/oz Pt.
Slide 77: Significant Base Metals Growth - Teck’s Base Metals business rivals leading copper peers1. Production for 2020 reflects actuals sourced from company disclosures. Production for 2023 is sourced from Wood Mackenzie asset models, considering assets included in Wood Mackenzie’s base case for each company. Production is shown
on a consolidated reporting basis, except where noted as attributable for ownership. Copper equivalent production for 2020 is calculated using annual average prices of: US$2.83/lb Cu, US$1.05/lb Zn, US$0.85/lb Pb, US$8.68/lb Mo, US$US$1,779/oz Au, US$20.70/oz Ag, US$6.43/lb Ni. Copper equivalent production for 2023 is calculated using the following prices: US$3.50/lb Cu, US$1.15/lb Zn, US$0.90/lb Pb, US$10.50/lb Mo, US$1,650/oz Au, US$22.50/oz Ag, US$6.90/lb Ni.
2. 2020 C1 cash cost data is sourced from company disclosures and are for copper operations only. Expected 2023 C1 cash cost data is sourced from S&P Global Market Intelligence (formerly SNL Metals & Mining) cost curve database considering primary copper mines and total cash costs on a by-product basis for Teck and peers, and weighted on a consolidated production basis.
3. Enterprise Value, or Total Enterprise Value is as of market close on August 30, 2021 and is sourced from S&P Capital IQ.Slide 78: Industry Leading Copper Growth1. Calculated as reported Gross Profit before D&A divided by reported Revenue, sourced from Teck’s public disclosures. Margin data from 2017-2020 are for the full year, while margin data for 2021 reflects available results through the first half of
2021 only. Gross Profit Before Depreciation & Amortization Margin from Operations is a non-GAAP financial measure. 2. We include 100% of production from our Quebrada Blanca and Carmen de Andacollo mines in our production and sales volumes, even though we do not own 100% of these operations, because we fully consolidate their results in our financial
statements. We include 22.5% of production from Antamina, representing our proportionate ownership interest in the operation. QB2 is on a consolidated basis and is based on the QB2 Sanction Case first five full years of copper production.3. All-in sustaining costs (AISC) are net cash unit costs (also known as C1 cash costs) plus sustaining capital expenditures. Net cash unit costs are calculated after cash margin by-product credits assuming US$10.00/lb molybdenum and
US$18.00/oz silver. Net cash unit costs for QB2 include stripping costs during operations. AISC, Net cash unit cost and cash margins for by-products are non-GAAP financial measures which do not have a standardized meanings prescribed by International Financial Reporting Standards (IFRS) or Generally Accepted Accounting Principles in the United States. These measures may differ from those used by other issuers and may not be comparable to such measures as reported by others. These measures are meant to provide further information about our financial expectations to investors. These measures should not be considered in isolation or used in substitute for other measures of performance prepared in accordance with IFRS. For more information on our calculation of non-GAAP financial measures please see our Management’s Discussion and Analysis for the year ended December 31, 2018, which can be found under our profile on SEDAR at www.sedar.com.
90

Endnotes: Base Metals Business Units
Slide 79: World Class Zinc Business1. Mining operations only, and therefore excludes Trail. Calculated as Gross Profit before D&A divided by reported Revenue, sourced from Teck’s public disclosures. Margin data from 2017-2020 are for the full year, while margin data for 2021
reflects available results through the first half of 2021 only. Gross Profit Margin Before Depreciation & Amortization from Mining Operations is a non-GAAP financial measure.2. Sources: S&P Global Market Intelligence, SNL Metals & Mining Database, Teck Public Disclosures. 3. 80-150 Mt @ 16-18% Zn + Pb. Aktigiruq is an exploration target, not a resource. Refer to press release of September 18, 2017, available on SEDAR. Potential quantity and grade of this exploration target is conceptual in nature. There has been
insufficient exploration to define a mineral resource and it is uncertain if further exploration will result in the target being delineated as a mineral resource.4. Inferred resource of 58 Mt @ 11.1% Zn and 1.5% Pb, at a 6% Zn + Pb cut off, estimated in compliance with the Joint Ore Reserves Committee (JORC) Code. Excludes Myrtle.Slide 80: RACE21TM – Processing Analytics Journey 1. Production rate increase is compared against a historical throughput baseline established for similar operating conditions when the tools were not in use.2. Copper production increase is compared against a historical baseline established for similar operating conditions when the tools were not in use.Slide 83: Copper Unit Costs1. Copper unit costs are reported in US dollars per pound. Non-GAAP financial measures. See “Non-GAAP Financial Measures” slides.Slide 85: Zinc Unit Costs1. Zinc unit costs are reported in US dollars per pound. Non-GAAP financial measures. See “Non-GAAP Financial Measures” slides.Slide 86: Red Dog Sales Seasonality1. Average sales from 2016 to 2020.Slide 87: Red Dog Net Cash Unit Cost Seasonality1. Average quarterly net cash unit cost in 2016 to 2020, before royalties. Based on Teck ‘s reported financials. Net cash unit cost is a non-GAAP financial measure. See “Non-GAAP Financial Measures” slides. Slide 88: Red Dog in Bottom Quartile of Zinc Cost Curves1. Source: Data compiled by Teck from information from Wood Mackenzie, LME – Based on WM Forecast information and estimates for 2021 based on current short term average prices.Slide 89: Red Dog Extension Project1. Aktigiruq is an exploration target, not a resource. Refer to press release of September 18, 2017, available on SEDAR. Potential quantity and grade of this exploration target is conceptual in nature. There has been insufficient exploration to
define a mineral resource and it is uncertain if further exploration will result in the target being delineated as a mineral resource. 2. Based on Teck’s 2020 Annual Information Form.
91

Copper Market

Copper Supply Needed for Electrification TargetsSupply committed pre-pandemic insufficient to meet growing demand
Supply response falling short• >80% of the current committed mine projects were
sanctioned prior to the pandemic • Under an IEA 1.5 degree scenario, copper demand
will grow by >12 Mt in the next 10 years• In the last 20 years (China growth), copper mine
production only grew 7 Mt• Only 2.4 Mt is committed over the next five years
Demand accelerating in mid-term• Automakers are raising five-year targets for EV fleets;
up by 18% in the last six months• Wind and solar driven by corporate agendas• Current electric grid requires >10% increase to meet
near term targets of 40% EV penetration
93
Teck well positioned for future copper demand growth
15,000
16,500
18,000
19,500
21,000
2019 2020 2021 2022 2023 2024 2025 2026
2019-2021890 kt
2021-20231,730 kt
2023-2026-170 kt
0
5
10
15
20
2020 2021 2022 2023 2024 2025 2026Mar-21 Jun-21 Sep-21
4.2% 6.8%
Global Market Share
8.6%10.4%
12.6%14.8%
18.1%
Copper Mine Growth1 (kt)
EV Change in Projected Growth Last Six Months2 (BEV + PHEV M units)
Smelter Demand

Copper MarketPhysical inventories continue to tighten
• Demand for raw materials and mine disruptions keep concentrate demand high‒ Mine production cuts YTD 2021 ~0.6 Mt ‒ Chinese/EU smelters face power restrictions‒ Spot TC/RC rise to mid-50’s to low 60’s
• LME price return to record highs, as available on warrant LME inventories drop
• SHFE stocks continue to fall to 2009 lows• Scrap availability remains tight, shipments
restricted by logistics issues.• Tight scrap market is pushing cathode
premiums higher; Chinese cathode premiums US$85-105 per tonne in Q3 2021
Copper Scrap is 18% of Supply and 20% of Total Demand2
Available LME Stocks Drop to Historic Lows1
94
Cathode Demand 23.6 Mt Copper Demand 29.6 Mt
Wire Rod 74%
Billet 13%
Cable/Slab 13% Electrical
Network 28%
Construction 28%
Industrial Machinery
11%
Consumer & General
21%
Transport 12%
050100150200250300
$6,000
$7,000
$8,000
$9,000
$10,000
$11,000
Jan-20 Apr-20 Jul-20 Oct-20 Jan-21 Apr-21 Jul-21 Oct-21
On Warrant LME Stocks Price

• Chinese mine production flat to 2024 on lack of resources• Total probable projects: 900 kmt
Mine kmt
Kamoa – Kakula 535
PT – Freeport (vs 2019) 435
Quebrada Blanca 2 300
Quellaveco to 2024 275
Cobre Panama 252
China to 2024 345
All others (Spence, Chuqui UG, Escondida) 1,090
SXEW Reductions to 2024 (360)
Reductions & Closures (654)
Mine Production Set To Increase 2.2 Mt By 20241
Includes:
95
12,000
14,000
16,000
18,000
20,000
22,000
2018 2019 2020 2021 2022 2023 2024 2025 2026 2027
Other ChinaPT Freeport Cobre PanamaQuellaveco Quebrada BlancaKamoa-Kakula New Mines
Global Copper Mine Production2 (kt contained)
Global Copper Mine Production Increasing Slowly

96
$0$10$20$30$40$50$60$70$80$90
$100$110$120
Annual/Mid Year Spot
TC/RCs Spot and Annual Falling1 (US$/lb)
Copper Disruptions Continue To Impact MinesSmelters now facing power supply issues
Disruptions (kt)2;
-1,800
-1,600
-1,400
-1,200
-1,000
-800
-600
-400
-200
02005 2007 2009 2011 2013 2015 2017 2019 2021
3.6%
2.7%
4.0%
6.6%
4.0%Run Rate

15,000
16,000
17,000
18,000
19,000
20,000
21,000
22,000
2019 2020 2021 2022 2023 2024 2025
Growth in Copper Smelter Capacity China added 3.2 Mt since 2019; 1.9 Mt of new announcements ex-China
97
Copper Mine Growth1
(kt)
2019 - 2021200kt
2021- 20232,180 kt
2023 - 2025128 kt
0100200300400500600700800900
1000
+1.9 Mt of New/Restarted Chinese Smelting Capacity+1.9 Mt of Ex-China Capacity
2021 – 20231,915 kt
2023+1,900 kt

98
Chinese Imports Shift to Concentrates3
(Copper content, kt)
0
2,000
4,000
6,000
8,000
10,000
12,000
2016 2017 2018 2019 2020 2021e 2022e
Concentrates Blister Scrap Cathode
Chinese Scrap/Blister Imports Fall2(Copper content, kt)
0
500
1,000
1,500
2,000
2,500
2013 2014 2015 2016 2017 2018 2019 2020 2021e 2022e
Blister Scrap
• Cathode imports drop in 2021, after tight concentrates and scrap market in 2020 saw record cathode imports
• Concentrates imports continue to rise on smelter demand
• Reclassified scrap/blister rising off the 2020 lows
Copper SupplyChinese imports shift to concentrates to feed smelter capacity increases

Copper Metal StocksRaw material shortages increase cathode demand
• Exchange stocks have fallen 150 kt since June, now equivalent to 3.9 days of global consumption
• Available stock days are now 1.5 days of global consumption
• SHFE stocks have decreased 115 kt and bonded stocks are down ~200 kt since the announced release of government stockpiles
• Visible global copper inventories have fallen 40% since June, all of it within China
• If the European Cancelled Warrants are removed global visible stocks would at lowest since 2004
• Underlying demand remains supported despite cuts to power supplies, supply chain inventories low
99
Daily Copper Prices (US$/mt) and Stocks1 (kt)
02004006008001,0001,2001,4001,6001,800
$0
$2,000
$4,000
$6,000
$8,000
$10,000
$12,000
2011
2012
2013
2014
2015
2016
2017
2018
2019
2020
2021
LME Stocks ComexSHFE Bonded EstimatePrice

Endnotes: Copper Market
Slide 93: Copper Supply Needed for Electrification Targets1. Copper concentrate supply and smelter demand 2019 – 2020 actuals and 2021 – 2026 forecasts, includes committed projects and projected 4% disruption allowance. Wood Mackenzie, CRU, Teck. As at September 30th, 2021.2. Change in BEV/PHEV market share projections by global auto makers. Source: CRU.Slide 94: Copper Market1. Source: Shanghai Metal Market.2. Source: Wood Mackenzie.Slide 95: Global Copper Mine Production Increasing Slowly1. Source: Data compiled by Teck based on information from Wood Mackenzie and Company Reports (average production first 10 years).2. Source: Data compiled by Teck based on information from Wood Mackenzie and Teck’s analysis of publicly available quarterly financial reports and other public disclosures of various entities.Slide 96: Copper Disruptions Continue to Impact Mines1. Source: Data compiled by Teck based on information from Wood Mackenzie, CRU, and Metal Bulletin.2. Source: Data compiled by Teck based on information from Wood Mackenzie and Teck’s analysis of publicly available quarterly financial reports and other public disclosures of various entities.Slide 97: Growth in Copper Smelter Capacity1. Includes mine projects with copper capacity >10 ktpa. Source: BGRIMM.2. Source: BGRIMM, SMM, Teck.Slide 98: Copper Supply1. Source: Wood Mackenzie, GTIS, BGRIMM, SMM.2. Source: Wood Mackenzie, GTIS, BGRIMM, SMM. Slide 99: Copper Metal Stocks1. Source: LME, Comex, SHFE, SMM.
100

Zinc Market

Zinc Outperforms Market ExpectationsChinese mine production continues to underperform expectations
102
0%
10%
20%
30%
40%
2016 2017 2018 2019 2020 2021E 2022E 2023E0
2,000
4,000
6,000
8,000
China production Additional concenrate requiredShare of imported concs
Concentrate market remains tight through 2021• Spot TCs unchanged all year at historically low levels• China energy shortages have minor impact on Chinese smelters• Chinese mine production growth limited going forward• South American supply/logistics continue to struggle • European smelter cuts impact less on tight concentrate market
Metal market better than projected• Chinese mine supply did not deliver as analysts projected• Galvanized steel demand strong globally, record high prices• Auto production backlog likely to continue into 2022• Ex-China infrastructure spending to continue, energy sector
under invested• Decarbonization trend will be steel intensive• Galvanizing steel extends service life, reducing scrapping• European energy crisis leads to potential Zinc Metal cuts -
results in price spike and increase in physical premiums0¢30¢60¢90¢120¢150¢180¢
0
500
1,000
1,500
2014 2015 2016 2017 2018 2019 2020 2021
LME Comex SHFE Bonded Estimate LME Price
China Zinc Concentrate Supply1 (Kmt)
Global Visible Stocks2 (kt)
(RHS US¢/lb)
(RHS imports as a percentage of total feed)

Zinc MarketRaw materials shortages and strong demand support prices
• Demand for raw materials and mine disruptions due to COVID-19 kept concentrate demand strong‒ Mine production in 2020 declined ~1 Mt, while
smelter cuts were only ~300 kt‒ Ongoing spread of the virus and COVID-19
protocols continue to impact production in 2021‒ Despite return of mine production, concentrate
supply remains tight; Spot TCs have remained stable in 2021, currently at ~US$80/dmt
• Construction, infrastructure, and automobile demand driving zinc demand in China‒ Galvanized utilization rates rebounded after Lunar
New Year to 91% in March and has since averaged 86%, well above the long-term average of 78%
‒ China zinc premiums remain above ~US$100/t for ten straight months so far
‒ Power cuts will likely impact demand over the winter, but seasonally not surprising
Zinc Tied to the Protection of Steel for 60% of Total Demand2
Steel Demand in China Supporting Zinc Price1
25
50
75
100
Jun-17 Dec-17 Jun-18 Dec-18 Jun-19 Dec-19 Jun-20 Dec-20 Jun-21Ope
ratin
g R
ates
%
Total Smelter Operating Rates Large Zinc SmeltersOperating Rates at Galvanizers
103
Zinc Demand 13.1 Mt Zinc End Uses 13.1 MtConsumer Products
6%
Construction 51%
Transport20%
Industrial Machinery
7%Infrastructure
16%Galvanizing
52%
Oxides & Chemical
7%
Brass & Semi Cast
16%
Semi-Manufactured
6%Die Cast
Alloys 15%
Other4%

0
1,000
2,000
3,000
4,000
5,000
6,000
7,000
2013
2014
2015
2016
2017
2018
2019
2020
2021
2022
2023
0
1,000
2,000
3,000
4,000
5,000
6,000
7,000
2013
2014
2015
2016
2017
2018
2019
2020
2021
2022
2023
Chinese Zinc Mine and Smelter ProductionMine production flat while smelter production increases
104
Chinese Refined Production Up 13% Since 20182
(kt Contained)Chinese Mine Production Flat Since 20181
(kt Contained)
Delayed projects and decreasing ore grades continue to impact Chinese mines

3.03.33.53.84.0
100
350270
180300 326
557392
495
277360
200
-630
83-38
-153
40-50
50 100
-800
-600
-400
-200
0
200
400
600
800
Early-year estimate Adjusted estimate
105
Estimated Chinese Zinc Mine Growth Rarely Achieved1 (Kmt Contained)
Zinc Ore Grades Falling at Chinese Mines3
(Ore grade, zinc %)
-4,000-3,000-2,000-1,000
01,000
New Mines China Mines ROW Mines ChangeChanges in Mine Production Since Q1 20182
Global Zinc Mine Production Remains Under PressureOngoing risk to supply growth in 2021

0200400600800
1,0001,2001,4001,600
Jan-
12Au
g-12
Mar
-13
Oct
-13
May
-14
Dec
-14
Jul-1
5Fe
b-16
Sep-
16Ap
r-17
Nov
-17
Jun-
18Ja
n-19
Aug-
19M
ar-2
0O
ct-2
0M
ay-2
1
Domestic Commercial Stocks Bonded StocksSmelter + Consumer Stocks
503
770 788
627 627
1,095 1,109 1,174
0
200
400
600
800
1,000
1,200
1,400
2016 2017 2018 2019 2020 2021 2022 2023
Zinc Stocks Continue to Decrease Despite Refined Production Increases in China
106
Additional Zinc Metal Required to Fill the Gap3 (kt)
De-stocking ContinuesChinese Stocks at Record Lows1,2 (kt)
• August 2021 stocks down 23% yoy; down 66% from decade-ago high• SRB released stocks for first time since 2012 in an attempt to influence prices; Prices have not responded and stocks
have remained flat since June• Additional metal required to meet 2021 demand

• Following the return of Chinese mine production after COVID-19 shutdowns, increasing smelter production kept China reliant on imported concentrate
• Chinese mine production decreased 1.6% in 2020 on declining ore grades and delayed projects
• Mine production is recovering in South America, after losing >1.0 Mt of production in 2020; production may return to 2018 levels this year
• 2021 global zine mine production currently forecast to grow 7.2% over 2020, but up only 3.9% over 2019 levels. Smelter production globally is forecast to be up 5.2% over the same two year period
Zinc SupplyMine production increasing in 2021, but remains at risk due to COVID-19
107
Zinc Mine Production1 (kt contained)
0
2,000
4,000
6,000
8,000
10,000
12,000
14,000
16,000
2017 2018 2019 WM Q42019 F
2020 2021 2022 2023
ROW Others ChinaGlencore Dugald RiverGamsberg New CenturyNew Mines WM Pre-Covid 2020 Forecast

Zinc Concentrate Treatment ChargesStable in 2021, near historical lows
Treatment Charges1 (USD/dmt)
108
0
50
100
150
200
250
300
350
Spot TC Benchmark TC
Spot TCs down 75%
vs. Feb 2020 peak
Benchmark TCs down 47% YoY
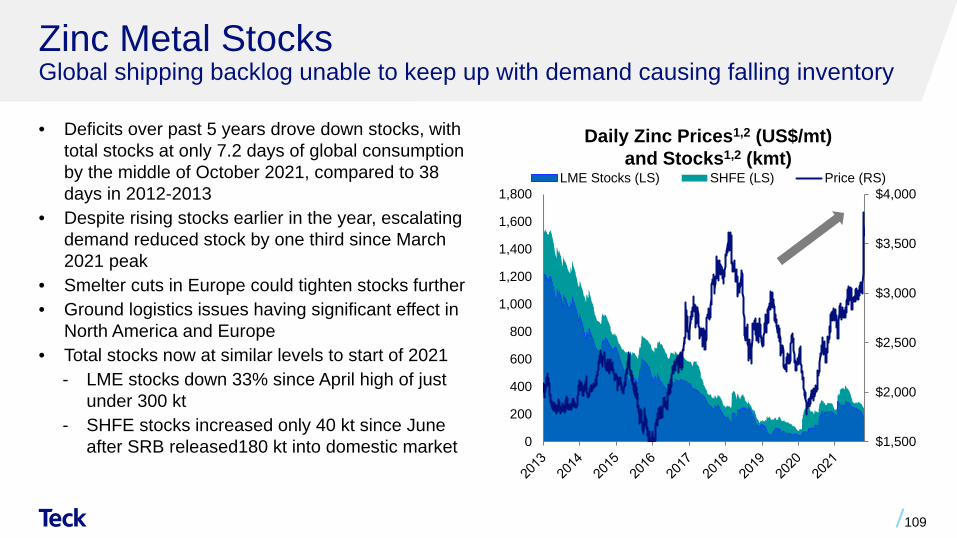
Zinc Metal StocksGlobal shipping backlog unable to keep up with demand causing falling inventory
• Deficits over past 5 years drove down stocks, with total stocks at only 7.2 days of global consumption by the middle of October 2021, compared to 38 days in 2012-2013
• Despite rising stocks earlier in the year, escalating demand reduced stock by one third since March 2021 peak
• Smelter cuts in Europe could tighten stocks further• Ground logistics issues having significant effect in
North America and Europe• Total stocks now at similar levels to start of 2021
- LME stocks down 33% since April high of just under 300 kt
- SHFE stocks increased only 40 kt since June after SRB released180 kt into domestic market
109
Daily Zinc Prices1,2 (US$/mt) and Stocks1,2 (kmt)
$1,500
$2,000
$2,500
$3,000
$3,500
$4,000
0
200
400
600
800
1,000
1,200
1,400
1,600
1,800LME Stocks (LS) SHFE (LS) Price (RS)

Largest Global Net Zinc Mining Companies
Teck is the Largest Net Zinc Miner1(kt)Provides significant exposure to a rising zinc price
110
0
50
100
150
200
250
300
Teck
Public Company
Private Company

Endnotes: Zinc Market
Slide 102: Zinc Outperforms Market Expectations1. China zinc concentrate supply requirements 2016 – 2023 estimates. Source: China NBS/CNIA, BGRIMM, Teck.2. Global Visible Stocks. Source: LME, ICE, SHFE, SMM. To September 30th, 2021.Slide 103: Zinc Market1. Source: Shanghai Metal Market.2. Source: Based on information from the International Zinc Study Group Data.Slide 104: Chinese Zinc Mine and Smelter Production1. Source: Data compiled by Teck based on information from BGRIMM, CNIA, Antaike.2. Source: Data compiled by Teck based on information from BGRIMM, CNIA, Antaike.Slide 105: Global Zinc Mine Production Remains Under Pressure1. Source: Data compiled by Teck based on information from BGRIMM, CNIA, Antaike. Early year estimates from consolidation of several analyst views in the year preceding.2. Source: Data compiled by Teck based on information from BGRIMM, CNIA, Antaike.3. Source: Data compiled by Teck based on information from BGRIMM, CNIA, Antaike., NBS. Slide 106: Zinc Stocks Continue to Decrease Despite Refined Production Increases in China1. Source: Data compiled by Teck Analysis based on information from SHFE, SMM, 2. Source: ”Smelter + consumer stocks” refers to zinc metal held in the plants of smelters and semi producers and those on the road; ”Bonded stocks” refers to zinc stored in bonded zones and will need to complete Customs clearance before
entering China; ”Domestic commercial stocks” refers to zinc stored in SHFE warehouses and other domestic commercial warehouses not registered in SHFE.3. Source: Data compiled by Teck Analysis based on historic numbers from China Customs, and forecasts based on data from BGRIMM, Antaike and Teck’s commercial contacts.Slide 107: Zinc Supply1. Source: Data compiled by Teck based on information from Wood Mackenzie, BGRIMM, CNIA, Antaike and Teck analysis.Slide 108: Zinc Concentrate Treatment Charges1. Source: Wood Mackenzie.Slide 109: Zinc Metal Stocks1. Source: Data compiled by Teck from information from LME, SHFE, SMM.2. Source: Data compiled by Teck from information from LME, Fastmarkets, Argus, Acuity, company reports.
Slide 110: Largest Global Net Zinc Mining Companies1. Source: Data compiled by Teck from information from Wood Mackenzie. Company smelter production netted against company mine production on an equity basis.
111

Steelmaking CoalBusiness Unit

113
• Diversified, long term customer base• Stable long term strip ratio• Long term production run rate of
26-27 million tonnes per annum• Positive social license with a history of
50+ years of continuous operations• Integrated operations and supply chain
with dedicated market access
Tier-One Steelmaking Coal Portfolio
Proven commitment to responsible mining through innovation
Fully Integrated Operating Mines
4Mtpa
Steelmaking Coal Production Capacity
(attributable)
~27
Steelmaking Coal12-year Historical Average
Annual Impairment Adjusted EBITDA Margin1
49%Steelmaking Coal
12-year Historical Average Annual Impairment Adjusted EBITDA1
$2.2B

Steelmaking Coal Operating Strategy
114
Optimized Supply Chain• Improved market access and reliability for customers• Pit to port integration maximizes short and long term Elk Valley synergies
Increase Margins Not Volumes• Strategically replaced high cost tonnes with low cost tonnes –
Elkview Plant Expansion • Leveraging technology to lower unit costs and increase throughput – RACE
Innovation Drives Best in Class Productivity and Asset Utilization• Leaders in haul truck productivity improvement
‒ Record 2020 haul truck productivity• Asset life cycle optimization to minimize capital investment requirements;
Advanced plant & mining analytics
Commitment to Strong Social and Environmental Performance• Improving water quality• Reducing carbon footprint
~800 Mt of reserves2 support long term production run rate of 26-27 million tonnes per annum
Fording River~9.0 Mtpa
20km
Greenhills~4.7 Mtpa
Line Creek~4.0 Mtpa
Elkview~9.0 Mtpa
Elkford
Sparwood
Map and Production Capacity1

Executing on the Elk Valley Water Quality Plan
115
Tripling treatment capacity in 2021 >50 million litres per day; 90 million litres per day by 2025
Active Water Treatment Facilities (AWTF)• Tank based biological treatment process removes
nitrate and transforms selenium into a solid form
Saturated Rock Fill (SRF)• Uses naturally-occurring biological process in old
mining areas that are backfilled with rock and saturated with water
Saturated Rock Fill (SRF)

Cumulative production (Million tonnes)
50 150100 200 250
Optimally Positioned For a Decarbonizing Future
116
• Teck’s premium hard coking coal improves blast furnace efficiency and decreases CO2 emissions per tonne of steel
• Within the lowest carbon performance of the commodity range, assisted by access to low carbon sources of electricity in B.C.
• Evaluating renewable and alternative energy sources and storage capabilities and introducing efficient and emissions-free fleet technology
Steelmaking Coal CO2 Intensity Curve1
(t CO2e/t saleable coal)Will be even more cost competitive
with rising CO2 prices globally
Highest quality HCC leading to amongst the lowest CO2 emissions in steelmaking coal
Teck

1
★
Proven Operator, Managing for Margin And Costs Through Cycles
117
Strong EBITDA1 and EBITDA Margin1 generation potential through all cycles
Low Price EnvironmentCost focus to protect margins and maximize Free Cash Flow1
2013: Cost Reduction Program (CRP) is introduced2013-2016: Operating Excellence drives cost reduction and productivity improvement2020: CRP in response to pandemic disruption
High Price EnvironmentProduction focus to capture high margins and maximize Free Cash Flow1
2016-2019: Historic bull-run focused on maximizing Free Cash Flow1
Q4 2020+: Product and sales strategy to maximize record CFR China prices
2
3
4
3
1
4
2
★
0%
10%
20%
30%
40%
50%
60%
70%
2012 2013 2014 2015 2016 2017 2018 2019 2020 H1-2021
Annual Impairment Adjusted EBITDA
$1.5B
Annual Impairment Adjusted EBITDA
$3.0B
Annual Impairment
Adjusted EBITDA
$0.8B
Steelmaking Coal Impairment Adjusted EBITDA1
& Impairment Adjusted EBITDA Margin1 (%)
2

Top Quartile Margins in Steelmaking Coal
118
Managing our Core Business Drivers to Optimize Margins• Neptune capacity increase and third-party logistics
contracts‒ Lowering port costs, increase logistics chain
flexibility and improved reliability• RACE21TM transformation
‒ Lowering operating costs and increasing EBITDA1
potential• Stable long term strip ratio, maintaining best in class
truck productivity• Strong margins in any market with exceptional cash
generating potential
Strong Cash Flow Generation Potential2Clean Coal
Production per Annum Change
Estimated Effect on Annualized Profit3
Estimated Effect on Annualized EBITDA3
Coal 26 Mt US$50/t C$950M C$1,500M
Steelmaking coal competitively positioned to continue to deliver strong returns
Seaborne Steelmaking Coal Delivered Operating Margin4
Teck Adjusted For Today’s
Premium Pricingto China
BHPTeck

Steelmaking Coal Unit Costs
119
Operating Cost1 Breakdown in 2020
Labour 34%
Contractors and Consultants 13%
Operating Supplies 16%
Repairs and Maintenance Parts 19%
Energy 14%
Other 4%
Total 100%
Transportation 29%
Depreciation and
Amortization 24% Operating Costs
47%
Unit Costs1 in 2020

Sustain Production Capacity and ProductivitiesIn Steelmaking CoalMaintaining historical dollar per tonne sustaining investment levels2010-2016: Average spend of ~$11 per tonne1
• Swift at Fording River and Line Creek• Reinvestment in 5 shovels, 50+ haul trucks
2017-2024: Average spend of ~$11-13 per tonne1
• Plant expansion at Elkview, mine life extension projects and Neptune sustaining investments
• Reinvestment in equipment fleets and infrastructure to increase mining productivity and processing efficiencies
120Sustaining capital is now inclusive of production capacity investments previously called Major Enhancement.
Sustaining Capital, Excluding Water Treatment1 ($/t)
Long term run rate for sustaining capital is ~$11-13 per tonne

121
Significant benefits from moving to a haul truck rebuild strategy, vs. replacing 930E trucks at the end of truck life• Reduces capital spending for new truck purchases• Increases fleet operating hours• Reduces fleet operating costs
Expected to reduce capex by ~$375 million1 over 10 years, with an NPV of ~C$135 million and a payback of ~4.6 years• Components will be replaced at time of rebuild as condition
dictates. There is also additional opportunity to further reduce capex requirements by rebuilding frames
• Assumes cost savings of C$4.5 million per truck, or 47%, based on the cost of a new 930E-5SE truck of C$8.5 million and the cost of an average 930E-4 rebuild of C$4.0 million
Haul Truck Rebuild StrategyPotential to significantly reduce capital costs
Opportunity to extend the program to other vehicles in the fleet

122
Neptune upgrade in site-wide ramp up phase• Ramp up in Q3 2021
• Equipment performing according to, or exceeding, plan
• Starting to see the benefit of lower port costs, with a higher percentage of sales volumes loaded at Neptune
• In Q3 2021:‒ Throughput impacted by B.C. wildfires in July‒ Demonstrated capability to perform at design capacity
during the second half of September
• Expect to achieve a run rate at design capacity of 18.5 million tonnes or higher in Q4 2021
Steelmaking Coal Supply Chain Transformation
Maximizing optionality and reliability to capture strong commodity prices
Photo: Vessel arriving at Neptune Terminal, May 2021.

West Coast Port Capacity
123
• Current capacity 35 Mtpa• Teck contracted capacity:
‒ 2021: 12.55-13.55 Mt, including ~5 Mt in Q1 2021 ‒ From 2022: 5-7 Mtpa at fixed loading charges ‒ Total of 33 Mt over agreement term
WESTSHORE TERMINALS
• Current capacity 18 Mtpa• Teck contract:
‒ January 2021 to December 2027‒ 6 Mtpa available from 2022 ‒ Used as an option for sprint and recovery
RIDLEY TERMINALS
Teck’s Contracted West Coast Port Capacity (Nominal Mt)
Westshore Terminals
Neptune Coal Terminal
Ridley Terminals6
5-7
>18.5
• World class design and equipment for enhanced reliability • Capacity >18.5 Mtpa• Upstream supply chain functioning to plan, supported
by ~$150M infrastructure investment • 100% ownership of coal capacity
NEPTUNE COAL TERMINAL

Endnotes: Steelmaking Coal Business Unit
Slide 113: Tier-One Steelmaking Coal Portfolio 1. The 12-year historical average annual Impairment Adjusted EBITDA and Impairment Adjusted EBITDA Margin are for the 2009 to 2020 period, inclusive. Impairment Adjusted EBITDA and Impairment Adjusted EBITDA Margin are non-GAAP
financial measures. See “Non-GAAP Financial Measures” slides.Slide 114: Steelmaking Coal Operating Strategy1. Metallurgical Clean Coal production capacity from Teck’s 2020 Annual Information Form, shown on an attributable basis to Teck (80% Greenhills). 2. Metallurgical Clean Coal Mineral Reserves from Teck’s 2020 Annual Information Form. Reserves is shown on a mine and property total and is not limited to Teck’s proportionate interest, annual production supported by reserves is shown on an
attributable basis to Teck (80% Greenhills).Slide 116: Optimally Positioned For a Decarbonizing Future1. Source: Skarn Associates, Q2 2021 update to 2020 dataset for global carbon intensity performance of steelmaking coal assets. Includes Scope 1 and 2 emissions. Slide 117: Proven Operator, Managing for Margin and Costs Through Cycles1. Free Cash Flow, EBITDA, Impairment Adjusted EBITDA, EBITDA Margin, Impairment Adjusted EBITDA Margin are non-GAAP financial measures. See “Non-GAAP Financial Measures” slides.2. Annualized.Slide 118: Top Quartile Margins in Steelmaking Coal1. EBITDA is a non-GAAP financial measure. See “Non-GAAP Financial Measures” slides.2. Sensitivities from Teck’s 2020 Annual Report. The sensitivity of our annual profit attributable to shareholders and EBITDA to changes in the Canadian/U.S. dollar exchange rate and commodity prices, before pricing adjustments, based on a 26.0
million tonne production volume estimate, our current balance sheet, current commodity prices and a Canadian/U.S. dollar exchange rate of $1.30. See Teck’s Q4 2020 press release for further details.3. The effect on our profit attributable to shareholders and on EBITDA of commodity price and exchange rate movements will vary from quarter to quarter depending on sales volumes. Our estimate of the sensitivity of profit and EBITDA to changes
in the U.S. dollar exchange rate is sensitive to commodity price assumptions. EBITDA is a non-GAAP financial measure. See “Non-GAAP Financial Measures” slides.4. Source: Teck, Wood Mackenzie Seaborne Metallurgical Coal Cost Curve August 2021. Teck’s total cost includes royalties normalized to Wood Mackenzie’s 2021 FY FOB Australia HCC price assumption of US$130.74 per tonne.Slide 119: Steelmaking Coal Unit Costs1. Steelmaking coal unit costs are reported in Canadian dollars per tonne. Non-GAAP financial measures. See “Non-GAAP Financial Measures” slides.Slide 120: Sustain Production Capacity and Productivities in Steelmaking Coal1. Historical spend has not been adjusted for inflation or foreign exchange. 2021-2025 average spend assumes annualized average production of 27 million tonnes. All dollars referenced are Teck’s portion net of POSCAN credits for Greenhills
Operations at 80% and excludes the portion of sustaining capital relating to water treatment. Sustaining capital is now inclusive of production capacity investments previous called Major Enhancement. Excludes capital leases and growth capital.Slide 121: Haul Truck Rebuild Strategy1. Assumes 83 trucks rebuilt over a ten-year period, an 8% discount rate and a Canadian/U.S. dollar exchange rate of 1.30.
124

Steelmaking CoalMarket

Steelmaking Coal Facts
Global Coal Production1:~7.4 billion tonnesSteelmaking Coal Production2: ~1,130 million tonnesExport Steelmaking Coal2: ~320 million tonnesSeaborne Steelmaking Coal2: ~285 million tonnes
126
• ~0.7 tonnes of steelmaking coal is used to produce each tonne of steel3
• Up to 100 tonnes of steelmaking coal is required to produce the steel in the average wind turbine4
Our market is seaborne hard coking coal2: ~190 million tonnes
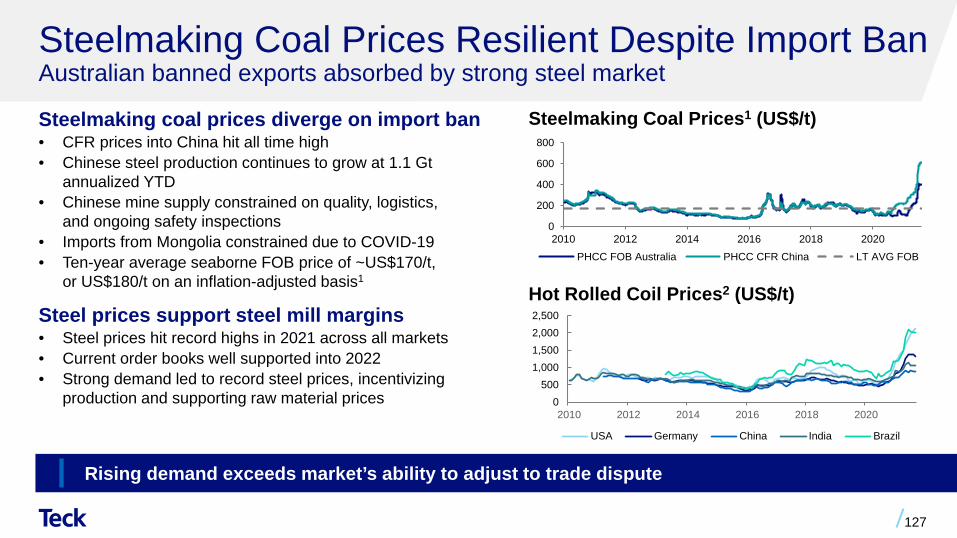
Steelmaking Coal Prices Resilient Despite Import BanAustralian banned exports absorbed by strong steel market
Steelmaking coal prices diverge on import ban• CFR prices into China hit all time high• Chinese steel production continues to grow at 1.1 Gt
annualized YTD• Chinese mine supply constrained on quality, logistics,
and ongoing safety inspections• Imports from Mongolia constrained due to COVID-19• Ten-year average seaborne FOB price of ~US$170/t,
or US$180/t on an inflation-adjusted basis1
Steel prices support steel mill margins• Steel prices hit record highs in 2021 across all markets• Current order books well supported into 2022• Strong demand led to record steel prices, incentivizing
production and supporting raw material prices
127
Rising demand exceeds market’s ability to adjust to trade dispute
Steelmaking Coal Prices1 (US$/t)
Hot Rolled Coil Prices2 (US$/t)
0500
1,0001,5002,0002,500
2010 2012 2014 2016 2018 2020
USA Germany China India Brazil
0
200
400
600
800
2010 2012 2014 2016 2018 2020PHCC FOB Australia PHCC CFR China LT AVG FOB

0
20
40
60
2016 2017 2018 2019 2020 2021E 2022ECanada Russia US Other Australia
Australian Coal Ban Absorbed Displaced Australian coal taken up by ex-China market
Australian HCC finds new homes; market pivots• Australian coal banned; ROW to fill the Chinese gap• Australian exports to China drop to zero from ~34 Mt• Increased demand ex-China & repositioning absorbed
Australian surplus; took market ~6 months to sort out logistics/supply
• No indication of change to import ban into 2022
China remains short steelmaking coal• China relied on increased domestic production, imports from
Mongolia, Canada/USA & others• Mongolia down 36% YTD due to COVID-19 (2021: -10 Mt)• Domestic production up 2% YTD, estimated +9 Mt for 2021• Seaborne imports ex-Australia up 163% YTD, estimated
+20 Mt for 2021• China short ~13–20 Mt this year based on historic imports
and production
128
Teck capitalizing on Chinese market opportunity while maintaining existing contracts
Australian HCC Exports1 (Mt)
China HCC Imports2 (Mt)
28-30 Mt
33 33 3143
0
50
100
2018 2019 2020 Nov/20-Jun/21Annlzd
Others S.America SE Asia Europe JKT India China

Long Term Steelmaking Coal Demand Well SupportedPlanned blast furnace capacity set to grow
129
Financial commitments being made for multi-decade traditional steel making
Asian blast furnace capacity continues to grow• Asia committing to 20+ years of traditional steel making• European steel mills seek alternatives to coal feed• Hydrogen pilot plants only, commercial technology still decades
away and currently prohibitively expensive• Seek alternative carbon abatement in CCS/CCUS
Blast Furnace Capacity2 (Mt)
South-East Asia1India1
0
20
40
60
80
100
120
140
160
180
2021 2025 2030
Myanmar Vietnam Malaysia IndonesiaCambodia Philippines India Exp. India Greenfield

Steelmaking Coal Demand Growth ForecastContinued recovery with majority of banked blast furnaces restarted
Seaborne Steelmaking Coal Imports1 (Mt)Change 2021 vs. 2019
130
Includes:• China: Impact of the ban on Australian coal, domestic
production flat, Mongolian imports down further• Europe/JKT: All banked furnaces restarted
• India: Growing steel production; unchanged long-term fundamentals
• Brazil: Strong domestic demand (residential construction, automotive) and export market
• SE Asia: Economic recovery
320
293
304
7
2
9
135 3 2
17
510
4 22
260
270
280
290
300
310
320
330
2019 China Europe India JKT Brazil SE Asia 2020 China Europe India JKT Brazil SE Asia 2021E

Steelmaking Coal Demand Growth ForecastContinued recovery with majority of banked blast furnaces restarted
131
Includes:• China: Impact of the ban on Australian coal, domestic
production flat, Mongolian imports down further• Europe/JKT: All banked furnaces restarted
• India: Growing steel production; unchanged long-term fundamentals
• Brazil: Strong domestic demand (residential construction, automotive) and export market
• SE Asia: Economic recovery
320
293
304 311
7
29
135 3 2 1 2 1 1 3
17
5 104 22
260
270
280
290
300
310
320
330
Flat
Seaborne Steelmaking Coal Imports1 (Mt)Change 2019 to 2022

Indian Steelmaking Coal ImportsMid- & long-term imports supported by strong demand and government targets
132
Indian Seaborne Coking Coal Imports2 (Mt)Indian Crude Steel Production1 (Mt)
India 2021 crude steel production and seaborne coking coal imports surpassing 2019 levels
0
20
40
60
80
100
120
0
10
20
30
40
50
60

Chinese Steelmaking Coal Imports – Australia Ban 2021 ex-Australia seaborne imports up to new record high of 33Mt
133
Chinese Coking Coal Imports2 (Mt)Chinese Crude Steel Production (CSP), Hot Metal Production (HMP) and Coal Production (Mt)1
China annualized domestic production flat, Mongolia imports down -40%• Annualized CC production down -1 Mt to the end of September; Safety inspections to limit forward growth• Mongolian coking coal imports down -20 Mt vs. 2019… pandemic closes borders reduces imports
2130
16 10 9 13 9 10 13
33
14
30
31
26 2731
28 3135
19
16
15
1324
2628
34 24
14
0
10
20
30
40
50
60
70
80
Ex-Australia Imports Australian Imports Mongolian Imports
0
100
200
300
400
500
600
0
200
400
600
800
1,000
1,200
CSP (LHS) HMP (LHS) Coking Coal Production (RHS)

Chinese Steel MarginsSteel margins moderated but remain very healthy
China Hot Rolled Coil (HRC) Margins and Steelmaking Coal (HCC) Prices1 (US$/t)
134
-100
0
100
200
300
400
500
600
700
Gross HRC profits Argus PHCC CFR China TSI 62% Fe CFR China

0200400600800
10001200
2010 2012 2014 2016 2018 2020 2022 2024
Chinese Scrap Use Remains LowScrap supply limits EAF share in steel output
135
China’s scrap ratio lower than global average of 38%1
(2019)2
Crude Steel
Electric Arc Furnace
Hot Metal
China Steel Use By Sector (2000-2020)3
2025 EAF share forecast to be similar to 20104
83%69%
55%42% 40% 34%
22%
0%20%40%60%80%
100%
Turkey USA EU Russia Korea Japan China
Construction50-60%
Machinery15-20%
Auto5-10%
Others15-25%

Steelmaking Coal Supply Growth ForecastSupply partially recovers; while crude steel production up significantly
Seaborne Steelmaking Coal Exports1 (Mt)Change 2021 vs. 2019
136
• Australia: Production to increase in 2022• USA: YTD Aug exports up 7% on higher CFR prices, but
still down 12% over 2019 on production/logistics issues• Canada: Growth restricted due to wildfires
• Russia: Higher exports possible but railways key to new projects. Spot rail car rates double over last year
• Mozambique: still not at 2019 levels• Indonesia: Production ramps up from new mines
Crude steel production up ~125 Mt over 2019 levels; Steelmaking coal exports down ~10 Mt
314
281289
1 4 27 0 1
1211
5 32 1 6
1
260
270
280
290
300
310
320

Steelmaking Coal Supply Growth ForecastSupply partially recovers; while crude steel production up significantly
137
• Australia: Production to increase in 2022• USA: YTD Aug exports up 7% on higher CFR prices, but
still down 12% over 2019 on production/logistics issues• Canada: Growth restricted due to wildfires
• Russia: Higher exports possible but railways key to new projects. Spot rail car rates double over last year
• Mozambique: still not at 2019 levels• Indonesia: Production ramps up from new mines
Crude steel production up ~125 Mt over 2019 levels; Steelmaking coal exports down ~10 Mt
314
281289
301
1 4 27 0 1 5 1 2 4 1 1 0
12
11
5 32 1 6
1
260
270
280
290
300
310
320
Seaborne Steelmaking Coal Exports1 (Mt)Change 2019 to 2022

Australia and US Steelmaking Coal Exports2021 Australia and US coal exports down vs. 2019
138
US Exports2 (Mt)Australian Exports1 (Mt)
0
10
20
30
40
50
60
70
2000
2001
2002
2003
2004
2005
2006
2007
2008
2009
2010
2011
2012
2013
2014
2015
2016
2017
2018
2019
2020
2021
E
0
20
40
60
80
100
120
140
160
180
200

Canadian & Mozambique Steelmaking Coal Exports2021 Canadian exports impacted by B.C. wildfires
139
Mozambique Exports2 (Mt)Canadian Exports1 (Mt)
0
5
10
15
20
25
30
35
40
0
1
2
3
4
5
6
7
8
9

2nd Largest Seaborne Steelmaking Coal SupplierCompetitively positioned to supply steel producers worldwide
140
CHINA2013: ~30%2017: ~15%2019: ~10%2020: ~15%
INDIA2013: ~5%2017: ~10%2019: ~15%2020: ~15%
Sales Distribution
AMERICAS~5%
EUROPE2013: ~15%2017: ~20%2019: ~15%2020: ~15%
ASIA EXCL. CHINA & INDIA2013: ~40%2017: ~45%2019: ~55%2020: ~50%
Targeting increased sales to China to capture current CFR China price premium

Endnotes: Steelmaking Coal Market
Slide 126: Steelmaking Coal Facts1. Source: IEA.2. Source: Wood Mackenzie (Long Term Outlook H2 2020).3. Source: World Coal Association. Assumes all of the steel required is produced by blast furnace-basic oxygen furnace route.4. Source: The Coal Alliance. Assumes all of the steel required is produced by blast furnace-basic oxygen furnace route.Slide 127: Steelmaking Coal Prices Resilient Despite Import Ban1. Ten-year steelmaking coal prices are calculated from January 1, 2011. Inflation-adjusted prices are based on Statistics Canada’s Consumer Price Index. Source: Argus, Teck. As at September 28th , 2021.2. Ten-year steel hot rolled coil. Source: CRU, Teck. As at September 28th, 2021Slide 128: Australian Coal Ban Absorbed1. Australian hard coking coal exports by market 2018 – 2020 and post ban annualized (November 2020 – June 2021 Actuals) in millions of tonnes. Source: IHS/GTIS, Australian Bureau of Statistics.2. Chinese hard coking coal imports by country of origin 2016 to 2020 with estimates for 2021 based on exports to June/July 2021 annualized. Estimates for 2022 based on currently projected production increases and no change to import ban
observed by market analysts as at September 2021. Source: IHS/GTIS, Teck, Wood Mac, CRU. As at September 15th, 2021Slide 129: Long-Term Steelmaking Coal Demand Well Supported1. Source: Data compiled by Teck based on information from public sources, company announcements.Slide 130: Steelmaking Coal Demand Growth Forecast1. Source: Wood Mackenzie (Short Term Outlook September 2021).Slide 131: Steelmaking Coal Demand Growth Forecast1. Source: Wood Mackenzie (Short Term Outlook September 2021).Slide 132: Indian Steelmaking Coal Imports1. Source: WSA and CRU (Crude Steel Market Outlook August 2021).2. Source: Global Trade Atlas and CRU (Metallurgical Coal Market Outlook August 2021). 2021 are based on information from CRU.Slide 133: Chinese Steelmaking Coal Imports – Australian Ban1. Source: Data compiled by Teck based on information from NBS and Fenwei. 2021 is Q1 annualized for crude steel production and hot metal production and Fenwei estimate for coking coal production.2. Source: Data compiled by Teck based on information from China Customs and Wood Mackenzie (Short Term Outlook September 2021). 2021 is based on information from Wood Mackenzie.Slide 134: Chinese Steel Margins1. Source: China HRC Gross Margins is estimated by Mysteel. China Domestic HCC Price is Liulin #4 price sourced from Sxcoal and is normalized to CFR China equivalent. Seaborne HCC Price (CFR China) is based on Argus Premium HCC
CFR China. Plotted to October 22, 2021. Slide 135: Chinese Scrap Use Remains Low1. Source: Bureau of International Recycling, BIR Global Facts and Figures, 11th Edition.2. Source: Data compiled by Teck based on information from Bureau of International Recycling.3. Source: Data compiled by Teck based on information from China Metallurgy Industry Planning and Research Institute.4. Source: Data compiled by Teck based on information from Wood Mackenzie (Long Term Outlook H2 2021) and CRU (Crude Steel Market Outlook August 2021).
141

Endnotes: Steelmaking Coal Market
Slide 136: Steelmaking Coal Supply Growth Forecast1. Source: Wood Mackenzie (Short Term Outlook September 2021). 2. Source: T. Parker.Slide 137: Steelmaking Coal Supply Growth Forecast1. Source: Wood Mackenzie (Short Term Outlook September 2021). 2. Source: T. Parker.Slide 138: Australia and US Steelmaking Coal Exports1. Source: Global Trade Atlas. 2021E is YTD August annualized. Slide 139: Canadian & Mozambique Steelmaking Coal Exports1. Source: Global Trade Atlas. 2021E is YTD August annualized. 2. Source: Wood Makenzie. 2010-2020 are based on information from Wood Mackenzie (Long Term Outlook H1 2021). 2021 is based on information from Wood Mackenzie (Short Term Outlook September 2021).
142

Steelmaking Coal Resilience

Executive Summary
144
Global steel industry emits 7-10% of total GHG emissions
• Meeting the objective of the Paris Accord will rely on a range of steelmaking abatement technologies
• Together they can reduce steelmaking emissions by more than 80% by 2050
Demand for high-quality seaborne hard coking coal used in blast furnace steelmaking is forecast to remain strong
• Forecast long-term demand for steel is strong in high growth importing regions such as India and South-East Asia where blast furnace steelmaking will dominate
• Teck’s high-quality seaborne steelmaking coal will continue to be a key resource for the low-carbon transition
Steel demand is forecast to remain strong through to 2050
• Steel is not substitutable for most applications
• Steel is required for infrastructure development, including that required to support electrification and decarbonization
Blast furnace CCUS is the only technology capable of decarbonizing steelmaking at the rate and scale required by 2050
• >70% of the world’s steelmaking uses blast furnaces
• Leverages sunk cost of more than US$1 trillion of young blast furnaces, which will last well into the second half of this century
• Blast furnace CCUS is the only technology commercially ready for near-term adoption

Steel is Essential for Economic Growth In a Low-Carbon World
145
World’s largest metal market today
Enables low-carbon energy system
Suited for a circular economy
Essential to lifting global living standards
Steel is widely used and hard to substitute
Growth continues to be driven by decarbonization and ongoing economic development
Fundamental to renewable energy transition and1.5°C target of Paris Accord
Steelmaking coal required while alternatives evolve andcarbon abatement policy advances
Easily recyclable (e.g., without alloy issue of aluminum)
80%+ recycle rate of steel scrap in developed economies2
Middle class expected to grow by 2-3 billion people by 2050,mostly in India and South-East Asia (SEA)
Rural communities are moving to cities, driving infrastructure build
~25%Lower CO2 footprint in steel relative to cement1
>90%Lower CO2 footprint of recycled steel compared to new steel1
~165%Increase in combined annual demand growth for India and SEA3 between 2019 and 2050
1,800
90 25
Steel Aluminum Copper
Global Production in 2019 (Mt)

Steel Demand Is Robust Through 2050 In all IEA Scenarios
1. Integrated steel demand model closely approximating the IEA Sustainable Development Scenario.2. Integrated steel demand model closely approximating the IEA Stated Policies Scenario.
Finished steel demand, billion tonnes
2.0
1.5
0.5
0
1.0
2.5
2030Current 2040 2050
1.82.1 2.1 2.0
Standard Growth scenario – IEA SDS1
▪ Industrialized growth in India and South East Asia
▪ China plateaus until 2030 before converging to Japan/Germany levels
▪ Growth in North America from green infrastructure development
DevelopingIndia
China
Mature
146
Muted Growth scenario▪ China decline to Western European
levels by 2050
Robust Growth scenario – IEA STEPS2
▪ China grows for several more years and then joins developed Asian rate
1.8
2.1
1.9
2.3
1.8
2.4
Billion tonnes

Steelmaking Technologies are Driven by Regional Factors
147
Blast Furnace + CCUSProven technology with favorable economics in regions with young blast furnaces (Asia) and abundant sequestration capacity, deriving the best combination of speed and scale for decarbonization
ScrapCurrently accounts for ~30% of global crude steel production, and while expected to grow, availability will be limited in new growth regions
H2-Direct Reduced Iron (H2-DRI) via EAFExpected to increase with technology development, and favourable in regions with steady scrap supply, access to abundant cheap renewable power and high-grade iron ore pellets, and near end-of-life blast furnaces (e.g., Europe)
Natural Gas Direct Reduced Iron (DRI) + CCUS via Electric Arc Furnace (EAF)Effective where there is low-cost & abundant natural gas (Americas, MENA and parts of Asia) and steady scrap supply

Blast Furnace + CCUS Will Lead Large-Scale Decarbonization Adoption
148
Blast Furnace + CCUS adoption will lead through 20502Blast Furnace + CCUS is adoption ready
Blast Furnace + CCUS is commercially feasible• Leverages >US$1 trillion of young installed blast furnace fleet• Ample global CCUS storage capacity of ~5 trillion tonnes CO2
Proven technology in hard-to-abate industries• CCUS operates in power generation, refining, petrochemicals,
agrichemicals, and steel/iron industry
Accelerators to adoption • Large-scale hub and cluster transportation and storage
infrastructure will support economies of scale
Fastest path to large-scale decarbonization• >75% of global steel is produced through the blast furnace route• Requires moderate CO2 pricing (> US$50/t -$150/t CO2) to be
economic• Cost reductions achieved with generational learning
2019 20502030 2040
NG-DRI + CCUS
100%
Scrap
BF + CCUS
H2-DRI
NG-DRI
BF
1.8 2.0
Total Steel Demand (Bt) – Standard Growth Scenario2.1 2.1

Blast Furnace + CCUS is the Only Technology That Can be Adopted with Speed and Scale
149
Large-scale green hydrogen adoption is unlikely before 2040
To make hydrogen steelmaking cost competitive, ample access to low-cost hydrogen (US$1-2/kg) is required. This implies:
Stable supply of renewable power <US$1.5c/KWh• Significant investment in large-scale renewable infrastructure
development that does not exist today• ~60% lower wind and solar costs
Low-cost, highly-efficient electrolyzers• Decline in electrolyzer capex by ~80%• High-capacity scale-up and utilization rates• Sufficient H2 storage capacity to allow stable and
continuous supply
High-grade iron ore pellet availability• Availability constraints on high-grade iron-ore pellets suitable
for DRI will limit H2-DRI adoption beyond 2030
3.2 2.1 1.4 1.1Levelized Cost of Energy2 – China (US$c/kWh)
Total Cost of Ownership1 (US$/t liquid steel)China (SDS – 1.7o scenario)
Brownfield BF + CCUS
750
800
20302020 2025 2035 2040 2045 20500
400
450
500
550
600
650
700
H2-DRIGreenfield BF + CCUS
CCUS retrofit of brownfield blast furnaces (Brownfield BF + CCUS) remains most competitive
Greenfield H2-Direct Reduced Iron (H2-DRI) becomes more competitive than Greenfield BF + CCUS after ~2040

Despite Robust Steel Demand, Long-Term Demand for Steelmaking Coal Is Expected to Decline…
150
Steelmaking Coal Demand1 (Mtpa) Global demand for non-seaborne hard coking coal is expected to decline by 2050 due to 3 factors:
1. Increased steel scrap availability and recycling in mature regions
2. Declining coke rates due to blast furnace efficiency gains, expected to erode some coking coal demand
3. Ramp up of direct reduced iron (DRI) steelmaking using natural gas and hydrogen, expected to displace some coking coal demand mainly after 2040
191 235 188
629 539
182
Current 2030 2050
Seaborne HCC
Other Steelmaking
Coal2
The magnitude of steelmaking coal demand will ultimately be driven by the pace of decarbonization

…But Long-Term Demand for Seaborne Hard Coking Coal Will Remain Robust
151
• Seaborne HCC demand is expected to remain resilient due to steel demand growth in regions that rely on lower-cost seaborne hard coking coal (HCC) imports (e.g., India and South-East Asia) for blast furnace steelmaking
• Premium hard coking coal such as Teck’s product is expected to be favored as it improves blast furnace efficiency and lowers emissions
Seaborne hard coking coal demand will benefit from strong growth in major importing regions where blast furnace steelmaking will dominate
South-East Asia
Current 2030
India
Developed Asia
2050
China
Rest of World
191
235
188
Seaborne Steelmaking Coal Demand1 (Mtpa)

Blast Furnace Capacity Development is Well Underway in India and South-East Asia
152
Financial commitments being made for multi-decade traditional steel making
0
20
40
60
80
100
120
140
160
180
2021 2025 2030
Myanmar Vietnam Malaysia IndonesiaCambodia Philippines India Exp. India Greenfield
• Asia committing to 20+ years of traditional steel making• European steel mills seek alternatives to coal feed• Hydrogen pilot plants only, commercial technology still
decades away and currently prohibitively expensive• Seek alternative carbon abatement in CCUS
Blast Furnace Capacity2 (Mt)
South-East Asia1India1

Teck’s Hard Coking Coal Is Optimally Positioned For a Decarbonizing Future
153
Highest quality HCC leading to lowest CO2 emissions in steelmaking
Teck’s HCC has amongst lowest Scope 1 and Scope 2 emissions relative to peers
Globally advantaged seaborne logistics and cost position
• Teck’s emissions intensity is within the lowest of the commodity range, assisted by access to low carbon sources of electricity in B.C.
• Teck mines will be even more cost competitive with rising CO2 prices globally
CO2 Coal Intensity Curve1
(t CO2e/t saleable coal)
• Teck premium HCC is amongst the highest quality in the world, benchmarking favorably to premium Australian coking coal on strength and volatility2
• Teck HCC improves blast furnace efficiency and decreases CO2 emissions per tonne of steel
• Proximity to the Pacific Ocean gives direct access to Asia
• By 2050, forecast cost position in the 1st-2nd quartile due to scarce new projects and high-cost for domestic suppliers switching to export
150 30050 200 250100
Simplified 2030 Seaborne HCC Supply Curve3
Cumulative production (Mt)
Teck
0
Cumulative production (Mt)15050 200 250100
Low PhosphorusTeck
FutureHigh
Strength
Low Sulphur
Low Ash

Endnotes: Steelmaking Coal Resilience
Slide 145: Steel is Essential for Economic Growth In a Low-Carbon World1. Source: Teck.2. Source: WSA, IEA.3. India (from ~100 Mt in 2019 to 300 Mt in 2050) and South-East Asia (from ~100 Mt in 2019 to ~230 Mt in 2050) IEA SDS Scenario assumptions on CO2 pricing (~US$0/t CO2 in 2020 to ~US$160\/t in 2050).Slide 146: Steel Demand Is Robust Through 2050 in all IEA Scenarios1. IEA Sustainable Development Scenario (SDS) +1.7C and internal analysis.2. IEA Stated Policies Scenario and internal analysis.Slide 148: Blast Furnace + CCUS Will Lead Large-Scale Decarbonization Adoption1. Global CCUS Institute estimates.2. IEA Sustainable Development Scenario (SDS) +1.7oC.Slide 149: Blast Furnace + CCUS is the Only Technology That can be Adopted with Speed and Scale1. IEA forecast and internal analysis, Sustainable Development Scenario (SDS) +1.7oC.2. LCOE based on Solar PV.Slide 150:Despite Robust Steel Demand, Long-Term Demand for Steelmaking Coal Is Expected to Decline…1. IEA Sustainable Development Scenario (SDS) +1.7oC.2. Comprised of landborne hard coking coal and global semi-soft coking coal.Slide 151: …But Long-Term Demand for Seaborne Hard Coking Coal Will Remain Robust1. IEA Sustainable Development Scenario (SDS) +1.7oC.Slide 152: Blast Furnace Capacity Development is Well Underway in India and South-East Asia1. Announced planned blast furnace expansions and greenfield blast furnaces projects, various company announcements.2. Announced potential blast furnace capacity increases by country. Source: Various Company Announcements, Wood Mackenzie, CRU, Platts, Teck As at September 15, 2021.Slide 153: Teck’s Seaborne Steelmaking Coal Is Optimally Positioned For a Decarbonizing Future1. Source: Skarn Associates, 2019.2. Source: Coking coal peers company filings and presentations.3. 2050 HCC operating cost, including royalty and price differential, $/t, FOB, real 2020$), MineSpans, 2021.
154

EnergyBusiness Unit

Fort Hills Oil Sands MineState of the art oil sands mining facility
156
Capacity200+kbpd
(Dec 2018)
High Ore Quality1(11.4% bitumen grade)
Low GHG Intensity2
Long Life Resource1
(550Mbbls Teck share)

157
• Mining contractors now on site to support ramp-up
• Major water inflows are capped
• Process underway to stabilize and maintain pit wall slope
• Recent operational performance show clear signs of improvements in mine productivity
Focus on transforming Fort Hills into a Best-in-Class1 mineable oil sands asset
Fort Hills Operations UpdateOperational problems being addressed, with continued focus on production ramp-up

Fort Hills Financial OutlookFinancial performance improves once production is stabilized
158
EBITDA3 – Teck’s Share (C$ million)Assumptions
2021 Fort HillsPotential
NYMEX WTI US$67.93 US$75.00
WTI-WCS differential US$13.01 US$12.00
C$/US$ exchange rate 1.24 1.25
Production – barrels/day1 20,045 41,330
Adjusted operating costs2 C$43/bbl C$23/bbl
Improved financial performance expected with stable two-train production
Nameplate Capacity
194,000 bpd1
Adjusted Operating
Costs C$22/bbl
(Dec 2018)2
$-
$100
$200
$300
$400
$500
$600
2021 Fort Hills Potential
Nameplate Capacity
194,000 bpd1
Adjusted Operating
Costs C$23/bbl
(Dec 2018)2
+$560M

Significant EBITDA Upside Potential in EnergyProviding the basis for strong and steady cash flow for decades
159
Potential annual EBITDA of $300 million to $700 million with debottlenecking
WTI @ US$75/BBL
WTI @ US$60/BBL
WTI-WCS differential US$10.75 US$10.75
C$/US$ exchange rate 1.25 1.25
Adjusted operating costs2 C$23/bbl C$23/bbl
EBITDA1 Potential – Teck’s Share (C$ million)Assumptions
• Debottlenecking could add incremental capacity of 20,000 – 40,000 barrels per day
• Regional synergies may provide further opportunities for cost efficiencies and production optimization
$200
$300
$400
$500
$600
$700
$800
$900
194,000 bpd (nameplate)
214,000 bpd (phase 1)
234,000 bpd (phase 2)
EBITDA (@ US$60 WTI) EBITDA (@ US$75 WTI)
+$100M
+$150M

Best In Class Low Carbon Intensity ProductionOur Fort Hills blend can displace carbon intensive crudes
160
• Emissions intensity of Canadian oil sands has declined by 25%; estimated reduction of 15% to 20% by 2030
• PFT bitumen emissions from mining significantly lower than others
• Fort Hills PFT currently the new bar for low emissions
• Fort Hills will displace barrels of crude from higher emitters
Source: Bloomberg, BMO Capital Markets
Total Life Cycle Emissions Intensity (kg CO2e/bbl refined product – gasoline/diesel)
Lower carbon intensity than 50% of the US refined barrels of oil

Endnotes: Energy Business Unit
Slide 156: Fort Hills Oil Sands Mine1. Source: Oil Sands Magazine. https://www.oilsandsmagazine.com/projects/suncor-fort-hills-mine2. Source: Oil Sands Magazine. https://www.canadianenergycentre.ca/this-oil-sands-crude-has-lower-ghg-emissions-than-the-u-s-average/Slide 157: Fort Hills Operations Update1. Best-in-class (BIC) defined as >90% mine and plant availability and a competitive cost structure of <$C23 per barrel.Slide 158: Fort Hills Financial Outlook1. Short-term outlook assumes production at nameplate capacity of 194,000 barrels per day, equating to 41,330 barrels per day for Teck share.2. Short-term outlook assumes Teck’s actual adjusted operating costs of C$22.48 per barrel in December 2018. Adjusted operating costs is a non-GAAP financial measure. See “Non-GAAP Financial Measures” slides. 3. EBITDA is a non-GAAP financial measure. See “Non-GAAP Financial Measures” slides.Slide 159: Significant EBITDA Upside Potential in Energy1. EBITDA is a non-GAAP financial measure. See “Non-GAAP Financial Measures” slides.2. Adjusted operating costs is a non-GAAP financial measure. See “Non-GAAP Financial Measures” slides.Slide 160: Best in Class Low Carbon Intensity Production1. Bitumen production assumes the mid-point of our 2021 production guidance range.
161

Energy Market

Jan-19 Jul-19 Jan-20 Jul-20 Jan-21 Jul-21 -
20
40
60
80
100
Crude Oil Prices Supported by Strong DemandDemand-supply imbalance leading to price recovery
163
Demand returning to pre-COVID-19 levels• Q4 2021 and 2022 annual forecast ~100 Mbpd• Mobility levels improving, including jet travel• Fuel switching adds 500 kbpd to 1.0 Mbpd
Supply restraint – inventory drawdowns• OPEC+: Managed/ratable return to market
‒ 400 kbpd per month• OECD inventories well below five-year average
Canadian differentials steady; Forecast to narrow in the long term on improved pipeline egress • Enbridge Line 3: In-service Q4 2021• TransMountain TMX: In service Q4 2022• US/China/India largest heavy crude importers
Q12021
Q2 Q3 Q4 Q12022
Q2 Q3 Q4 80
90
100
110
Demand Supply
NYMEX WTI
WCS Differential
Benchmark Pricing (US$/bbl)
Global Crude/Liquids Demand/Supply (Mbpd)

Endnotes: Energy Marketing
Slide 162: Crude Oil Prices Supported by Supply Restraints1. Source: Monthly Market Reports published by Energy Aspects, International Energy Agency (IEA), Energy Information Agency (EIA), Organization of Petroleum Exporting Countries (OPEC).2. Source: CME Group, NetEnergy, Shorecan.
164

Non-GAAP Financial Measures

Non-GAAP Financial Measures
166
Our financial results are prepared in accordance with International Financial Reporting Standards (IFRS) as issued by the International Accounting Standards Board. This document refers to a number of Non-GAAP FinancialMeasures which are not measures recognized under IFRS and do not have a standardized meaning prescribed by IFRS or Generally Accepted Accounting Principles (GAAP) in the United States.The Non-GAAP Measures described below do not have standardized meanings under IFRS, may differ from those used by other issuers, and may not be comparable to such measures as reported by others. These measures havebeen derived from our financial statements and applied on a consistent basis as appropriate. We disclose these measures because we believe they assist readers in understanding the results of our operations and financial positionand are meant to provide further information about our financial results to investors. These measures should not be considered in isolation or used in substitute for other measures of performance prepared in accordance with IFRS.Adjusted profit attributable to shareholders – For adjusted profit, we adjust profit attributable to shareholders as reported to remove the after-tax effect of certain types of transactions that reflect measurement changes on our balance sheet or are not indicative of our normal operating activities. We believe adjusted profit helps us and readers better understand the results of our core operating activities and the ongoing cash generating potential of our business.Adjusted basic earnings per share – Adjusted basic earnings per share is adjusted profit divided by average number of shares outstanding in the period.Adjusted diluted earnings per share – Adjusted diluted earnings per share is adjusted profit divided by average number of fully diluted shares in a period.EBITDA – EBITDA is profit before net finance expense, provision for income taxes, and depreciation and amortization.Adjusted EBITDA – Adjusted EBITDA is EBITDA before the pre-tax effect of the adjustments that we make to adjusted profit attributable to shareholders as described above.Impairment adjusted EBITDA - Impairment adjusted EBITDA margin is EBITDA margin after impairments net of impairment reversal.EBITDA margin – EBITDA margin is EBITDA as a percentage of revenue.Impairment adjusted EBITDA margin - Impairment adjusted EBITDA margin is EBITDA margin after impairments net of impairment reversal.
The adjustments described above to profit attributable to shareholders and EBITDA highlight items and allow us and readers to analyze the rest of our results more clearly. We believe that disclosing these measures assists readers in understanding the ongoing cash generating potential of our business in order to provide liquidity to fund working capital needs, service outstanding debt, fund future capital expenditures and investment opportunities, and pay dividends.Gross profit before depreciation and amortization – Gross profit before depreciation and amortization is gross profit with the depreciation and amortization expense added back. We believe this measure assists us and readers to assess our ability to generate cash flow from our business units or operations.Gross profit margins before depreciation – Gross profit margins before depreciation are gross profit before depreciation and amortization, divided by revenue for each respective business unit. We believe this measure assists us and readers to compare margins on a percentage basis among our business units.Unit costs – Unit costs for our steelmaking coal operations are total cost of goods sold, divided by tonnes sold in the period, excluding depreciation and amortization charges. We include this information as it is frequently requested by investors and investment analysts who use it to assess our cost structure and margins and compare it to similar information provided by many companies in the industry.Adjusted site cash cost of sales – Adjusted site cash cost of sales for our steelmaking coal operations is defined as the cost of the product as it leaves the mine excluding depreciation and amortization charges, out-bound transportation costs and any one-time collective agreement charges and inventory write-down provisions.Total cash unit costs – Total cash unit costs for our copper and zinc operations includes adjusted cash costs of sales, as described above, plus the smelter and refining charges added back in determining adjusted revenue. This presentation allows a comparison of total cash unit costs, including smelter charges, to the underlying price of copper or zinc in order to assess the margin for the mine on a per unit basis.Net cash unit costs – Net cash unit costs of principal product, after deducting co-product and by-product margins, are also a common industry measure. By deducting the co- and by-product margin per unit of the principal product, the margin for the mine on a per unit basis may be presented in a single metric for comparison to other operations. Readers should be aware that this metric, by excluding certain items and reclassifying cost and revenue items, distorts our actual production costs as determined under IFRS.

Non-GAAP Financial Measures
167
Adjusted cash cost of sales – Adjusted cash cost of sales for our copper and zinc operations is defined as the cost of the product delivered to the port of shipment, excluding depreciation and amortization charges, any one-time collective agreement charges or inventory write-down provisions and by-product cost of sales. It is common practice in the industry to exclude depreciation and amortization as these costs are non-cash and discounted cash flow valuation models used in the industry substitute expectations of future capital spending for these amounts. Adjusted operating costs – Adjusted operating costs for our energy business unit is defined as the costs of product as it leaves the mine, excluding depreciation and amortization charges, cost of diluent for blending to transport our bitumen by pipeline, cost of non-proprietary product purchased and transportation costs of our product and non-proprietary product and any one-time collective agreement charges or inventory write-down provisions.Cash margins for by-products – Cash margins for by-products is revenue from by- and co-products, less any associated cost of sales of the by and co-product. In addition, for our copper operations, by-product cost of sales also includes cost recoveries associated with our streaming transactions. Adjusted revenue – Adjusted revenue for our copper and zinc operations excludes the revenue from co-products and by-products, but adds back the processing and refining charges to arrive at the value of the underlying payable pounds of copper and zinc. Readers may compare this on a per unit basis with the price of copper and zinc on the LME.
Adjusted revenue for our energy business unit excludes the cost of diluent for blending and non-proprietary product revenues, but adds back crown royalties to arrive at the value of the underlying bitumen.Blended bitumen revenue – Blended bitumen revenue is revenue as reported for our energy business unit, but excludes non-proprietary product revenue, and adds back crown royalties that are deducted from revenue. Blended bitumen price realized – Blended bitumen price realized is blended bitumen revenue divided by blended bitumen barrels sold in the period.Operating netback – Operating netbacks per barrel in our energy business unit are calculated as blended bitumen sales revenue net of diluent expenses (also referred to as bitumen price realized), less crown royalties, transportation and operating expenses divided by barrels of bitumen sold. We include this information as investors and investment analysts use it to measure our profitability on a per barrel basis and compare it to similar information provided by other companies in the oil sands industry.
The debt-related measures outlined below are disclosed as we believe they provide readers with information that allows them to assess our credit capacity and the ability to meet our short and long-term financial obligations.Net debt – Net debt is total debt, less cash and cash equivalents.Debt to debt-plus-equity ratio – debt to debt-plus-equity ratio takes total debt as reported and divides that by the sum of total debt plus total equity, expressed as a percentage.Net debt to net debt-plus-equity ratio – net debt to net debt-plus-equity ratio is net debt divided by the sum of net debt plus total equity, expressed as a percentage.Debt to Adjusted EBITDA ratio – debt to adjusted EBITDA ratio takes total debt as reported and divides that by adjusted EBITDA for the twelve months ended at the reporting period, expressed as the number of times adjusted EBITDA needs to be earned to repay all of the outstanding debt.Net debt to Adjusted EBITDA ratio – net debt to adjusted EBITDA ratio is the same calculation as the debt to adjusted EBITDA ratio, but using net debt as the numerator.Net debt to capitalization ratio – net debt to capitalization ratio is net debt divided by the sum of total debt plus equity attributable to shareholders. The ratio is a financial covenant under our revolving credit facility.

Non-GAAP Financial Measures
168
Reconciliation of Profit (Loss) and Adjusted Profit

Non-GAAP Financial Measures
169
Reconciliation of Basic Earnings (Loss) Per Share to Adjusted Basic Earnings (Loss) Per Share and Reconciliation of Diluted Earnings (Loss) Per Share to Adjusted Diluted Earnings Per Share

Non-GAAP Financial Measures
We include net debt measures as we believe they provide readers with information that allows them to assess our credit capacity and the ability to meet our short and long-term financial obligations, as well as providing a comparison to our peers. 170
Reconciliation of Net Debt to Adjusted EBITDA Ratio

Non-GAAP Financial Measures
171
Reconciliation of EBITDA and Adjusted EBITDAReconciliation of EBITDA by Business Unit
Three months ended September 30, 2021
(CAD$ in millions) Copper ZincSteelmaking
Coal Energy Corporate Total
Profit (loss) before tax $ 296 $ 246 $ 1,009 $ (37) $ (159) $ 1,354
Net finance income (expense) 32 13 27 6 (23) 55
Depreciation 106 81 219 25 - 431
EBITDA $ 434 $ 339 $ 1,255 $ (6) $ (182) $ 1,840

Non-GAAP Financial Measures
172
(C$ in millions)For the 12 Years Ending
December 31, 2020Steelmaking CoalProfit (loss) before taxes $ 15,847Finance expense net of finance income 398Depreciation and amortization 7,808EBITDA $ 24,053Impairments net of impairment reversal 2,114Impairment Adjusted EBITDA (A) $ 26,167Revenue (B) $ 54,047Impairment Adjusted EBITDA Margin (A/B) 48%
Reconciliation of Impairment Adjusted EBITDA and Impairment Adjusted EBITDA Margin

Non-GAAP Financial Measures
173
Reconciliation of Gross Profit Before Depreciation and Amortization and Reconciliation of Gross Profit (Loss) Margins Before Depreciation

Non-GAAP Financial Measures
174
Reconciliation of Gross Profit Before Depreciation & Amortization Margin from Mining Operations (C$ in millions, except where noted)
Year ended December 31, 2017
Year ended December 31, 2018
Year ended December 31, 2019
Year ended December 31, 2020
Six months ended June 30, 2021
Gross profit $ 4,567 $ 4,621 $ 3,340 $ 1,333 $ 1,343Add back: Depreciation and amortization 1,492 1,483 1,619 1,510 748Gross profit before depreciation and amortization $ 6,059 $ 6,104 $ 4,959 $ 2,843 $ 2,091Revenues
Copper $ 4,567 $ 4,621 $ 3,340 $ 1,333 $ 1,343Zinc
Trail 2,266 1,942 1,829 1,761 926Red Dog 1,752 1,696 1,594 1,394 336Pend Oreille 105 98 56 - -Other 8 8 8 9 5Intra-segment revenues (635) (650) (519) (494) (236)
$ 3,496 $ 3,094 $ 2,968 $ 2,700 $ 1,031Steelmaking Coal 6,014 6,349 5,522 3,375 2,159Energy - 407 975 454 327
Total Revenues $ 11,910 $ 12,564 $ 11,934 $ 8,948 $ 5,105Gross profit (loss) before depreciation and amortization
Copper $ 1,154 $ 1,355 $ 1,080 $ 1,242 $ 980Zinc
Trail 209 91 - 65 40Red Dog 971 990 837 717 216Pend Oreille 19 (5) (4) - -Other (26) 9 (2) 33 11Intra-segment revenues - - - - -
$ 1,173 1,085 $ 831 $ 815 $ 267Steelmaking Coal 3,732 3,770 2,904 1,009 869Energy - (106) 144 (223) (25)
Total gross profit (loss) before deprecation and amortization $ 6,059 $ 6,104 $ 4,959 $ 2,843 $ 2,091

Non-GAAP Financial Measures
175
(C$ in millions, except where noted)Year ended
December 31, 2017Year ended
December 31, 2018Year ended
December 31, 2019Year ended
December 31, 2020Six months ended
June 30, 2021Gross profit (loss) margins before depreciation (%)
Copper 48% 50% 44% 51% 62%Zinc
Trail 9% 5% - 4% 4%Red Dog 55% 58% 53% 51% 64%Pend Oreille 18% (5%) (7%) - -Other (325%) 113% (25%) 367% 220%Intra-segment revenues - - - - -
34% 35% 28% 30% 26%Steelmaking Coal 62% 59% 53% 30% 40%Energy - (26%) 15% (49%) (8%)
Zinc Mining AssetsRevenue
Red Dog $ 1,752 $ 1,696 $ 1,594 $ 1,394 $ 336Pend Oreille 105 98 56 - -
$ 1,857 $ 1,794 $ 1,650 $ 1,394 $ 336Gross profit (loss) before depreciation and amortization
Red Dog $ 971 $ 990 $ 837 $ 717 $ 216Pend Oreille 19 (5) (4) - -
$ 990 $ 985 $ 833 $ 717 $ 216Gross profit (loss) margins before deprecation and amortization 53% 55% 50% 51% 64%
Reconciliation of Gross Profit Before Depreciation & Amortization Margin from Mining Operations (cont.)

Non-GAAP Financial Measures
1. Average period exchange rates are used to convert to US$ per pound equivalent.We include unit cost information as it is frequently requested by investors and investment analysts who use it to assess our cost structure and margins and compare it to similar information provided by many companies in our industry. 176
Copper Unit Cost Reconciliation

Non-GAAP Financial Measures
1. Average period exchange rates are used to convert to US$ per pound equivalent.We include unit cost information as it is frequently requested by investors and investment analysts who use it to assess our cost structure and margins and compare it to similar information provided by many companies in our industry. 177
(C$ in millions, except where noted)Three months ended December 31, 2020
Three months ended December 31, 2019
Year ended December 31, 2020
Year ended December 31, 2019
Revenue as reported $ 820 $ 592 $ 2,419 $ 2,469By-product revenue (A) (104) (68) (300) (311)Smelter processing charges (B) 40 38 140 164Adjusted revenue $ 756 $ 562 $ 2,259 $ 2,322Cost of sales as reported $ 452 $ 462 $ 1,560 $ 1,852Less:
Depreciation and amortization (102) (109) (383) (463)Inventory (write-downs) provision reversal - (20) - (24)Labour settlement and strike costs - (22) - (35)By-product cost of sales (C) (29) (19) (71) (58)
Adjusted cash cost of sales (D) $ 321 $ 292 $ 1,106 $ 1,272Payable pounds sold (millions) (E) 172.7 158.5 591.7 641.7Per unit amounts (C$/lb)
Adjusted cash cost of sales (D/E) $ 1.86 $ 1.84 $ 1.87 $ 1.98Smelter processing charges (B/E) 0.23 0.24 0.23 0.26
Total cash unit costs (C$/lb) $ 2.09 $ 2.08 $ 2.10 $ 2.24Cash margin for by-products (C$/lb) ((A-C)/E) (0.43) (0.31) (0.39) (0.39)Net cash unit costs (C$/lb) $ 1.66 $ 1.77 $ 1.71 $ 1.85US$ AMOUNTS1
Average exchange rate (C$/US$) $ 1.30 $ 1.32 $ 1.34 $ 1.33Per unit amounts (US$/lb)
Adjusted cash cost of sales $ 1.42 $ 1.40 $ 1.39 $ 1.49Smelter processing charges 0.18 0.18 0.18 0.19
Total cash unit costs (US$/lb) $ 1.60 $ 1.58 $ 1.57 $ 1.68Cash margin for by-products (US$/lb) (0.33) (0.24) (0.29) (0.29)Net cash unit costs (US$/lb) $ 1.27 $ 1.34 $ 1.28 $ 1.39
Copper Unit Cost Reconciliation

Non-GAAP Financial Measures
178
1. Red Dog mining operations.2. Average period exchange rates are used to convert to US$ per tonne equivalent.We include unit cost information as it is frequently requested by investors and investment analysts who use it to assess our cost structure and margins and compare it to similar information provided by many companies in our industry.
Zinc Unit Cost Reconciliation (Mining Operations)

Non-GAAP Financial Measures
1. Average period exchange rates are used to convert to US$ per tonne equivalent.We include unit cost information as it is frequently requested by investors and investment analysts who use it to assess our cost structure and margins and compare it to similar information provided by many companies in our industry. 179
Steelmaking Coal Unit Cost Reconciliation

Non-GAAP Financial Measures
1. Calculated per unit amounts may differ due to rounding.2. Bitumen price realized represents the realized petroleum revenue (blended bitumen sales revenue) net of diluent expense, expressed on a per barrel
basis. Blended bitumen sales revenue represents revenue from our share of the heavy crude oil blend known as Fort Hills Reduced Carbon Life CycleDilbit Blend (FRB), sold at the Hardisty and U.S. Gulf Coast market hubs. FRB is comprised of bitumen produced from Fort Hills blended with purchaseddiluent. The cost of blending is affected by the amount of diluent required and the cost of purchasing, transporting and blending the diluent. A portion ofdiluent expense is effectively recovered in the sales price of the blended product. Diluent expense is also affected by Canadian and U.S. benchmarkpricing and changes in the value of the Canadian dollar relative to the U.S. dollar. 180
Energy Operating Netback, Bitumen & Blended Bitumen Price Realized Reconciliations andAdjusted Operating Costs and Adjusted Operating Costs1

Non-GAAP Financial Measures
3. Reflects adjustments for costs not directly attributed to the production of Fort Hills bitumen, including transportation for non-proprietary product purchased.We include unit cost information as it is frequently requested by investors and investment analysts who use it to assess our cost structure and margins and compare it to similar information provided by many companies in our industry. 181
Energy Operating Netback, Bitumen & Blended Bitumen Price Realized Reconciliations andAdjusted Operating Costs and Adjusted Operating Costs1

Non-GAAP Financial Measures
182
(C$ in millions) 2003 to Q3 2021Cash Flow from Operations $ 40,790Debt interest paid (6,130)Capital expenditures, including capitalized stripping costs (32,038)Payments to non-controlling interests (NCI) (608)Free Cash Flow $ 12,014Dividends paid $ 4,567Payout ratio 38%
Reconciliation of Free Cash Flow

Global Natural Resources Conference
November 10, 2021