global ocean protection - international union for ... · pdf fileglobal ocean protection:...
TRANSCRIPT

Global Ocean ProtectionPresent Status and Future Possibilities
Editors:Caitlyn Toropova, Imèn Meliane, Dan Laffoley, Elizabeth Matthews and Mark Spalding

Global Ocean ProtectionPresent Status and Future Possibilities
Editors:Caitlyn Toropova, Imèn Meliane, Dan Laffoley, Elizabeth Matthews and Mark Spalding
The designation of geographical entities and the presentation of the material do not imply the expression of any opinion whatsoever on the part of IUCN, The Nature Conservancy, UNEP, United Nations University - Institute of Advanced Studies, l’Agence des aires marines protégées, Wildlife Conservation Society or other contributory organisations concerning the legal status of any country, territory, city, company or area or its authority, or concerning the delimitation of its frontiers or boundaries.
The views expressed in this report are those of the authors and do not necessarily reflect the views or policies of IUCN, The Nature Conservancy, UNEP, United Nations University - Institute of Advanced Studies, l’Agence des aires marines protégées, Wildlife Conservation Society, or other contributory organisations.
This publication has been made possible in part by funding from The Nature Conservancy, l’Agence des aires marines protégées and Wildlife Conservation Society. Support for the analysis described in Chapter 3 was provided through the 2010 Biodiversity Indicators Partnership (www.twentyten.net), a GEF-funded initiative providing information on biodiversity trends and global progress towards the CBD 2010 Target.
Published by: IUCN, Gland, Switzerland, The Nature Conservancy, Arlington, USA, UNEP-WCMC, Cam-bridge, UK, UNEP, Nairobi, Kenya, UNU-IAS, Tokyo, Japan, Agence des aires marines proté-gées, Brest, France
Copyright: © 2010 International Union for Conservation of Nature and Natural Resources
Reproduction of this publication for educational or other non-commercial purposes is au-thorized without prior written permission from the copyright holder provided the source is fully acknowledged.
Reproduction of this publication for resale or other commercial purposes is prohibited without prior written permission of the copyright holder.
Citation: Toropova, C., Meliane, I., Laffoley, D., Matthews, E. and Spalding, M. (eds.) (2010). Global Ocean Protection: Present Status and Future Possibilities. Brest, France: Agence des aires marines protégées, Gland, Switzerland, Washington, DC and New York, USA: IUCN WCPA, Cambridge, UK : UNEP-WCMC, Arlington, USA: TNC, Tokyo, Japan: UNU, New York, USA: WCS. 96pp.
For individual chapters: Lead Authors. (2010). ‘Title of the chapter’. In C. Toropova, I. Me-liane, D. Laffoley, E. Matthews and M. Spalding (eds.) Global Ocean Protection: Present Status and Future Possibilities. Brest, France: Agence des aires marines protégées, Gland, Switzerland, Washington, DC and New York, USA: IUCN WCPA, Cambridge, UK : UNEP-WC-MC, Arlington, USA: TNC, Tokyo, Japan: UNU, New York, USA: WCS 96pp.
ISBN: 978-2-8317-1311-3
Designed by: Georgios Sarantakos, IUCN
Cover photos: Upper left: © Mark Godfrey, TNC; Upper middle: © Mito Paz; Upper right: © Louise GogginLower left: © Gerick Bergsma; Lower middle: © Jerker Tamelander, IUCN; Lower right: © Louise Goggin
Printed by: Linemark Printing, Inc. an EPA Green Partner

Emanuel (Manny) Mori
President
Federated States of Micronesia
Preface Small island cultures, like ours in Micronesia, have been shaped by our
surrounding oceans. Indeed, we would not know who we are, or what will
become of us, without sustenance from our marine resources. Today, more
than ever, greater and more innovative effort must be made to protect and
maintain our biodiversity and ecosystem structure, functions and processes,
as anthropogenic and natural threats continue to escalate. Equally important
is increased and more effective effort to ensure that the benefits derived from
these resources are equitably distributed among all users. With climate change
currently identified as the greatest threat to biodiversity, there may be an
inclination to neglect community-based marine protected areas, as more focus
shifts towards a global system of protected areas, and while we certainly need
to do this, we also cannot afford to forget or abandon the small-scale marine
protected areas, because they are the foundation and starting point of any larger
marine protected areas.
Without effective protected areas at the village or community level, there can never be a successful global protected areas
system. Therefore, much effort and attention is still required at the local level, not only to provide assistance towards
their success, but to also receive valuable lessons from them towards a successful global system of protected areas. For
example, customary marine tenure, which has been practiced over centuries, tried and tested by islanders, must hold
some of the answers and ‘innovative’ solutions we seek today towards our vision of a global system of protected areas.
The use of protected areas to facilitate the maintenance and recovery of biological resources has been practiced by
Pacific island communities for centuries in accordance with customary practices and spiritual beliefs. Such concepts of
ecosystem approach, adaptive management and marine protected areas are generally perceived to be relatively recent
developments of Western origin, when in fact, they have been in practice in our small islands in Micronesia, as well as
the rest of the Pacific Island countries, for over a millennium. Due to colonization, western influence and globalization,
we have adopted new ways of using our marine protected areas (MPAs), exploring various forms of management and
collaboration at the local level, the national level and even at the regional level.
At present, we have a wide range of MPA systems throughout the Pacific Islands, including those managed by communities,
by local and national governments, as well as various types of co-management in between. However, in the Federated
States of Micronesia, our traditional marine management system, based on our customs via our traditional chiefs,
cultural beliefs and values remains one of our best marine management tools simply because it has proven to work and
continues to be culturally appropriate for us. Without a doubt, in my country, in other Micronesian countries, and even
many island nations across the globe, customary marine tenure and community-based management systems remain one
of our most important approaches we use to protect our biodiversity, our livelihood and our future.
Micronesia has implemented efforts to establish nation-wide protected areas networks (PANs) and has initiated a
regional collaborative effort, the Micronesia Challenge initiative, to further drive our individual and collective efforts in
marine biodiversity conservation. The Micronesia Challenge (MC) is fully described in this publication and we are proud
to be seen as a leader and innovator in marine protection.
This publication provides a much needed and timely tool to assist us in our collective effort to find new and better
solutions to address the various threats to our marine biological diversity and productivity. It provides evidence-based
recommendations on improving and accelerating actions on delivering ocean protection and management through
marine protected areas and facilitates the sharing of experiences and lessons learned.

ContentsPreface 3
Executive Summary 7
Chapter 1 9
Introduction 9
Chapter 2 11
Benefits and Challenges of MPA Strategies 11
Context and Definitions 12
Management Regimes 14
Benefits of MPAs 17
MPA Costs 21
Complementarities with Other Management Tools 21
MPAs: From the Concept to the Target 23
Chapter 3 25
The 10% Target: Where Do We stand? 25
Introduction 26
Methods 27
Results 28
Discussion 32
Conclusions 36
Moving Beyond the CBD targets 38
Chapter 4 41
Meeting Global Goals at Regional Scales and in the High Seas 41
Introduction 42
Wider Caribbean: Building Networks Through Regional Agreements 43
East Asia: How Groups are Working Together Across a Vast Ocean Area 45
The Mediterranean: Building a Regional Picture Combining Knowledge from Disparate Sources 46
West Africa: High Level Government Collaboration 48
The United States: Building a Systematic Network With a Scientific Base 50
The South Pacific: Local Uptake at a Regional Scale 52
Advancing Conservation of the Open Oceans and Deep Seas Within and Beyond National Jurisdiction 54

Chapter 5 61
Climate Change – A Challenge and an Opportunity 61
Introduction 62
Climate Change Impacts, Ocean Acidification, and MPAs 62
MPAs and MPA Networks as Tools for Ecosystem-Based Adaptation to Climate Change 63
Creating Climate Resilient MPA Networks 64
The Additional Value of MPAs for Carbon Sequestration 65
Implications for MPA Network Design and Management 67
Conclusions 67
Resilience Management Resources 68
Chapter 6 69
Moving Forward Towards Networks and Broader Spatial Management 69
Introduction 70
Improving MPA Effectiveness 71
Moving from Isolated MPAs to MPA Systems or Networks 72
Scaling Up – Regional Approaches to Fostering Political Will, Sustainable Fi-nance, Capacity and Accountability 73
Incorporating MPAs into Broader Spatial (Multi-Objective) Seascape Manage-ment 77
Chapter 7 83
Conclusions and Recommendations 83
Building Broader Context for Ocean Protection 83
Accelerating Efforts to Establish MPA Networks: Addressing Gaps and Selecting the Right Places 84
Improving Management Effectiveness 85
Addressing Climate Change 86
Increasing Cooperation and Protection at Scale 87
The Right Targets and Indicators 88
Acknowledgments and References 89


Executive Summary
The important commitments made by the international community at the 2002 World Summit on Sustainable Development and the Convention on Biological Diversity to put in place ecologically representative and effectively managed networks of MPAs by 2012 and to effectively conserve at least 10% of each of the world’s marine and coastal ecological regions have sparked important efforts towards ocean conservation.
The total ocean area protected has risen by over 150% since 2003. The total number of MPAs now stands at approximately 5880, covering over 4.2 million km2 of ocean. This figure equates to only 1.17% of the marine area of the world, but the focus remains largely on continental shelf areas where MPA coverage is some 4.32%. Off-shelf protection stands at just 0.91%. Although it is not possible to develop an exact account, fully protected, no-take areas cover only a small portion of MPA coverage, while a large proportion of MPAs are ineffective or only partially effective.
Rather than ecologically representative, MPA coverage is very uneven and does not adequately represent all ecoregions and habitats important for conservation. In addition to the almost universal lack of MPA coverage in offshore waters, there are major gaps in protection of coastal and continental shelf waters, particularly in temperate regions. Some 44 coastal ecoregions have more than 10% MPA coverage but 102 (44%) have a coverage of less than 1%.
One clear trend in the recent growth of marine protection has been the designation of very large MPAs – 11 MPAs are larger than 100,000km2 and together these make up over 60% of the global coverage. While such sites are to be welcomed, their overall influence on statistics masks a disproportionate lack of protection in some areas, notably in areas where human population densities are high and pressures may be more intense.
From a political perspective, almost all MPAs are located within areas of national jurisdiction and when the high seas are excluded, MPA coverage stands at some 2.88% (of areas within 200nm of the coastline). Only 12 of 190 States and territories have MPA coverage at or above 10%.
In addition to national efforts, we are witnessing an increase of regional approaches for marine protected areas networks across entire regions and seas. This is fostering collaborative management and partnerships among multiple sectors and stakeholders. Aligning data, effective communication and efficient stakeholder and community engagement are essential for success.
The last few years have also helped advance global tools and efforts for the conservation and management of open oceans and deep seas, in particular in areas beyond national jurisdiction. A biogeographic classification system of open oceans and deep seabed, including criteria for selecting biologically and ecologically significant areas, provides a scientific and technical basis for conserving marine areas beyond the limits of national jurisdiction. Though various regional and sectoral conventions and instruments are increasing efforts to conserve marine biodiversity in open oceans and deep seas, there is an urgent need for further institutional improvements, cooperative mechanisms and agreements on common principles and goals for spatial management of human activities in areas beyond national jurisdiction.
Over the last few years, climate change has become more dominant on the environmental agenda. Today we know that climate change is already affecting the ocean in many different ways and the scale and extent will continue to increase as effects take hold. By protecting important habitats and ecosystem functions, such as coastal carbon sinks, MPAs provide the foundation for ecosystem-based mitigation and adaptation strategies. Important changes in the way that MPAs are designed, managed, and governed are needed now more than ever to help assure that key components of marine ecosystems are resilient in the face of climate change.
Looking ahead at the coming decades, the combination of acute climate change impacts and a growing world population are adding ever increasing pressures on, and competition for, coastal and marine resources. To ensure that the coastal and marine capital is sustainably managed to continue to provide for the needs of the present and future generations, the ocean conservation agenda needs to shift to integrate marine management at ecologically meaningful scales. We are witnessing visionary leaders banding together to create large-scale initiatives like the Micronesia and Caribbean Challenges and the Coral Triangle Initiative with bold aspirations that explicitly link ocean protection to the well-being of their people and the development and prosperity of their nations. Moving forward globally, we need to secure greater political will, increased human and financial capacity and improved governance and engagement with ocean stakeholders.
Marine protected areas remain a strong foundation to address ocean challenges. However, they cannot be a panacea to the heavy pressures on the coasts and oceans. For them to achieve their objectives, they need to be designed and managed effectively, taking into considerations the socio-economic needs of their surrounding communities. They also need to be part of an effective broader framework that addresses management across all sectors. Policies, planning and management have to be expanded to look beyond MPAs, to consider biodiversity conservation and management needs across the entire ocean space, within and beyond national jurisdictions.
Marine spatial planning is emerging as one of the most promising tools for creating an ecosystem-based management (EBM) approach and ensuring that coasts and oceans are managed to meet current and future demands on ocean resources. It focuses on the most concrete aspects of EBM – area-based planning and management – and addresses multiple human uses, their cumulative impacts and interactive effects.
The inevitable conclusion is that the CBD target for achieving effective conservation of 10% of marine ecological regions will not be met in time. There still remains much progress to be made for the development of comprehensive, effectively managed, and ecologically representative national and regional systems of protected areas by 2012. As the global community is charting a new course to reduce biodiversity loss while achieving development goals and greener economies, we offer specific recommendations to strengthen the MPA foundation and move towards multi-objective integrated planning and management frameworks that embed MPAs and conservation objectives within a wider context and integrate ecological, economic and social needs.
7

Mangrove in Aldabra Atoll lagoon, Seychelles © J Tamelander / IUCN

The world’s oceans and coasts are crucially important to
humankind; the goods and services they provide have underpinned
human activity for more than a millennium (Roberts 2007). Oceans
and coasts host some of the most productive ecosystems on
earth, providing food and livelihoods to millions of dependent
local communities, sustaining local and national economies, and
supporting cultural services to human communities. They also are
the largest carbon sink on the planet. Ocean services were once
believed to be infinite. However, the past decades have proved
that marine ecosystems and resources are limited, vulnerable and
becoming increasingly degraded.
As early as the late 19th century, there were many local examples of
fisheries collapse and estuarine and coastal degradation (Roberts
2007). Over the last century, the degradation and overexploitation
of the coastal and marine ecosystem and resources has continued
and intensified. Today oceans and coasts are among the most
threatened ecosystems of the world (Millennium Ecosystem
Assessment 2005. Halpern et al. (2008) analysed the current extent of human impacts on marine ecosystems, and showed that no area of the oceans is unaffected by human influence and that 41% of the ocean is strongly affected by multiple drivers, with the highest impacts concentrated closer to shores.
The 1970s marked an era of recognition that management of marine resources and habitats was insufficient which led to a growing interest in approaches to ensure the continuing viability of marine ecosystems. In 1975, the first international conference on Marine Parks and Reserves was hosted by IUCN in Tokyo, Japan. The report of that conference noted increasing pressures upon marine environments and called for the establishment of a well-
monitored system of marine protected areas representative of
the world’s marine ecosystems. Marine protected areas (MPAs) have been proposed as an integral component of broader marine and coastal zone management schemes, with establishment of
networks of MPAs as a means to improve the overall governance
of the ocean. Marine areas were again in the spotlight at the 1988 IUCN General Assembly that called on governments to seek cooperative action between the public and all levels of government
for development of a national system of marine protected areas as
an integral component of marine conservation and management (IUCN 1988).
As our understanding of the many and synergistic impacts of human activities on marine biodiversity and resources increases,
so does the need for more innovative and integrated approaches to ocean management. Indeed, management approaches for the marine and coastal environment are rapidly evolving, including the theoretical guidance and practical advice for effective
implementation and management of MPAs. MPAs have been used
increasingly over the last century, and they remain a fundamental tool that is widely recognized as one of the most pragmatic and effective means for achieving ecosystem-level conservation,
protecting marine biodiversity and sustaining local human
communities. MPAs and MPA networks that recognize and display connectivity are increasingly being used to respond to some of the
key threats and pressures on the marine and coastal environment
and resources. They are able to fulfil both broader conservation goals and fisheries management objectives, as well as providing a
foundation for delivering ecosystem-based management (Agardy
& Staub 2006; Compass 2004; IUCN-WCPA 2008; Mora et al. 2006;
Parks et al. 2006).
Still, the already high pressures on coastal and marine resources are
anticipated to continue to increase, and with them the continued
concern of the international community. The World Summit
on Sustainable Development (WSSD) held in Johannesburg,
South Africa in 2002 once again put ocean conservation high on
governments’ agenda. Through the WSSD plan of implementation,
governments committed to improving ocean conservation and
management through actions at all levels, giving due regard to the
relevant international instruments. Particularly, they committed
to:
“Develop and facilitate the use of diverse approaches and tools,
including the ecosystem approach, the elimination of destructive
fishing practices, the establishment of marine protected areas
consistent with international law and based on scientific information, including representative networks by 2012 and time/area closures for the protection of nursery grounds and periods, proper coastal land use and watershed planning and the integration of marine and coastal areas management into key sectors.”(Para 31.c of the WSSD Plan of implementation)
By setting a time-specific target to establish representative networks of MPAs, governments have put a particular spotlight on MPAs as an important tool for achieving marine conservation and management. In addition to the 2012 MPA target, governments made other important and time-bound ocean-related commitments at WSSD, these include: “encourage application of the ecosystem
approach to fisheries and ocean management by 2010”; “maintain
the productivity and biodiversity of important and vulnerable marine and coastal areas, including in areas within and beyond national jurisdiction”; “and maintain or restore depleted fish stocks
to levels that can produce the maximum sustainable yield with the
aim of achieving these goals for depleted stocks on an urgent basis and where possible not later than 2015”.
A few months prior to WSSD, the Parties to the Convention
on Biological Diversity (CBD) adopted a strategic plan of the
Convention that contained a global target to “achieve by 2010 a significant reduction in the current rate of biodiversity loss at the global, regional and national level as a contribution to poverty
alleviation and to the benefit of all life on Earth.” The following CBD
Conference of the Parties (COP), decided to develop a framework to enhance the evaluation of achievements and progress in the implementation of the Strategic Plan and, in particular, to establish
goals, sub-targets and indicators for each of the focal areas of the
convention. The same COP adopted a new programme of work on Protected Areas (POWPA) and a revised programme of work on marine and coastal biodiversity, and both programmes reinforced
the WSSD outcomes.
In particular, the POWPA included a series of targets including the
following “By 2010 terrestrially and 2012 in the marine area, a global network of comprehensive, representative and effectively
managed national and regional protected area system is established
as a contribution to (i) the goal of the Strategic Plan of the
Chapter 1Introduction
9

Convention and the World Summit on Sustainable Development of
achieving a significant reduction in the rate of biodiversity loss by
2010; (ii) the Millennium Development Goals - particularly goal 7 on
ensuring environmental sustainability; and (iii) the Global Strategy
for Plant Conservation.” Also, through their decision on marine
and coastal biodiversity, Parties agreed that the overarching goal
for work under the Convention relating to marine (and coastal)
protected areas should be establishing and maintaining “effectively
managed and ecologically based MPAs that built upon national
and regional systems in contribution to a global MPA network and
the WSSD approach”. The decision states that such MPAs should
include a range of levels of protection, where human activities are
managed, and be delivered through regional programs and policies
and international agreements, in order to maintain the structure
and functioning of the full range of marine and coastal ecosystems
and provide benefits for both present and future generations.
In 2006, COP 8 further refined the biodiversity target by adopting
a number of biome-specific sub-targets, some of which relate to
effective conservation of marine and coastal areas. Specifically,
these focused on the agreement that ‘at least 10% of each of
the world’s ecological regions [should be] effectively conserved’
(target 1.1), and that ‘areas of particular importance to biodiversity
[should be] protected’ (target 1.2). Connections between these
various targets and sub-targets and their deadlines often get confusing. In general, there’s a widespread interpretation that the MPA target (under both WSSD and CBD) is to achieve 10% coverage of ecologically representative and effectively managed MPAs by 2012. Furthermore, protected areas coverage was selected as a specific indicator to evaluate progress towards the implementation of the CBD targets, and 2010 goal.
Eight years after the initial 2002 commitments, in a year where Parties to the CBD are revising the strategic plan of the convention, and where the global community is also preparing for the upcoming
UN conference on sustainable Development in 2012 (Rio+20), the
immediate questions that many are asking is “how are we doing
at meeting the 2010/2012 targets?”, “what have we learned from
the implementation of these targets?”, and “what other additional
actions are needed to improve ocean conservation?”.
This report is not intended to provide a comprehensive review
of ocean conservation and management tools or even of marine
protected areas – current knowledge simply does not allow such
assessment. However, it provides an overview of the different types
of marine protected areas and other area-based management
measures and the benefits they provide. The report particularly
focuses on examining and analysing a commonly agreed global
indicator- global MPA coverage - looking both at the jurisdictional
and the biogeographic coverage and identifies areas where more
progress may be needed, what efforts have been particularly
successful, and that may be useful models for replication at larger
scales elsewhere in the world. Based on achievements to date,
the report highlights national and regional experiences that have
successfully established marine protected areas and networks.
It also identifies some emerging new directions and approaches
that hold promise in addressing some of the major impediments
to scaling up conservation efforts and averting the continued
degradation of the marine environment and associated loss of
ecosystem services. In particular, we examine multi-objective planning tools that have been used to address the cumulative impacts of ocean threats and to reconcile conservation and development needs.
Lastly, the report provides reflections on some of the trends observed through the implementation of the targets, as well as broader considerations that need to be better articulated as the global community accelerates its efforts to achieve effective conservation of the oceans.
Sperm whale off Kaikoura peninsula, New Zealand ©Imèn Meliane
Chapter 110
Chapter 2Benefits and Challenges of MPA Strategies
Lead Authors: Caitlyn Toropova, Richard Kenchington, Marjo Vierros and Imèn Meliane
Contributing Authors: Nigel Dudley, Isabelle M. Côté, Kim Wright, and Suzanne Garrett
Key Messages:
Marine protected areas have been considered and promoted as an important and interactive tool to achieve effective ocean conservation, nested in a broader framework of integrated management.
There are various management categories of MPAs ranging from strict protection to management for sustainable use, all have an important role, both in conservation and in maintaining critical ecosystem services.
MPA benefits go beyond biodiveristy conservation, and contribute to social and economic aspects for local communities and economies.
Stewardship of marine and coastal resources by indigenous peoples and local communities should be encouraged.

Chapter 2
Context and Definitions
During the 1950s and early 1960s, as coastal and marine ecosystems
marine environments and resources became more stressing. The
of integrated marine resources and environmental management, and
in 1972.
Marine protected areas (MPAs) have been considered and promoted
management.
Our Common Future (WCED 1987) have both highlighted the need
for an integrated strategy for managing oceans and coasts. This
comprehensive strategy was further enhanced when it adopted a
the high degree of linkage between marine environments and their
use, understanding and enjoyment of the marine heritage of the world
marine protected areas and through the management, in accordance
IUCN and its World Commission on Protected Areas have played a key
of marine protected areas have been produced, the most used and
cited being Kelleher and Kenchington (1992) and Kelleher (1999),
marine life, and that the establishment of an MPA should be integrated
with other policies for use of land and sea.
In another important IUCN guide for MPA planning and management,
Salm et al. (2000), clearly state that ‘coastal ecosystems include
both land and water components and that they should be managed
together is considered fundamental’. And that ‘the management
programmes of management which seek to deal comprehensively
with powers to control development impacts.’
12
Year or
Period
Activity or Event Significance for MPAs
Historical and pre-history
The closing of fishing or crabbing areas by island communities for con-servation for example, because the chief felt the area had been over-
fished or in order to preserve the area as a breeding ground for fish to
supply the surrounding reefs
Established the concept of protecting areas critical to sustainable har-
vesting of marine organisms
1950s and 1960s
Decline in catch or effort ratios in various fisheries around the world At the global level, the need to devise methods to manage and protect marine environments and resources became strongly apparent
1958
Four conventions, known as the Geneva Conventions on the Law of the
Sea were adopted. These were the Convention on the Continental Shelf the Convention on the High Seas, the Convention on Fishing, and the Convention on Conservation of the Living Resources of the High Seas
Established an international framework for protection of living marine resources
1962The First World Conference on National Parks considered the need for
protection of coastal and marine areas
Development of the concept of protecting specific areas and habitats
1971The Convention on Wetlands of International Importance Especially as Waterfowl Habitat (known as the Ramsar Convention) was developed
Provided a specific basis for nations to establish MPAs to protect wet-lands
1972Convention for the Protection of the World Cultural and Natural Herit-
age (known as the World Heritage Convention) was developed
Provided a regime for protecting marine (and terrestrial) areas of glo-
bal importance
1972
The Governing Council of the United Nations Environment Programme (UNEP) was given the task of ensuring that emerging environmental problems of wide international significance received appropriate and
adequate consideration by governments. UNEP established the Re-
gional Seas Programme. The first action plan under that program was adopted for the Mediterranean in 1975. The Caribbean Environment Programme action plan was adopted in 1981, and the Cartegena Con-
vention was adopted in 1983, including the Protocol on Specially Pro-tected Areas and Wildlife of the Wider Caribbean Region
Provided a framework and information base for considering marine environmental issues regionally. MPAs were one means of addressing
some such issues
1973-1977
Third United Nations Conference of the Law of the Sea Provided a legal basis upon which measures for the establishment of MPAs and the conservation of marine resources could be developed
for areas beyond territorial seas
Benefits and Challenges of MPA Strategies
countries started establishing and managing MPAs. The concept
may be the basis of comprehensive ecosystem-scale approaches to
human uses, and impacts on biological diversity and ecosystem
Table 2.2) report listed 32 acronyms for marine management tools and
some of which are presented in Table 2.2. As protected areas in the
or terminology. One result of that lack of common vocabulary is
13
1975The International Union for the Conservation of Nature (IUCN) conducted a Conference on MPAs in Tokyo
The conference report called for the establishment of a well-monitored system of MPAs representative of the world's marine ecosystems
1982
The IUCN Commission on National Parks and Protected Areas organ-ized a series of workshops on the creation and management of marine and coastal protected areas. These were held as part of the Third World Congress on National Parks in Bali, Indonesia
An important outcome of these workshops was publication by IUCN (1994) of Marine and Coastal Protected Areas: A Guide for Planners and Managers
1983
The United Nations Educational, Scientific, and Cultural Organization (UNESCO) organized the First World Biosphere Reserve Congress in Minsk, USSR
At that meeting it was recognized that an integrated, multiple-use MPA can conform to all of the scientific, administrative, and social principles that define a Biosphere Reserve under the UNESCO Man and the Biosphere Programme
1984 IUCN published Marine and Coastal Protected Areas: A Guide for Plan-ners and Managers
These guidelines describe approaches for establishing and planning protected areas
1986-1990
IUCN's Commission on National Parks and Protected Areas (now IUCN World Commission on Protected Areas) created the position of vice chair, (marine), with the function of accelerating the establishment and effective management of a global system of MPAs
The world's seas were divided into 18 regions based mainly on bio-geographic criteria, and by 1990, working groups were established in each region
1987-1988
The Fourth World Wilderness Congress passed a resolution that established a policy framework for marine conservation. A similar resolution was passed by the Seventeenth General Assembly of IUCN
These resolutions adopted a statement of a primary goal, defined “marine protected area,” identified a series of specific objectives to be met in attaining the primary goal, and summarized the conditions necessary for that attainment
1992United Nations Conference on Environment and Development, also known as the Earth Summit
Agenda 21 called on coastal states to maintain biological diversity and productivity of marine species and habitats under national jurisdiction through inter alia establishment and management of protected areas
1994
The United Nations Convention on the Law of the Sea (UNCLOS) and the Convention on Biological Diversity (CBD) came into force. UNCLOS de-fines the duties and rights of nations in relation to establishing exclusive economic zones measuring 200 nautical mile from baselines near their coasts. While facilitating the establishment and management of MPAs outside a country's territorial waters, UNCLOS does not allow interfer-ence with freedom of navigation of vessels from other countries
These two international conventions greatly increase both the obliga-tions of nations to create MPAs in the cause of conservation of bio-logical diversity and productivity and their rights to do so. It is notable that the United States has not ratified eighth Conference of Parties of the CBD has identified MPAs as an important mechanism for attaining the UNCLOS objectives and intends to address this matter explicitly in the next few years
1995 The Great Barrier Reef Marine Park Authority, the World Bank, and the IUCN published A Global Representative System of Marine Pro-tected Areas (Kelleher et al. 1995)
This publication divided the world's 18 marine coastal regions into biogeographic zones, listed existing MPAs, and identified priorities for new ones in each region and coastal country
1999 IUCN published Guidelines for Marine Protected Areas These updated guidelines describe the approaches that have been
successful globally in establishing and managing MPAs
2002
World Summit on Sustainable Development Plan of implementation Called for the establishment of marine protected areas consistent with international law and based on scientific information, including repre-sentative networks by 2012 as part of a suite of tools to promote the conservation and management of the oceans through actions at all levels
2003
The 5th World Parks Congress recognised multiple governance types suitable for all protected areas, including, state and private govern-ance, indigenous and community conserved areas and various kinds of co-management
Many Locally Managed Marine Areas and other community marine conservation initiatives could be recognised as protected areas.
2004
CBD adopted the programme of work on protected areas (POWPA) Objective of POWPA is the establishment and maintenance by 2010 for terrestrial and by 2012 for marine areas of comprehensive, effectively managed, and ecologically representative national and regional systems of protected areas that collectively, inter alia through a global network contribute to achieving the three objectives of the Convention and the 2010 target to significantly reduce the current rate of biodiversity loss;
2006CBD adopts sub-targets and indicators for its strategic plans “at least 10% of each of the world’s marine and coastal ecological
regions to be effectively conserved” by 2010
2008IUCN published a new set of Guidelines to Protected Area Categories, which included a new definition of a protected area, replacing the 1994 definition and the separate IUCN MPA definition
MPAs were aligned more closely with terrestrial protected areas. Conservation aims within protected areas were strengthened.

out four protected area categories. In 1942, the Western Hemisphere
incorporated four types, or categories,
Areas (CNPPA), now the World Commission on Protected Areas
(WCPA), prepared a World List of Guidelines for applying protected area
, for
nomenclature by C. Frank Brockman (1962). In 1966, IUCN produced a
UN List of Protected Areas
, and natural monuments.
By 1972, the Second World Parks Conference called on IUCN to “
the various purposes for which protected areas are set aside; and develop
suitable standards and nomenclature
in January 1994 the IUCN General Assembly approved a new system, with
established a task force to develop new guidelines. These were published
(terrestrial or marine):
and cultural values
landscapes/seascapes, and four governance types including state, private,
indigenous and community governance and co-management.
Chapter 214
Management Regimes
have complex governance systems. They can be managed by the
that the marine environment is used by many groups and fall under
of stakeholders, the management of a single marine space within
overlapping needs.
In many cases, there needs to be strong inter-governmental
to oversee and manage the MPA (See Chapter 4 for examples). Their
Marino Bellana National Park, Coast Rica© Link Roberts

Benefits and Challenges of MPA Strategies
Examples of successful governance approaches
underway in developed country contexts; Centralized Management
such, are likely most appropriate for developed country contexts.
equitable and transparent planning process that is formally recognized
Regardless of the category, when using MPAs, a more complete
15
Increasing ecological protection Increasing managed use and social protection
Country
Profiles
Marine Protected Area
Tools: Primarily for Bio-
diversity Conservation
and Habitat Protection
Multiuse Marine
Management Tools:
Primarily for Balanced
Conservation and So-
cioeconomic Uses
Sustainable Use Marine
Resource Management
Tools: Primary for Ex-
tractive Use
Culture-Ecological/
Social Protection
Reserves: Primarily for
Indigenous and Tradi-
tional Non-indigenous
Communities
Philip-
pines
Community-based MPANo-take Marine ReserveMPA NetworkNational Marine ParkWorld Heritage SiteRamsar Site
Integrated Coastal Man-agementMultiuse MPA
Fishery Management Re-serveEcosystem-based Fishery ReserveLocally Managed Marine Area
Chile
National Marine ParkMarine SanctuaryRegional Seas MPA Net-workCommunity-based MPARamsar Site
Large Marine EcosystemMultiuse MPA
Extractive Reserve (Man-agement and Exploitation Area for Benthic Resourc-es)Fishery Management Re-serve
Brazil
National Marine ParkRamsar Site
Integrated Coastal Man-agementMultiuse MPA (Environ-mental Protection Areas)
Sustainable Development (Sustainable Development Reserve)
Culture-ecological Reserve Traditional (Non-indige-nous) Communities (Ma-rine Extractive Reserves)Marine Sacred SitesCulture-ecological Indig-enous Peoples Territory
Tanzania
MPARamsar Site
Integrated Coastal Man-agementMultiuse MPACommunity-based MPAMPA Network
Collaborative Manage-ment Area
Australia
National Marine ParkEcosystem-based ReserveMPA NetworkNo-take Marine ReserveRamsar Site
Integrated Coastal Man-agementTreaty-based MPAWorld Heritage SiteBiosphere Reserve
Fishery Management Re-serve
Culture-ecological Indig-enous Peoples TerritoryCustomary Marine Tenure-based MPAIndigenous MPAIndigenous Landscape Management AreaMarine Sacred Sites
Solomon
Islands
MPAWorld Heritage Site
Integrated Coastal Man-agement
Treaty-based MPALarge Marine Ecosystem
Wildlife Management Area MPAFishery Management Re-serve
Customary Marine Tenure-
based MPAMarine Sacred Sites
Papua
New Guinea
MPA Integrated Coastal Man-agement
Treaty-based MPA
Wildlife Management Area MPA
Fishery Management Re-serve
Customary Marine Tenure-based MPA
Marine Sacred Sites

Chapter 2
Grunts Schooling - Elkhorn coral and grunts, Ambergris Caye, Belize © Mito Paz
16
management system should be in place to give that MPA the best
opportunity for success. In this context, there are three main elements
products is allowed. This is consistent with IUCN Category I and
Category II except to the extent that category II may permit
in the sense of maintaining biological diversity and ecosystem
processes. This is consistent with IUCN category VI with inclusions
regimes. (Kenchington 2010).
A deeper look at ‘bottom up’ categories: LMMAs
have changed through the years in response to societal and economic
changes (Johannes and Hickey 2004). One aspect of this has been the
An LMMA in this context would equate to a protected area under the
indigenous and community conserved area (ICCA) governance type and
can include a range of management approaches. Marine managed areas
shells”). One or more MPAs or other management techniques or “tools”,
employed within an LMMA. In using an LMMA approach, some coastal
of local knowledge and western science (LMMA network 2010).

resources management. For example, Papua New Guinea, Vanuatu, Fiji
not always without challenges, as demonstrated by a recent study
management rules in Kubulau District, Fiji (Clarke and Jupiter 2010).
MPAs and fisheries management
In recent years, MPAs are increasingly being considered as an
MPAs as a tool within an integrated and ecosystem-based approach
Halpern 2003; McClanahan & Mangi 2000).
Privately managed areas
MCAs include any formal or informal contract in which one or more
Benefits and Challenges of MPA Strategies
Benefits of MPAs
marine environment including:
nursery and feeding habits;
culture; and
research.
Properly designed and managed MPAs play important roles in:
associated ecosystems;
recover from other stresses such as increased ocean temperature;
Providing undisturbed control or reference sites serving as a
management of other areas.
17
© Mark Godfrey, TNC

grounds. Strategically located protected areas provide sites for
Natural refuges in the ocean have long provided an in situ reservoir
Australia 2003 for further details):
grounds);
— provision of spillover of an exploited species; and
Chapter 2
as a result of recruitment of exported eggs and larvae and from spillover
has been demonstrated mainly in molluscs (e.g. Queen conch in the
Bahamas, Stoner & Ray 1996; scallops in Georges Bank, Murawski et
al. 2001; clams in Fiji, Tawake et al. 2001; and scallops and murex in the
Gulf of California, Cudney-Bueno et al. 2009).
exploited species becomes higher just outside reserve boundaries
(e.g, Murawski et al. 2005, Russ et al. 2004, Abesamis et al. 2006,
net movement of organisms out of reserves is highly variable among
Tupper 2007, Forcada et al. 2009).
did not predict later performance.
Tourism benefits
The establishment of a marine protected area is an excellent way to
economic driver for many developing and developed countries. For
many island states and developing countries, tourism is the primary
contributor to GDP and provider of employment (Burke et al. 2000),
the source of foreign exchange for some 83 developing countries, and
the primary export for one-third of the poorest countries (Mastny
2001).
18
Indicator Main findings Region # of MPAs Source
Biomass DensitySizeRichness
446% increase166% increase
28% increase 21% increase
Global (for fish, invertebrates, algae)
124 Lester et al. 2009
Fish density 1.66 x higher Global 33 Molloy et al. 2009
DensityBiomassSpecies richness
1.4-1.92 x higher0.107-3.67 x higher1.27-1.68 x times higher
Global, temperate only (for fish, invertebrates, algae)
30 Stewart et al. 2009
Biomass
DensitySizeRichness
352% increase
151% increase29% increase25% increase
Global (for fish, invertebrates, algae)
81 Halpern 2003
Fish density Species richness
1.25-3.7 x higher1.11 x higher
Global 19 Mosqueira et al. 2000/ Côté et al. 2001
Fish density
Biomass
1.2 x higher
2.1x greater
Mediterranean 12 Guidetti & Sala 2007
Fish densitySpecies richness
2.46 x higher No effect
Mediterranean 12 Claudet et al. 2008
Fish density 1.64 x higher (2.5 x for exploited species)
Philippines 19 Maliao et al. 2009b

Benefits and Challenges of MPA Strategies
revenues in the US (Leeworthy 2000). The growth of ecotourism and
nature tourism outpaced the overall tourism industry in 2004 (UNWTO
2004), with most new tourism markets developing near natural areas
(Christ 2005). Coastal and marine areas that are healthy and intact can
bring in more tourism revenue than those areas that are degraded.
Marine protected areas can help contribute to local incomes directly
by ensuring tourism areas remain desirable and intact. However, there
tourism on coastal habitats, such as damage from careless snorkelers
to a visit to the coast; however, the quality of the natural systems
enhances the overall experience (Brander et al. 2006), and users are
sustainability of the MPA. Access fees generated through nature-based
Sustainable tourism development has been recognized as a means
to meet Millennium Development Goals, as it provides a host of
et al. 2007). These sites also indicated an improvement in community
Spiritual, cultural, historical and aesthetic values
economic terms but have immense value in other terms (Fiske 1992).
Sacred natural sites are places that have high value for one or more
faith groups and include many marine areas such as sacred coves,
islands and designated coastal waters. Such areas, being carefully
:
The island of Zanzibar is predominantly Muslim and many people
MPA, is a holy place because it points towards Mecca. In 1999,
Environmental Sciences to help use Islamic principles to promote
the management of the MPA. A management plan was developed
based on ethical principles laid down by the religion. A guide
book for religious leaders, schools, and madrasa was prepared
and translated into Swahili, with the result that the majority of
Bijagos islands /Guinea Bissau – local culture preserving dozens
of islands: The Bijagos archipelago in the south western part of
Guinea Bissau covers more than 80 islands and islets of which half
are not inhabited. A large part of these islands are sacred natural
planning in the Bolama-Bijagos biosphere reserve and have been
also formally recognized as parts of the core zones in the three
19
Tourism boats in the Galapagos Marine Reserve, Ecuador. © Imèn Meliane

Chapter 2
Disaster mitigation benefits
Natural ecosystems within MPAs can play an important role in
as typhoons and tsunamis, as well as regular erosion, all of which are
by coral reefs, seagrass beds, mangroves and coastal wetlands:
management framework to protect or, if necessary, restore such
: The Black River Lower Morass is the largest
freshwater wetland in Jamaica. The Morass lies on the coastal
the sea and is an important economic resource for some 20,000
people (Garrick 1986).
sea dyke maintenance. During typhoon Wukong (2000) the
et al. 2006).
: The
mangrove forests of the Sundarbans support vital ecosystem
services supplied by the Sundari trees ( ) that
countries the roots stabilise coasts, break up storm waves and
2004), although currently only 15% are protected and the area is
under severe threat.
Education and research benefits
experience and study marine plants and animals that are undisturbed
people can observe and compare with the impacts from disturbance.
important role in helping children and students learn about marine
animals and their habitats. As children learn and then take that
knowledge to their families and the wider community, they play a
for sustainable management of their marine environments. Repeated
years to be informed contributors to future decisions about marine
environments and resources.
values (Commonwealth of Australia 2003).
Creating stewardship for ocean awareness and protection
talking to friends and family members about the value of such areas,
and a newfound respect for the species found within the site. Such
sites are also important for developing local understanding of rights
20
Arranmore Island Lighthouse off the Donegal coast during the recent storms. © John Rafferty

Benefits and Challenges of MPA Strategies
Another role MPAs can have is as a framework for Peace Parks. Trans-
Costs of MPAs
examined the annual costs for running individual MPAs, which ranged
However, such a network would likely create around one million jobs
and/or income (Scholz et al. 2004; IUCN-WCPA 2008), requiring former
costs in the design process can be detrimental to the success of the
MPA.
capacity for maintenance, enforcement, oversight, monitoring
management. In many cases, the costs of MPAs can be reduced by
framework (e.g. Zoning, Integrated Coastal Management, Ecosystem-
Based Management).
Complementarities with Other Management Tools
broader framework of ocean management and hence act in synergy
sea by rivers and air or from estuaries, coastal development, pipelines,
and other land-based sources).
21
Fisherman landing Pacific angelshark in Puerto Lopez, Ecuador © Imèn Meliane

Chapter 222
The growing array and intensity of threats to the ocean extend well
systems and the many sources of airborne pollutants are amongst the
a globalized world economy introduces non-indigenous species to
new areas where they establish and become invasive, undermining
ecosystem stability and established human uses.
how isolated impacts from individual sectors concentrate, go beyond
on marine and coastal ecosystems, but increasingly the larger natural
an ecosystem-based management approach that addresses the
human uses.
divisions and overlaps in the biological and ecological features of the
ecosystem. The design and management of MPAs has involved the use
provided important lessons learned with regards to schemes of
resources as well as a range of socioeconomic tools.
The scope of the six IUCN categories of protected areas provides a
framework for ecosystem-based management (Kenchington 2010).
voluntary FAO Code of Conduct for Responsible Fisheries and the
both ecologically and economically sustainable. Although the primary
target species), they also address species belonging to the same
ecosystem as or dependent upon target species (FAO principle 6.2).
Tuna boat fleet - Each boat is equipped with a host of high tech equipment including a helicopter used to spot schools of tuna. Pago Pago Bay, Tutuilla -
American Samoa © Wolcott Henry

Benefits and Challenges of MPA Strategies 23
MPAs: From the Concept to the Target
MPAs have been suggested as an integral part of an overall strategy for ocean management, over the last few years we observe a tendency
to use them as a strategy to achieve ecosystem-based management.
made to increase their number and improve their management. However it is important to remember the context in which they operate.
Halpern et al. (2010) have undertaken a global analysis of where and how much marine protected areas and no-take marine reserves
ocean ecosystems. While they revealed large stretches of coastal oceans where reserves can play a major role in improving overall ocean
management.
Small-scale fishers on the coral reef surrounding Siquijor island, Philippines. © Rebecca Weeks

Rock island, Palau © Imèn Meliane

Chapter 3The 10% Target: Where Do We stand?
Lead Authors: Mark Spalding, Louisa Wood, Claire Fitzgerald and Kristina Gjerde
Key Messages:
Current MPAs number 5878 and cover over 4.2 million km2 of ocean (1.17% of the global ocean surface).
MPA coverage of continental shelf areas is now 4.32%, and 2.86% of waters within 200nm of coastlines.
A few large MPAs have accounted for the greatest increase in coverage over the last 5 years.
Only 12 out of 190 states and territories with marine jurisdictions have an MPA coverage of 10% or more in the areas under their jurisdiction.

Chapter 3
Introduction
of the world’s terrestrial surface was already covered, while marine
protected areas (MPAs) extended over only 0.5% of the ocean surface
2006 which called for “at least 10% of each of the world’s marine
Biological Diversity 2006)1. This paper explores progress that MPAs
1 The 10% target is not strictly about MPAs, as “effective conservation” was more broadly defined to include “other means of [area based] protection, for which management plans exist” (Convention on Biological Diversity, 2005). This broader interpretation was originally intended to acknowledge the contribu-tion of other management measures (such as well-functioning integrated ma-rine and coastal area management regimes, fisheries management areas and control of land-based sources of pollution), however there are concerns that this would also mean that Parties have only agreed to effectively manage 10% of the oceans, which is inconsistent with the obligations that States have with regards to the marine environment under UNCLOS and other treaties. A further degree of ambiguity exists over the deadline: the CBD Programme of
Work on Protected Areas (POWPA) continues to talk about a 2012 date for ma-
rine protection targets (Convention on Biological Diversity 2009) even though
the 2006 decision mentions only 2010. This slightly later date was proposed in
2004 in recognition of the considerable lag in MPA coverage, and matches the
target set by the WSSD.
Regardless of these various interpretations, CBD Parties have clearly agreed
that protected areas coverage is a relevant indicator for assessing progress to-
wards achieving effective conservation; and most of the CBD deliberations with
respect to these targets have remained focused on MPAs; and MPAs remain
one of the only extensively tools being used directly for conservation purposes.
Following the adoption of the 10% target, a number of countries have, in fact,
set percentage-based MPA targets.
coastal systems – coral reefs, mangrove forests and seagrasses – had
seamounts were under-represented. Spalding et al (2008) explored in
area 2
the only “marine” components of terrestrial protected areas.
This chapter updates and expands upon these studies – using the
same underlying data sources and methodologies as the previous
2 defined as areas where the seabed is less than 200m deep, with the inclusion
of a 5km buffer beyond these to capture errors in bathymetric resolution and to
allow for inclusion of more mobile or wide ranging shelf-related fauna
Coral reef of Restoff Island, an MPA in Kimbe Bay west New Britain Papua New Guinea © Mark Godfrey
26

The 10% Target: Where Do We stand?
Methods
(GIS). The very large and complex nature of a number of these datasets
database used in this work is the World Database on Protected Areas
(WDPA, www.wdpa.org)3 . This database has been fully updated and
harmonised with MPA Global (Wood et al. 2008), and provides the
most comprehensive global source on MPAs world-wide. Although
designated and the data being incorporated into the WDPA, however,
the WDPA is currently being redeveloped to facilitate and accelerate
datasets that are not yet formally incorporated into WDPA, but soon
will be. As with the previous works we also performed a rapid review of
the sites listed as marine in the database, and a) added sites that were
clearly marine but not listed as such, and b) removed sites that were
of an IUCN protected area (see box).
than the next most recent review (Spalding et al. 2008). Of these
ordinates and known total area were used to develop an approximate
recorded area.
Many MPA boundaries also include terrestrial area, which needed to
be excluded in order to calculate marine areal coverage. This exclusion
of terrestrial area was done using a standardized global coastline, the
the geographical space that has been or could be claimed under
Exclusive Economic Zones (EEZ), or their equivalents4. Such boundaries
3 The WDPA is a joint project of UNEP and IUCN, produced by UNEP-WCMC and the IUCN World Commission on Protected Areas. It is committed to serving the
best possible data on protected areas, as defined by IUCN.
4 The Exclusive Economic Zone is the area beyond and adjacent to the ter-ritorial sea out to a maximum of 200 nm from coastal baselines which can be claimed under the United Nations Convention on the Law of the Sea (UNCLOS
1982) where states have rights over the resources and jurisdiction over activi-
ties including fisheries, environmental protection, and scientific research. Not all states are signatory to UNCLOS, and several who are have not claimed EEZ areas, or have declared more limited jurisdictions, such as fishing or environ-
mental protection zones over the equivalent geographic footprint as an EEZ.
The dataset used here (Flanders Marine Institute 2009) provides approximate boundaries for all national jurisdictional areas: territorial seas, protection zones, fishing zones, EEZs or hypothetical EEZs (areas that could likely be claimed if the
country were signatory to UNCLOS and / or were to claim an EEZ). It does not differentiate between them. Given the complexity of existing claims and the
large number of disputed areas it is important to note that this dataset is only a basic approximation, and inevitably contains errors. Further, given that some countries have not claimed EEZs, our estimates of total area under potential
jurisdiction are considerably larger than the areas currently under jurisdiction. One of the most notable areas is the Mediterranean where only a few countries
have jurisdictional claims extending beyond territorial seas.
the legal status of any country, territory or area, or concerning the
1. Marine Ecoregions of the World, MEOW (Spalding et al. 2007),
5km seaward of the 200m depth contour.
2. Pelagic provinces (Spalding et al. in review), a new biogeographic
from an earlier version (UNESCO 2009), with the inclusion of semi-
3. Benthic provinces
described in (UNESCO 2009). Bathyal systems are described from
the 300m depth contour down to 3500m, while abyssal systems
All 5878 sites were included in all the biogeographic overlay analyses.
to target either pelagic or benthic systems, this is not always the
the WDPA (primarily due to limited data availability). As such, we did
with each of the layers listed above in a GIS. This was done with a
“dissolved” version of the global MPA site layer in which site boundaries
27
MPAs – Definitions and Exclusions
The present work focuses only on MPAs as defined by IUCN (Dudley 2008). These lie at the heart of conservation efforts in almost all countries, and are spatially the most widely used conservation tool in terms of geographic extent and conservation impact. They are also the only conservation measure for which global, consistent data are available (see discussion). Although data on some other conservation measures, such as fisheries regulations, are held for a few locations in the WDPA, this is not globally complete and such sites were excluded to ensure we used a consistent dataset. As with the previous studies we did not include internationally inscribed / approved sites (e.g. World Heritage, Ramsar and UNESCO-MAB Biosphere Reserves), because such sites are typically also designated nationally through statutory or non-statutory means, and where such sites lie outside of national designations, there are often few legal protections.

larger protected seascapes) or b) where inaccuracies in the GIS show
apparent overlap. In these overlays, some 600 sites occur completely
on land and have no marine area. All of these sites had been annotated
in the WDPA as marine by expert sources, and a manual review
indicated that they are indeed coastal sites. This apparent non-overlap
area polygons). As such, these sites are included in the counts of MPAs,
Results
The total number of MPAs now stands at approximately 5878, covering
over 4.2 million km2 of ocean (Map 3.1). This equates to 1.17% of
the global ocean area and represents a notable increase on previous
records, largely thanks to the inclusion of just a small number of very
large new MPAs5
5 Recently declared large sites include the 180,000km2 Prince Edward Islands
(South Africa) MPA declared in mid-2009 and the 94,000km2 South Orkney (Ant-
arctica) MPA designated in November, 2009. The former is still awaiting final le-
gal gazetting, but is already being actively managed (Belinda Reyers Council for Scientific and Industrial Research (CSIR) South Africa, pers comm., July 2010). Others include the 226,000km2 network of Commonwealth Marine Reserves in
SE Australia in 2007, the 600,000km2 of Benthic Protection Areas around New
Zealand, also in 2007, and 500,000km2 of Marine National Monuments around
the US Pacific territories declared in 2009. We have not included Chagos Pro-
Chapter 3
2003a 2006b 2008c 2010d
Number of MPAs 4116 4435 5045 5850
MPA area coverage statistics
million km2 % million km2 % million km2 % million km2 %
Global total 1.64 0.45 2.35 0.65 2.59 0.72 4.21 1.17
Within EEZs 1.64 1.14 2.35 1.63 2.59 1.80 4.12 2.86
On continental shelf 1.20 4.09 1.27 4.32
Off-shelf 1.39 0.42 3.01 0.91
aChape et al (2003) bWood et al (2008) cSpalding et al (2008) dThis study
Table 3.1: Summary of recent growth in number and areal extent of marine protected areas globally
High Seas Protection
The Pelagos Sanctuary is widely regarded as the first MPA to be designated in the High Seas (i.e. areas beyond national jurisdiction). This site was designated
under a trilateral agreement between France, Italy and Monaco, which entered into force in 2002. This site straddles the territorial waters of all three nations
and the high seas beyond, covering some 87,500km2. The Pelagos Sanctuary set a number of critical precedents in terms of international co-operation, but
also has highlighted the considerable challenges of management in international waters (Notarbartolo-di-Sciara et al. 2008). Focused on the protection of
cetaceans, the “regulations” at present largely focus on applying pre-existing European regulations on limiting the size of drift nets and an agreement to
control boating activities (speed boating and whale watching) if or when these should become a serious threat to cetaceans. Such regulations would be
insufficient for the site to be classed as an IUCN protected area (it was therefore omitted from the global analysis in this chapter), although it may qualify
under the CBD definition. An important observation, for this and other sites that currently have less strict levels of protection, is that they do still provide a
management framework through which additional regulations and/or management activities may be introduced over time (See Chapter 4 for further data
issues relating to Pelagos).
More recently, in 2009, the South Orkneys MPA was designated by the Commission on the Conservation of Antarctic Marine Living Resources (CCAMLR) as
the first step in the development of a representative network of MPAs in the waters in the Southern Ocean surrounding the Antarctic continent. CCAMLR
operates as a fisheries management framework for the Southern Ocean, but unlike a conventional Regional Fisheries Management Organisation, it has
wider conservation responsibilities for the region (i.e. it looks at the impact of fishing on the whole food-chain). CCAMLR operates as part of the wider
Antarctic Treaty System, which also contains a Protocol for Environmental Protection mandating the development of a representative system of terrestrial and
marine protected areas. The MPA came into force in May 2010 to conserve important foraging areas used by albatrosses, petrels and penguins, and unique
oceanographic features and to allow scientists to better monitor the effects of human activities and climate change on the Southern Ocean. The site covers
some 94,000km2, within which no fishing activities are permitted, nor dumping, discharges or transhipments between fishing vessels.
A number other large areas in the high seas have been declared, mostly fisheries closures by Regional Fisheries Management Organisations (RFMOs). Many of
these are described and mapped on www.highseasmpas.org (see also Ardron et al. 2008). These sites again show important progress towards the use of spatial
management tools for conservation of the high seas, however most are temporary, or only include narrow restrictions on single fishing gears or on particular
target species, which means they cannot be included under the IUCN definition of a protected area used in this analysis.
tected Area, declared by the UK government in April 2010. At over 500,000km2 this will be the world’s largest MPA and will substantially alter a number of sta-tistics in this chapter. At the time of writing, however, negotiations as to the
legal status were still ongoing, no regulations had been applied beyond the
former existing MPAs (which are included) and no boundary had been decided (Joanne Yeadon, Foreign and Commonwealth Office, pers comm., July 2010).
are disputed and that there may be inaccuracies in the source map we have placed countries grouped into broad groupings. Only 12 countries and territories lie to the right of the line
28
121
2116
128 9
3
0
20
40
60
80
100
120
140
<0.5% 0.5-1% 1-2% 2-5% 5-10% 10-20% >20%
Nu
mb
er
of
cou
ntr
ies
or
terr
ito
rie
s
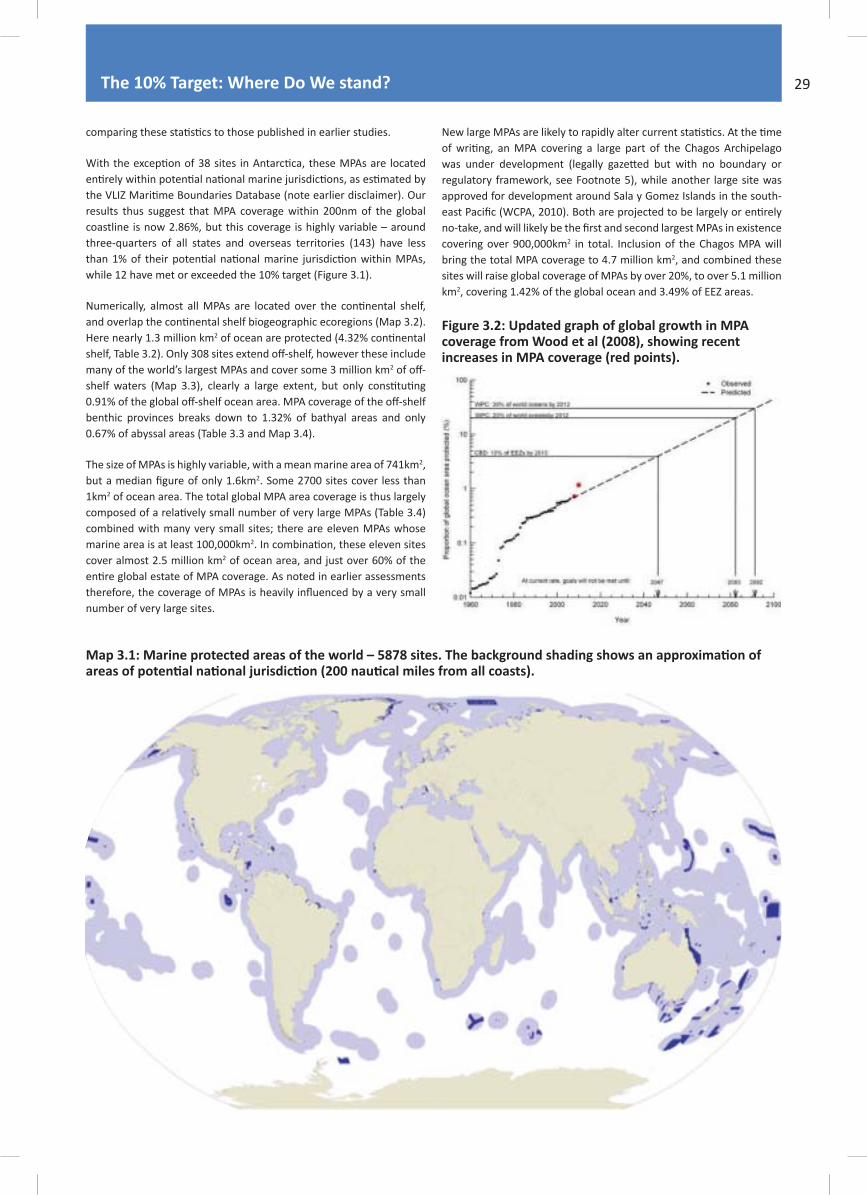
Figure 3.2: Updated graph of global growth in MPA
results thus suggest that MPA coverage within 200nm of the global
coastline is now 2.86%, but this coverage is highly variable – around
three-quarters of all states and overseas territories (143) have less
while 12 have met or exceeded the 10% target (Figure 3.1).
Here nearly 1.3 million km2
many of the world’s largest MPAs and cover some 3 million km2
benthic provinces breaks down to 1.32% of bathyal areas and only
0.67% of abyssal areas (Table 3.3 and Map 3.4).
The size of MPAs is highly variable, with a mean marine area of 741km2, 2. Some 2700 sites cover less than
1km2 of ocean area. The total global MPA area coverage is thus largely
combined with many very small sites; there are eleven MPAs whose
marine area is at least 100,000km2
cover almost 2.5 million km2 of ocean area, and just over 60% of the
number of very large sites.
The 10% Target: Where Do We stand?
regulatory framework, see Footnote 5), while another large site was
approved for development around Sala y Gomez Islands in the south-
covering over 900,000km2 in total. Inclusion of the Chagos MPA will
bring the total MPA coverage to 4.7 million km2, and combined these
sites will raise global coverage of MPAs by over 20%, to over 5.1 million
km2, covering 1.42% of the global ocean and 3.49% of EEZ areas.
29

Chapter 3
Province Shelf area (km2
Proportion MPA Area (km2
No of eco-regions
No of ecoregions with MPAs
1 7,636,248 4.87 372,132 19 19
4,178,449 1.58 66,113 25 23
2 Northern European Seas 1,751,687 1.85 32,423 7 6
3 Lusitanian 306,872 2.05 6,304 3 3
4 Mediterranean Sea 688,638 2.66 4,242 7 7
5 890,075 0.76 6,778 5 4
6 370,865 1.39 5,142 2 2
7 Black Sea 170,311 2.59 4,413 1 1
3,029,022 2.45% 74,156 17 17
8 1,620,446 1.39 22,506 6 6
9 663,789 2.32 15,377 2 2
10 558,551 2.86 15,960 6 6
11 186,236 10.91 20,313 3 3
2,162,800 6.42 138,764 25 22
12 1,013,910 6.78 68,774 9 9
13 North Brazil Shelf 502,608 6.98 35,080 2 2
14 197,339 7.63 15,048 5 3
15 St. Helena and Ascension Islands 1,256 0.13 2 1 1
16 73,354 10.44 7,660 2 1
17 Gulf of Guinea 374,333 3.26 12,201 6 6
2,233,848 1.75 39,119 25 22
18 Red Sea and Gulf of Aden 284,818 3.74 10,643 3 3
19 Somali/Arabian 391,400 1.16 4,548 4 3
20 Western Indian Ocean 489,958 1.70 8,310 9 7
21 West and South Indian Shelf 387,427 0.51 1,965 2 2
22 Central Indian Ocean Islands 78,847 1.56 1,227 2 2
23 Bay of Bengal 288,246 0.45 1,307 2 2
24 Andaman 313,152 3.55 11,119 3 3
5,881,372 7.17 421,679 40 37
25 South China Sea 542,091 0.58 3,129 3 2
26 Sunda Shelf 1,833,967 2.50 45,890 4 4
27 66,834 3.65 2,437 2 2
28 South Kuroshio 42,498 7.61 3,235 1 1
29 58,103 2.29 1,328 4 4
30 Western Coral Triangle 979,509 7.83 76,720 8 7
31 Eastern Coral Triangle 229,785 0.46 1,049 4 3
32 Sahul Shelf 1,314,415 0.75 9,801 4 4
33 Northeast Australian Shelf 290,837 83.64 243,263 2 2
34 Northwest Australian Shelf 304,796 2.03 6,188 2 2
35 209,260 12.57 26,297 5 5
36 Lord Howe and Norfolk Islands 9,277 25.24 2,342 1 1
150,287 19.59 29,448 12 10
37 Hawaii 31,545 76.21 24,041 1 1
38 Marshall, Gilbert and Ellis Islands 49,243 2.21 1,089 2 2
39 Central Polynesia 16,539 25.00 4,134 3 3
40 Southeast Polynesia 47,617 0.30 143 4 3
41 Marquesas 4,629 0.88 41 1 1
the results at the ecoregional level.
30

The 10% Target: Where Do We stand?
42 Easter Island 714 0.00 - 1 0
254,137 10.84 27,558 11 10
3 237,555 4.62 10,978 8 7
44 Galapagos 16,582 99.99 16,580 3 3
Temperate South America 1,704,401 0.36 6,052 15 10
45 149,783 1.23 1,839 4 1
46 Juan Fernández and Desventuradas 1,821 0.00 - 1 0
47 561,700 0.44 2,487 4 4
48 Magellanic 989,211 0.17 1,701 5 4
49 Tristan Gough 1,885 1.34 25 1 1
Temperate Southern Africa 284,261 2.54 7,225 5 4
50 Benguela 160,880 2.25 3,620 2 2
51 Agulhas 122,449 2.37 2,905 2 2
52 Amsterdam-St Paul 932 0.00 - 1 0
Temperate Australasia 1,025,333 5.49 56,288 17 15
53 Northern New Zealand 49,253 3.57 1,758 3 3
54 Southern New Zealand 240,894 0.13 323 4 2
55 East Central Australian Shelf 68,843 18.15 12,495 2 2
56 Southeast Australian Shelf 241,183 7.86 18,954 3 3
57 Southwest Australian Shelf 334,593 3.96 13,263 3 3
58 West Central Australian Shelf 90,567 10.48 9,494 2 2
Southern Ocean 792,253 3.58 28,330 21 13
59 93,188 19.08 17,784 7 6
60 163,301 0.94 1,541 5 4
61 499,328 0.01 35 6 3
62 36,437 24.62 8,970 3 3
Map 3.2: MPA coverage by marine ecoregions. The same data are summed up into provinces and realms in Table
seawards to 200nm.
31

DiscussionCurrently, global MPA coverage represents 1.17% of the global ocean
surface. This represents an increase of over 60% of the area recorded
reported from 2003 (Chape et al. 2008). These increases can be partly
environment over the last decade. This increase is evidenced by the
four which alone have contributed an increase of almost 750,000km2
or 17% of the total MPA area. Despite this success, 1.17% remains a far
cry from the 10% target set by the CBD and although other tools than
tools are in place. This target will not be met in 2010, nor even by 2012,
Patterns across jurisdictional zones
with a marine component have already reached or surpassed the
Chapter 3
Province Biome Province area (km2 MPA area (km2
Pelagic
Agulhas Current Boundary – western 2,109,096 14 0.00
Polar 29,511,842 94,217 0.32
Polar 14,038,776 342,958 2.44
Polar 12,203,263 46,987 0.39
Benguela Current Boundary – eastern 1,328,969 7,216 0.54
Black Sea Semi-enclosed sea 292,027 - 0.00
California Current Boundary – eastern 1,473,269 3,844 0.26
Canary Current Boundary – eastern 1,796,491 175 0.01
Equatorial 11,743,973 143,411 1.22
Equatorial 15,996,871 236 0.00
Equatorial 9,124,046 121,701 1.33
Guinea Current Boundary – eastern 626,188 - 0.00
Gulf Stream Boundary – western 1,189,309 1,358 0.11
Humboldt Current Boundary – eastern 3,120,839 562 0.02
Southern Indian Ocean Gyre 18,461,939 3,496 0.02
Northern Indian Ocean Gyre 19,034,649 1,083 0.01
Indonesian Through-Flow Semi-enclosed sea 3,571,343 42,895 1.20
Inter American Seas Semi-enclosed sea 3,321,482 65,256 1.96
Kuroshio-Oyashio Current Boundary – western 1,063,826 11 0.00
Leeuwin Current Boundary – eastern 1,359,848 230 0.02
Malvinas Current Boundary – western 685,365 - 0.00
Mediterranean Semi-enclosed sea 1,840,859 4,382 0.24
7,787,574 200,102 2.57
6,186,594 - 0.00
Gyre 12,132,822 13,012 0.11
Gyre 36,137,158 665,819 1.84
7,388,208 - 0.00
Red Sea Semi-enclosed sea 229,964 2 0.00
Sea of Japan/East Sea Semi-enclosed sea 740,969 2 0.00
Somali Current Boundary – western 2,596,329 40 0.00
Gyre 14,718,463 - 0.00
Gyre 41,364,059 624,077 1.51*
South China Sea Semi-enclosed sea 1,586,354 6.62366 0.00
Polar 16,855,986 275,274 1.63*
Gyre 8,234,506 827 0.01
Southern Subtropical Front 21,837,584 345,893 1.58*
32

10% target: Dominican Republic, Ecuador, Estonia, Germany, Guam,
Mariana Islands, South Africa, and the United States Minor Outlying
EEZ areas, as well as two remote territories with few inhabitants, but
examples for others to follow.
By contrast, some 75% of the 190 states and territories with a marine
component that are considered in this chapter (143 in total) have less
than 1% of their EEZs (or equivalent) within MPAs, including 63% with
less than 0.5% protected. At a global scale, there are some very large
gaps, most notably around the Indian Ocean Basin, Central and West
Africa (but see Chapter 4), and around the western and southern coasts
of South America. In most of these cases, new MPAs are currently
being developed, some within the context of regional networks (e.g.
1) Most MPAs are largely restricted to territorial waters (Territorial Seas
claims extend from the legal baseline on the shore to three, or more
have designated extensive MPAs right across their EEZs or equivalent
areas. Most notably these include Australia, New Zealand, Germany
and the USA, while single large sites beyond the territorial sea have also
been declared by Colombia, Ecuador, South Africa and the Dominican
Republic. These countries and their associated territories are all listed
as having high levels of MPA coverage.
most extensive MPA coverage, even in coastal and shelf areas, to be
analyses performed here (EEZs and biogeographic areas, see below).
e.g. Commonwealth of the Northern Mariana Islands and the USA,
The considerable growth of MPA coverage in areas far from human
The 10% Target: Where Do We stand?
Bathyal
n/a 6,265,125 56,488 0.90
n/a 4,704,449 2,491 0.05
Cocos Plate n/a 4,730,774 128,364 2.71
Indian n/a 14,284,191 32,194 0.23
Nazca Plate n/a 1,183,807 - 0.00
New Zealand Kermadec n/a 4,300,385 262,404 6.10
n/a 8,437,208 58,881 0.70
n/a 1,376,522 153,560 11.16
n/a 3,432,488 1,160 0.03
n/a 3,256,403 5,776 0.18
n/a 7,539,536 25 0.00
n/a 6,108,929 555 0.01
n/a 7,359,484 287218 3.90
n/a 10,080,869 104,658 1.04
Abyssal
Angola and Sierra Leone Basins n/a 7,438,812 - 0.00
n/a 1,333,575 - 0.00
n/a 5,605,402 - 0.00
Brazil Basin n/a 6,860,975 - 0.00
n/a 18,276,942 285,367 1.56
n/a 25,502,050 108,028 0.42
n/a 14,207,765 6,179 0.04
Indian n/a 39,080,942 217,153 0.56
n/a 26,782,413 7,873 0.03
n/a 33,574,876 409,019 1.22
n/a 14,582,507 268 0.00
n/a 30,861,315 548,893 1.78
n/a 12,094,177 1,296 0.01
n/a 1,234,346 2,461 0.20
2
33
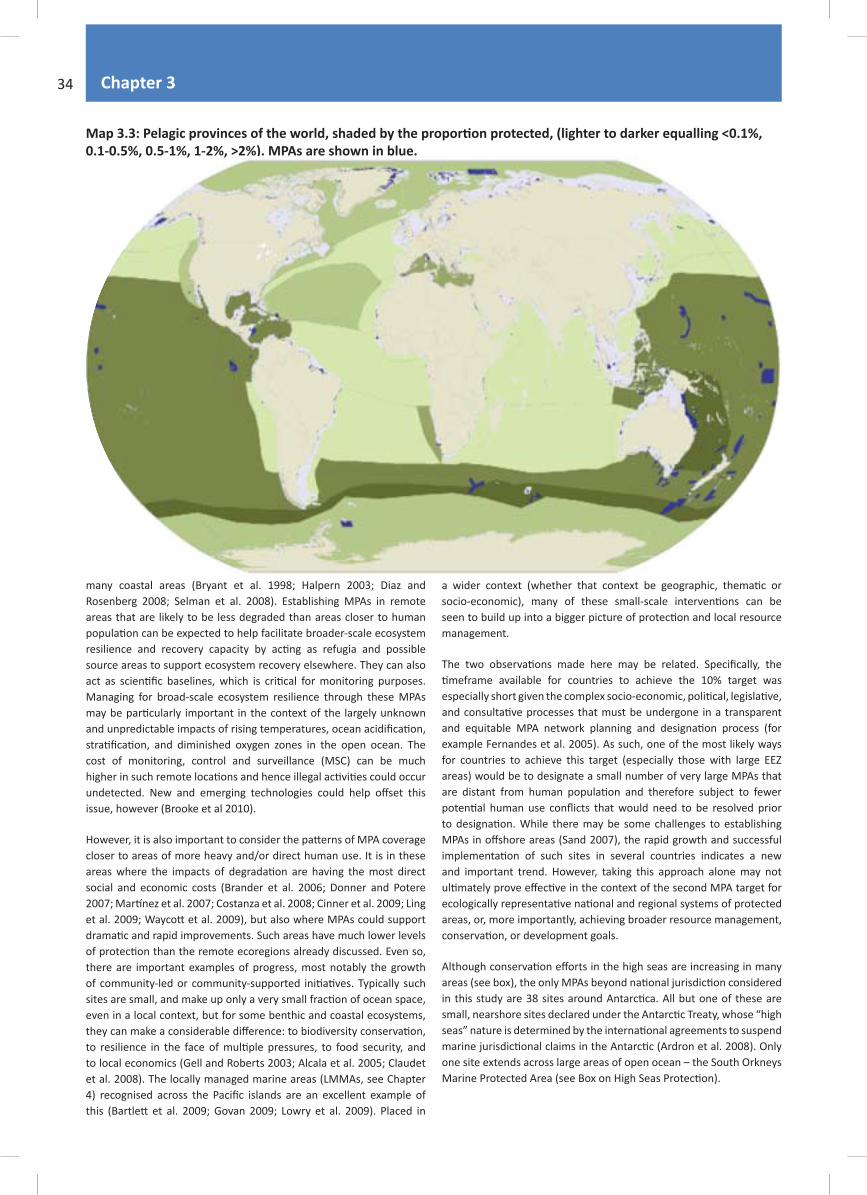
Chapter 3
Map 3.3:
management.
example Fernandes et al. 2005). As such, one of the most likely ways
for countries to achieve this target (especially those with large EEZ
areas) would be to designate a small number of very large MPAs that
and important trend. However, taking this approach alone may not
areas, or, more importantly, achieving broader resource management,
one site extends across large areas of open ocean – the South Orkneys
many coastal areas (Bryant et al. 1998; Halpern 2003; Diaz and
Rosenberg 2008; Selman et al. 2008). Establishing MPAs in remote
areas that are likely to be less degraded than areas closer to human
source areas to support ecosystem recovery elsewhere. They can also
Managing for broad-scale ecosystem resilience through these MPAs
cost of monitoring, control and surveillance (MSC) can be much
issue, however (Brooke et al 2010).
closer to areas of more heavy and/or direct human use. It is in these
social and economic costs (Brander et al. 2006; Donner and Potere
there are important examples of progress, most notably the growth
even in a local context, but for some benthic and coastal ecosystems,
to local economics (Gell and Roberts 2003; Alcala et al. 2005; Claudet
et al. 2008). The locally managed marine areas (LMMAs, see Chapter
34

The 10% Target: Where do we stand?
MPAs are shown in red.
Name of MPA Jurisdiction 2
Phoenix Islands Protected Area 408,342
Great Barrier Reef Marine Park Australia 343,480
United States 334,154
United States 247,179
United States 212,788
Prince Edward Islands Marine Protected Area South Africa 180,633
New Zealand 164,840
Macquarie Island Commonwealth Marine Reserve Australia 161,895
Galapagos Marine Reserve Ecuador 137,975
Franz Josef Land Zakaznik Russia 123,877
New Zealand 110,565
New Zealand 99,734
Greenland 96,598
South Orkneys Marine Protected Area High Seas 93,787
Nearshore Bristol Bay Trawl Closure United States 65,030
Heard Island and McDonald Islands Marine Reserve Australia 64,267
Colombia 61,099
Freycinet Commonwealth Marine Reserve Australia 57,942
New Zealand 54,025
New Zealand 44,231
Tasman Fracture Commonwealth Marine Reserve Australia 42,501
New Zealand 40,695
American Samoa 34,784
New Zealand 30,553
Table 3.4: The world’s largest MPAs: all known sites with marine areas calculated in GIS as being greater than 30,000km2.
35

Chapter 3
Biogeographic patterns
similar to those observed in Spalding et al (2008). Overall, coverage
remains highest for tropical realms, with 6.15% incorporated into
MPAs. Temperate areas, in both northern and southern hemisphere
of an MPA and their inclusion in the earlier study was an error. In polar
Temperate Southern Africa and Temperate Australasia (71% and 47%
(Table 3.2 and Map 3.2) remains highly variable across shelf areas.
Some 44 ecoregions have greater than 10% MPA coverage (19% of the
total), including 31 (13%) with greater than 20% coverage, and 14 (6%)
with over 50% coverage. By contrast 102 ecoregions (44%) have less
than 1% MPA coverage. By and large the greatest progress has been
6.
6 In their earlier analysis Spalding et al. (2008) looked at MPA coverage of a nar-
row 2km belt (1km inland and offshore from the coast). This study provided an insight into the very concentrated conservation effort going on this area. It also
provided a more accurate overview of coastal coverage (simple marine overlays
can miss the large parts of the intertidal zone which fall on the landwards mar-gin of the coastline). Unfortunately we were unable to re-run this analysis in the available time for this chapter, however it is undoubtedly the case that MPA
coverage in the coastal belt will have risen (from 12%) since that analysis, al-
though perhaps not so steeply given the large increased in large oceanic MPAs.
ConclusionsComprehensiveness and Representativeness
Barrier Reef Marine Park (1979, 1984), the Galapagos Marine Reserve (1986) and the Northwest Hawaiian Islands (designated in 2000 as a
include most of the world’s largest MPAs. Many of these sites are
linked to oceanic islands and in the pelagic overlays coverage is
area within MPAs. As more countries begin to designate MPAs whose
rapid increases in MPA coverage could be achieved in some pelagic
coverage with depth: bathyal areas, which make up 23% of the ocean
have 1.32% coverage, while the vast abyssal provinces, which make
of their area within MPAs. Most of these provinces are very large
provinces and the biodiversity they represent.
Ile de la Passe © J Tamelander / IUCN
36

The 10% Target: Where do we stand?
not only to biodiversity, but also the valuable marine ecosystem services on which millions depend for their livelihoods and well-being. It
intense and threats are high.
the legal challenges of establishing MPAs in the high seas, whilst complex, can be resolved (Scovazzi 2004; Corrigan and Kershaw 2008). Both
– they are high diversity, high-value systems, but they are also are well-known and well-mapped. The apparent failure to adequately protect
marine ecosystems.
Effectiveness
individual sites have been assessed (Pomeroy et al. 2004; Leverington et al. 2008b), there are no global datasets that have been developed
using consistent methodologies. In a review of recent assessments of some 2322 terrestrial and marine sites, 14% were found to be clearly
It seems likely that management challenges may be greater for MPAs than for many terrestrial sites, with physical challenges and high
in situ pressures. At the same
the total MPA network, but clearly such sites are of considerable importance. In considering targets for MPA coverage it is important to stress
Networks / Systems Characteristics
Green et al. 2007; Lombard et al. 2007; Harris et al. 2008; Game et al. 2009 and see Chapter 2).
37

Moving Beyond the CBD Targets
but there are also trends that may signal broader changes in the
geography of MPA establishment. There is also an urgent need to build
our understanding of how MPAs sit within a broader management
regime of ocean space, and to consider how that wider framework of
Future trends
local MPAs, with varying but increasing levels of local involvement will
lead to levels of MPA coverage that are ecologically meaningful even
at the scale of benthic and pelagic provinces in many areas. Trends in
measures. The challenges of monitoring and policing in these areas
are diminishing with current and emerging technologies (Brooke et al.
2010).
Building a global system
ad hoc
networks. This is not always the case and there are good models of
Chapter 3
the larger-scale planning needed to build networks of MPAs (Sala et al.
scales (Ardron 2008, and see Chapter 4).
the UN General Assembly decisions regarding Vulnerable Marine
(“seamounts, hydrothermal vents and cold water corals”) and call
upon states and RFMOs to sustainably manage and protect these (UN
General Assembly 2006). FAO has further developed guidelines for the
Protected areas are only one means of sustainably managing marine
space, and in many areas the wider use of ocean space is already
Wandering Albatross in Kaikoura, Southern island, New Zealand © Imèn Meliane
38

The 10% Target: Where Do We stand?
manage ocean space, such as the RFMOs. There is therefore a growing
management of which MPAs are an integral part, as advocated through
will be to try and understand this more complex framework of ocean
use and management extending beyond the boundaries of MPAs.
for the remaining 90%.
CBD targets, can be observed and measured.
Beyond 2010, it seems clear that the growth of MPA coverage will
less apparent. The present work shows the urgent need to increase
establishment and management are far greater where there are other,
both to nature and to people will also be commensurately greater.
Indeed factoring in ecosystem services or other socio-economic
simple benchmarks (see, e.g. Mace et al. 2010).
The need to monitor progress at all levels is important and there
is a need to broaden our assessments to more comprehensively
considerable investment in data gathering and management. There
is also an urgent need to build our understanding of how MPAs sit
within a broader management regime of ocean space, and to consider
Chapter 6 for more detail). MPAs, though necessary, are not a panacea
and cannot be expected to deal with sheer volume and diversity of
pressures facing the marine environment. Numerous measures other
than MPAs are already in place and, although many only provide
develop co-ordinated and integrated planning for the sustainable use
of all ocean space.
Lagoons of New Caledonia © Dan Laffoley
39

Derelict Fishing Gear and Nets - Marine debris, like these discarded fishing nets, pose a major threat to marine life and the fragile coral reef
©Claire Fackler

Chapter 4Meeting Global Goals at Regional Scales and in the High Seas
Lead Authors: Caitlyn Toropova, Richard Kenchington, Marjo Vierros, Georgina Bustamante, Robert Glazer, Alessandra Vanzella-Khouri, Charlotte Karibuhoye, Lauren Wenzel, Kohei Hibino, Moi Kim Tan, Imèn Meliane, Kristina M. Gjerde and Christophe Lefebvre
Key Messages:
Collaborative marine management partnerships among multiple sectors and stakeholders (e.g. Regional) can be cost-effective means for sharing scarce resources, personnel and skills.
Both legislative (top-down) and community driven (bottom-up) approaches can be used to implement successful ocean protection measures.
Aligning data, messaging and stakeholders is essential to successful MPAs.

Chapter 4
Introduction
management.
There are many advantages to working on regional and even sub-
many exist that allow countries to implement transboundary MPAs
scaling up appropriate local endeavors to regional ones can reduce
costs, personnel, and governmental processes when compared to
number of partners and complexity.
and achieve WSSD and CBD targets, regional approaches can provide
on how to overcome obstacles and accelerate progress on a scale
In this chapter, seven case studies (from the Caribbean, the
Mediterranean, East Asia, West Africa, the United States of America,
illustrate regional or sub-regional approaches on policy, data, and
successes, not a comprehensive review.
MEOW Realms
and Provinces
Shelf
Area
(km2
Marine
Area under
some form
of protec-
tion (km2
% Marine
Area Protect-
ed (within
the coastal
WCPA Terrestrial
Region
Total
land area
(km2
Land Area
under
protection
(km2
% Land
area
protect-
Southern Ocean 792,253 28,330 3.58 14,024,832 3,470 0
Tropical Eastern 254,137 27,558 10.84 Central America 521,600 133,731 25.6
Temperate
Australasia1,025,333 56,288 5.49
Australia / New
Zealand8,011,930 831,420 10.4
Temperate Northern 3,029,022 74,156 2.45 East Asia 11,799,212 1,904,342 16.1
Temperate Southern
Africa284,261 7,225 2.54
Eastern & Southern
Africa11,487,920 1,825,918 15.9
Europe 5,119,172 634,248 12.4
2,233,848 39,119 1.75North Africa & Middle
East12,954,170 1,226,928 9.5
Temperate Northern 4,178,449 66,113 1.58 North America 23,724,226 4,231,839 17.8
7,636,248 372,132 4.87 North Eurasia 22,110,050 1,789,006 8.1
150,287 29,448 19.59 553,058 54,949 9.9
Temperate South
America1,704,401 6,052 0.36 South America 9,306,560 2,056,559 22.1
8,547,400 1,305,864 15.3
South Asia 4,487,510 339,058 7.6
5,881,372 421,679 7.17 South East Asia 4,480,990 715,218 16
Western & Central
Africa12,804,860 1,293,206 10.1
2,162,800 138,764 6.42 Caribbean 234,840 36,469 15.5
Totals 29,332,411 1,266,864 150,168,330 18,382,225
Global Average 5.55 13.30
*Source PPO/WDPA 2008; Note some MPA #s are disputed. Regardless, there is clearly much less than the 10-30% CBD goals protected.
42

Meeting Global Goals at Regional Scales and in the High Seas
Wider Caribbean: Building Networks Through Regional Agreements
The Wider Caribbean region extends from South Florida south to
French Guyana, including The Bahamas, Mexico, Central America, the
countries and territories and is occupied by one Coastal Biogeographic
where some resources, such as Nassau grouper and queen conch, have
poorly managed coastal development and land-based and marine
reefs, seagrasses and mangroves. Global changes associated with
may not be adequate to keep corals from bleaching, for example, as
it happening currently (as of Summer 2010). However, when there
implemented to give the area the best chance at surviving catastrophic
events.
regulated uses. Recent studies of the economic value of coral reef areas
in Belize, Tobago, St. Lucia and Dominican Republic have contributed
of healthy marine environments among governments and coastal
These divisions, based on larval dispersal modeling1 suggest a more compartmented ecoregional scenario than previously thought, and can serve as a road map
managed areas.
1 Bustamante, G. and C. Paris. 2008. Marine population connectivity and its potential use
for the nomination of new World Heritage Sites in the Wider Caribbean. Marine Sanctuar-ies Conservation Series, NOAA. ONMS-08-07, pp 97-112. (Proceedings of a Special Sympo-
sium, November 9-11, 2006, 59th Annual Meeting of the Gulf and Caribbean Fisheries Insti-tute, Belize City, Belize) (http://sanctuaries.noaa.gov/science/conservation/pdfs/carib.pdf)
Coral Reefs in Dry Tortugas Ecological Reserve. © Jiangang Luo
43

That is the case of coastal towns next to Hol Chan and Port of Honduras
Marine Reserves in Belize; the Soufriere Marine Management Area
in St. Lucia; and within the Sian Ka’an Biosphere Reserve in Mexico,
among others.
are ecologically connected across countries. Transboundary or sub-
systems. For example, countries that have endorsed the Caribbean
Challenge (The Bahamas, Dominican Republic, Jamaica, Saint Vincent
it may take a broader, transboundary/subregional ecosystem-based
approach to accelerate progress to the desired levels. Strengthening
to ecoregional levels.
In order to expedite the process of ecologically-based MPA networks
created in 1997 the Caribbean Marine Protected Area Management
Network and Forum (CaMPAM) to “enhance of marine and coastal
area management in the Wider Caribbean Region through sharing
Research data and management experiences in the Wider Caribbean
Chapter 4
Fishermen become allies in protection efforts in the caribbean
At the 62nd Annual Conference of the Gulf and Caribbean Fisheries
Institute (GCFI) held in Venezuela in November, 2009, a Caribbean
Fisher Forum cosponsored by UNEP, CaMPAM, GCFI and others,
was attended by 25 fishers, and more than 150 marine scientists,
college students and professors, as well as staff of governmental and
nongovernmental agencies. This forum is part of a larger initiative
(http://www.gcfi.org/Initiatives/FisheriesForFishers/Fisheries
ForFishersEng.html) aimed at incorporating fishers into the regional
conservation dialogue and dissemination of best management
practices. This dialogue showed that the problems are similar and
require quick solutions to generate radical changes in the ways
coastal resources are used in the 21st century. Among the measures
and changes suggested are:
1. Grant exclusive fishing rights to traditional local fishermen in
certain “areas of responsible fishing.” This would generate a
climate conducive to self-monitoring and control of resources,
and create community management schemes that combine
sustainable fisheries and tourism.
2. Increase the number and size of no-take areas (sanctuaries and
reserves) within multiple-use managed areas (for conservation,
fisheries, tourism, etc.).
3. Train fishermen and coastal communities to better understand
the ecological functioning and value of their marine ecosystems
and the promotion of alternative (non-extractive) livelihoods.
4. Increase the added value of fishery products for boosting
competitiveness in domestic and international markets, and
increase income with less catches.
These recommendations show that fishermen and marine managers
in the Caribbean understand the need of spatial planning, and the
development of new policies are essential if the marine resources
are to be there to be available for present and future generations.
CASE STUDY
Attributes that Make the Wider Caribbean a Potential
Model for Transboundary Marine Management
There are many characteristics in the Caribbean that may facilitate scaling up to a subregional/regional approach to managing marine resources:
Similar climate and oceanographic conditions: Tropical marine currents from the Atlantic Ocean that enter the Caribbean Sea, a semi-enclosed sea, from the Atlantic Ocean flow to exit mainly along the Gulf of Mexico and Florida coast as the Gulf Stream, and The Bahamas.
One marine biogeographic province with several ecoregions: Although the region shares most marine populations (fishes, invertebrates, turtles, plants, mammals) the province is divided
into distinct eco-regions or units of connectivity due to the existence of gyres and meandering currents that retain oceanic
larvae. This ecoregional scenario may serve as a road map to develop subregional management of marine resources.
Tourism and fisheries are major industries: In most countries coastal tourism is the dominant industry, and commercial fishing is common to all of them. Coastal development and overfishing have negative impacts throughout the region. Restoring and maintaining the ecological services of coastal habitats and populations is essential to the economic prosperity of most nations.
Few languages: English and Spanish are the dominant languages, although French, Dutch, Creole and Papiamento are also spoken in some islands. Communication is easier than in many other regions of the world.
Similar historical and cultural heritage: Similar patterns of colonialism and impacts of the slave trade shaped the formation of the Caribbean culture in the 16th-18th centuries.
Geographic closeness: 38 Countries and Territories with approximately 5.8 million km2 of combined Economic Exclusive Zones.
A regional intergovernmental agreement for coastal and marine resources: The Cartagena Convention and its Protocols provide a legal framework to address issues for the protection and sustainable development of the marine environment, facilitate funding acquisition and foster regional cooperation.
44

ecoregional levels requires a recipe with some or all of the following
that MPAs are not solely closed, no-take zones but are “marine
value of healthy marine ecosystems; and strengthening managers
of having “integrated coastal managed zones”, a dream of the 20th
Meeting Global Goals at Regional Scales and in the High Seas 45
Nansei ShotoEcoregion
South ChinaSea
Coral Triangle
Lesser SundaEcoregion
Andaman SeaEcoregion
Yellow Sea LargeMarine Ecosystem
Sulu-Sulawesi MarineEcoregion / Seascape
Bismark SolomonSeas Ecoregion
Map 4.2: Map of East Asian countries and
programs working on MPAs.
East Asia: How Groups are Working Together Across a Vast Ocean Area
East Asia generally comprises of two WCPA-Marine Regions, the North-
part of the southern area is recognized as the global center of marine
biodiversity, known as the Coral Triangle area (see Ch. 6 for more
world, and the majority of people live near the coast. There is a long
history of people using and depending on the ocean through trade,
these resources.
focuses on MPA networks was conducted from 2008 to 2010 by the
coral reef habitat mapping exercise done by remote sensing. One of
the most successful achievements was the upgrade of the regional
their own virtual MPA database on their website.
Regional Workshops during 2008 to 2010. The results of the discussions
ICRI
. The document
focused on the development of a sustainable regional support
and a series of socioeconomic guidance on MPA network development
Fishing community near the Ang Thong National Park, Thailand © Imèn Meliane

Meadows of Posidonia oceanica are one of the most emblematic and endangered ecosystems in the Mediterranean sea. © Jose Antonio Moya
The Mediterranean1: Building a Regional Picture Combining Knowledge from Disparate Sources
1 More information can be found in The Mediterranean and Black Sea Region: Celebrating successes and addressing challenges in marine protected areas. Vol. 1
in Protect Planet Ocean Review Series. 2009. IUCN, and in Abdulla, A., Gomei, M., Maison, E. and Catherine Piante (2008). Status of Marine Protected Areas in the Mediterranean Sea. IUCN, Malaga and WWF, France.
Chapter 446
Considering its small dimension (less than 1% of the world’s ocean
areas; The Mediterranean Sea includes 6% of the world’s species in
less than 1% of the world’s ocean area, and while much of the fauna
It contains 46,000 km of coastline and about 2.5 million km2 of sea.
Within its waters live 20 species of marine mammals (including the
of jobs, revenue and food supply and is an important component
of the Mediterranean diet – having been one of the pillars of the
industry faces other problems such as poor knowledge of the biology
Mediterranean has been rising steadily over the past 10 years and is
projected to increase by a further 18% over the next 10 years. The
biodiversity. This sector is growing rapidly and is expected to become
increasing throughout the Region. The Mediterranean also remains
the region every year, over 100 million visit Mediterranean beaches.
Mass tourism has led to degraded landscapes, soil erosion, increased
waste discharges into the sea, loss of natural habitats, higher pressure
Other threats to the marine environment are invasive marine species
and climate change. Many of these threats can be addressed, at least
protected areas.
Soundings. Meghan Miller, Walter H.F. Smith, John Kuhn, & David T. Sandwell. NOAA Laboratory for

Meeting Global Goals at Regional Scales and in the High Seas 47
The Mediterranean Region is on par with other regions of the world
with ~1% of their marine area protected (Table 4.1); however that
number jumps to ~4% if the Pelagos Sanctuary2
seas MPA, is included. Though this is far less than the 10% target set by
Pelagos, and are mainly located in the northern shores of the
and spacing between protected sites too wide to ensure larval
equipments such as boats, visitor centres, and diving equipment.
various means, including the CBD commitments and the Barcelona
Increase and accelerate MPA development,
Develop a coherent, viable network of MPAs through regional
networks,
issues, and
include an ecosystem based approach.
aligning data needed to be managed. To that end, IUCN embarked on a
regional MPA analysis of this region (IUCN, 2009; Abdulla et al 2008),
and detail, even between databases that were thought to be similar
(i.e. WDPA and MPA Global). To address the diversity in available
available (i.e. ProtectPlanetOcean, MedPan, WDPA, and MPA Global).
Countries on a regular basis.
2 The Pelagos Sanctuary for Mediterranean Marine Mammals is a vast marine protected area extending over 87,500 km2 of sea surface in a portion of the
north-western Mediterranean Sea between south-eastern France, Monaco, north-western Italy and northern Sardinia, and encompassing Corsica and the
Tuscan Archipelago. The Sanctuary waters include the Ligurian Sea and parts of the Corsican and Tyrrhenian Seas, and contain territorial waters of France, Monaco and Italy, as well as the adjacent high seas.
database cannot be overstated. In a region with 23 countries, more
than 20 languages, and nearly 300 million people dependent on a
upfront costs.
PlanetOcean, 2010; MedPan 2010; MPA Global 2009) were compared
and contrasted. A hierarchy was created with the most current and up-
to-date database used as a base (MedPan) and compared to the world
to WDPA to upload.
management, however it became clear that there were so many
inconsistencies between data sources that only a line by line
world with the most up to date and accurate MPA data yet. Currently,
which was launched at the regional level between regional partners
a common database of MPAs which will be linked with ProtectedPlanet
(the newest version of the WDPA).
With one globally approved database for protected areas (WDPA), it is
involves the key stakeholders, allowing for a wide range of input and, in
Red gorgon in Cap de Creus, Spain. © Jose Antonio Moya

Chapter 4
West Africa: High Level Government Collaboration
Increasing pressure on coastal and marine resources has led to the
of cultural heritage.
The West African marine region extends southwards from Morocco to
South Africa; it spans 14 000km of coast and includes 24 countries.
and broad sandy beaches to extensive sea grass beds, island systems,
wetlands and coastal lagoons (Figure 4.1).
For several years, seven countries (Mauritania, Senegal, Guinea
Bissau, The Gambia, Cape Verde, Guinea and Sierra Leone) have
the major concern in the region and has led to important declines in
with the oil and gas and mining industries.
Most striking biodiversity features in the region are: the largest
breeding colony of monk seals on Earth, one of the 10 top global hot
and whales. Due to the cold water upwelling zones, this region is
Fishing boats along the coast between Nouakchott and the Banc d’Arguin National Park in Mauritania. © Hellio - Van Ingen
48

Meeting Global Goals at Regional Scales and in the High Seas 49
The challenges arising from strong ecological, social and economic
common issues related with the sustainable management of coastal
and marine resources (FIBA/WWF/UICN 2000).
network of marine protected areas at the regional level is considered
the highest priority in the joint strategy (PRCM 2003). This strategy was
3) which is being
4
RAMPAO seeks to enhance cohesion within a group of ecologically
mutual capacity building and advocacy on common issues in the region
One of the key success factors for RAMPAO network is the high level
recognizes the need to establish a regional network of MPAs in West
Africa was signed by 10 ministries in charge of protected areas,
of the network, this was formally recognized through a ministerial
3 Regional program for the conservation of the coastal and marine zone in West
Africa (French acronym PRCM)4 IUCN, International foundation for the Banc d’Arguin FIBA, WWF and Wet-lands International
Today the RAMPAO includes 22 MPAs from 5 countries (Mauritania,
Senegal, The Gambia, Guinea Bissau and Guinea), including a wide
range of management categories and governance types. The network
covers 18,867 km2, which represents more than 92% of the total area
More than 70% of the total RAMPAO area is marine, however this
represents only about 7% of the total territorial waters and only about
0.7% of the total EEZ. In fact some countries have already achieved
case for Mauritania where more than 32% of the territorial waters
are within the MPA network or Guinea Bissau with around 12% and
Senegal with almost 10% (Fig. 4.1).
represented ecosystem in the network, followed by humid forests, sea
Planned next steps for the RAMPAO include the analysis of the
policies;
member MPAs;
the MPAs and the MPAs network; and
network.

Chapter 4
The United States: Building a Systematic Network With a Scientific Base
Although the United States is a single country, its EEZ is the largest in
the world, spanning over 12 million km2, including all of its overseas
territories, and can therefore be an example of scaling up to a large-
of Marine Protected Areas of the United States of America
natural events, and other sources straining the health of marine
ecosystems and the Great Lakes. Impacts to these intricately balanced
reefs and other vital habitats, threats to rare or endangered species,
With such a large area, a system was needed coordinate the diverse
are over 1,600 federal, state and territorial MPAs in U.S. waters. The
National System Sites At A Glance
The national system contains 254 sites and covers an area of
175,000 square miles
4% of U.S. waters (0-200 nautical miles, including estuarine areas and the Great Lakes) is covered by the national system
sites
About 27% of the total area of all national system sites is considered no-take, and this is primarily located in the large, highly protected Papahanaumokuakea Marine National Monument in Hawaii
All 21 of the national system’s priority conservation objectives are addressed by national system members
Every major marine ecoregion in the U.S. is represented in the national system
A Marina and Golf Course sit along the San Francisco Bay. The Coyote Point Marina, the Poplar Creek Golf Course and a power substation are just some of the uses for the heavily developed shore along the San Francisco Bay near San Mateo, California.© Gerick Bergsma
50

Meeting Global Goals at Regional Scales and in the High Seas 51
natural heritage, conserving and managing cultural heritage, and
system sites, the U.S. Fish and Wildlife Service manage 106 sites (42%).
agencies, while 37% are managed by state agencies. The remainder is
managed by federal/state partnerships or territories.
America
commitments, such as those made at the 2002 World Summit on
and Mexico, coordinated by the Commission for Environmental
Protocol Concerning Specially Protected Areas and Wildlife (SPAW
in Hawaii, a zoned site that has eleven no-take zones covering
approximately 44,000 square miles, makes up nearly all of the no-take
no-take.
and access data for more than 1,000 marine protected areas (MPAs)
in the United States (www.mpa.gov). The tool provides an interface
through technical assistance, training, and a new partnership with the
on ecologically important areas and human uses of the ocean. These
States by Ecoregion
Oyster reefs in the Virginia coastal reserve. © Robert Brumbaugh

Chapter 4
The South Pacific: Local Uptake at a Regional Scale
as a major source of protein, further increasing the demand for this
2009).
the ecosystem approach and marine protected areas, have been
the mountaintops to the reef (such as the ahupua’a in Hawaii, vanua in
classes of persons. Closed areas include the tabu areas of Fiji, Vanuatu
the bul in Palau, the mo in the Marshall Islands, the kapu in Hawaii and
the fono in Niue (Govan et al. 2008a, Parks & Salafsky 2001, Vierros et
al. 2010).
put in place to ensure catches for special events or as a cache for
some 10,000 kilometres from east to west and 5,000 kilometres from
north to south, with a combined EEZ close to 38.5 million km². The region
represents one of the most biologically and culturally diverse areas on
rich coastal and marine ecosystems including mangroves, seagrass
beds, coral reefs and estuaries, as well as extensive deep waters in their
cultural and economic dependence on marine and terrestrial resources
for daily needs such as food, water, shelter and medicine, and much of
the use and management of resources is arranged through customary
tenure systems that cover over 81-98% of land areas in independent
marine tenure is also common, with seaward boundaries ranging from
not only for social and economic development, but is also supported in
next 30 years), which combined with poor economic performance
and poverty in some areas increases pressures on natural resources.
Namena Reserve Fiji - Namenalala Island, at the heart of the Namena Marine Reserve, Kubulau, Fiji © Stacy Jupiter
52

Meeting Global Goals at Regional Scales and in the High Seas 53
Quick Facts About LMMAs
: The main driver leading to the establishment of LMMAs is a community desire to maintain or improve livelihoods,
often related to perceived threats to food security or local economic revenue. In the Pacific Island countries, conservation and sustainable use are
often seen as inseparable, and are part of the surviving concept of traditional environmental stewardship, in which caring for resources is a duty
towards future generations. In general, LMMAs have succeeded in creating economic benefits for communities while providing for sustainable use
of marine resources.
In Fiji, monitoring has demonstrated the real impact of the approach in economic terms, including increased harvests and sustainability of marine
resources. Results since 1997 have included a 20-fold increase in clam density in the tabu areas; average of 200-300% increase in harvest in adjacent areas; tripling of fish catches; and 35-45% increase in household income (Aalbersberg et al. 2005).
LMMA Size: varies widely from small to relatively large (the largest LMMAs, Macuata and Yadua Taba in Fiji, cover an area of more than 1000 km2
each).
: Generally small (less than 1.0 km2). Not permanent, opened to harvest occasionally (for example on special occasions, such as
major feasts) or regularly, (for example as part of annual rotation). The smaller reserves may be well suited for meeting fisheries, livelihoods and
community engagement goals, as evidenced by the documented increases in resources within closed areas.
Biodiversity benefits: Localized recovery or protection of vulnerable species (large food fish or marine turtles).
Future management: Attainment of broader biodiversity and resilience-building goals would likely require the integration of LMMA approaches into
wider ecosystem-based management that incorporates entire watersheds and operates in the context of adaptive management (Govan et al. 2009).
& Hickey, 2008; Vierrros et al. in press). These revitalized customary
economic changes (Johannes & Hickey, 2004). One aspect of this has
An example is provided by Locally Managed Marine Areas (LMMAs)
as a Marine Protected Area (MPA) in that LMMAs are characterized
by local ownership and/or control, whereas MPAs are typically
food species or small amounts of coral or shells”). One or more MPAs
or other management techniques or “tools”, including commonly a
knowledge and western science (LMMA network, 2010).
According to a recent study (Govan et al. 2009), marine managed
independent countries and territories, and they are virtually the only
type of marine protected area pursued in the independent countries
territories are using more western-style protected area approaches.
resources management. For example, Papua New Guinea, Vanuatu, Fiji
not always without challenges, as demonstrated by a recent study
management rules in Kubulau District, Fiji (Clarke & Jupiter, 2010).
biodiversity strategies. Because they are built on customary tenure
and similar approaches are likely to be more successful in providing

Chapter 4
marine and coastal protected area (MCPA) encompasses LMMAs and
54
Advancing Conservation of the Open Oceans and Deep Seas Within and Beyond National JurisdictionIntroduction to deep and open oceans
The open oceans and deep seas cover more than half of the planet
and account for the largest part of the ocean. Of that vast area, the
areas contain not only the majority of ocean by volume, but also
migratory species such as cetaceans, turtles, tuna and seabirds, and
biodiversity, they contribute to the provision of important ecosystem
Earth’s climate.
concentrated in coastal and shelf areas where both knowledge of and
deeper areas has increased manifold, leading to growing threats from
knowledge about the deep sea, unveiling an important array of unique
Rising concerns about risks to biodiversity in marine areas beyond
the need to conserve and sustainably manage these remote ocean
ocean areas has been limited by our incomplete knowledge about how
and where species and their habitats are distributed geographically,
though this knowledge will likely be greatly enhanced by studies
Recent scientific activities for improved management
sustainable use of underrepresented deep and open ocean areas,
The UNGA ad hoc open-ended informal working group to study issues
areas, the development of systems of MPAs and biogeographic
Protection Progress In The Region
On average, between 3 and 4% of territorial seas are protected in the region, with Fiji and New Caledonia reaching 10% and 24% protection
respectively. Marine managed area coverage represents under 0.2% of the combined national EEZs, and only Fiji (0.8%) and New Caledonia
(0.9%) are within reach of the global average of 1.5% of EEZ protected (Govan et al. 2009).
While most LMMA sites are located in clusters, networks or groupings, the sites have been mainly selected with social, logistical or political
factors in mind, rather than according to ecological criteria. Although some ecologically-based LMMA networks exist, they are a minority. This
is due to the fact that bottom-up approaches do not lend themselves very easily to external planning guidance, and selecting sites based on
geospatial data can be costly particularly if the established sites have to rely on incentives or investments of external resources to survive
(Govan et al. 2009, Ruddle & Hickey, 2008).
The strength of community-based approaches in the Pacific Islands is their sustainability, adaptive nature, and ability to enhance community
resilience and self-sufficiency in a time of change. While these approaches alone are likely not enough to develop ecologically representative
regional networks, particularly in the deeper ocean, they provide building blocks that can be integrated into wider national and regional
strategies, as has already been done in the context of national marine protection efforts in at least Palau, the Federated States of Micronesia,
Fiji and Samoa. Strengthening LMMAs and other traditional marine management systems in the context of national strategies relating to
biodiversity conservation, fisheries management, climate change adaptation and poverty alleviation are particularly important at a time when
many MPAs established through top-down processes have failed to reach their management objectives, and are in danger of becoming paper
parks.
coverage is lacking, as many countries do not maintain up-to-date
Database on Marine Protected Areas) do not always include smaller,
2010).

Meeting Global Goals at Regional Scales and in the High Seas 55
Baseline *12 nM *24 nM
Territorial Sea(Art. 3 and 4)
Contiguous Zone(Art. 33)
*200 nM
Exclusive Economic Zone(Art. 57)
Continental Shelf(Art. 76)
High Seas (Art. 86)
The Area (Art. 1(1) and 137)
* up to The Area starts at 200 nM from the baseline when the legal Continental Shelf (as defined in Art. 76) does not extend beyond that limit.
approach, and in delivering the 2010 target.
decision, the COP also adopted guidance for the establishment of
at a CBD expert workshop in the Azores in 2007, and are as follows:
1. Uniqueness or rarity
2. Special importance for life history of species
3. Importance for threatened, endangered or declining species and/
or habitats
4.
5.
6. Biological diversity
7. Naturalness
Advice on the use of the criteria has been further developed by an
in applying the criteria, as described in the box below.
The EBSA criteria of the CBD could also be applied in deep waters
an EBSA marine area could overlap and cover both marine areas within
A biogeographic classification system for deep and open oceans
open oceans globally.
The box below describes the Global Open Oceans and Deep Seabed
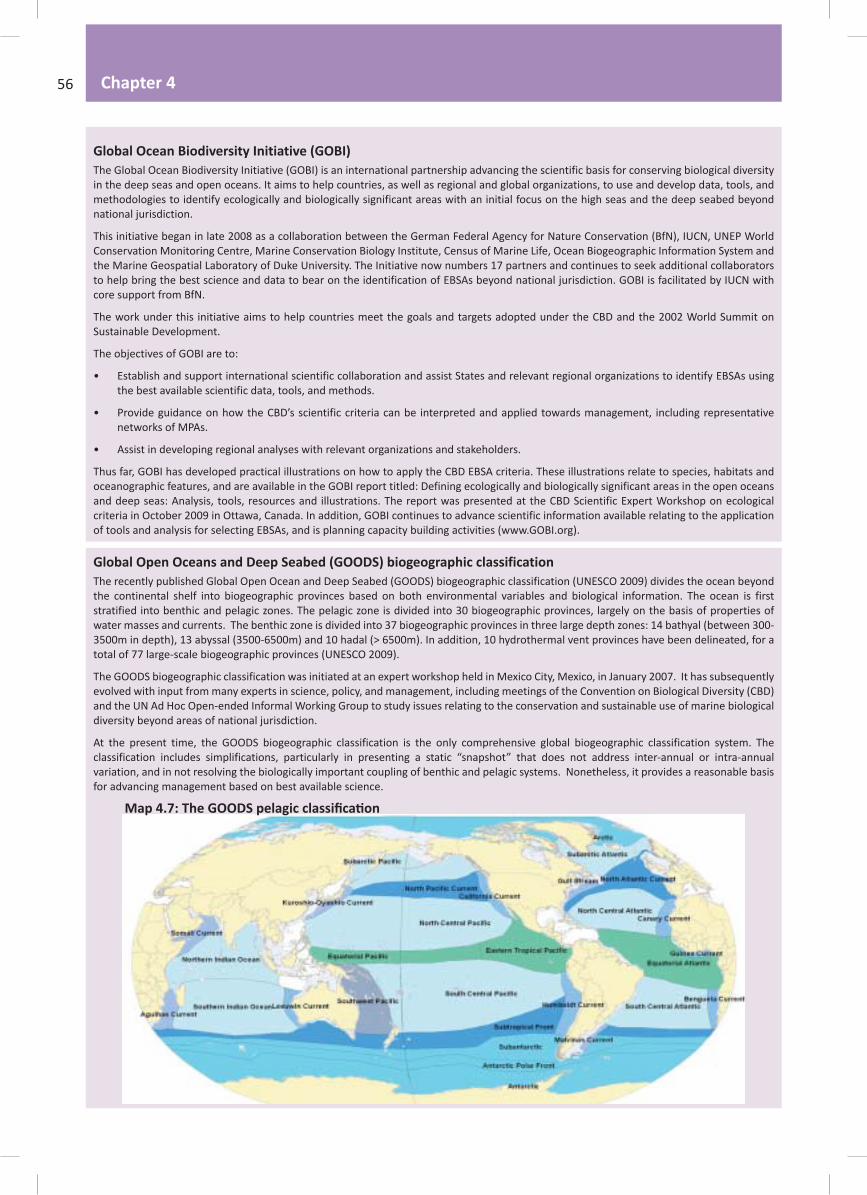
Chapter 456
The recently published Global Open Ocean and Deep Seabed (GOODS) biogeographic classification (UNESCO 2009) divides the ocean beyond
the continental shelf into biogeographic provinces based on both environmental variables and biological information. The ocean is first
stratified into benthic and pelagic zones. The pelagic zone is divided into 30 biogeographic provinces, largely on the basis of properties of
water masses and currents. The benthic zone is divided into 37 biogeographic provinces in three large depth zones: 14 bathyal (between 300-
3500m in depth), 13 abyssal (3500-6500m) and 10 hadal (> 6500m). In addition, 10 hydrothermal vent provinces have been delineated, for a
total of 77 large-scale biogeographic provinces (UNESCO 2009).
The GOODS biogeographic classification was initiated at an expert workshop held in Mexico City, Mexico, in January 2007. It has subsequently
evolved with input from many experts in science, policy, and management, including meetings of the Convention on Biological Diversity (CBD)
and the UN Ad Hoc Open-ended Informal Working Group to study issues relating to the conservation and sustainable use of marine biological
diversity beyond areas of national jurisdiction.
At the present time, the GOODS biogeographic classification is the only comprehensive global biogeographic classification system. The
classification includes simplifications, particularly in presenting a static “snapshot” that does not address inter-annual or intra-annual
variation, and in not resolving the biologically important coupling of benthic and pelagic systems. Nonetheless, it provides a reasonable basis
for advancing management based on best available science.
The Global Ocean Biodiversity Initiative (GOBI) is an international partnership advancing the scientific basis for conserving biological diversity
in the deep seas and open oceans. It aims to help countries, as well as regional and global organizations, to use and develop data, tools, and
methodologies to identify ecologically and biologically significant areas with an initial focus on the high seas and the deep seabed beyond
national jurisdiction.
This initiative began in late 2008 as a collaboration between the German Federal Agency for Nature Conservation (BfN), IUCN, UNEP World
Conservation Monitoring Centre, Marine Conservation Biology Institute, Census of Marine Life, Ocean Biogeographic Information System and
the Marine Geospatial Laboratory of Duke University. The Initiative now numbers 17 partners and continues to seek additional collaborators
to help bring the best science and data to bear on the identification of EBSAs beyond national jurisdiction. GOBI is facilitated by IUCN with
core support from BfN.
The work under this initiative aims to help countries meet the goals and targets adopted under the CBD and the 2002 World Summit on
Sustainable Development.
The objectives of GOBI are to:
Establish and support international scientific collaboration and assist States and relevant regional organizations to identify EBSAs using
the best available scientific data, tools, and methods.
Provide guidance on how the CBD’s scientific criteria can be interpreted and applied towards management, including representative
networks of MPAs.
Assist in developing regional analyses with relevant organizations and stakeholders.
Thus far, GOBI has developed practical illustrations on how to apply the CBD EBSA criteria. These illustrations relate to species, habitats and
oceanographic features, and are available in the GOBI report titled: Defining ecologically and biologically significant areas in the open oceans
and deep seas: Analysis, tools, resources and illustrations. The report was presented at the CBD Scientific Expert Workshop on ecological
criteria in October 2009 in Ottawa, Canada. In addition, GOBI continues to advance scientific information available relating to the application
of tools and analysis for selecting EBSAs, and is planning capacity building activities (www.GOBI.org).
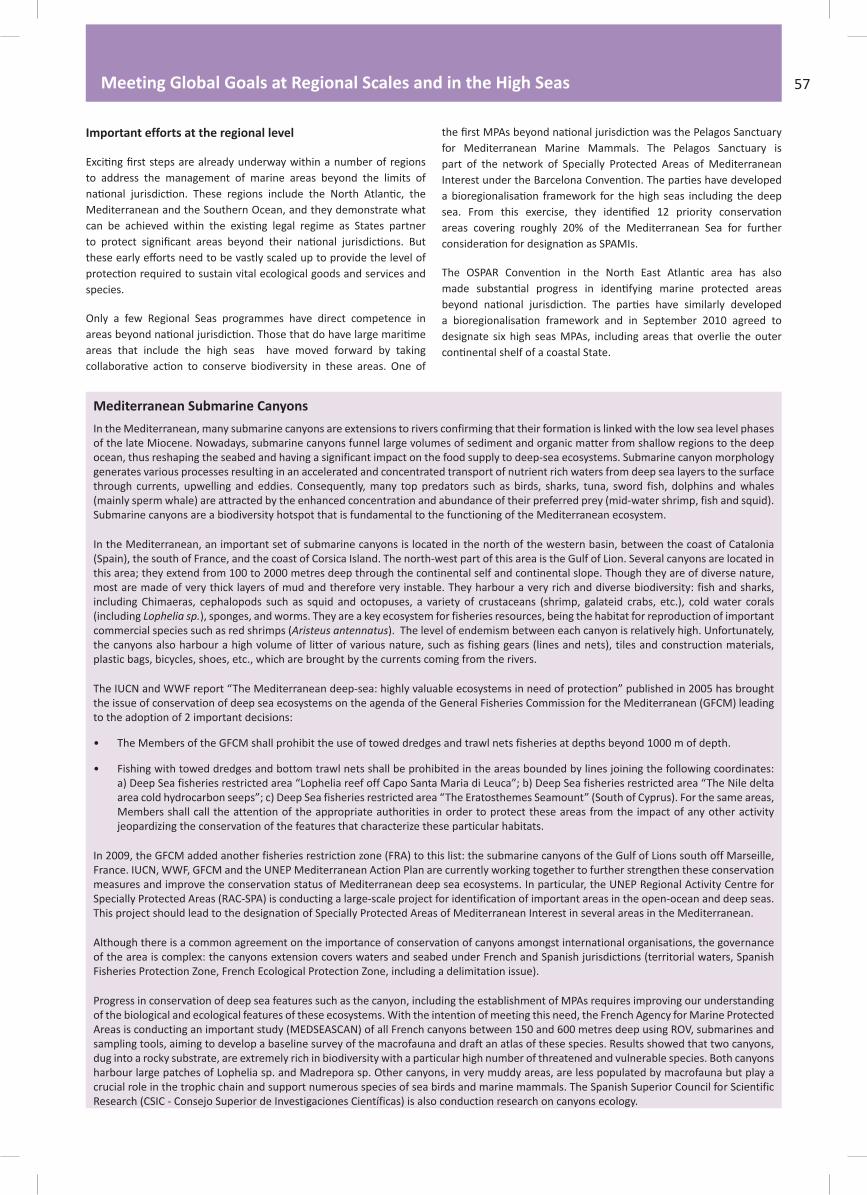
Meeting Global Goals at Regional Scales and in the High Seas 57
Important efforts at the regional level
to address the management of marine areas beyond the limits of
Mediterranean and the Southern Ocean, and they demonstrate what
species.
Only a few Regional Seas programmes have direct competence in
areas that include the high seas have moved forward by taking
for Mediterranean Marine Mammals. The Pelagos Sanctuary is
part of the network of Specially Protected Areas of Mediterranean
areas covering roughly 20% of the Mediterranean Sea for further
designate six high seas MPAs, including areas that overlie the outer
Mediterranean Submarine Canyons
In the Mediterranean, many submarine canyons are extensions to rivers confirming that their formation is linked with the low sea level phases of the late Miocene. Nowadays, submarine canyons funnel large volumes of sediment and organic matter from shallow regions to the deep ocean, thus reshaping the seabed and having a significant impact on the food supply to deep-sea ecosystems. Submarine canyon morphology generates various processes resulting in an accelerated and concentrated transport of nutrient rich waters from deep sea layers to the surface through currents, upwelling and eddies. Consequently, many top predators such as birds, sharks, tuna, sword fish, dolphins and whales (mainly sperm whale) are attracted by the enhanced concentration and abundance of their preferred prey (mid-water shrimp, fish and squid). Submarine canyons are a biodiversity hotspot that is fundamental to the functioning of the Mediterranean ecosystem.
In the Mediterranean, an important set of submarine canyons is located in the north of the western basin, between the coast of Catalonia (Spain), the south of France, and the coast of Corsica Island. The north-west part of this area is the Gulf of Lion. Several canyons are located in this area; they extend from 100 to 2000 metres deep through the continental self and continental slope. Though they are of diverse nature, most are made of very thick layers of mud and therefore very instable. They harbour a very rich and diverse biodiversity: fish and sharks, including Chimaeras, cephalopods such as squid and octopuses, a variety of crustaceans (shrimp, galateid crabs, etc.), cold water corals (including Lophelia sp.), sponges, and worms. They are a key ecosystem for fisheries resources, being the habitat for reproduction of important commercial species such as red shrimps (Aristeus antennatus). The level of endemism between each canyon is relatively high. Unfortunately, the canyons also harbour a high volume of litter of various nature, such as fishing gears (lines and nets), tiles and construction materials, plastic bags, bicycles, shoes, etc., which are brought by the currents coming from the rivers.
The IUCN and WWF report “The Mediterranean deep-sea: highly valuable ecosystems in need of protection” published in 2005 has brought the issue of conservation of deep sea ecosystems on the agenda of the General Fisheries Commission for the Mediterranean (GFCM) leading to the adoption of 2 important decisions:
The Members of the GFCM shall prohibit the use of towed dredges and trawl nets fisheries at depths beyond 1000 m of depth.
Fishing with towed dredges and bottom trawl nets shall be prohibited in the areas bounded by lines joining the following coordinates: a) Deep Sea fisheries restricted area “Lophelia reef off Capo Santa Maria di Leuca”; b) Deep Sea fisheries restricted area “The Nile delta area cold hydrocarbon seeps”; c) Deep Sea fisheries restricted area “The Eratosthemes Seamount” (South of Cyprus). For the same areas, Members shall call the attention of the appropriate authorities in order to protect these areas from the impact of any other activity jeopardizing the conservation of the features that characterize these particular habitats.
In 2009, the GFCM added another fisheries restriction zone (FRA) to this list: the submarine canyons of the Gulf of Lions south off Marseille, France. IUCN, WWF, GFCM and the UNEP Mediterranean Action Plan are currently working together to further strengthen these conservation measures and improve the conservation status of Mediterranean deep sea ecosystems. In particular, the UNEP Regional Activity Centre for Specially Protected Areas (RAC-SPA) is conducting a large-scale project for identification of important areas in the open-ocean and deep seas.
This project should lead to the designation of Specially Protected Areas of Mediterranean Interest in several areas in the Mediterranean.
Although there is a common agreement on the importance of conservation of canyons amongst international organisations, the governance of the area is complex: the canyons extension covers waters and seabed under French and Spanish jurisdictions (territorial waters, Spanish Fisheries Protection Zone, French Ecological Protection Zone, including a delimitation issue).
Progress in conservation of deep sea features such as the canyon, including the establishment of MPAs requires improving our understanding of the biological and ecological features of these ecosystems. With the intention of meeting this need, the French Agency for Marine Protected Areas is conducting an important study (MEDSEASCAN) of all French canyons between 150 and 600 metres deep using ROV, submarines and
sampling tools, aiming to develop a baseline survey of the macrofauna and draft an atlas of these species. Results showed that two canyons, dug into a rocky substrate, are extremely rich in biodiversity with a particular high number of threatened and vulnerable species. Both canyons harbour large patches of Lophelia sp. and Madrepora sp. Other canyons, in very muddy areas, are less populated by macrofauna but play a crucial role in the trophic chain and support numerous species of sea birds and marine mammals. The Spanish Superior Council for Scientific Research (CSIC - Consejo Superior de Investigaciones Científicas) is also conduction research on canyons ecology.

Chapter 458
ESPA A
FRANCE
CANYONBOURCART
CANYONLACAZE - DUTHIERS
CANYONPRUVOT
CANYONCABO CREUS
CANYONCASSIDAIGNE
CANYONMARTI
CANYONDE SÈTE
CANYONDU PETIT-RHÔNE
CANYONDE MONTPELLIER
CANYONDU GRAND-RHÔNE
CANYONDU PLANIERCANYON
DE MARSEILLE
MARSEILLE
-100
-200
GOLFE DU LION
highlights a complexity in managing high seas MPAs—responsibility
sovereign rights over the sedentary and non-living resources of their
the water column beyond the territorial sea or EEZ is high seas, it is
management responsibility for the seabed below.
Resources (CCAMLR) has now adopted broad-scale bioregional
of marine protected areas will now be focused. CCAMLR established a
Sectoral advances
capacity to adopt binding measures to protect biodiversity including
be applied to protect species, habitats and ecosystems in the high seas
In 2006, responding to global concern over the impacts of unregulated
called for three important new requirements for “vulnerable marine
had been taken (UNGA Res. 61/105 (paragraphs 80-93)).

Deep Sea Coral Community © Alberto Lindner
Meeting Global Goals at Regional Scales and in the High Seas 59
take measures to implement these requirements, including criteria
Various RFMOs have as a result closed areas where VMEs are known
prototype, it is now developing an environmental management plan
to nine “areas of environmental interest” from the impacts of mining
impact assessments.
areas that could be applied to the high seas. These include discharge
routeing measures. The IMO already has adopted criteria similar to
Future needs
subject to environmental impact assessment (EIA) processes, and
and geographic contexts. A requirement for States to perform
approaches such as ecosystem-based management, marine protected
Towards implementation of MPAs in the high-seas
deep ecosystems; when they will have both research and knowledge
also supposed to get the support of and to integrate the sea users and
professionals in the management system.
on the governance of ocean resources and the need to jointly tackling,
need to advance ecosystem-based principles across board and resolve
some gaps and mismatches in the various instruments for ocean
managements.

Artisanal Fishermen, Patagonia, Chile ©Tom Crowley

Chapter 5Climate Change – a Challenge and an Opportunity
Lead Authors: Dan Laffoley, Dorothée Herr and Jerker Tamelander
Contributing Authors: Scott Smith, Emily Pigeon and Elizabeth Moore
Key Messages:
Climate change is already affecting the ocean in many different ways and the scale and extent will continue to increase as effects take hold.
By protecting important habitats and ecosystem functions, MPAs can provide the foundation for ecosystem-based mitigation and adaptation strategies.
The role of coastal marine habitats as effective carbon sinks provides a new reason why greater action should be taken to increase management coverage of MPA networks in these areas as part of an effective strategy to tackle climate change.
Important changes in the way that MPAs are designed, managed, and governed are needed to assure they are resilient in the face of climate change impacts and effective in playing this role.

Chapter 5
Introduction
of greenhouse gases leads to increasing average temperature of both
the lower atmosphere and the surface ocean, which in turn changes
Earth’s climate system and disrupts ecological processes and the
provision of ecosystem services.
The challenge is how to secure the diversity of wildlife and habitats
in the ocean, and the values they provide humanity, in the face of
one hand this calls for reducing and eventually stabilizing atmospheric
greenhouse gases at a safe level. On the other hand it means changing
how MPAs and MPA Networks are viewed, created and managed.
This is to ensure they can meet the threats associated with climate
MPAs therefore need to take climate change impacts into account to
2010).
Climate Change Impacts, Ocean Acidification, and MPAs
: A warming ocean impacts marine
species in numerous ways, such as changes in geographical range,
marine food webs. Changes to any part of the web can cause cascading
al. 2005).
taking place too quickly for species and ecosystems to adapt, local
that they are adapted to live near the upper physiological limit of their
temperature range (Gitay et al. 2002). Even slight, temporary warming
events can lead to coral bleaching, disease and even widespread
Antarctica © Dorothée Herr
62

Climate Change – a Challenge and an Opportunity
mortality (Hoegh-Guldberg 1999; 2005; Wilkinson 2008; Muller et al.
: Coastal areas will increasingly experience habitat loss
due to sea-level rise and severe storms events. Due to rising sea
water temperature the intensity of extreme weather events such
as hurricanes, typhoons or cyclones is expected to augment (IPCC
2007; Webster et al. 2005; Hoyos et al. 2006). This will erode sandy
for seabirds and sea turtles. Other impacts include increased risk of
seawater intrusions into estuaries and freshwater habitats, adversely
processes in mangroves, thus threatening the role of mangroves in
: The spread of invasive alien species (IAS), already
worldwide (CBD 2009a), is likely to increase as a result of climate
change. The lowering of physiological barriers, e.g. as a result of
between donor and recipient areas. Further, the risks of successful IAS
establishment increases in systems that are weak or altered (Lotze et
al. 2006), including those damaged by climate change. IAS can severely
2009; McNeely et al. 2001).
: The Ocean has absorbed approximately one third of
the ability of some reef-building corals and other calcium carbonate-
dependent organisms, including some phytoplankton species and
species, with impacts possibly cascading through marine ecosystems.
: The impacts of climate change and
marine and coastal ecosystems (Keller et al. 2009; Hughes et al. 2005;
and services, on which so many people rely on for food and income.
are more likely to succumb to the impacts of rising water temperatures
suggest an opportunity for coastal resource managers to increase the
resilience of coral reefs and other ecosystems to the impacts of climate
change while the global community struggles to bring greenhouse gas
emissions under control (Hoegh-Guldberg et al. 2007; Hughes et al.
We are now building a clear picture of the nature of changes climate
is having on the ocean globally, and regional examples, such as the
UK Marine Climate Change Impacts Partnership’s latest Annual Report
Card (Baxter et al. 2010), give a clear comprehensive insight to the
scale and extent of changes now occurring in temperate waters around
MPAs and MPA Networks as a Tool for Ecosystem-Based Adapta-tion to Climate Change
exacerbate the impacts of climate change by further destroying fragile
For example, wetlands, mangroves, oyster reefs, barrier beaches and
for, more expensive infrastructure investments to protect coastal
depend.
threats that result from climate change and make ecosystems more
resistant and resilient in the face of climate change so that they can
subsistence and livelihoods. (Hale et al. 2009)
Providing a clear perspective on climate change impacts on the ocean: the UK’s Marine Climate Change Impacts Partnership Annual Report Card for 2010 - 2011.
The Marine Climate Change Impacts Partnership (MCCIP) is a UK partnership between scientists, government, its agencies, non-governmental organizations (NGOs) and industry. The principal aim is to provide a coordinating framework for the UK, so as to be able to transfer high quality evidence on marine climate change impacts, and guidance on adaptation and related advice to policy advisors and decision makers.
The 2010 – 2011 Annual Report Card (Baxter et al. 2010) provides the very latest updates on how climate change is affecting the seas. Almost 100 scientists from 40 leading UK science organisations contributed. Key messages include that: sea temperatures are generally increasing but variability between years is high; some fish distributions have moved northwards over the past 30 years by distances ranging from around 50 to 400km; climate change has contributed to a decrease by approximately 9% in the total number of seabirds breeding in the UK between 2000 and 2008; and the increasing seawater temperatures may have the potential to increase the geographical range of some harmful algal bloom species associated with Paralytic Seafood Poisoning (PSP) events.
CASE STUDY
63

MPAs and MPA networks nested within broader coastal and ocean
management frameworks are a key tool to help ecosystems remain
mangroves, reefs and barrier beaches, and helping enhance and
on these resources.
Creating Climate Resilient MPA Networks
strategies, they must themselves adapt to the impacts of climate
change. If an MPA is resilient it can rebound from or withstand
to reduce the adverse impacts of climate change, are greatly enhanced
through the design and management of connected networks rather
than individual protected areas (IUCN-WCPA 2008; Keller et al. 2009).
range of habitats and species on which ecosystem services depend,
MPAs.
the risk of losing an important habitat or community type following
a disturbance such as a bleaching episode or intense storm. The
resilience of MPA networks in the face of climate change impacts
us.
Components of a Resilient MPA Network are:
, including integrated management
strategies.
that can serve as reliable sources
nursery habitats, areas of high species diversity, areas that contain
refugia.
(both biological and ecological) should be maintained
among and between habitats to ensure larval exchange and
enhance recovery following disturbance events.
species and habitats ensures that some habitat areas and species
will be protected and remain viable given the uncertainty of
exactly where and how strong impacts of climate change will be.
The successful use of MPA networks as a tool to help reduce the
their environment should be incorporated into governance systems
that involve them in the planning, managing, decision-making,
impacts of climate change on their surrounding ecosystems, and help
them understand and support the need to manage resource use in
There is a growing body of research and experience on managing for
resilience. This experience has been summarized in a number of useful
tools that are now available to help managers and decision makers
manage in the face of change are presented at the end of this chapter
(see Box pg. 68).
Chapter 5
Lagoons of New Caledonia © Dan Laffoley
64

The Additional Value of MPAs for Carbon Sequestration
peatlands. These ecosystems inherently hold vast reservoirs of carbon,
retain such reserves. The challenge is recognizing that other carbon
sinks that could contribute and ensure that they too are subject to
mangroves, seagrasses and salt marshes – alongside their widely
demonstrated capacity for carbon storage. This is in both the biomass
of the dominant plants and the sediment below them that is similar
to carbon storage in terrestrial systems. Research shows that these
coastal systems sequester carbon in the sediment at rates up to 50
can be maintained for centuries or more: terrestrial forest systems
more typically reach a steady-state equilibrium level of carbon in the
soil within a few decades.
upon maintaining or restoring natural processes and environmental
2 already in the atmosphere.
Joaquin Delta region of California leads to emissions of 10 to 15 million
tCO2/year which represents 2.5% of California’s total annual emissions.
Currently we have a very poor understanding of the geographic extend
of these wetlands types, and their vulnerability to pressure of global
environmental change.
The carbon storage capacity of terrestrial systems has been widely
recognized for its importance in addressing climate change and
mechanisms are now being developed to reduce greenhouse gas
value the role of coastal marine systems in sequestering greenhouse
There is, therefore, a strong and immediate need to understand the
Climate Change – a Challenge and an Opportunity
Ecosystem type Standing carbon
stock (gC m-2
Total global area 12 m2
Global carbon stocks 15
Longterm rate
of carbon ac-
cumulation in
sediment
(gC m-2 y-1Plants Soil Plants Soil
Tropical forests 12045 12273 17.6 212 216 2.3-2.5
Temperate forests 5673 9615 10.4 59 100 1.4 – 12.0
Boreal forests 6423 34380 13.7 88 471 0.8 – 2.2
Tropical savannas and grasslands 2933 11733 22.5 66 264
Temperate grasslands and shrublands 720 23600 12.5 9 295 2.2
Deserts and semi-deserts 176 4198 45.5 8 191 0.8
Tundra 632 12737 9.5 6 121 0.2 – 5.7
Croplands 188 8000 16 3 128
Wetlands 4286 72857 3.5 15 225 20
Tidal Salt MarshesUnknown (0.22
reported)210
Mangroves 7990 0.152 1.2 139
Seagrass meadows 184 7000 0.3 0.06 2.1 83
Kelp Forests 120-720 Na 0.02- 0.4 0.009-0.02 na na
65

Chapter 5
Climate-Smart Marine Protected Areas: Helping MPAs Plan, Adapt, Manage, and Mitigate for Climate Change
Facing a Challenging Issue
Climate change has been acknowledged as the greatest natural threat facing the planet today. However, many protected area managers
have not been able to do as much as they would like to due to uncertainty about climate change impacts and the appropriate response
measures lack of resources, or both. To help meet this challenge for its own sites, the U.S. National Marine Sanctuary System (NMSS), part
of the National Oceanic and Atmospheric Administration (NOAA), developed a Climate-Smart Sanctuary Initiative This initiative is based on
a number of proven processes and tools already in use by the NMSS, including the management plan review process, condition reports,
sanctuary advisory councils, and performance assessment methodology. These tools have been in use for over ten years and have produced
real and extensive results in NMSS sites.
Recognizing that other MPAs outside the NMSS might also find value in such a process, the NMSS has developed a more generic version
called Climate-Smart MPAs.
Taking Action
This process was developed on the premise of certifying MPAs as “Climate-Smart” when they have taken action to meet a set of identified
standards:
Climate Change Site Scenario completed
MPA Manager, staff, and/or partners as appropriate have completed training
Advisory groups and/or stakeholders have been briefed
Climate Action Plan completed
Minimal green operating standard reached
Adapting to Different Needs
Most of this process can be adapted to the specific needs of an MPA, MPA network, agency, or nation. Ways to adapt the process include
changing or replacing the standards, and removing or altering the certification process.
Mangroves in the lagoon of Aldabra Atoll World Heritage Site © Jerker Tamelander / IUCN
66

Implications for MPA Network De-sign and Management1
MPA managers can enhance ecosystem resilience, for example, by
biodiversity from being lost as a result of isolated disturbances. By
McLeod et al. 2009). Fragmented or degraded ecosystems will require
strengthen resilience.
challenging MPA strategies and management plans. Minimizing other
human-induced impacts can strengthen the resilience of ecosystems
1 Additional and more explicit information on the design and effective manage-ment of representative and resilient protected area networks see Dudley et al. 2008, IUCN-WCPA 2008, Marshall & Schuttenberg 2006a
to climate change. MPA management responses and MPA network
design should be developed and implemented in an integrated manner
to an ever changing environment Therefore it is extremely valuable
for MPA managers to understand the possible changes on MPAs and
other pressures. Especially due to a degree of uncertainty about
climate change impacts it is extremely important to provide managers
breeding and foraging habits of highly migratory and pelagic species
(Keller et al. 2009). Where possible, terrestrial components should
expected to be future refugia (Herr & Galland 2009) and areas that
Conclusions
future.
the impacts of climate change on ocean and coastal systems and the human economies and cultures they sustain. Impacts from climate
Climate Change – a Challenge and an Opportunity
Climate change range extensions.
In eastern Tasmania, warming coastal waters due to climate change have driven range extension of the long-spined sea urchin (Centrostephanus rodgersii), which has begun catastrophic overgrazing of productive kelp beds, leading to loss of biodiversity and important rocky reef ecosystem services. Coincident with the overgrazing is heavy fishing of reef-based predators including the spiny lobster Jasus edwardsii, shifting the distribution of lobsters toward smaller size classes and dramatically reducing the abundance of large lobsters capable of preying on the sea urchin. Experiments conducted inside and outside MPAs clearly showed that, by protecting large lobsters, MPAs were able to considerably reduce survival of sea urchins and the overgrazing resulting from
their range extension (Ling et al. 2009).
CASE STUDY
Mangroves Seagrasses
Annual average global loss (km2/
year)
118 110
Equivalent tropical forest loss (km2/
year)
6600 3600
Equivalent temperate forest loss
(km2/year)
1400 770
Table 5.2: Annual and total loss of mangrove and Seagrass habitat and the equivalent areas of tropical and temperate terrestrial forest needed for longterm carbon
67
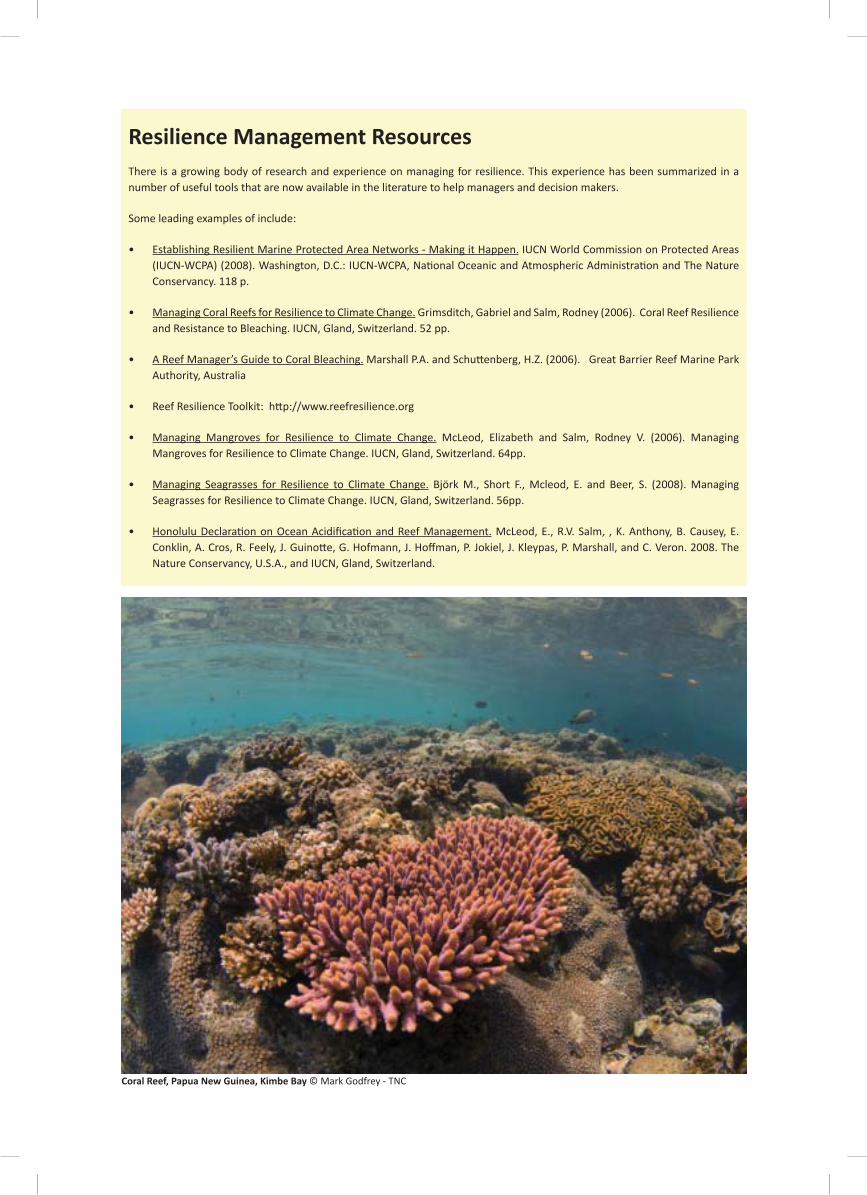
Resilience Management Resources
There is a growing body of research and experience on managing for resilience. This experience has been summarized in a
number of useful tools that are now available in the literature to help managers and decision makers.
Some leading examples of include:
Establishing Resilient Marine Protected Area Networks - Making it Happen. IUCN World Commission on Protected Areas
Conservancy. 118 p.
Managing Coral Reefs for Resilience to Climate Change. Grimsditch, Gabriel and Salm, Rodney (2006). Coral Reef Resilience
and Resistance to Bleaching. IUCN, Gland, Switzerland. 52 pp.
A Reef Manager’s Guide to Coral Bleaching.
Authority, Australia
Managing Mangroves for Resilience to Climate Change. McLeod, Elizabeth and Salm, Rodney V. (2006). Managing
Mangroves for Resilience to Climate Change. IUCN, Gland, Switzerland. 64pp.
Managing Seagrasses for Resilience to Climate Change. Björk M., Short F., Mcleod, E. and Beer, S. (2008). Managing
Seagrasses for Resilience to Climate Change. IUCN, Gland, Switzerland. 56pp.
McLeod, E., R.V. Salm, , K. Anthony, B. Causey, E.
Nature Conservancy, U.S.A., and IUCN, Gland, Switzerland.
Coral Reef, Papua New Guinea, Kimbe Bay © Mark Godfrey - TNC

Chapter 6Moving Forward Towards Networks and Broader Spatial Management
Lead Authors: Imèn Meliane, Alan White, Scott Smith, Caitlin Mullan Crain and Michael Beck
Contributing Authors: Yuko Chiba, Marjo Vierros, Anne McDonald, Richard Kenchington and Ole Vestergaard
Key Messages:
Individual MPAs are vital but not sufficient in either scale or effectiveness to achieve sustainable ocean management.
Sustainable financing mechanisms and involvement of stakeholders are needed to improve management effectiveness of MPAs.
The effectiveness of MPAs and the broader benefits they provide are greatly increased when MPAs are networked together.
The design of MPAs and MPA networks should not only consider biological and ecological criteria but also integrate the social and economic considerations.
Regional “Challenges” are proving successful in providing enabling conditions for increasing the scale, effectiveness and financing of MPA networks.
To be truly effective, MPAs must be part of a broader ecosystem-based management approach.
Marine spatial planning provides a concrete step towards the development of ecosystem-based management because it focuses on developing area-based management plans to jointly meet multiple objectives such as conservation, fishery production, transportation,
and energy extraction, and allows for addressing multiple human uses and their cumulative impacts on the ecosystem.

Chapter 6
Introduction
As previous chapters have shown, many countries and regions have
made remarkable progress in establishing MPAs and MPA networks.
MPAs have clearly accelerated over the last several years and the
protected areas remains very low, just over 1%, compared to over 12%
The current coverage of MPAs does not adequately represent all
coastal ecosystems has had limited results so far (Sale et al. 2008;
UNGA 2009). The various reports on the health of the planet and
2005; Halpern et al. 2008; Secretariat of the CBD 2010). The global
biodiversity outlook concludes that no country claims success in
report warns that the principal pressures leading to biodiversity loss
are, in some cases, intensifying (Secretariat of the CBD 2010).
Marine and coastal ecosystems are amongst the most threatened in the
to be on a downward trajectory, the pressure on coastal ecosystems
environments to provide the goods and services on which humans
depend.
Looking ahead over the next decade, the world will be facing
space and resources. Climate change impacts are expected to increase,
provided by oceans and coasts, the global community needs to build
on and accelerate success and progress towards achieving the goals of
Though global data are lacking to provide a comprehensive picture on
Policies, planning and management also need to be expanded to look
across all sectors.
improved governance and engagement with ocean stakeholders are
all key ingredients for success and need to be secured moving forward.
sustainable management of the coastal and marine environment and
resources in all areas of decision-making and in all economic sectors.
Conserving biodiversity and maintaining ecosystem services can no
Rather, it should be the underpinning to ensure that the natural capital
of marine protected areas and to make them more resilient to change.
seascapes and mainstream them in development planning.
Sea fans on the outer reef slope, Aldabra Atoll WH site © Jerker Tamelander
70

Moving Forward Towards Networks and Broader Spatial Management
Improving MPA Effectiveness
A key step in moving the MPA agenda forwards involves addressing
the widespread concern that many MPAs around the world are mostly
2006, The World Bank 2006).
and basic infrastructure and resources, which makes it hard to even
consider monitoring programs that provides necessary data to evaluate
should incorporate an assessment of the three factors (biophysical,
managers to document and monitor the performance of management
on progress to decision-makers and stakeholders (Pomeroy et al.
2004; Staub & Hatziolos 2004; Wells & Mangubhai 2007; White et al.
2006). Furthermore, when community members are involved in the
public, this can raise the visibility and credibility of an MPA team, also
support.
Engaging communities and stakeholders
focus of major disputes. In turn, a lack of support for, and compliance
of the protected area.
stakeholders and ensure a broader support for the MPA (McClanahan
et al. 2006; Pollnac et al. 2004; The World Bank 2006). Many studies
Throughout the world, experiences of community involvement in the
design, planning and management of MPAs through co-management
resources ( ) and
the Sian Ka’an Biosphere Reserve in Mexico illustrate good examples
Marine Conservation Agreements and the example of the Gili Eco Trust’s fishermen project at Gili Trawangan in Indonesia
Marine conservation agreements (MCAs) are increasingly being recognized and used by NGOs, governments, and conservation-minded businesses as adaptive mechanisms to meet ocean and coastal protection needs. They can serve to formally recognize and potentially shift governance arrangements over ocean and coastal resources.
MCAs include any formal or informal contract in which one or more parties commit to delivering explicit economic incentives in exchange for one or more other parties committing to take certain actions, refrain from certain actions, or transfer certain rights and responsibilities to achieve agreed-upon ocean or coastal conservation goals.
In 2002, the Gili Eco Trust (GET) was established to support efforts of SATGAS (a local security effort) in protecting the reefs around Gili Trawangan, one of three islands located within the Gili Marine Recreation Area off the coast of Lombok in Indonesia. Seven SCUBA dive centers at Gili Trawangan (through GET) reached an agreement with SATGAS and began collecting a small fee from each diver visiting the area. This money was initially used to help ban dynamite and cyanide fishing. In 2008, a formal agreement was signed between GET, SATGAS, the government MPA manager, and groups of local fisherman to control destructive net fishing in approximately 103 hectares of nearshore reef areas around Gili Trawangan (1.5% of the total 6,140-hectare MPA). The agreement allows net fishing in only two small areas around the island. There is a first-come, first-serve policy implemented around the island
for fishermen and SCUBA divers (if fishermen are at a site first, divers must
go elsewhere; if divers are at a site first, fishermen must go elsewhere).
Explicit incentives in the agreement include monthly direct cash payments
to seven fisher families. Explicit monetary sanctions are available to both
parties for noncompliance. The project is sustainably financed via daily diver
“donations” that go directly to GET for fishermen payments, guard salaries,
community outreach and development, and reef restoration. GET employs
local staff to patrol the area and works with MPA enforcement personnel.
Extract from Dudley, 2008
CASE STUDY
71

leasing and ownership and new roles for civil society, NGOs, tourism
and other sectors (Beck et al. 2004)(see also www.mcatoolkit.org)
Ensuring linkages to livelihood and other human benefits
The problems that MPAs and MPA networks are intended to solve are
areas, controls on level of tourism and development in an area, changes
be determined and transparently discussed with stakeholders.
discussed, they do not need to be inhibitors of a good project if the
include:
Empowerment through stronger local governance and community
decision-making.
Improved health through increased protein intake.
The strongest convincing factor in the eyes of involved stakeholders
control and watchful eye.
Moving from Isolated MPAs to MPA Systems or Networks
to scale up to “networks” of MPAs or to develop MPA systems whereby
(IUCN-WCPA 2008; UNEP-WCMC 2008). As science and experience
MPAs is being seen increasingly important. Sale et al. (2010) provides a
and provides MPA managers and others with useful guidance in
As discussed in chapter 2, depending on the governance, the term
component of marine ecosystem-based management because they
and maintenance of biological diversity and ecosystem processes. They
also provide control or reference areas against which the management
of the larger ecosystem can be evaluated.
very large MPA, may form part of a more integrated system of ocean
Chapter 6
MPA networks
Papua New Guinean villagers in a dugout canoe at Tarobi village in Kimbe Bay, Papua New Guinea. Mark Godfrey © 2008 The Nature Conservancy
72

primary stakeholders within and surrounding the areas of concern
of the MPAs at a network scale
outset, but in many cases involves a progression from individually well
designed and protected MPAs to network scale of management. This
shown in Figure 6.2 (IUCN-WCPA 2008):
In many cases opportunism is used as a strategy to establish MPAs
Scaling Up – Regional Approaches to Fostering Political Will, Sustain-able Finance, Capacity and Ac-countability
It is encouraging to note that over the last few years, an increasing
Just in the last several years, a growing number of coastal countries
a blueprint for sustainable development for coastal and marine areas
Western Europe, Australia and New Zealand, Thailand, Belize, Costa
Moving Forward Towards Networks and Broader Spatial Management
The Japanese Concept of Satoumi in Ecosystem-Based Management of Coastal Areas
The Japanese concept of “satoumi” is centred on providing benefits to both people and biodiversity through culturally specific methods of implementing the ecosystem approach in a coastal context. As recognized in the CBD ecosystem approach, humans with their cultural diversity are an integral component of many ecosystems, and thus management activities will need to benefit both biodiversity and human communities. In Japanese, “Sato” means the area where people live, while “Umi” means the sea. When “satoumi” is restored in coastal waters, marine productivity and biodiversity are enhanced through the involvement of, and in harmony with, people. Achievement of satoumi relies on a long cultural heritage of fisheries knowledge and management, and an understanding of the interactions within and between ecosystems and human communities in the coastal zone.
Satoumi is an extension of the concept of “satoyama”, which is a traditional a rural practice of resource management in hilly or mountainous areas. Satoyama has long been practiced in Japan and has not only been the subject of numerous academic publications, but is also a key element of government policies and civil society activities in the last twenty years. Satoumi is a more recent concept based on traditional management methods, and is an attempt to apply the essence of satoyama to coastal areas and communities.
The concept of satoumi was originally introduced as an attempt to restore coastal seas that have been affected by marine pollution and associated impacts, such as eutrophication and red tides, particularly in an area called the Seto Inland Sea. This area, renowned for its biodiversity and scenic beauty, and celebrated in some of the earliest Japanese poetry, has experienced rapid environmental deterioration since the 1950s. Concerned citizens and fishermen in the area organized protests to fight against pollution and large-scale development, which accounted for one of the very first citizens’ environmental movements in Japan. This resulted in a partnership of local government bodies and experts to revive the ocean under the slogan “let’s transform Seto Inland Sea into Satoumi”. The partnership has produced a number of concrete measures aimed at achieving positive environmental outcomes.
Satoumi is unique in addressing highly populated coastal areas, such as the Tokyo Bay area. In the Tokyo Bay, large human populations cause a significant pollution load into the sea, while water purification is limited due to the lack of natural coast. Satoumi-based efforts have been undertaken by local residents and communities to improve water quality through various means, including through the use of oyster cultivation for water purification. By increasing the number of living and filter-feeding organisms ingesting nutrients from the land, the project aims to restore water quality in the Tokyo Bay. As the population densities in coastal areas increase, these types of efforts are transferable to many highly populated areas in Asia and globally.
Unlike many management practices based on traditional cultural heritage, satoumi has been incorporated into Japanese national policies, including the Strategy for an Environmental Nation in the 21st Century (2007), the Third National Biodiversity Strategy of Japan (2007), and the Basic Plan on Ocean Policy (2008). The concept is being put into practice through a programme of the Japanese Ministry of Environment, which supports the efforts of local governments, residents, non-profit organizations and universities to undertake diverse activities that include planting eelgrass to restore coastal ecosystems, public education, and working with fishing communities to revive traditional fishing methods. There are also plans underway to develop a satoumi restoration manual and promote public awareness and education, both in Japan and abroad.
CASE STUDY
73

and Specially Protected Areas Protocol in the Mediterranean, and
establishing and strengthening regional MPA networks (see Chapter 4).
In a similar fashion, the last few years have seen the rise of various
and coastal resources in response to the CBD target. The Micronesia
are among the most notable examples where leaders in all three
food security, sustainable tourism, maintenance of natural capital
and ecosystem services, livelihoods, and cultural heritage). These
in establishing and maintaining their MPA networks – sustainable
successful in maximizing the capacity and ability of the countries and
the regions to access and leverage technical and funding assistance
from various sources.
The “Micronesia Challenge” – a precedent setting initiative
resources and 20 percent of their terrestrial resources by 2020
Challenge that was launched in 2006 at CBD COP-8 by the Republic
of Palau, the Federated States of Micronesia (FSM), the Republic of
the Marshall Islands (RMI), the U.S. Territory of Guam, and the U.S.
Commonwealth of the Northern Mariana Islands (CNMI). Each
shore marine and 20% of the terrestrial resources across Micronesia by
between the need to use their natural resources today and the need to
languages — all working towards the same set of goals.
(MIC), a peer-learning network that brings together senior government
Area Community (PIMPAC) network includes marine and terrestrial
complemented by the Micronesia Challenge Young Champions intern
program to begin to develop future leaders.
Challenge. Hence, a central element of the Micronesia Challenge is
fund to help provide a sustainable revenue stream. At the launch,
managed.
made important progress to meet their commitment. For example,
raised so far.
Chapter 6
Rock Islands, Palau. © Imèn Meliane
74

The “Caribbean Challenge” – Seeking the end of Paper Parks
In May 2008, The Governments of the Bahamas, Grenada, Jamaica, the
Dominican Republic, and St. Vincent and the Grenadines launched the
Caribbean Challenge, a region-wide campaign to protect the health of
the Caribbean’s lands and waters.
almost 21 million acres of coral reefs, mangroves, sea grass beds and
other important habitat for sea turtles, whales, sharks and other
wildlife.
The three core components of the Challenge include:
million acres of territorial coasts and waters
Establishing protected area trust funds to generate permanent,
protected areas
shore marine and terrestrial resources by 2025.
areas, by 2020.
terrestrial area by 2015.
protected areas, has approximately 56% of its near shore marine
environment and 22% of its land within protected areas; its focus
areas.
master plans (including ecological gap assessments and, in some cases,
Support Partnerships created in most countries as a vehicle for
Nevertheless, the countries in the region recognize that to ensure
of increased and sustained funding for management. Legally protected
binding trusts dedicated solely to the expansion and management of
the Caribbean challenge to ensure permanent sustainable funding for
regional endowment—the Caribbean Biodiversity Fund (CBF) that
feature of the Caribbean Challenge.
boards of directors within each country. They will also include a
visitors, park entrance fees, tourism fees, developer’s fees, and other
similar income sources that are developed by the individual country
Facility (GEF) and the German Development Bank (KfW), to capitalize
dollars from private donors.
The Coral Triangle Initiative - linking human needs and conservation
leaders of Indonesia, Malaysia, Papua New Guinea, Philippines,
with the World Ocean Conference in Manado, Indonesia. “The
focuses on the links between healthy coastal and marine resources
and sustainable development. It aims to reverse the decline of coastal
Moving Forward Towards Networks and Broader Spatial Management
Data Coordination in The Coral Triangle Initiative –
The Coral Triangle Atlas
To track the progress of the Plan of Action, there was a need
to centralize data from the six countries. To support this spatial
approach to conservation management, The Nature Conservancy
(TNC), World Wildlife Fund (WWF), Conservation International
(CI), Wildlife Conservation Society (WCS), International Union
for Conservation of Nature - Global Marine Species Assessment
(IUCN-GMSA), World Fish Centre and ReefBase developed the
Coral Triangle Spatial Data Atlas (CT Atlas). The CT Atlas (http://
ctatlas.reefbase.org) is an online GIS database that aims to compile
the core layers essential for management decisions at local and
regional levels and focuses in particular on MPAs and MPANs,
identifying key layers from sites and scaling up the process to a
regional level. The datasets are often incomplete or incompatible
and the CT Atlas works towards creating uniform layers and makes
them accessible to managers, decision makers and scientists.
The CT Atlas is evolving into an interactive database for the
CT countries and organizations that will facilitate keeping the
database current as well as promoting the use of the datasets for
planning and refinement of MPA networks that are resilient to
local threats as well as climate change. The 5-year MPA goal for
the CT countries is to design and agree on the framework for the
“Coral Triangle MPA System.” A functional and current CT Atlas
as designed will be essential to facilitate this outcome for the CT
Region.
75

outlines several overarching commitments that include making
sustainable management of marine and coastal resources as a high
needed economic, policy and legal reforms; establishing a system of
are:
marine resources fully applied
management)
Threatened species status improved
such as Indonesia’s commitment to increase its marine area within
at the regional level, a permanent secretariat has been established,
hosted in Indonesia and a Council of Ministers was established to
at the regional level.
governments in achieving their vision. A CTI Partnership group that
Australian governments, the Asian Development Bank (ADB), and the
Global Environment Facility (GEF) aims to coordinate technical and
government, through USAID and the Department of State, provided
government agencies, and the CTI Secretariat was established in 2008
targets.
countries through regional forums coordinated by the CTI Regional
Contributions of the “Challenges” to improved management of ocean and coastal resources
in actually changing the pace at which marine and coastal resources
generated to address these needs.
The Micronesia Challenge was inspired by a commitment to marine
and experience on which other regions such as the Western Indian
Ocean can build.
development. They are also working together to address large-scale
implement the PoWPA. The Micronesia and Caribbean Challenges in
management and have catalyzed the development of permanent
Chapter 676
Map 6.1: Coral Triagle ©TNC

Incorporating MPAs into Broader
Management
establish MPA networks recognized the need to address the broader
networks were promoted as a way to strategically plan and place MPAs
on the environment than the sum of the individual sites (Agardy 2005).
who depend on its resources (Allison et al. 1998). The future of most
MPAs—however, well designed, and well managed they may be as well
as their roles within an ecosystem-based approach will largely depend
on their surrounding environments and the type of threats that need
to be addressed by management outside of MPAs (Halpern et al. 2010;
The World Bank 2006).
The need for integrated management of coastal areas and the marine
of the UN General Assembly to convene a UN Conference on the Law
of the Sea to prepare a single comprehensive treaty on all aspects
ocean space are interrelated and need to be considered as a whole
to “integrated management and sustainable development of coastal
(Agenda 21, Chapter 17).
Programme.
At the 2002 World Summit on Sustainable Development, Governments
Moving Forward Towards Networks and Broader Spatial Management
Micronesia Challenge Caribbean Challenge Coral Triangle Initiative
Scope and year of
launch
2006; Palau, FSM, Marshall Islands,
Guam, CNMI Caribbean; 8 countries currentlyecologically and includes all or part
Commitments and
goals
near shore marine resources and
20% of terrestrial resources by
2020
Individual goals by each country;
of near shore marine area by 2020
9 overarching, general
commitments and 5 general goals
Origins and develop-
ment process
Inspired by Fiji commitment at
Barbados+10; government leaders
mechanisms developed later
Inspired by Micronesia and
Grenada commitments in 2006;
developed through a series of GEF
projects
principles announced in 2007; 18
RPoA
Important pre-condi-
tions
and informal networks; gap PA master plans and NISPs
developed as part of PoWPA
Leaders make links between
natural resource management and
sustainable development; strong
NGO presence and history of
Financing targets endowment funding to support
Palau, FSM and Marshall Islands
Organizational struc-
ture/coordination
mechanismsseveral networks of government
and NGOs
administer regional endowment
CTI secretariat and inter-
Monitoring & evalua-
tion
biological and socio-economic
indicators and score card on
commitments
GEF projectsa monitoring system
Key external partners TNC, USA, GEF, CI TNC, GEF, GermanyTNC, WWF, CI, USA, GEF, ADB,
Australia
77

a suite of tools to achieve the ecosystem approach, including, but not
limited to MPAs.
sectoral and single species approaches to managing the ocean
to achieve integrated management approaches were being tested,
have been valuable in providing key lessons and models that are being
incorporated in the management of marine and coastal ecosystems.
management (EBM) to the oceans has also evolved over the recent
accounts for the interconnectedness among systems, such as between
recognizing their strong interdependences. The concept of EBM can be
because it focuses on the most concrete aspects of EBM – area-based
Marine spatial planning and zoning
emerged as increasingly important tools for planning an ecosystem-
based management approach and ensuring a coordinated governance
structure in the world’s oceans. This approach strives to distribute
and manage the numerous human uses of ocean areas in a more
sustaining the provision of ecosystem services for current and future
planning or MSP processes. We also examine what can be learned from
challenges these projects face.
means maintaining the delivery of ecosystem services. Processes
ecosystems. A recent review by Foley et al. (2010) of guiding ecological
ecosystem service provisioning. These principles are to maintain or
proposed are context and uncertainty that need to be addressed in the
in a planning process will ensure that necessary ecological criteria
for maintaining ecosystem service provisioning are considered when
ecosystem services, planning principles guide how an MSP process
Boundaries.
on the reasoning for the landward (coastal) boundary and somewhat
less crucial for the alongshore and then seaward boundaries. The
consistency in human uses and ecological features.
Geographic Scale. Decisions about the geographic scope or scale
2) and (b) a regional scale (1000s of km) with coarser 2).
The most important challenge for MSP
Risk
assessments and environmental impact assessments (EIA) are useful
Chapter 6
MPAs need to be integrated in a broader management framework that ad-dresses threats outside the protected area. Venice, Italy. © Karl Heinz Gaudry
78

inter-related socio-economic, cultural and human-health impacts,
Decision Support. In many areas, one of the most useful approaches
which provide transparency and engage a diverse array of people
possible management scenarios. When stakeholders can be involved
to the planning process (Gleason et al. 2010).
was used to improve the management of marine protected areas. The
and reasonable use of the Great Barrier Reef, associated ecosystems,
and tourism) within its boundaries that are distributed throughout
zoning success. Other strong points of the GBRMP zoning scheme
outlined by Day (2002) include:
Moving Forward Towards Networks and Broader Spatial Management
Potential Benefits of Marine Spatial Planning
MSP is a tool for achieving the best possible trade-off of multiple and conflicting spatial goals within the larger marine management landscape. The U.S. Interagency Ocean Policy Task Force outlines the expected benefits of MSP that will “reduce conflicts among uses, reduce environmental impacts, facilitate compatible uses, and preserve critical ecosystem services to meet economic, environmental, security and social objectives”(USIOPTF 2009).
Reduce conflict among uses and users:When activities are proactively zoned in the ocean, uses can be grouped to avoid incompatibilities such as renewable energy and shipping (see below). The distribution of uses into marine space should also reduce conflict among the users that are frequently in tension (e.g. trawlers versus static gear fishing). A straightforward zoning scheme can increase stability for business interests and ease permitting burdens as it will be clearer where these uses can and cannot be developed (Douvere & Ehler 2009). A comprehensive MSP should also gain support and buy-in from multiple users. While MPAs are often defined by limiting access and restricting use, MSP, in contrast, aims to distribute all uses into appropriate locations based on ecology, economics, and other planning principles.
Reduce environmental impacts:MSP considers the cumulative impacts of multiple human uses in managing the marine environment. It is expected that recognizing these will enable managers to plan proactively for the cumulative negative effects of combined human uses of the marine environment (Halpern et al. 2008).
Concentrate compatible and separating incompatible uses:A marine spatial plan will evaluate and distribute human uses based on compatibility, assuring better ecosystem protection and reducing conflicts among users. For example, zoning schemes may designate high-use marine industrial zones in less ecologically sensitive areas, while focusing non-extractive uses in ecologically sensitive areas.
Preserve ecosystem services:A spatial plan or marine zoning system can distribute uses according to ecological principles to maximize the sustainable use of marine resources. For instance, habitat conservation zones that prevent benthic disturbances but allow pelagic fishing could be designed around sensitive benthic habitats that support productive fisheries. This type of zone will maximize the economic benefit (e.g. fish extraction) to humans while protecting the ecology and ability of the ecosystem to continue providing the service. A well-designed spatial plan will incorporate a protected area network within a broader spatial context of appropriately distributed human uses. This comprehensive and ecosystem-based approach may improve ecosystem health and service provision.
Better coordinate management:Many countries recognize that their marine management has developed in a piecemeal fashion with various sectors and agencies having disjointed focus and jurisdiction. An ecosystem-based approach is difficult in this management scenario since oversight of the ecosystem is lacking continuity. A comprehensive spatial plan should improve coordination among agencies. With a comprehensive ocean management plan, ocean use, permitting and enforcement should be streamlined and better coordinated.
precede more smoothly.
The GBRMP involves public input and process and the importance
of stakeholder involvement and “buy-in” has been emphasized
al. 2010).
maps of zones.
between economic development, social interests and ecological
79

MSP Project Management Objectives Achievements Perceived Benefits Citation
Australia – Bi-
oregionalisation
Program ecological criteria of marine plans
Framework developed Planning in progress
ecological criteria, will ensure ecologically-sustainable development.
(Day et al. 2008)
Australia –
GBRMPFisheriesTourismAquaculture
Management Implemented Results measured
in placeHigh level of compliance
(Day et al. 2002)
Belgium – Part
of the North Sea
Fisheries
gravel)
TourismAquacultureInfrastructure (cables and pipelines)DumpingDefense
Management Implemented
new and emerging human uses.
(Douvere et al. 2007)
Canada – Eastern
Scotian Shelf
Fisheries
minerals)Infrastructure (cables and pipelines)TourismDefenseResearch
Plan complete DFO (2007)
Germany – North
Sea and Baltic
Sea
Fisheries Plan complete 2007. Adopted 2009.
new and emerging human uses.
and Hydrographic Agency. (2009)
The NetherlandsFisheries
Plan complete in 2005
Enables planning for emerging human uses and increasing intensity of human uses, as well as future planning for sea-level rise.
Interdepartmental Directors’
Sea (2005)
Norway
Energy (oil and gas)Fishereis Plan complete in
2006separate management regimes
(Olsen et al. 2007)
SwedenFramework developed
Improved ecological management of the marine environment (2008)
United KingdomFramework developed
A more coherent and integrated approach to addressing marine threats.
US – Massachu-
settsAquacultureInfrastructure (cables and pipelines)
Plan complete in 2008 new and emerging human
uses.
EEA (2009)
US – Florida KeysTourismFishing
Energy
Management ImplementedResults measured
Protects the environment from and for heavy tourism
China Marine developmentManagement Implemented
Controlling development and use of marine resources.
Li (2006)
measured achievements.
Chapter 680

assessments (USIOPTF 2009). However a recent study of Lyme Bay
social and economic values of marine biodiversity may support a win-
short-term.
A major shortcoming in many MSP projects underway is the lack of
compared to the size of the ecosystem. Countries such as Belgium,
level needed for zoning or planning within the regions.
adopted as a key element in marine related policies in various regions
in North America, Europe, China and Australia. The European Union
as a key instrument for the management of a growing and increasingly
Great Lakes in the US.
failed to do this (Douvere & Ehler 2009). Ecological criteria tend to
of the various threats to coasts and oceans. As the experiences of
and providing guidance to managers (Beck et al. 2009; www.
the GBRMP and other promising integrated planning and management
management.
should be a primary focus of the new course that the global community
is one of the fundamental cores for the development of integrated
goals for coastal and marine resources.
Moving Forward Towards Networks and Broader Spatial Management 81
© IUCN / Marco Calvo

Aerial photo showing development and construction pressure on the Chesapeake Bay estuary at Cape Charles on Virginia’s Eastern shore. ©Alan Eckert Photography

The global community has made considerable progress in
supporting ocean conservation both at national and international
levels, particularly in establishing ecologically representative
and effectively managed MPAs. We have witnessed a significant
increase in the number of MPAs over the last few years.
However, despite these efforts and progress, the coverage
achieved remains patchy and falls far short of the 10% target that
contracting parties to the CBD have agreed for 2010. The nearly
5880 individual MPAs cover just 1.17% of the global ocean area.
Rather than a representative network, coverage is very uneven
and does not adequately represent all ecoregions, habitats and
species important for conservation. Moreover, the vast majority of
established MPAs lack human capacity and financial resources for
effective management.
While MPA coverage must be expanded, new efforts must be
mounted to better manage the remaining 90% of ocean space,
beyond current targets. Although we have not documented it here,
some significant progress has been made in applying ecosystem
approaches to fisheries management, yet the degradation and
overexploitation of the oceans and coast by fisheries continues
to increase alarmingly. Global population growth, coastal
development, pollution and climate change are adding significant
pressures to the status of already weakened marine and coastal
environments.
To reverse these trends, the global ocean conservation agenda
must incorporate strengthened measures and accelerated
implementation to avoid the growing consequences of inaction.
Chapter 7Conclusions and Recommendations
83
Building Broader Context For Ocean Protection
Efforts to secure a foundation of well planned and effectively
managed MPA networks, as one of the fundamental cores of more comprehensive ocean management strategies, should be accelerated. Marine protected areas are essential for conserving
priorities sites and processes, however they cannot be managed
effectively as islands of conservation in a sea of depletion and degradation. For MPAs to fulfil their conservation objectives and contribute to ocean conservation and restoration more broadly,
the design of the MPA system, and the selection, governance and
management of sites should be part of an overall strategy of ocean management. Such a strategy must take into account the multiple factors that influence the persistence of coastal and marine
resources, including the structure and function of the natural
ecosystem, the existing and potential consumptive and non-consumption uses, the range of maritime activities and security
considerations and the manner in which these interact with and
impact the marine environment.
Apply principles of ecosystem-based management at large scales
Though there have been important advances, more efforts should be dedicated to establishing comprehensive management regimes for coastal and marine resources that are defined on the basis of ecological, rather than only political boundaries, and that integrate ecological, social, economic and institutional perspectives, recognizing their strong interdependences. Often this will require a change in the governance and institutional arrangements at the relevant scales to facilitate better integration.
Mainstreaming: Planning for both conservation and develop-ment
There is increased recognition of the need for mainstreaming conservation objectives into development planning, and the welcome emergence of new approaches and tools. Marine spatial
planning is one such pragmatic approach that helps incorporate
protected area networks and other conservation objectives within a broader spatial context of appropriately distributed human uses. Increased efforts are now required to apply this approach in a
variety of geographic and jurisdictional contexts. Documenting and
sharing lessons learned is critical to furthering our understanding and capacity to use these new approaches effectively for advancing both ocean protection and sustainable use.
Consideration of synergistic and cumulative impacts
Environmental impact assessments (EIAs) and strategic environmental assessments (SEAs) are frequently used to identify
the potential risks associated with specific proposed activities and
plans. A commonly reported weakness is that they are too activity or sector-specific, and do not adequately consider synergistic or cumulative impacts. Embedding SEA and EIA processes in marine
spatial planning (and vice-versa) should be encouraged to enable
better prediction of the magnitude and significance of the overall impacts resulting from human activities on conservation outcomes.
In particular, the explicit analysis of trade-offs and potential “win-
wins” among conservation and development objectives would be enhanced.
© Octavio Aburto-Oropeza

Chapter 784
Accelerating Efforts to Establish MPA Networks: Addressing Gaps and Selecting the Right Places
Chapter 3 highlights that the existing coverage and connectivity of marine protected areas, though improved, remains insufficient to meaningfully contribute to reversing the trends of overexploitation and degradation in coastal and marine environments. Two parallel trends in establishing MPAs are observed, namely the increased designation of very large MPAs in areas far from coastlines and human settlements, and the continued expansion of locally initiated MPAs, often involving local communities. It is likely and essential that both trends will continue and accelerate.
However, there remains much more to be done to achieve an
ecologically representative and socio-economically relevant MPA system in accordance with the broader objective of ocean conservation. In particular the establishment of new MPAs should
be guided by:
Improving representative conservation
Systematic conservation planning based on biogeographical criteria must be improved. Targets and planning should take biodiversity
patterns and processes into account, and this should encourage the
expansion of MPAs in major gaps. This will incorporate increased attention towards waters beyond territorial seas, including areas within EEZ and in the high seas;
Targetting vulnerable and high value systems
Variable targets may be required for different ecosystems. Under-represented and vulnerable ecosystems such as shellfish reefs,
seamounts and deepwater corals, may be singled out for urgent
attention. At the same time certain ecosystems of high ecological value or which provide critical ecosystem services, including coral
reefs and mangrove forests, may benefit from higher targets –even if they already benefit from relatively high levels of protection;
The need to secure ecosystems, communities and resource
management programmes likely to be severely disrupted by global change or resource demands should be prioritised.
Building effective MPAs
Natural ecosystem dynamics must feature in MPA designation and management, with sites located to maximise ecological benefits, and the development of sites, or networks, of sufficient size to ensure sustained benefits;
The efficiency and effectiveness of management of the overall system must further take into account the institutional and individual capacity needs and constraints, in both conservation and
related marine and coastal resource management sectors.
Linking MPAs to people
Existing stewardship of marine and coastal resources by indigenous people and local communities should be encouraged. Where there
is the possibility of recognizing traditional means for conservation
involving local governance and management this will provide considerable benefits;
MPAs coverage should be increased to meet targets especially in
areas close to human populations where threats may be high. The potential benefits of protection to human health and well-being in
such areas will be considerable;
Setting targets for strict protection
There are considerable benefits from a broad range of management
approaches, and a range of such approaches is highly appropriate
in most settings. At the same time the considerable benefits from strictly protected areas (no-take areas or marine reserves) must be acknowledged and such areas should be included in MPA networks.
New targets for strict protection should be actively considered.
Village fishermen explore the edge of a coastal mangrove forest in Micronesia. The bounty of Pohnpei’s sea and forests has sustained people for thousands of
years. ©Ami Vitale

Conclusions and Recommendations 85
Improving Management Effectiveness
Paper parks do not contribute to ocean management. A substantial focus on management effectiveness is needed to ensure that marine protected areas, once designated, are managed to successfully achieve their objectives. Elements of management effectiveness that are of particular concern include the following:
Sustainable financing
An explicit consideration of the costs of establishment and ongoing management of all marine protected areas and networks should
be addressed from the outset The development of a business plan
and financing strategy, that involves all relevant stakeholders, is essential to effectiveness and sustainability. The full portfolio of financing mechanisms need be explored and utilized including
government budgets, capital trust funds, revenues and levies,
payments for ecosystem services, tourism fees and licences, and voluntary contributions. Additional innovations to address financial sustainability will be required in the long-term.
Involvement of communities and stakeholders
MPAs that do not consider the rights and interests of stakeholders, or strategies that do not fully recognize the power of partners for
ocean conservation represented by communities and resource user groups, are unlikely to be successful. Fortunately, there has been
much progress in the processes for planning and managing MPAs with enhanced consultation and involvement of stakeholders. This
is supported by the emergence and use of processes and tools for social impact assessment and for incorporating traditional
and customary knowledge. Further efforts should be made
in documenting and sharing lessons learned from engaging stakeholders, particularly when these involve innovative and
interactive processes, so that these become the norm.
Co-management
Co-management approaches that assign or share management responsibilities with stakeholders of MPAs and MPA networks should be encouraged, thereby sharing the burden of respective management bodies, and taking advantage of the expertise and capacity of multiple stakeholders (government, public sector,
NGOs, communities, fishers and other user groups, private sector).
When considering the further development or expansion of MPA systems, or contemplating changes in their management, explicit attention should be paid to existing rights and responsibilities and
the opportunity to engage a range of actors, including indigenous
peoples, local communities, the private sector and special interest groups in marine and coastal conservation. In some cases this requires the formalisation of existing arrangements, but should
always respect and consider existing governance and other
management arrangements. Special attention should also be dedicated to increasing the capacity of all stakeholders to fulfil their management responsibilities.
Cross-sectoral cooperation
The process of expanding involvement among stakeholders and sectors can engender new areas of co-operation, but also
potentially engender conflicts of interest among existing sectors where collaboration has been limited or where objectives are
misaligned. Building trust among partners also takes time. Efforts should be made to break though the existing barriers and work
together to address conflicts when they arise, and to promote
synergies in the longer term. Stakeholders should try to determine the common benefits in the development and management of
MPA networks and use them as a basis for building collaborative
efforts.
Numerous commercial fishing boats pursuing migrating salmon in the coastal waters off southwest Alaska. ©Ami Vitale

Chapter 786
Addressing Climate Change
The marine environment has a critical role to play in helping address the causes and impacts of climate change, and MPAs may have an important part to play in safeguarding these function and thus in building adaptation and mitigation actions. This is both for safeguarding biodiversity and enhancing carbon capture and storage functions, but also for securing livelihoods and sustaining the benefits that are derived from the ocean. This role can be enhanced by:
Promoting and delivering in-situ ecosystem resilience, resist-ance and recovery
High levels of protection should be afforded within and across MPA networks, and as part of broader effective ecosystem management
measures, to promote ecosystem resilience and resistance. This
is essential for minimizing the impacts of climate change and ensuring rapid recovery from debilitating episodic occurrences such as extreme ocean and weather events. Achieving such
goals and ensuring healthy examples of all habitat types covering
sufficient area acts as an insurance against losses in the broader marine landscape.
Creating understanding and actions to deliver ecosystem resilience, resistance and recovery in temperate and polar regions
In tropical regions, a considerable body of work has been
undertaken and effectively communicated to create understanding and generate action for increased ecosystem resilience, through improved design, establishment and management of MPA
networks. Such principles work equally well in temperate and
polar regions. However, the understanding and acceptance still lags well behind that of the tropics. ‘Re-inventing the wheel’ would put
efforts back by years. Learning from the experiences from tropical regions and applying these to other regions is urgently needed to
accelerate efforts and improve actions to combat climate change.
Work on resilience toolkits in tropical areas should therefore be further encouraged and strongly promoted as having much wider application. A programme of activities to transfer resilience theory and practice to temperate and polar areas should be urgently put in place.
Creating climate-smart MPAs
By bringing together science, policy and management information,
it is possible to develop and promote a suite of actions that enable
MPAs to play a full role in climate change mitigation and adaptation. Marine and coastal ecosystems can help protect coastal populations from climate-induced coastal hazards, e.g. by improving storm and
flood defences, and are an essential tool for ecosystem-based
adaptation. It is recommended that further investment be made to adjust the design and management of MPAs so that they are not only ‘climate proof’ but also to enable them to contribute to future
actions to secure livelihoods and reduce societal vulnerability in a
changing world.
Using MPAs to secure key components of the carbon cycle
Recent research has demonstrated that some coastal marine
habitats act as particularly valuable carbon sinks, in the same way as tropical forests, peatlands and soils. Whilst experts work to see how far such habitats can be brought into carbon finance markets
there is a more basic need to ensure that the future of such areas
is secured in the long-term interests of mitigating climate change. MPAs, as part of broader coastal management provide a readymade tool for this. Assessments and actions should be taken to ensure
that the coverage of MPAs and MPA networks, and the associated
management is implemented to secure these carbon capture and storage functions. Furthermore, action should be taken to avoid
loss and degradation as well as to enhance the sustainable use and
management of coastal carbon sinks as a contribution to reducing global GHG emissions.
An aerial view of one of the many islands which comprise the Federated States of Micronesia showing the coastal forest, mangrove and coral reefs that shel-
ter birds and provide protection for a vast aray of marine life. ©Ami Vitale

Conclusions and Recommendations 87
Foster and support regional commitments and initiatives
It is heartening to see that various like-minded countries sharing
the same goal have come together in important regional efforts to establish MPA networks. They have been fostering political
will and inspiring other nations and regions with bold political commitments that explicitly link ocean protection to the well-
being of their people and the development and prosperity of their nations. Such efforts need to be supported and sustained, and their lessons well documented and applied.
Regional efforts should be further encouraged to facilitate the
creation of enabling conditions for effective conservation, including increased political will, better integration into development priorities, improved policies, strengthened organizational
collaboration and the development of sustainable finance
mechanisms. Regional initiatives should further strengthen links between effective natural resource management and sustainable development, and addressing large scale threats like climate
change that transcend national boundaries.
Beyond political boundaries
It is well known that ocean ecosystems are interrelated and do not respect political boundaries. While many nations are now
adopting a more integrated approach to managing ocean space
and uses within their EEZs, existing international mechanisms for managing areas beyond national jurisdiction remain primarily
through sectoral approaches.
Though some progress has been made, further efforts are needed to galvanize cooperation and address the challenges of conserving and managing marine environment and resources
that lie beyond national jurisdiction. Existing tools like the CBD
criteria for identifying ecologically and biologically significant areas and the guidance for strategic environmental assessments and environmental impact assessments could help promote a
common approach to identification of areas and management of
risks to biodiversity beyond national jurisdiction while respecting the varying competences of the regional and sectoral bodies. However, agreement on common principles and goals for spatial
management, and guidance on implementation are sorely needed
to facilitate more coherent policies and practices across the numerous relevant agencies as well as national states.
Facilitating information exchange on biodiversity, its uses and
management measures in areas beyond national jurisdiction is a priority. The wealth of new scientific and technical data and
information from the scientific community and management organizations should be shared to inform improved management
and conservation in the open-ocean and deep sea and capacity development initiatives are required to support this purpose.
Though much of the open-ocean and deep sea lies beyond national
jurisdiction, changes in these systems will impact associated
regions and nations directly or indirectly. The interconnectedness of these system need to be recognised, and adjacent regions and
states therefore need to be engaged in managing these areas in
an integrated and transboundary manner consistent with the ecosystem approach.
Increasing Cooperation and Protection at Scale
Local fishermen in Palabuhan Ratu beach, West Java. ©Ahmad Fuadi, TNC
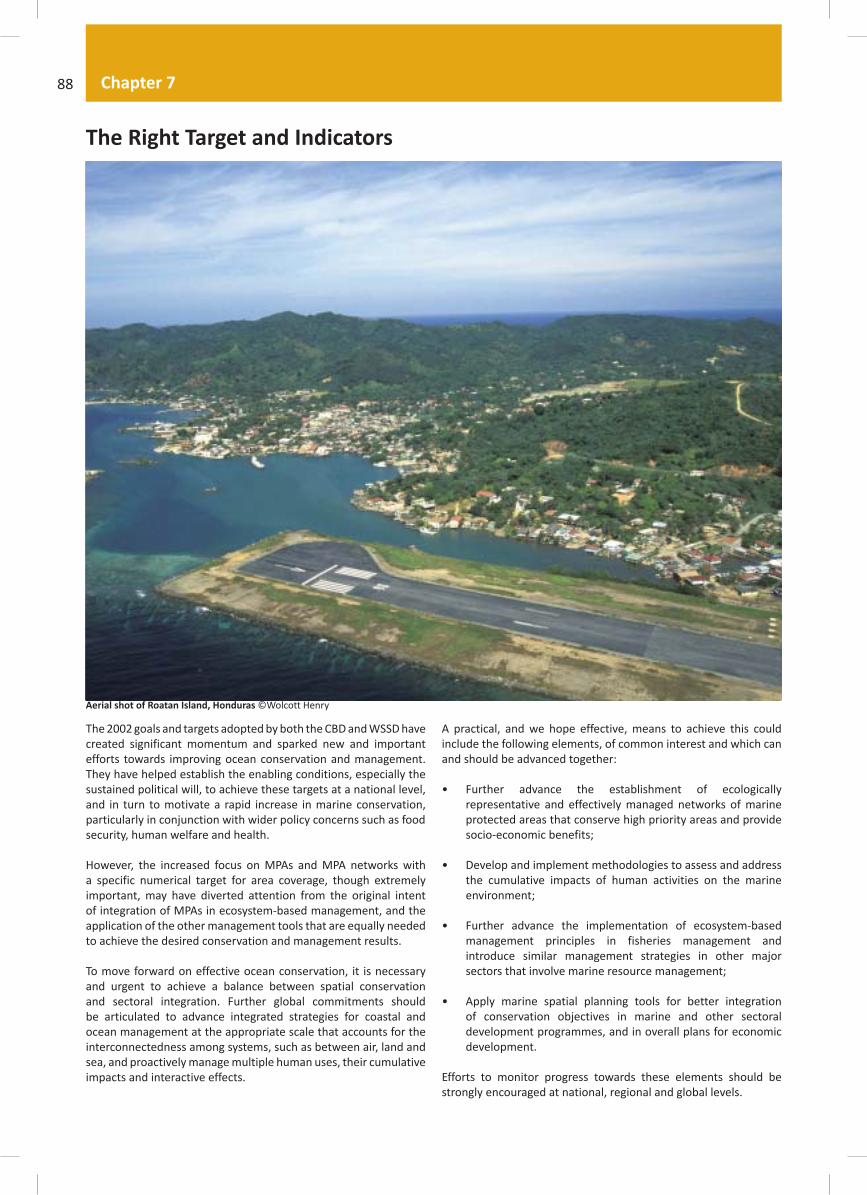
Aerial shot of Roatan Island, Honduras ©Wolcott Henry
The Right Target and Indicators
A practical, and we hope effective, means to achieve this could include the following elements, of common interest and which can
and should be advanced together:
Further advance the establishment of ecologically representative and effectively managed networks of marine protected areas that conserve high priority areas and provide
socio-economic benefits;
Develop and implement methodologies to assess and address
the cumulative impacts of human activities on the marine environment;
Further advance the implementation of ecosystem-based management principles in fisheries management and introduce similar management strategies in other major
sectors that involve marine resource management;
Apply marine spatial planning tools for better integration
of conservation objectives in marine and other sectoral development programmes, and in overall plans for economic
development.
Efforts to monitor progress towards these elements should be
strongly encouraged at national, regional and global levels.
The 2002 goals and targets adopted by both the CBD and WSSD have created significant momentum and sparked new and important efforts towards improving ocean conservation and management.
They have helped establish the enabling conditions, especially the
sustained political will, to achieve these targets at a national level, and in turn to motivate a rapid increase in marine conservation, particularly in conjunction with wider policy concerns such as food security, human welfare and health.
However, the increased focus on MPAs and MPA networks with
a specific numerical target for area coverage, though extremely important, may have diverted attention from the original intent of integration of MPAs in ecosystem-based management, and the
application of the other management tools that are equally needed
to achieve the desired conservation and management results.
To move forward on effective ocean conservation, it is necessary and urgent to achieve a balance between spatial conservation
and sectoral integration. Further global commitments should be articulated to advance integrated strategies for coastal and
ocean management at the appropriate scale that accounts for the interconnectedness among systems, such as between air, land and
sea, and proactively manage multiple human uses, their cumulative
impacts and interactive effects.
Chapter 788

Acknowledgments and References
Acknowledgments
This report reflects an enormous and largely voluntary group effort. Each of the chapters was developed
through input from various experts and practitioners from numerous organizations working in the field of
marine conservation. The substantial support and contribution made by our colleagues greatly assisted in
our writing. We would like to acknowledge the contributions from a number of individuals.
For their contributions with text and case studies, we would like to acknowledge Mike Beck, Georgina
Bustamante, Yuko Chiba, Isabelle M. Côté, Caitlyn Muller Crain, Nigel Dudley, Claire Fitzgerald, Suzanne
Garrett, Kristina Gjerde, Robert Glazer, Dorothée Herr, Kohei Hibino, Charlotte Karibuhoye, Richard
Kenchington, Dan Laffoley, Christophe Lefebvre, Anne McDonald, Imèn Meliane, Emily Pigeon, Trevor
Sandwith, Scott Smith, Mark Spalding, Jerker Tamelander, Moi Kim Tan, Caitlyn Toropova, Jay Udelhoven,
Alessandra Vanzella-Khouri, Ole Vestergaard, Marjo Vierros, Lauren Wenzel, Alan White, Louisa Wood,
and Kim Wright.
For their helpful comments and edits during the review process, the editors thank Jacqueline Alder, Jeff Ardron, Ruth Blyther, Isabelle Cote, Nigel Dudley, Carolina Garcia, Suzanne Garrett, Carlos Gaymer, Lynne Hale, Marea E. Hatziolos, Richard Kenchington, Thomas Laughlin, Trina Leberer, Liz Moore, Nyawira Muthiga, Trevor Sandwith, Alifereti Tawake, Ole Vestergaard, Marjo Vierros, Kathy Walls, and Kim Wright.
The preparation of this report was an intense but exciting process. We hope that everyone has been acknowledged; if names inadvertently fell off the list, please accept our sincere apologies.
We also want to thank Georgios Sarantakos and James Oliver for their efforts and patience with the layout
and design.
This report could not have been produced without the assistance of all our partner organizations: The Nature Conservancy, the International Union for the Conservation of Nature and its World Commission on Protected Areas-Marine, the United Nations Environment Programme, The United Nations University,
UNEP-World Conservation Monitoring Centre, The Wildlife Conservation Society and the French MPA
Agency.
The editors also thank all the photographers who contributed their images and Jemma Aitken for her assistance in researching photos.

90 Aalbersberg, B. Tawake, A. & Parras, T. ‘Village by village: Recovering Fiji’s
Abdulla, A. Gomei, M. Maison, E. & Piante, C. Status of Marine Protected Areas in the Mediterranean Sea. IUCN, Malaga and WWF, France, 2008.
reserve?’ Vol. 104, 2006, pp. 360-375.
--
ress Series Vol. 300, 2005, pp. 241–296.
Agardy, T. Bridgewater, P. Crosby, M.P. Day, J. Dayton, P.K. Kenchington, R. -
gets? Unresolved issues and ideological clashes around marine protected areas’, Vol. 13, 2003, pp. 353-367.
Agardy T, & Staub, F. ‘Marine Protected Areas and MPA Networks.
yields.’ , Vol. 62, 2005, pp. 98-108.
Allison, G. Lubchenco. J. & Carr, MH. ‘Marine reserves are necessary but Vol. 8,
Suppl. 1998, pp. S79–92.
MH. Francis, JE. Gruber, N. Haywood, AM. Karoly, DJ. Kaser, G. Le Quéré, C. Lenton, TM. Mann, ME. McNeil, BI. Pitman, AJ. Rahmstorf, S. Rignot, E.
K. Steig, EJ. Visbeck, M. & Weaver, AJ. The University of New
South Wales Climate Change Research Centre (CCRC), Sydney, Australia, 2009.
Ardron J. ‘The challenge of assessing whether the OSPAR network of marine protected areas is ecologically coherent’, Hydrobiologia Vol. 606, 2008, pp. 45-53.
high seas’, Marine Policy Vol. 32, 2008, pp. 832-839.
Australian Government. ‘Great Barrier Reef Outlook Report 2009. In Brief.’ Great Barrier Reef Marine Park Authority, Townsville, Australia, 2009.
Hydrobiologia Vol. 606, 2008, pp. 35-44.
Balmford, A. Gravestock, P. Hockley, N. McClean, CJ. & Roberts, CM. ‘The worldwide costs of marine protected areas’ Academy of Sciences of the United States of America, Vol. 101, issue 26, 2004, pp. 9694–9697.
Raina, J. ‘Comparison of outcomes of permanently closed and periodically harvested coral reef reserves.’ Vol. 23, 2009, pp. 1475-1484.
Marine Policy Vol. 33, 2009 (doi: 10.1016/j.marpol.2009.1001.1004).
Baxter, JM. Buckley, PJ. & Wallace, CJ. (Eds.) Marine Climate Change . Summary Report. MCCIP,
Beck, MW. Marsh, TD. Reisewitz, SE. & Bortman, ML. ‘New Tools for Ma-Con-
Vol. 18, 2004, pp. 1214-1223.
Beck, MW. Ferdana, Z. Kachmar, J. Morrison, KK. Taylor, P. and others. Best . The Nature Conservancy, Arlington,
VA. 2009.
Benzaken, D. Miller-Taei, S. & Wood, L. Status of policy and target
. SPREP, 2007.
Bjork M. Short, F. McLeod, E. & Beer, S. Managing seagrasses for resilience to climate change. IUCN, Gland, Switzerland, 2008.
Bossar, A., Capanna, S., Gilera, C.L. and Von Der Weppen, J. Weighing
. Johns Hopkins School
a comprehensive summary and a meta-analysis of the literature’, Vol. 33, 2006, pp. 223-250.
b) Brander, LM. van Beukering, P. & Cesar, HSJ. of coral reefs: a meta-analysis IVM Working Paper 06/07. Amsterdam, Netherlands, July 19, 2006.
in biodiversity eds. E. Norse & LB. Crowder LB. Island Press, Washington, DC, 2005.
-ture’ in Park Service, Washington, DC, 1962.
Brooke SD, Lim, TY. & Ardron, J. Surveillance and enforcement of . Marine
Brown, O. Crawford, A. & Hammill, A. Natural Disasters and Resource
Sustainable Development, Manitoba, Canada, 2006.
Bryant, D. Burke, L. McManus, J. & Spalding, M. . World Resources
Programme, Washington, DC, 1998.
Burke, L. Kura,Y. Kassem, K. Revenga, C. Spalding, M. & McAllister, D. Pilot . World Resources
Burke, L. & Maidens, J. . World Resources
Burke, L. Reytar, K. Spalding, M. & Perry, AL. . World
prep.
Caribbean’ in
. Eds. Grober-Dunsmore, R. & Keller, BD. Marine Sanctuaries
Sanctuaries, Silver Spring, MD, 2008.
Butchart, SHM. Walpole, M. Collen, B. van Strien, A. Scharlemann, JPW. Almond, REA. Baillie, JEM. Bomhard, B. Brown, C. Bruno, J. Carpenter, KE. Carr, GM. Chanson, J. Chenery, AM. Csirke, J. Davidson, NC. Dentener, F. Foster, M. Galli, A. Galloway, JN. Genovesi, P. Gregory, RD. Hockings, M. Kapos, V. Lamarque, J-F. Leverington, F. Loh, J. McGeoch, MA. McRae, L.
C. Sauer, JR. Skolnik, B. Spear, D. Stanwell-Smith, D. Stuart, SN. Symes, A. Tierney, M. Tyrrell, TD. Vie, J-C. & Watson, R ‘Global Biodiversity: Indica-tors of Recent Declines’, Science Vol. 328, 2010, pp. 1164-1168.
2010)
management’ .CalCOFI Rep Vol. 40, 1999.
Chape, S. Blyth, S. Fish, L. Fox, P. & Spalding, M. of Protected Areas
2003.
Chape, S. Harrison, J. Spalding, M. & Lysenko, I. ‘Measuring the extent
biodiversity targets’ Vol. 360. 2005. pp. 443-455.
Chape, S. Spalding, M. & Jenkins, M.

91. University of California Press, Berkeley, CA, 2008.
Chmura, GL. Shimon, CA. Cahoon, DR. & Lynch, JC. ‘Global carbon Global Biogeochemical Cycles
Vol. 17, no. 4, 2003 (doi:10.1029/2002GB001917).
Christ. C. ‘Ecoturism is transforming the travel industry’. Maine Center for
htm>. June 24th 2005. (accessed July 8, 2010)
Governance and Enforcement of Marine Protected Areas: An Overview.
marine protected areas: an overview’ in
. FAO Fisheries Report no. 825, Rome Italy, 2007.
Cinner, JE. McClanahan, TR. Daw, TM. Graham, NAJ. Maina, J. Wilson, SK. & Hughes, TP. ‘Linking Social and Ecological Systems to Sustain Coral Reef Fisheries’. Current Biology Vol.19, 2009, pp. 206.
Clarke, P. & Jupiter, S. ‘Law, custom and community-based natural resource management in Kubulau District (Fiji)’.
Vol. 37, no. 1, 2010, pp. 98–106.
A. Bulleri, F. Culiol,. JM. Dimech, M. Falcon, JM. Guala, I. Milazzo, M.
Vol. 11, 2008, pp. 481-489.
Coad, L. Burgess, ND. Bomhard, B. & Besancon. C. Progress towards the
Areas. UNEP-WCMC, Cambridge, UK, 2009
Commonwealth of Australia 2003. ISBN 0 642 54949 4. Prepared by the Commonwealth Department of Environment and Heritage from material supplied by Richard Kenchington, Trevor Ward, and Eddie Hegerl.
.
2004.
. United
United
Environment Programme, 2008.
. United
Bangkok, Thailand. 7-11 February 2005.
Corrigan, C. & Kershaw, F.
UK, 2008.
Ambio Vol. 37, 2008, pp. 241-248.
collapse?’ Science Vol. 321, 2008, pp.1678–1681.
Journal of Fish Biology Vol. 59 (suppl. A), 2001, pp. 178-189.
Cudney-Bueno, R. Lavin, MF. Marinone, SG. Raimondi, PT. & Shaw, WW. Vol. 4.
2009, e4140 (doi:10.1371/journal.pone.0004140).
Day, J. ‘Zoning lessons from the Great Barrier Reef Marine Park’. Ocean & Coastal Management Vol. 45, 2002, pp. 139–156.
. World Wildlife Fund Canada, 2002.
Diaz, RJ. & Rosenberg, R. ‘Spreading dead zones and consequences for marine ecosystems’. Science Vol. 321, 2008, pp. 926-929.
bleaching and promote recovery’ in Coral bleaching and marine protected
. eds. Salm, RV. & Coles, SL. The Nature Conservancy. Honolulu. HI, 2001.
Donner, SD. & Potere, D. ‘The inequity of the global threat to coral reefs’. BioScience Vol. 57, 2007, pp. 214-215.
Vol. 90. 2009. pp. 77-88.
Dudley, N. (Ed) Guidelines for Applying Protected Area Management Categories. Gland. Switzerland. 2008.
Dudley, N. Stolton, S. Belokurov, A. Krueger, L. Lopoukhine, N. MacKinnon, K. Sandwith, T. & Sekhran, N. people cope with climate change. IUCN-WCPA, TNC, UNDP, WCS, World Bank, WWF, 2010.
Edwards, M. & Richardson, AJ. ‘Impact of climate change on marine pelagic phenology and trophic mismatch’. Nature Vol. 430, 2004, pp. 881-884.
-ings. Morges: IUCN, 1974.
on marine fauna and ecosystem processes’. Vol. 65, 2008, pp.414-432.
Fisheries in the High Seas. Rome, FAO. 73p.
Fernandes, L. Day, J. Lewis, A. Slegers, S. Kerrigan, B. Breen, D. Cameron, D. Jago, B. Hall, J. Lowe, D. Innes, J. Tanzer, J. Chadwick, V. Thompson, L.
B. Marsh, H. Possingham, H. Ball, I. Ward, T. Dobbs, K. Aumend, J. Slater,
areas’ Vol. 19, 2005, pp.1733-1744.
FIBA/WWF/UICN. Saint-
Louis du Sénégal. Avril 2000.
Fiske, SJ. ‘Sociocultural Aspects of Establishing MPAs’. Ocean & Coastal

92 Management Vol. 17, no. 1, 1992, pp. 25-46.
<www.vliz.be/vmdcdata/marbound/index.php>. Flanders Marine
Foley, M. Halpern, BS. Micheli, F. Armsby, M. Caldwell, MR. Crain, CM.
JE. Hacker, SD. McLeod, KL. Palumbi, S. Peterson, CH. Regan, HM. Ruckelshaus, M. Sandifer, PA. & Steneck, RS. ‘Guiding ecological principles
Marine Policy Vol. 34, 2010, pp. 955-966.
Forcada, A. Valle, C. Bonhomme, P. Criquet, G. Cadiou, G. Lenfant, P. &
Series Vol. 379, 2009, pp. 197-211.
formerly cod-dominated ecosystem’. Science Vol. 308, no. 5728, 2005, pp.1621-1623.
Freudenberg, WR. Gramling, RB. Laska, SB. & Erikson, K. Catastrophe in .
Island Press, Washington DC, 2009.
Series Vol. 230, 2002, pp. 253-264.
changing climate. PNAS Vol. 102, no. 32, 2005, pp.11201-11206.
Game, ET. Grantham, HS. Hobday, AJ. Pressey, RL. Lombard, AT. Beckley, LE. Gjerde, K. Bustamante, R. Possingham, HP. & Richardson, AJ. ‘Pelagic
Trends in 2009 (doi:10.1016/j.tree.2009.01.011:10)
Vandeperre, F. Brito, A. Chemello, R. Dimech, M. Domenici, P. Guala,
Journal for Nature Vol. 16, issue 4, 2008, pp. 193-221.
Garrick, LD. ‘The Black River Lower Morass: A threatened wetland in Jamaica’ Vol. 20, 1986, pp. 155-160.
--
Vol. 35, 2008, pp. 36–45.
of marine reserves’. Vol. 18, 2003, pp. 448-455.
Gitay, H. Suárez, A. Watson, RT. & Dokken, DJ. (eds). ‘Climate change
driven marine protected area network planning: A successful case study from north central California’. Ocean & Coastal Management Vol. 53. 2010. pp. 52-68.
Goñi, R. Adlerstein, S. Alvarez-Berastegui, D. Forcada, A. Renones,
Pérez-Ruzafa, A. Sanchez-Lizaso, JL. García-Chartón, JA. Bernard, G. Stelzenmuller, V. & Planes, S. ‘Spillover from six western Mediterranean
Progress Series Vol. 366. 2008. pp. 159-174.
Progress Series Vol. 400, 2010, pp. 233-243.
Govan, H. Tawake, A. Tabunakawai, K. Jenkins, A. Lasgorceix, A. Schwarz, A-M. Aalbersberg, B. Manele, B. Vieux, C. Notere, D. Afzal, D. Techera, E. Rasalato, ET. Sykes, H. Walton, H. Tafea, H. Korovulavula, I. Comley,
Vave, R. Hills, R. Tawakelevu, S. Alefaio, S. Meo, S. Troniak, S. Malimali, S. Kukuian, S. George, S. Tauaefa, T. Obed, T.
LMMAs
Graham, NAJ. Spalding, M. & Sheppard, C. ‘Reef shark declines in remote
2010 (doi: 10.1002/aqc.1116).
2002.
Green, A. Lokani, P. Sheppard, S. Almany, J. Keu, S. Aitsi, J. Warku Karvon,
of Marine Protected Areas. Kimbe Bay. West New Britain. Papua New Guinea. The Nature Conservancy. Brisbane, Australia, 2007.
marine protected areas’. Vol. 24, 2010, pp. 312-318.
Mediterranean Sea’. Vol. 335, 2007, pp. 43-56.
Chemello, R. Greco, S. Manganaro, A. di Sciara, GN. Russo, GF. & Tunesi,
Vol. 141, 2008, pp. 699-709.
Hale, LZ. Meliane, I. Davidson, S. Sandwith, T. Beck, M. Hoekstra, J. Spalding, M. Murawski, S. Cyr, N. Osgood, K. Hatziolos, M. Van Eijk, P. Davidson, N. Eichbaum, W. Dreus, C. Obura, D. Tamelander, J. Herr, D.
coastal ecosystems’. Renewable Resources Journal Vol. 25, no. 4, 2009, pp. 21-28.
Halpern, BS. ‘The impact of marine reserves: Do reserves work and does Vol. 13, 2003, pp. S117-S137.
Halpern, BS. Lester, SE. & McLeod, KL. ‘Placing marine protected areas onto the ecosystem-based management seascape’. Proceedings of the
2010 (doi: 10.1073/pnas.0908503107).
Halpern, BS. McLeod, KL. Rosenberg, AA. & Crowder, LB. ‘Managing for
zoning’. Ocean & Coastal Management Vol. 51, 2008, pp. 203-211.
Harley, CDG. Hughes, AR. Hultgren, KM. Miner, BG. Sorte, CJB. Thornber, CS. Rodriguez, LF. Tomanek, L. & Williams, SL. ‘The impacts of climate change in coastal marine systems’. Vol. 9, 2006, pp. 228-241.
program’. Ocean & Coastal Management Vol. 51, 2008, pp.701-711.
Hays, GC. Richardson, AJ. & Robinson, C. ‘Climate change and marine plankton’. Vol. 20, no. 6, 2005, pp. 337-344.
Herr, D. & Galland, GR. The Ocean and Climate Change. Tools and . IUCN, Gland, Switzerland, 2008.
Higgins-Zogib, L. ‘Misali Island Case Study’ in Beyond Belief. Dudley, N. Higgins-Zogib, L. & Mansourian, S. WWF and ARC. Gland, Switzerland, 2006.
Hockings, M. Stolton, S. & Dudley, N. -. IUCN, Gland,
Switzerland & Cambridge, UK, 2000.
Hockings, M. Stolton, S. Leverington, F. Dudley, N. & Courrau, J. -
. IUCN, Gland, Switzerland and Cam-bridge, UK, 2006.
Hoegh-Guldberg, O. ‘Climate change, coral bleaching and the future of the world’s coral reefs’. Marine & Freshwater Research Vol. 50, 1999, pp. 839-866.
and global factors’ in The Ocean and Climate Change. Tools and Guidelines . Herr, D. & Galland, GR. IUCN, Gland, Switzerland, 2008.
Hoegh-Guldberg, O. ‘Low coral cover in a high-CO2 world’. Journal of
Geophysical Research Vol. 110, 2005 (doi: 10.1029/2004JC002528).
P. Gomez, E. Harvell, CD. Sale, PF. Edwards, AJ. Caldeira, K. Knowlton, N. Eakin, CM. Iglesias-Prieto, R. Muthiga, N. Bradbury, RH. Dubi, A. & Hatziolos, ME. ‘Coral reefs under rapid climate change and ocean
Science Vol. 318, no. 5857, 2007, pp. 1737-1742.
Holdgate, M. The Green Web. Earthscan London. 1999.

93Science Vol. 312, no. 5770, 2006, pp. 94-97.
Hughes, TP. Bellwood, DR. Folke, C. Steneck, RS. & Wilson, J. ‘New Trends in
Vol. 20, 2005, pp. 380–386.
Hughes, TP. Rodrigues, MJ. Bellwood, DR. Ceccarelli, D. Hoegh-Guldberg,
change’. Current Biology Vol. 17, no. 4, 2007, pp. 360-65.
IPCC.
Intergovernmental Panel on Climate Change. Eds. Pachauri, RK. & Reisinger, A. IPCC, Geneva, Switzerland, 2007.
IUCN. Marine Menace. Alien invasive species in the marine environment. IUCN, Gland, Switzerland, 2009.
IUCN. and addressing challenges in marine protected areas. Vol. 1 in Protect Planet Ocean Review Series. 2009.
IUCN. environment adopted by the 17th IUCN General Assembly, San José, 1988.
IUCN World Commission on Protected Areas,
Washington, DC, 2008.
IUCN - World Commission on Protected Areas. “Sala & Gomez Island
(accessed 23 Sept 2010).
IUCN World Commission on Protected Areas with the assistance of the Guidelines for Protected Area
Management Categories. IUCN, Gland, Switzerland and Cambridge, UK 1994.
Jameson, SC. Tupper, MH. & Ridley, JM. ‘The three screen doors: can Vol. 44,
2002, pp. 1177-1183
management in Vanuatu between 1993 and 2001’. Coastal region and small island papers 15. UNESCO, Paris, France, 2004. org/csi/wise/indigenous/vanuatu1.htm
Marine Policy Vol. 30, issue 2, 2006, pp. 143-156.
Kelleher, G. Guidelines for Marine Protected Areas. IUCN, Gland, Switzerland and Cambridge, UK, 1999.
Kelleher, G. & Kenchington, R. Protected Areas. Gland, Switzerland, 1992.
Keller, BD. Gleason, DF. McLeod, F. Woodley, CM. Airame, S. Causey, BD. Friedlander, AM. Grober-Dunsmore, R. Johnson, JE. Miller, SL. & Steneck,
marine protected areas’. Vol. 44, no. 6, 2009, pp. 1069-1088
Kenchington, R. ‘Strategic roles of marine protected areas in ecosystem : Vol. 86, no. 2, 2010, pp.
303-313.
measures’. Natural Hazards Vol. 6, no. 1, 1992, pp 11-24.
special introductory guide for policy advisers and decision makers’.
Reference User Group. 2009
The management of natural coastal . IUCN, Gland, Switzerland, 2009.
Leeworthy, VR.
Leisher, C. van Beukering, P. & Scherl, LM. . The Nature
Conservancy, Arlington, VA, 2007.
Le Quéré, C. Rödenbeck, C. Buitenhuis, ET. Conway, TJ. Gomez, A.
2 sink due to recent
climate change’. Science Vol. 316, no. 5832, 2007, pp. 1735-1738.
Biology Vol. 19, 2005, pp. 1701-1713.
Lester, SE. & Halpern, BS. ‘Biological responses in marine no-take reserves Vol. 367,
2008, pp. 49-56.
marine reserves: a global synthesis’. Series Vol. 384, 2009, pp. 33-46.
a) Leverington, F. Hockings, M. & Costa, KL. . IUCN, Gland, Switzerland,
2008.
b) Leverington, F. Hockings, M. Pavese, H. Costa, KL. & Courrau, J
Overview of approaches and methodologies. IUCN, Gland, Switzerland, 2008.
c) Leverington. F. Hockings, M. & Costa, KL.
. The University
Vol. 106, no. 52, 2009, pp. 22341-22345.
LMMA Network. <www.lmmanetwork.org>. 2010 (accessed 30 June. 2010).
Lombard, AT. Reyers, B. Schonegevel, LY. Cooper, J. Smith-Adao, LB. Nel, DC. Froneman, PW. Ansorge, IJ. Bester, MN. Tosh, CA. Strauss, T. Akkers, T.
Southern Ocean: designing a Marine Protected Area for the Prince Edward Islands’. Vol. 19, 2007, pp. 39-54.
Lotze, HK. Lenihan, HS. Bourque, BJ. Bradbury, RH. Cooke, RG. Kay, MC.
Science Vol. 312, 2006, pp. 1806-1809.
Coastal Management Vol. 37, 2009, pp. 274-290.
Lutchman. I. . WWF, The Netherlands, 2005.
Mace, GM. Cramer, W. Diaz, A. Faith, DP. Larigauderie, A. Le Prestre, P. Palmer, M. Perrings, C. Scholes, RJ. Walpole, M. Walther, BA. Watson,
Current Opinion in . 2010 (doi:10.1016/j.cosust.2010.03.003).
Maliao, RJ. White, AT. Maypa, AP. & Turingan, RG. ‘Trajectories and
reserves: a meta-analysis.’ Coral Reefs Vol. 28, 2009, pp. 809-822
bleaching. Great Barrier Reef Marine Park Authority, Townsville, Australia 2006.
the face of climate change’ in Coral reefs and climate change: science and management. Eds. Phinney, JT. Hoegh-Guldberg, O. Kleypas, J. Skirving, WJ. & Strong, A. American Geophysical Union, Washington, DC, 2006.
-
FAO Fisheries Report no. 825. Rome, Italy, 2007.
& Landgrave, R. ‘The coasts of our world: Ecological, economic and social importance’. Vol. 63, 2007, pp. 254-272.
Current Science Vol. 86, no. 3, 2004, pp 399-406.
Mastny, L. .

94 2010 (doi:
10.1111/j.1523-1739.2010.01530).
McClanahan, TR. & Mangi, S. ‘Spillover of Exploitable Fishes from a
Vol. 10, issue 6, 2000, pp. 1792-1805
McClanahan, TR. Verheij, E. & Maina, J. ‘Comparing the management
management area in East Africa’. - Vol. 16, 2006, pp.147–165.
McLeod, E. Salm, R. Green, A. & Almany, J. ‘Designing marine protected area networks to address the impacts of climate change’.
Vol. 7, 2009, pp. 362-370 (doi:10.1890/070211).
McNeely, JA. Mooney, HA. Neville, LE. Schei, P. & Waage, JK (eds.) A Global Strategy on Invasive Alien Species. IUCN, Gland, Switzerland, and Cambridge, UK, 2001.
McQuistan, CI. Fahmi, Z. Leisher, C. Halim, A. & Adi, SA. Protected Area A Study Implemented Under the Programmes
Indonesia. Ministry of Indonesia, Jakarta, 2006.
Micheli, F. Halpern, BS. Botsford, LW. & Warner, RR. ‘Trajectories and correlates of community change in no-take marine reserves.’
Vol. 14, 2004, pp. 1709-1723.
Millennium Ecosystem Assessment. Synthesis. Island Press, Washington, DC, 2005a.
Millennium Ecosystem Assessment. . Island Press, Washington, DC, 2005b.
Vol. 46, issue 4, 2009, pp. 743-751.
Mora, C. Andrefouet, S. Costello, MJ. Kranenburg, C. Rollo, A. Veron, J. Gaston, KJ & Myers, RA. ‘Coral reefs and the global network of marine protected areas’. Science Vol. 312, 2006, pp. 1750-1751.
Vol. 3, 2000, pp. 321-332.
Muller, EM. Rogers, CS. Spitzack, AS. & van Woesik, R. ‘Bleaching increases likelihood of disease on Acropora palmata (Lamarck) in Hawksnest Bay, St. John, US Virgin Islands’. Coral Reefs Vol. 27, no. 1, 2008, pp. 191-195.
Mumby, PJ. & Harborne, AR. ‘Marine reserves enhance the recovery of corals on Caribbean reefs’. Vol. 5, 2010, e8657.
in light of rapidly evolving ecological paradigms’. Vol. 23, issue 10, 2008, pp. 555-563.
Murawski, SA. Brown, R. Lai, HL. Rago, PJ. & Hendrickson, L. ‘Large-scale
The Georges Bank experience.’ Vol. 66, 2001, pp. 775-798.
of Marine Science Vol. 62, 2005, pp. 1150-1167.
-tem of Marine Protected Areas of the United States of America
Notarbartolo-di-Sciara, G. Agardy, T. Hyrenbach, D. Scovazzi, T. & Van Klaveren, P ‘The Pelagos Sanctuary for Mediterranean marine mammals’.
Vol. 18, 2008, 367-391.
-tected Areas, Jeju Island, Korea, October 24-27, 2006.
Perry, AL. Low, PJ. Ellis, JR. & Reynolds, JD. ‘Climate change and Science Vol. 308, no. 5724, 2005,
pp, 1912-1915.
Perry, I. Planque, B. Jennings, S. Brander, K. Cury, P. & Möllman, C.
and management responses’. Journal of Marine Systems Vol. 79, nos. 3-4, 2010, pp. 427-435.
Pinto da Silva, S. ‘From common property to co-management: Lessons Marine Policy Vol. 28, 2004,
pp. 419-428.
Pollnac, RB. Crawford, BR. & Gorospe, MLG. ‘Discovering factors that
Visayas. Philippines’. Ocean & Coastal Management Vol. 44, 2004, pp. 683–710.
Pomeroy, RS. Parks, JE. & Watson, LM. How is Your MPA Doing? A Guide-
. IUCN, Gland, Switzerland & Cambridge, UK, 2004.
l’Arique de l’Ouest (PRCM). Regional strategy for marine protected areas in West Africa www.pcrm.mr
study of Lyme Bay, England’. Ocean & Coastal Management Vol. 53, 2010, pp. 135-145.
Reid, PC. Fischer, CC. Lewis-Brown, E. Meredith, MP. Sparrow, M.
Kendall, M. Kasten, S. Keeling, R. Le Quéré, C. Mackenzie, FT. Malin, G. Mauritzen, C. Ólafsson, J. Paull, C. Rignot, E. Shimada, K. Vogt, M. Wallace, C. Wang, Z. & Washington, R. 2009. Impacts of the Oceans on Climate Change. In . Sims, DW ed. Academic Press, St. Louis, MO, US, 2009.
Roberts, CM. & Hawkins, JP. Fully-protected marine reserves: a guide. WWF Endangered Seas Campaign, Washington, DC, USA, and Environment Department, University of York, UK, 2000.
Vol. 10, issue 5, 2008, pp. 565-589.
Russ, GR. Alcala, AC. Maypa, AP. Calumpong, HP. & White, AT. ‘Marine Vol. 14, 2004, pp.
597-606.
Sabine, CL. Feely, RA. Gruber, N. Key, RM. Lee, K. Bullister, JL. Wanninkhof, R. Wong, CS. Wallace, DWR. Tilbrook, B. Millero, FJ. Peng, T-H. Kozyr, A. Ono, T. & Rios, AF. ‘The oceanic sink for anthropgenic CO
2’. Science Vol.
305, no. 5729, 2004, pp. 367-371.
Sadovy, YJ. Donaldson, TJ. Graham, TR. McGilvray, F. Muldoon, GJ. Phillips,
Fish Trade. Asian Development Bank, Manila, Philippines, 2003.
Sala, E. Aburto-Oropeza, O. Paredes, G. Parra, I. Barrera, JC. & Dayton, PK. ‘A general model for designing networks of marine reserves’. Science Vol. 298, 2002, pp. 1991-1993.
Sale, PF. Butler IV, MJ. Hooten, AJ. Kritzer, JP. Lindeman, KC. Sadovy de Mitcheson, YJ. Steneck, RS. & van Lavieren, H. Stemming Decline of the
. UNU-INWEH, Hamilton, Canada, 2008.
Sale, PF. Van Lavieren, H. Ablan Lagman, MC. Atema, J. Butler, M. Fauvelot, C. Hogan, JD. Jones, GP. Lindeman, KC. Paris, CB. Steneck R. & Stewart, HL.
Targeted Research & Capacity Building for Management Program, UNU-INWEH, Ontario, Canada, 2010.
Salm, RV. Done, T. McLeod, E. ‘Marine protected area planning in a changing climate’ in Coral reefs and climate change: science and management. Eds. Phinney, JT. Hoegh-Guldberg, O. Kleypas, J. Skirving, WJ. & Strong, A. American Geophysical Union, Washington, DC, 2006.
Salm, RV. Clark, J. & Siirila, E. Marine Protected Areas: A guide for planners and managers. IUCN, Washington, DC, 2000.
Sand, PH. ‘Green Enclosure of Ocean Space – ?’ Vol. 54, 2007, pp. 374-376.
Scholz, A. Bonzon, K. Fujita, R. Benjamin, N. Woodling, N. Black, P & Stein-
knowledge for marine protected area planning in California’. Marine Policy. Vol. 28, issue 4, 2004, pp. 335–349.
Scovazzi, T. ‘Marine Protected Areas on the High Seas: Some Legal and

Law Vol. 19, 2004, pp. 1-17.
Secrétariat du Réseau Régional des Aires Marines Protegées en Afrique de L’ouest (RAMPAO).
. IUCN, Dakar, Sénégal, 2007.
Species. A Threat to Biodiversity. Montréal, Québèc, Canada. 2009.
the Second Ad Hoc Technical Expert Group on Biodiversity and Climate Change. Technical Series No. 41. Montréal, Québèc, Canada. 2009.
Outlook 3. Montréal, Québèc, Canada. 2010.
Vol. 5, 2010, e9278 (doi:10.1371/journal.pone.0009278).
in Coastal Areas: A Global Assessment of the State of Knowledge’.
In review.
Spalding, MD. Fox, HE. Allen, GR. Davidson, N. Ferdaña, ZA. Finlayson, M.
Molnar, J. Recchia, CA. & Robertson, J. ‘Marine Ecoregions of the World: a BioScience Vol. 57, 2007, pp.
573-583.
Spalding, MD. Kainuma, M. & Collins, L. World Atlas of Mangroves.
a) Spalding, M. Fish, L. & Wood, J. ‘Marine Protected Areas - Coverage and Gaps’ in
. Rome, 2008.
Vol. 1, 2008, pp. 217-226.
Spergel, B. & Moye, M. -
Staub, F. & Hatziolos, ME. Score Card to Assess Progress in Achieving Man-. The World Bank,
Washington, DC, 2004.
Stefansson, G. & Rosenberg, AA. ‘Combining control measures for more
Society B: Biological Sciences Vol. 360, 2005, pp. 133-146.
Stefansson, G. & Rosenberg, AA. ‘Designing marine protected areas for Journal of Fish Biology Vol. 69, 2006, pp. 66-78.
Stewart, GB. Kaiser, MJ. Côté, IM. Halpern, BS. Lester, SE. Bayliss, HR. & Pullin, AS. ‘guidelines for future networks’. Vol. 2, issue 6, 2009, pp. 243–253.
Stobart, B. Warwick, R. Gonzalez, C. Mallol, S. Diaz, D. Renones, O. &
Vol. 384, 2009, pp. 47-60.
Stolton, S. & Dudley, N. [eds.] Arguments for Protected Areas. Earthscan, London, 2010.
Stoner, AW. & Ray, M. ‘Queen conch. Strombus gigas
Vol. 94, 1996, pp. 551-565.
Tawake, A. Parks, J. Radikedike, P. Aalbersberg, B. Vuki, V. & Salafsky, N. Vol. 2, no. 4,
2001, pp. 32-35.
The World Bank. 2006. Scaling up Marine Management: The role of Marine Protected Areas. The World Bank Environment Department, Report No. 36635 – GLB, Washington, DC, 2006.
The World Bank. . The World Bank,
Washington, DC, 2009.
protected areas in Guam. Micronesia.’ Vol. 105, 2007, pp. 527-537.
(UNESCO). . Intergovernmental Oceanographic
Commission (UNESCO-IOC). ed. Paris, 2009.
Centre (UNEP-WCMC). -tected Areas: A Review of ProgressCentre, Cambridge, UK, 2008.
Assembly. 2006.
of the Secretary-General’. A/64/66/Add.1, 2009.
United States Defense Mapping Agency. dataset. Bethesda, MD, USA, not dated.
United States Interagency Ocean Policy Task Force (USIOPTF). ‘Final Rec-
, 2009 (accessed on August 23rd 2010).
Veron, JEN. Hoegh-Guldberg, O. Lenton, TM. Lough, JM. Obura, DO.
2’. Marine
Vol. 58. 2009, pp. 1428-1437.
. Darwin, Australia, in press.
Olyarnik, S. Calladine, A. Fourqurean, JW. Heck, KL. Hughes, AR. Kendrick,
seagrasses across the globe threatens coastal ecosystems’. Proceedings of Vol. 106, 2009, pp. 12377-12381.
Webster, PJ. Holland, GJ. Curry, JA. & Chang, HR. ‘Changes in tropical
Science Vol. 309, no. 5742, 2005, pp. 1844-1846.
Wells, S. & Mangubhai, S. -. IUCN
Eastern Africa Regional Program, Nairobi, Kenya, 2007.
White, A. & Cruz-Trinidad, A. . Coastal Resource
Management Project, Cebu City, Philippines, 1998.
-tected Areas in the Philippines’. Fisheries Improved Sustainable Harvest Project -
2006.
Wilkinson, CR. . GCRMN/
Wood, LJ. Fish, L. Laughren, J. & Pauly, D. ‘Assessing progress towards
Vol. 42, 2008, pp. 340-351.
“Harnessing Tourism for the Millennium Development Goals”. New York, NY, September 13, 2005.
World Wildlife Fund (WWF). ‘MPA Management: How is Your MPA Doing?’
nd September 2009)
95


IUCN-WCPA (International Unionfor Conservation of Nature’s WorldCommission on Protected Areas)Rue Mauverney 28Gland 1196Switzerland
http://www.iucn.org /wcpa
The Nature Conservancy4245 North Fairfax DriveSuite 100ArlingtonVA 22203-1606USA
http://www.nature.org
UPEP-WCMC (UNEP World Conservation Moni-toring Centre)219 Huntingdon Road,Cambridge,CB3 0DL.UK
http://www.unep-wcmc.org/
UNEP (United Nations Environment Programme)United Nations Avenue, Gigiri, PO Box 30552, 00100, Nairobi, Kenya
http://www.unep.org/
UNU-IAS (United Nations University Institute of Advanced Studies)6F International Organizations CenterPacifico-Yokohama1-1-1 Minato Mirai, Nishi-kuYokohama 220-8502Japan
http://www.ias.unu.edu
Agence des aires marines protégéesQuai de la Douane, 42BBP 42932,29229 BREST Cedex 2France
http://www.aires-marines.fr/Accueil.html
The Wildlife Conservation Society2300 Southern BoulevardBronx, New York 10460(718) 220-5100USA
http://www.wcs.org/