global offering of msci indexes at eurex exchange (presentation)
TRANSCRIPT
MSCI derivatives at Eurex
December 2018
www.eurexchange.com
MSCI Derivatives December 2018
2
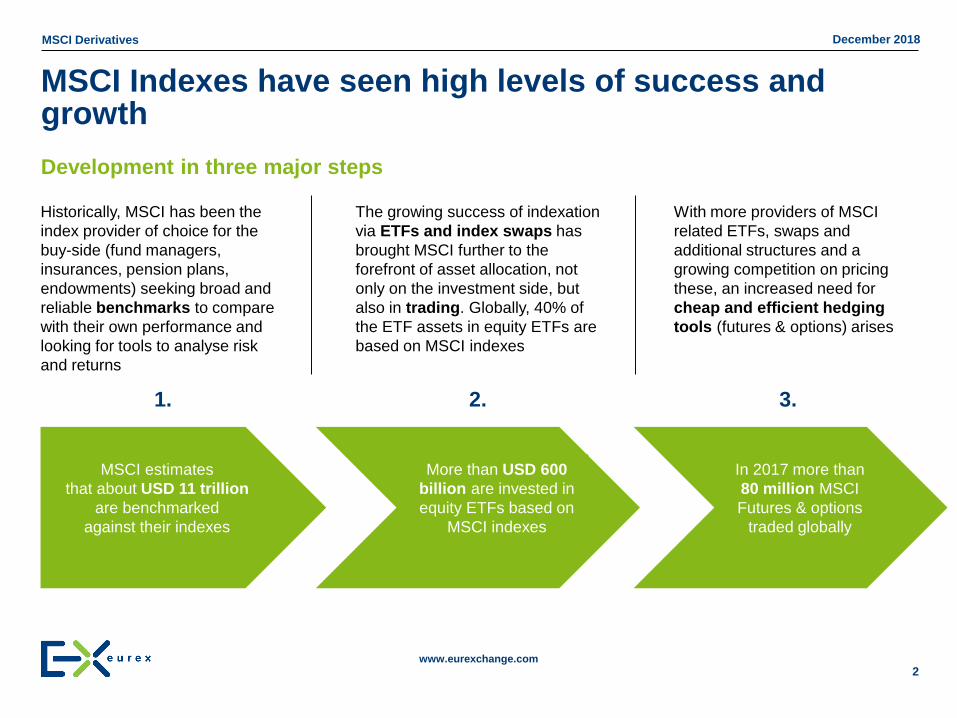
With more providers of MSCI
related ETFs, swaps and
additional structures and a
growing competition on pricing
these, an increased need for
cheap and efficient hedging
tools (futures & options) arises
Historically, MSCI has been the
index provider of choice for the
buy-side (fund managers,
insurances, pension plans,
endowments) seeking broad and
reliable benchmarks to compare
with their own performance and
looking for tools to analyse risk
and returns
The growing success of indexation
via ETFs and index swaps has
brought MSCI further to the
forefront of asset allocation, not
only on the investment side, but
also in trading. Globally, 40% of
the ETF assets in equity ETFs are
based on MSCI indexes
2.
3.
1.
MSCI estimates
that about USD 11 trillion
are benchmarked
against their indexes
More than USD 600
billion are invested in
equity ETFs based on
MSCI indexes
2.In 2017 more than
80 million MSCI
Futures & options
traded globally
2.1.
MSCI Indexes have seen high levels of success and growth
Development in three major steps
www.eurexchange.com
MSCI Derivatives December 2018
3
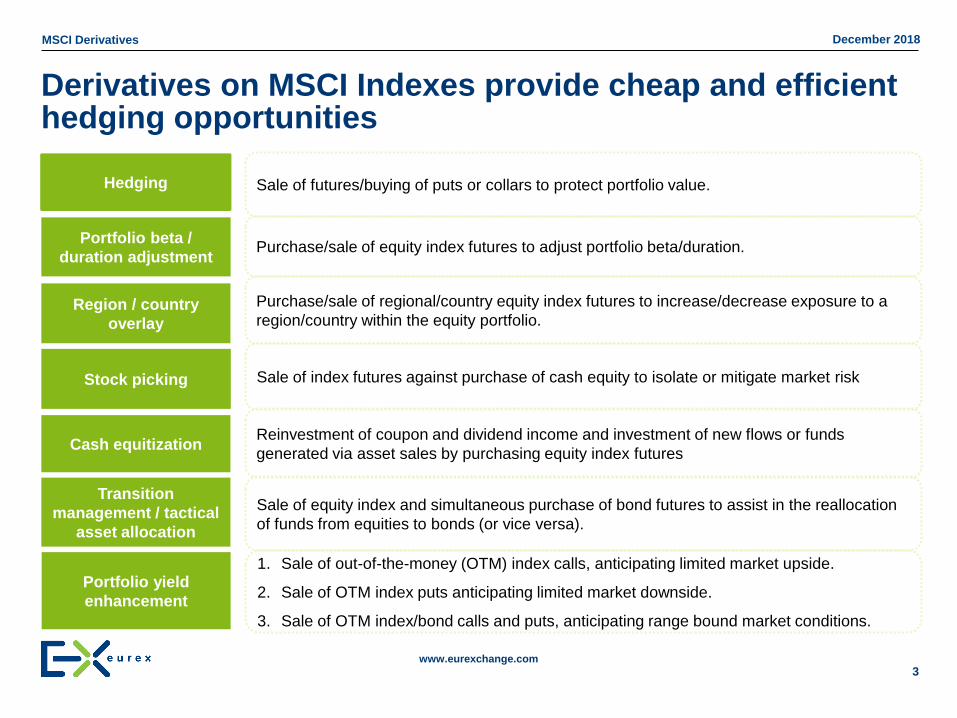
Derivatives on MSCI Indexes provide cheap and efficient hedging opportunities
Portfolio beta /
duration adjustment Purchase/sale of equity index futures to adjust portfolio beta/duration.
Stock picking Sale of index futures against purchase of cash equity to isolate or mitigate market risk
Hedging Sale of futures/buying of puts or collars to protect portfolio value.
Region / country
overlay
Purchase/sale of regional/country equity index futures to increase/decrease exposure to a
region/country within the equity portfolio.
Cash equitizationReinvestment of coupon and dividend income and investment of new flows or funds
generated via asset sales by purchasing equity index futures
Transition
management / tactical
asset allocation
Sale of equity index and simultaneous purchase of bond futures to assist in the reallocation
of funds from equities to bonds (or vice versa).
Portfolio yield
enhancement
1. Sale of out-of-the-money (OTM) index calls, anticipating limited market upside.
2. Sale of OTM index puts anticipating limited market downside.
3. Sale of OTM index/bond calls and puts, anticipating range bound market conditions.
www.eurexchange.com
MSCI Derivatives December 2018
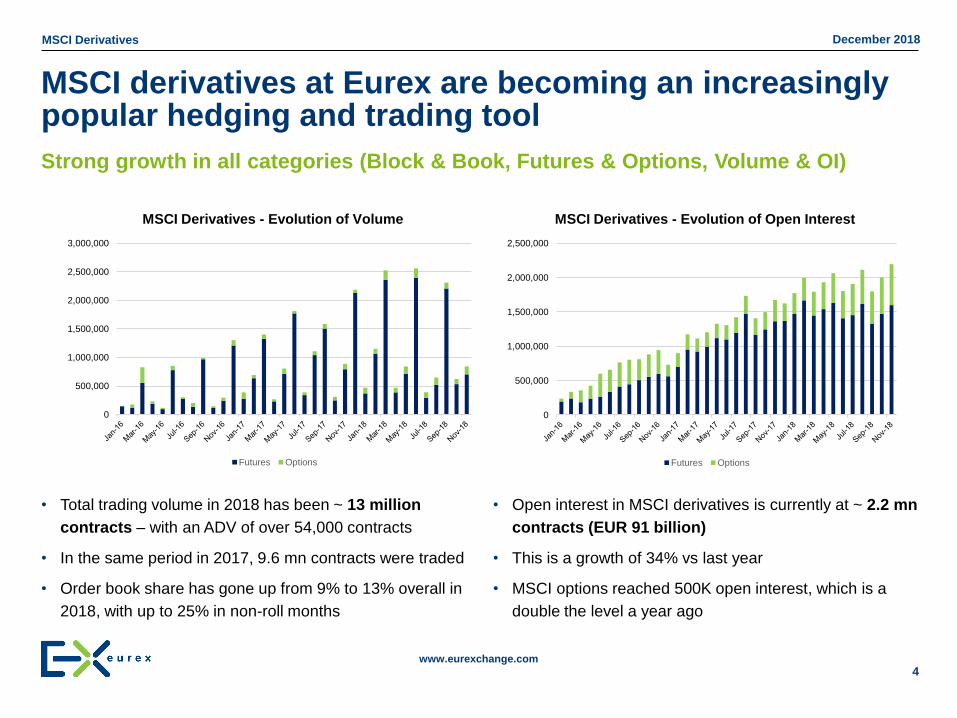
MSCI derivatives at Eurex are becoming an increasingly popular hedging and trading tool
4
• Total trading volume in 2018 has been ~ 13 million
contracts – with an ADV of over 54,000 contracts
• In the same period in 2017, 9.6 mn contracts were traded
• Order book share has gone up from 9% to 13% overall in
2018, with up to 25% in non-roll months
Strong growth in all categories (Block & Book, Futures & Options, Volume & OI)
• Open interest in MSCI derivatives is currently at ~ 2.2 mn
contracts (EUR 91 billion)
• This is a growth of 34% vs last year
• MSCI options reached 500K open interest, which is a
double the level a year ago
0
500,000
1,000,000
1,500,000
2,000,000
2,500,000
3,000,000
MSCI Derivatives - Evolution of Volume
Futures Options
0
500,000
1,000,000
1,500,000
2,000,000
2,500,000
MSCI Derivatives - Evolution of Open Interest
Futures Options
www.eurexchange.com
MSCI Derivatives December 2018
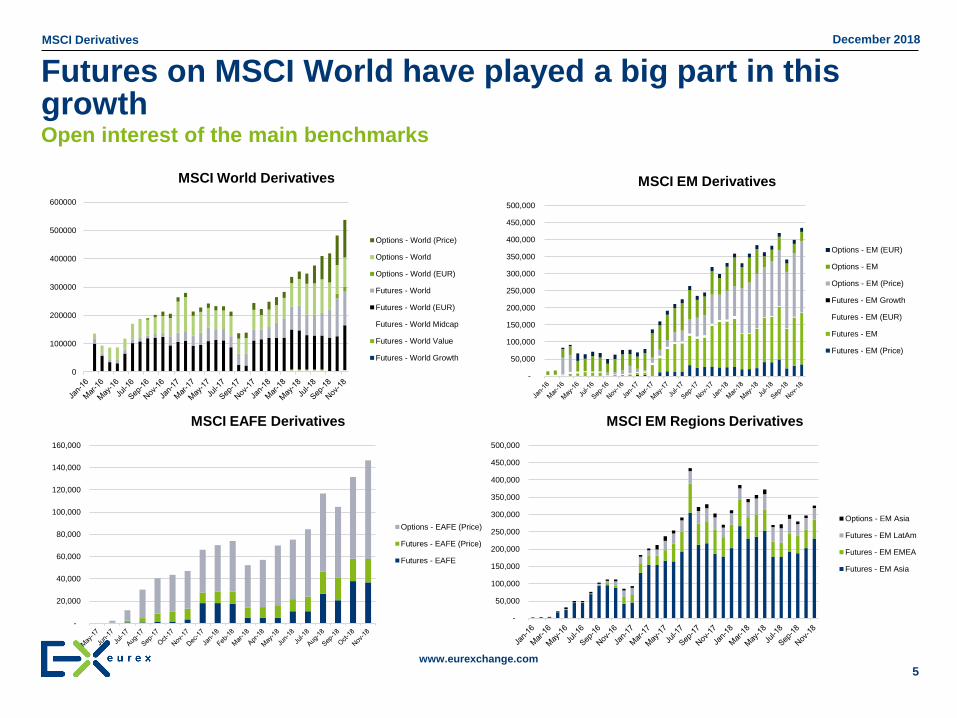
Futures on MSCI World have played a big part in this growth
5
Open interest of the main benchmarks
-
50,000
100,000
150,000
200,000
250,000
300,000
350,000
400,000
450,000
500,000
MSCI EM Derivatives
Options - EM (EUR)
Options - EM
Options - EM (Price)
Futures - EM Growth
Futures - EM (EUR)
Futures - EM
Futures - EM (Price)
-
20,000
40,000
60,000
80,000
100,000
120,000
140,000
160,000
MSCI EAFE Derivatives
Options - EAFE (Price)
Futures - EAFE (Price)
Futures - EAFE
0
100000
200000
300000
400000
500000
600000
MSCI World Derivatives
Options - World (Price)
Options - World
Options - World (EUR)
Futures - World
Futures - World (EUR)
Futures - World Midcap
Futures - World Value
Futures - World Growth
-
50,000
100,000
150,000
200,000
250,000
300,000
350,000
400,000
450,000
500,000
MSCI EM Regions Derivatives
Options - EM Asia
Futures - EM LatAm
Futures - EM EMEA
Futures - EM Asia
www.eurexchange.com
MSCI Derivatives December 2018
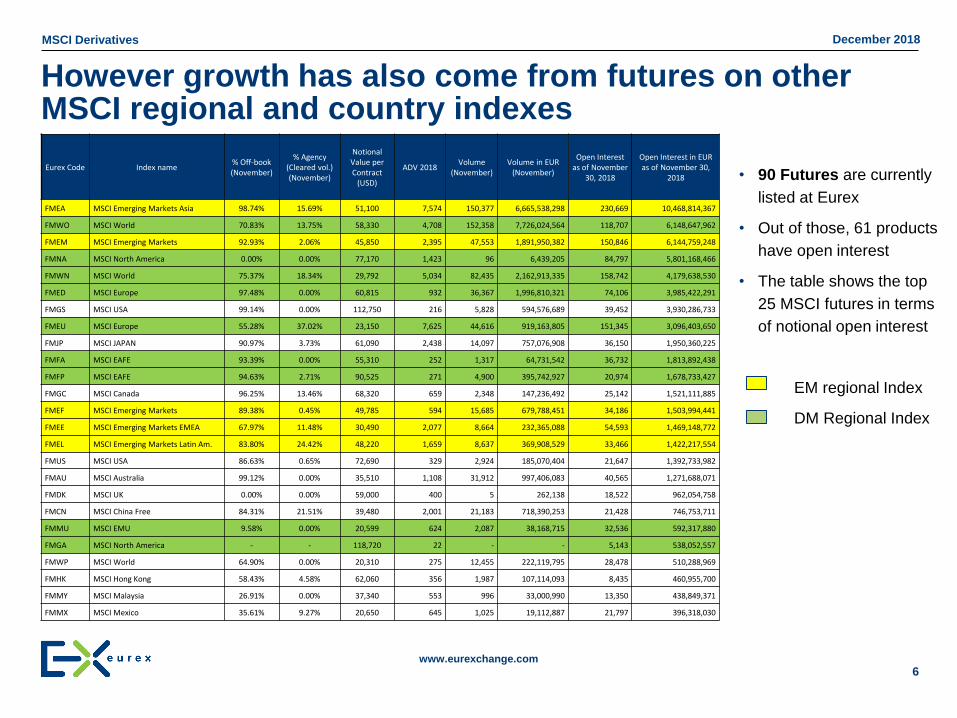
However growth has also come from futures on other MSCI regional and country indexes
6
• 90 Futures are currently
listed at Eurex
• Out of those, 61 products
have open interest
• The table shows the top
25 MSCI futures in terms
of notional open interest
EM regional Index
DM Regional Index
Eurex Code Index name% Off-book (November)
% Agency (Cleared vol.) (November)
Notional Value per Contract
(USD)
ADV 2018Volume
(November)Volume in EUR
(November)
Open Interest as of November
30, 2018
Open Interest in EUR as of November 30,
2018
FMEA MSCI Emerging Markets Asia 98.74% 15.69% 51,100 7,574 150,377 6,665,538,298 230,669 10,468,814,367
FMWO MSCI World 70.83% 13.75% 58,330 4,708 152,358 7,726,024,564 118,707 6,148,647,962
FMEM MSCI Emerging Markets 92.93% 2.06% 45,850 2,395 47,553 1,891,950,382 150,846 6,144,759,248
FMNA MSCI North America 0.00% 0.00% 77,170 1,423 96 6,439,205 84,797 5,801,168,466
FMWN MSCI World 75.37% 18.34% 29,792 5,034 82,435 2,162,913,335 158,742 4,179,638,530
FMED MSCI Europe 97.48% 0.00% 60,815 932 36,367 1,996,810,321 74,106 3,985,422,291
FMGS MSCI USA 99.14% 0.00% 112,750 216 5,828 594,576,689 39,452 3,930,286,733
FMEU MSCI Europe 55.28% 37.02% 23,150 7,625 44,616 919,163,805 151,345 3,096,403,650
FMJP MSCI JAPAN 90.97% 3.73% 61,090 2,438 14,097 757,076,908 36,150 1,950,360,225
FMFA MSCI EAFE 93.39% 0.00% 55,310 252 1,317 64,731,542 36,732 1,813,892,438
FMFP MSCI EAFE 94.63% 2.71% 90,525 271 4,900 395,742,927 20,974 1,678,733,427
FMGC MSCI Canada 96.25% 13.46% 68,320 659 2,348 147,236,492 25,142 1,521,111,885
FMEF MSCI Emerging Markets 89.38% 0.45% 49,785 594 15,685 679,788,451 34,186 1,503,994,441
FMEE MSCI Emerging Markets EMEA 67.97% 11.48% 30,490 2,077 8,664 232,365,088 54,593 1,469,148,772
FMEL MSCI Emerging Markets Latin Am. 83.80% 24.42% 48,220 1,659 8,637 369,908,529 33,466 1,422,217,554
FMUS MSCI USA 86.63% 0.65% 72,690 329 2,924 185,070,404 21,647 1,392,733,982
FMAU MSCI Australia 99.12% 0.00% 35,510 1,108 31,912 997,406,083 40,565 1,271,688,071
FMDK MSCI UK 0.00% 0.00% 59,000 400 5 262,138 18,522 962,054,758
FMCN MSCI China Free 84.31% 21.51% 39,480 2,001 21,183 718,390,253 21,428 746,753,711
FMMU MSCI EMU 9.58% 0.00% 20,599 624 2,087 38,168,715 32,536 592,317,880
FMGA MSCI North America - - 118,720 22 - - 5,143 538,052,557
FMWP MSCI World 64.90% 0.00% 20,310 275 12,455 222,119,795 28,478 510,288,969
FMHK MSCI Hong Kong 58.43% 4.58% 62,060 356 1,987 107,114,093 8,435 460,955,700
FMMY MSCI Malaysia 26.91% 0.00% 37,340 553 996 33,000,990 13,350 438,849,371
FMMX MSCI Mexico 35.61% 9.27% 20,650 645 1,025 19,112,887 21,797 396,318,030
www.eurexchange.com
MSCI Derivatives December 2018
7
*Calculation Date: 11 April 2018 **Near month Expiration: 18 June 2018
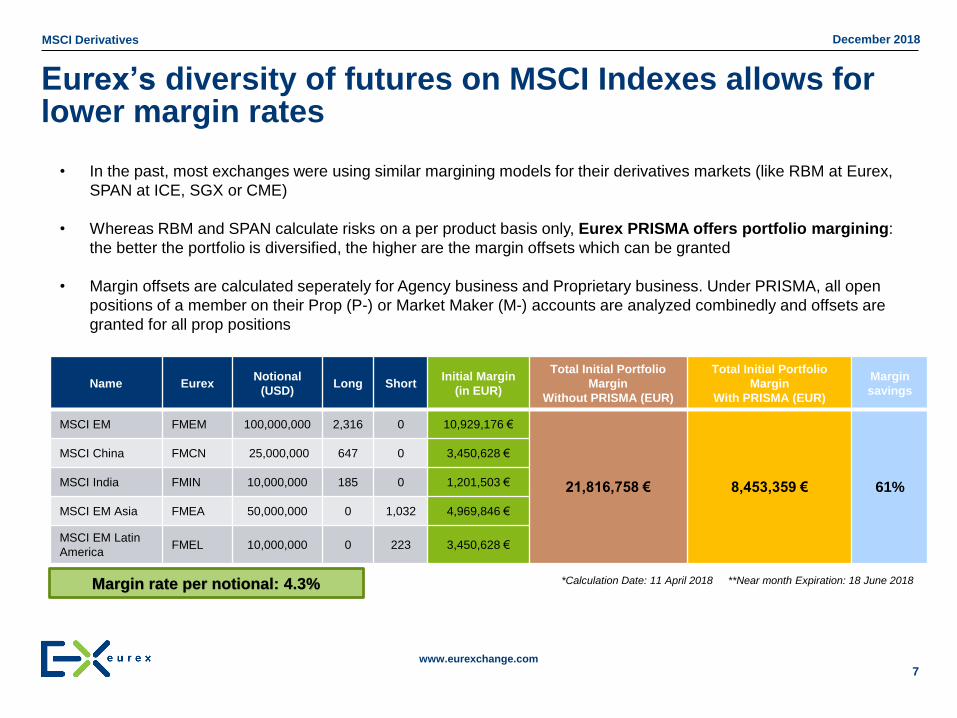
Eurex’s diversity of futures on MSCI Indexes allows for lower margin rates
Name EurexNotional
(USD)Long Short
Initial Margin
(in EUR)
Total Initial Portfolio
Margin
Without PRISMA (EUR)
Total Initial Portfolio
Margin
With PRISMA (EUR)
Margin
savings
MSCI EM FMEM 100,000,000 2,316 0 10,929,176 €
21,816,758 € 8,453,359 € 61%
MSCI China FMCN 25,000,000 647 0 3,450,628 €
MSCI India FMIN 10,000,000 185 0 1,201,503 €
MSCI EM Asia FMEA 50,000,000 0 1,032 4,969,846 €
MSCI EM Latin
AmericaFMEL 10,000,000 0 223 3,450,628 €
• In the past, most exchanges were using similar margining models for their derivatives markets (like RBM at Eurex,
SPAN at ICE, SGX or CME)
• Whereas RBM and SPAN calculate risks on a per product basis only, Eurex PRISMA offers portfolio margining:
the better the portfolio is diversified, the higher are the margin offsets which can be granted
• Margin offsets are calculated seperately for Agency business and Proprietary business. Under PRISMA, all open
positions of a member on their Prop (P-) or Market Maker (M-) accounts are analyzed combinedly and offsets are
granted for all prop positions
Margin rate per notional: 4.3%
www.eurexchange.com
MSCI Derivatives December 2018
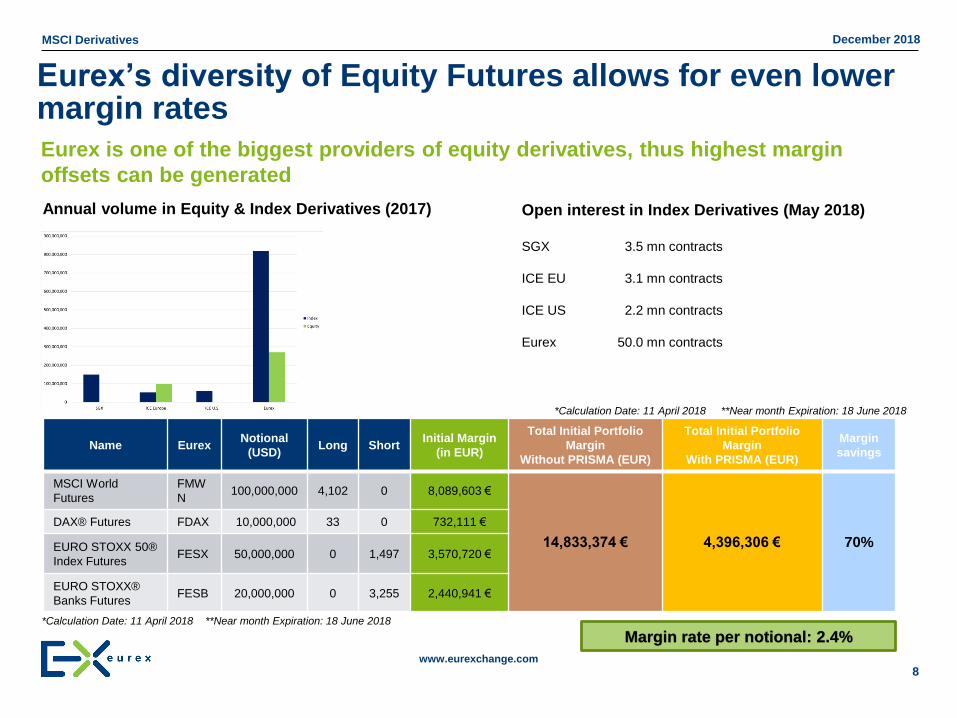
Eurex’s diversity of Equity Futures allows for even lower margin rates
8
*Calculation Date: 11 April 2018 **Near month Expiration: 18 June 2018
Name EurexNotional
(USD)Long Short
Initial Margin
(in EUR)
Total Initial Portfolio
Margin
Without PRISMA (EUR)
Total Initial Portfolio
Margin
With PRISMA (EUR)
Margin
savings
MSCI World
Futures
FMW
N100,000,000 4,102 0 8,089,603 €
14,833,374 € 4,396,306 € 70%
DAX® Futures FDAX 10,000,000 33 0 732,111 €
EURO STOXX 50®
Index FuturesFESX 50,000,000 0 1,497 3,570,720 €
EURO STOXX®
Banks FuturesFESB 20,000,000 0 3,255 2,440,941 €
Eurex is one of the biggest providers of equity derivatives, thus highest margin
offsets can be generated
Annual volume in Equity & Index Derivatives (2017)
SGX 3.5 mn contracts
ICE EU 3.1 mn contracts
ICE US 2.2 mn contracts
Eurex 50.0 mn contracts
Open interest in Index Derivatives (May 2018)
*Calculation Date: 11 April 2018 **Near month Expiration: 18 June 2018
Margin rate per notional: 2.4%
www.eurexchange.com
MSCI Derivatives December 2018
9
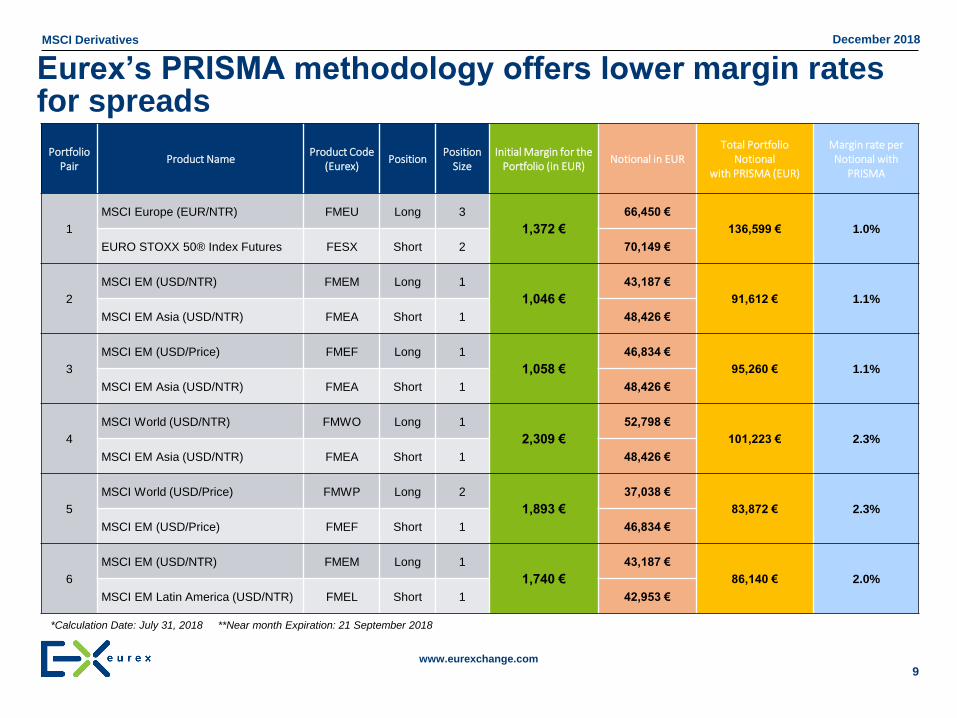
*Calculation Date: July 31, 2018 **Near month Expiration: 21 September 2018
Portfolio Pair
Product NameProduct Code
(Eurex)Position
Position Size
Initial Margin for the Portfolio (in EUR)
Notional in EUR Total Portfolio
Notionalwith PRISMA (EUR)
Margin rate per Notional with
PRISMA
1
MSCI Europe (EUR/NTR) FMEU Long 3
1,372 €
66,450 €
136,599 € 1.0%
EURO STOXX 50® Index Futures FESX Short 2 70,149 €
2
MSCI EM (USD/NTR) FMEM Long 1
1,046 €
43,187 €
91,612 € 1.1%
MSCI EM Asia (USD/NTR) FMEA Short 1 48,426 €
3
MSCI EM (USD/Price) FMEF Long 1
1,058 €
46,834 €
95,260 € 1.1%
MSCI EM Asia (USD/NTR) FMEA Short 1 48,426 €
4
MSCI World (USD/NTR) FMWO Long 1
2,309 €
52,798 €
101,223 € 2.3%
MSCI EM Asia (USD/NTR) FMEA Short 1 48,426 €
5
MSCI World (USD/Price) FMWP Long 2
1,893 €
37,038 €
83,872 € 2.3%
MSCI EM (USD/Price) FMEF Short 1 46,834 €
6
MSCI EM (USD/NTR) FMEM Long 1
1,740 €
43,187 €
86,140 € 2.0%
MSCI EM Latin America (USD/NTR) FMEL Short 1 42,953 €
Eurex’s PRISMA methodology offers lower margin rates for spreads
www.eurexchange.com
MSCI Derivatives December 2018
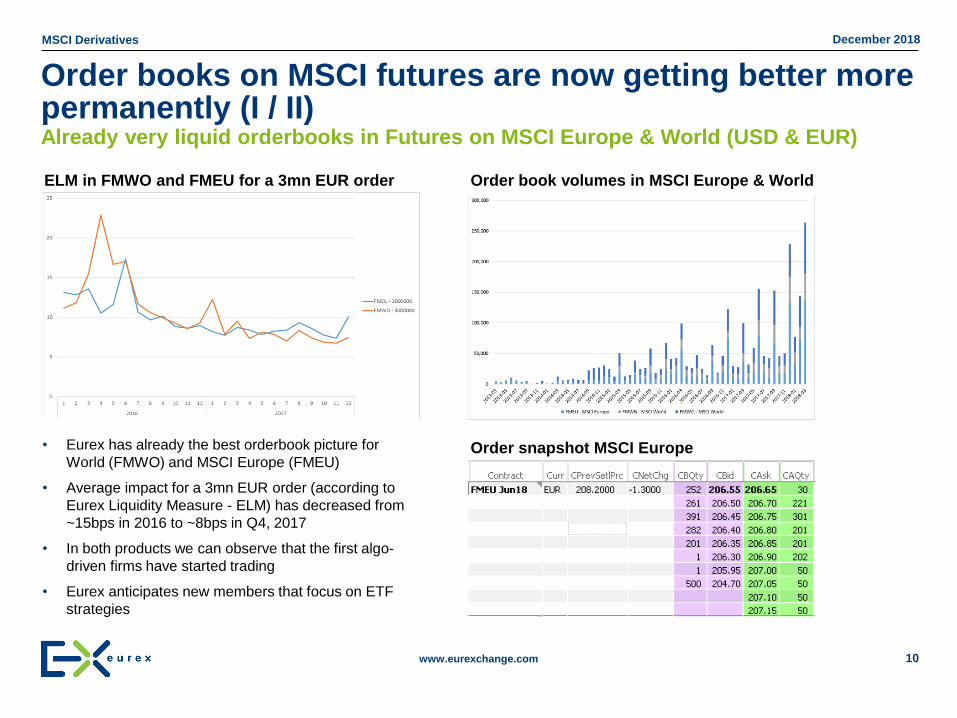
• Eurex has already the best orderbook picture for
World (FMWO) and MSCI Europe (FMEU)
• Average impact for a 3mn EUR order (according to
Eurex Liquidity Measure - ELM) has decreased from
~15bps in 2016 to ~8bps in Q4, 2017
• In both products we can observe that the first algo-
driven firms have started trading
• Eurex anticipates new members that focus on ETF
strategies
ELM in FMWO and FMEU for a 3mn EUR order Order book volumes in MSCI Europe & World
10
Order books on MSCI futures are now getting better more permanently (I / II)Already very liquid orderbooks in Futures on MSCI Europe & World (USD & EUR)
Order snapshot MSCI Europe
www.eurexchange.com
MSCI Derivatives December 2018
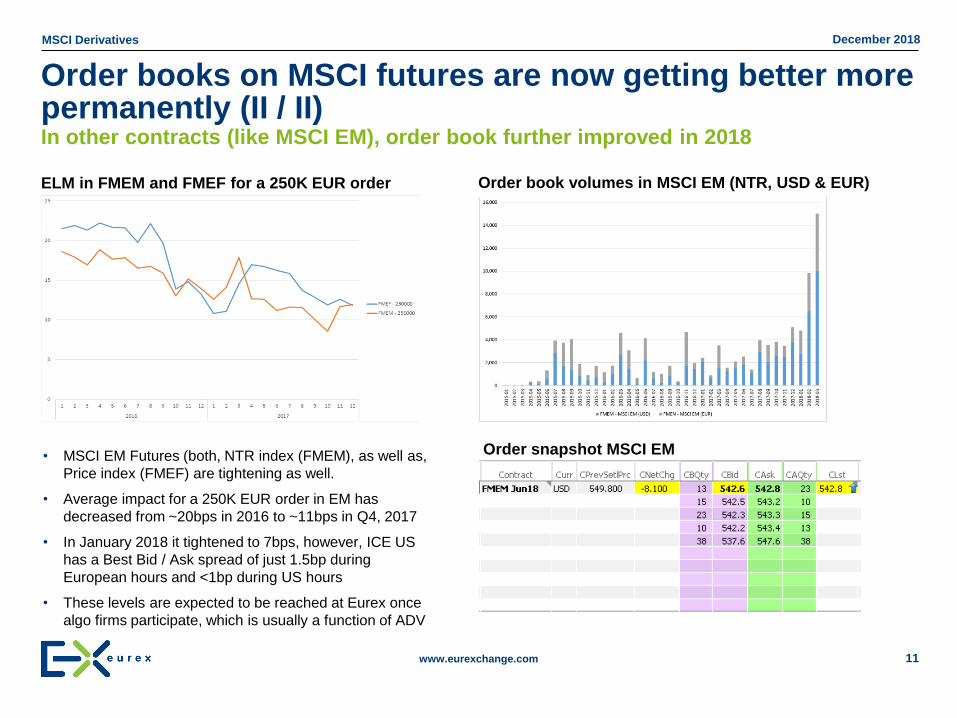
ELM in FMEM and FMEF for a 250K EUR order
• MSCI EM Futures (both, NTR index (FMEM), as well as,
Price index (FMEF) are tightening as well.
• Average impact for a 250K EUR order in EM has
decreased from ~20bps in 2016 to ~11bps in Q4, 2017
• In January 2018 it tightened to 7bps, however, ICE US
has a Best Bid / Ask spread of just 1.5bp during
European hours and <1bp during US hours
• These levels are expected to be reached at Eurex once
algo firms participate, which is usually a function of ADV
11
In other contracts (like MSCI EM), order book further improved in 2018
Order snapshot MSCI EM
Order book volumes in MSCI EM (NTR, USD & EUR)
Order books on MSCI futures are now getting better more permanently (II / II)
www.eurexchange.com
MSCI Derivatives December 2018
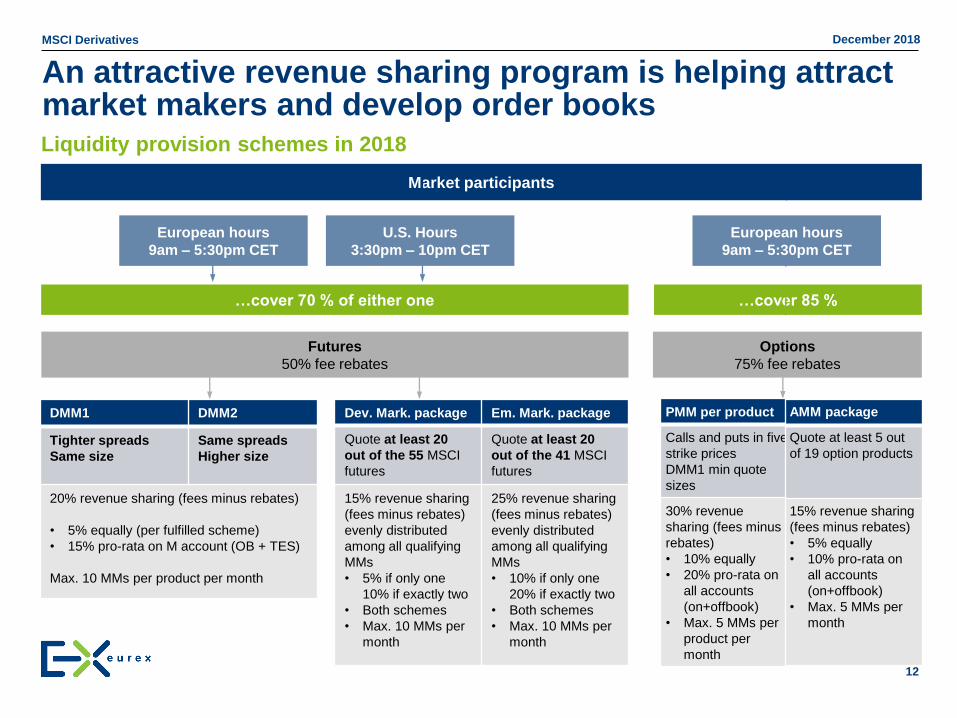
DMM1 DMM2
Tighter spreads
Same size
Same spreads
Higher size
20% revenue sharing (fees minus rebates)
• 5% equally (per fulfilled scheme)
• 15% pro-rata on M account (OB + TES)
Max. 10 MMs per product per month
Market participants
European hours
9am – 5:30pm CET
U.S. Hours
3:30pm – 10pm CET
…cover 70 % of either one
Futures
50% fee rebates
Options
75% fee rebates
…cover 85 %
European hours
9am – 5:30pm CET
Dev. Mark. package Em. Mark. package
Quote at least 20
out of the 55 MSCI
futures
Quote at least 20
out of the 41 MSCI
futures
15% revenue sharing
(fees minus rebates)
evenly distributed
among all qualifying
MMs
• 5% if only one
10% if exactly two
• Both schemes
• Max. 10 MMs per
month
25% revenue sharing
(fees minus rebates)
evenly distributed
among all qualifying
MMs
• 10% if only one
20% if exactly two
• Both schemes
• Max. 10 MMs per
month
PMM per product
Calls and puts in five
strike prices
DMM1 min quote
sizes
30% revenue
sharing (fees minus
rebates)
• 10% equally
• 20% pro-rata on
all accounts
(on+offbook)
• Max. 5 MMs per
product per
month
AMM package
Quote at least 5 out
of 19 option products
15% revenue sharing
(fees minus rebates)
• 5% equally
• 10% pro-rata on
all accounts
(on+offbook)
• Max. 5 MMs per
month
An attractive revenue sharing program is helping attractmarket makers and develop order books
12
Liquidity provision schemes in 2018
www.eurexchange.com
MSCI Derivatives December 2018
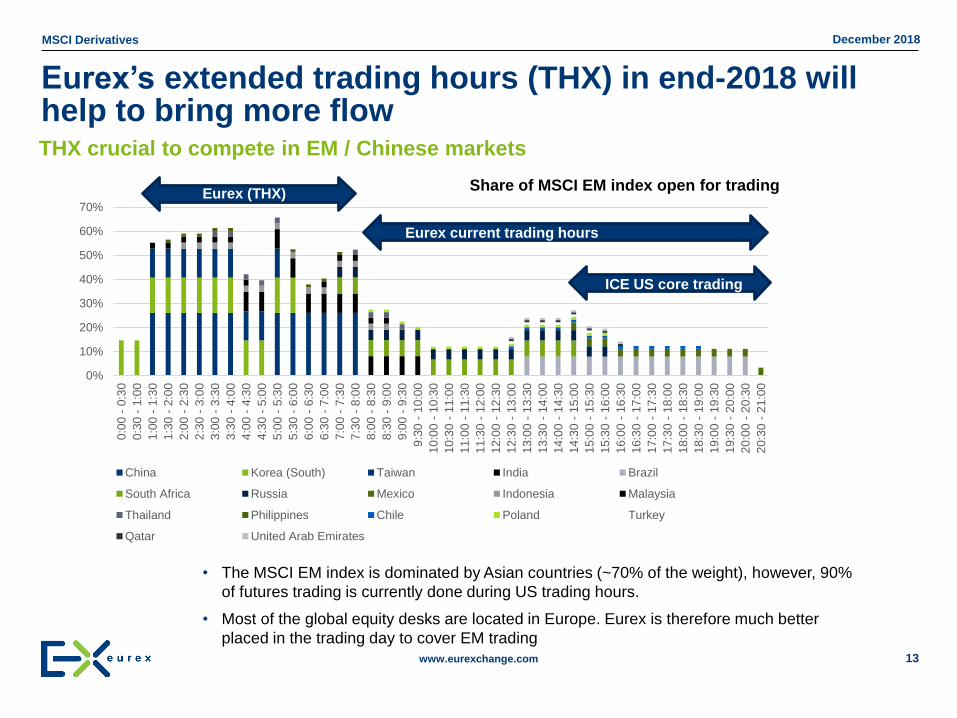
Eurex’s extended trading hours (THX) in end-2018 will help to bring more flow
13
• The MSCI EM index is dominated by Asian countries (~70% of the weight), however, 90%
of futures trading is currently done during US trading hours.
• Most of the global equity desks are located in Europe. Eurex is therefore much better
placed in the trading day to cover EM trading
0%
10%
20%
30%
40%
50%
60%
70%
0:0
0 -
0:3
0
0:3
0 -
1:0
0
1:0
0 -
1:3
0
1:3
0 -
2:0
0
2:0
0 -
2:3
0
2:3
0 -
3:0
0
3:0
0 -
3:3
0
3:3
0 -
4:0
0
4:0
0 -
4:3
0
4:3
0 -
5:0
0
5:0
0 -
5:3
0
5:3
0 -
6:0
0
6:0
0 -
6:3
0
6:3
0 -
7:0
0
7:0
0 -
7:3
0
7:3
0 -
8:0
0
8:0
0 -
8:3
0
8:3
0 -
9:0
0
9:0
0 -
9:3
0
9:3
0 -
10
:00
10:0
0 -
10
:30
10:3
0 -
11
:00
11:0
0 -
11
:30
11:3
0 -
12
:00
12:0
0 -
12
:30
12:3
0 -
13
:00
13:0
0 -
13
:30
13:3
0 -
14
:00
14:0
0 -
14
:30
14:3
0 -
15
:00
15:0
0 -
15
:30
15:3
0 -
16
:00
16:0
0 -
16
:30
16:3
0 -
17
:00
17:0
0 -
17
:30
17:3
0 -
18
:00
18:0
0 -
18
:30
18:3
0 -
19
:00
19:0
0 -
19
:30
19:3
0 -
20
:00
20:0
0 -
20
:30
20:3
0 -
21
:00
China Korea (South) Taiwan India Brazil
South Africa Russia Mexico Indonesia Malaysia
Thailand Philippines Chile Poland Turkey
Qatar United Arab Emirates
Eurex current trading hours
ICE US core trading
Eurex (THX)Share of MSCI EM index open for trading
THX crucial to compete in EM / Chinese markets
www.eurexchange.com
MSCI Derivatives December 2018
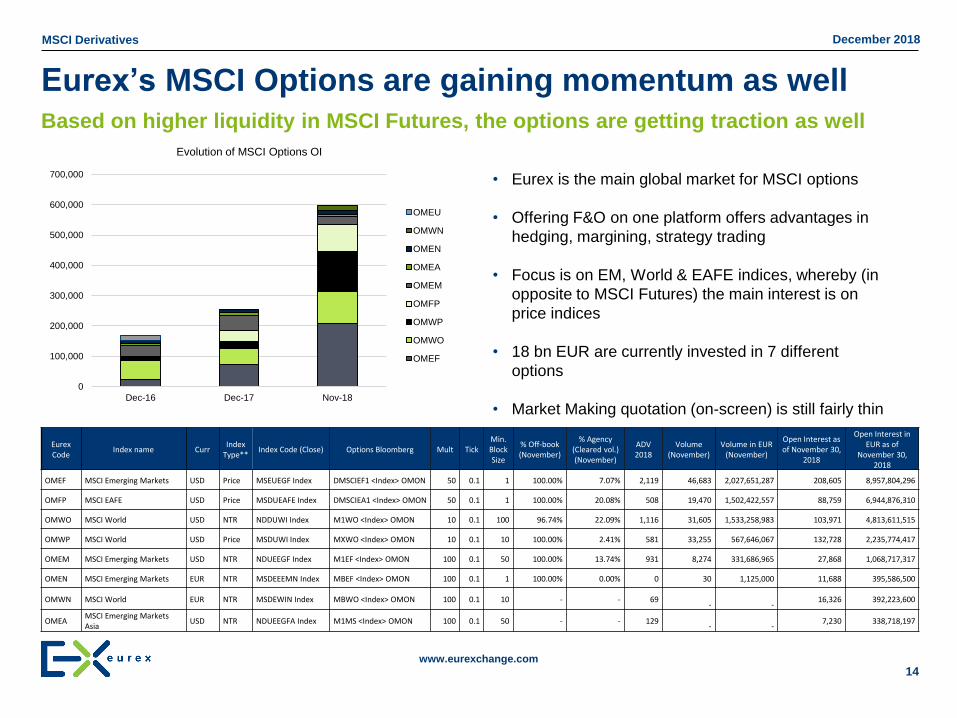
Eurex’s MSCI Options are gaining momentum as well
• Eurex is the main global market for MSCI options
• Offering F&O on one platform offers advantages in
hedging, margining, strategy trading
• Focus is on EM, World & EAFE indices, whereby (in
opposite to MSCI Futures) the main interest is on
price indices
• 18 bn EUR are currently invested in 7 different
options
• Market Making quotation (on-screen) is still fairly thin
14
Based on higher liquidity in MSCI Futures, the options are getting traction as well
0
100,000
200,000
300,000
400,000
500,000
600,000
700,000
Dec-16 Dec-17 Nov-18
Evolution of MSCI Options OI
OMEU
OMWN
OMEN
OMEA
OMEM
OMFP
OMWP
OMWO
OMEF
Eurex Code
Index name CurrIndex
Type**Index Code (Close) Options Bloomberg Mult Tick
Min. Block Size
% Off-book (November)
% Agency (Cleared vol.) (November)
ADV 2018
Volume (November)
Volume in EUR (November)
Open Interest as of November 30,
2018
Open Interest in EUR as of
November 30, 2018
OMEF MSCI Emerging Markets USD Price MSEUEGF Index DMSCIEF1 <Index> OMON 50 0.1 1 100.00% 7.07% 2,119 46,683 2,027,651,287 208,605 8,957,804,296
OMFP MSCI EAFE USD Price MSDUEAFE Index DMSCIEA1 <Index> OMON 50 0.1 1 100.00% 20.08% 508 19,470 1,502,422,557 88,759 6,944,876,310
OMWO MSCI World USD NTR NDDUWI Index M1WO <Index> OMON 10 0.1 100 96.74% 22.09% 1,116 31,605 1,533,258,983 103,971 4,813,611,515
OMWP MSCI World USD Price MSDUWI Index MXWO <Index> OMON 10 0.1 10 100.00% 2.41% 581 33,255 567,646,067 132,728 2,235,774,417
OMEM MSCI Emerging Markets USD NTR NDUEEGF Index M1EF <Index> OMON 100 0.1 50 100.00% 13.74% 931 8,274 331,686,965 27,868 1,068,717,317
OMEN MSCI Emerging Markets EUR NTR MSDEEEMN Index MBEF <Index> OMON 100 0.1 1 100.00% 0.00% 0 30 1,125,000 11,688 395,586,500
OMWN MSCI World EUR NTR MSDEWIN Index MBWO <Index> OMON 100 0.1 10 - - 69- -
16,326 392,223,600
OMEAMSCI Emerging Markets Asia
USD NTR NDUEEGFA Index M1MS <Index> OMON 100 0.1 50 - - 129- -
7,230 338,718,197
www.eurexchange.com
MSCI Derivatives December 2018
15
© Eurex 2018
Deutsche Börse AG (DBAG), Clearstream Banking AG (Clearstream), Eurex Frankfurt AG, Eurex Clearing AG (Eurex Clearing) as well as Eurex Bonds GmbH (Eurex Bonds) and Eurex Repo GmbH
(Eurex Repo) are corporate entities and are registered under German law. Eurex Zürich AG is a corporate entity and is registered under Swiss law. Clearstream Banking S.A. is a corporate entity and is
registered under Luxembourg law. Deutsche Boerse Asia Holding Pte. Ltd., Eurex Clearing Asia Pte. Ltd. and Eurex Exchange Asia Pte. Ltd are corporate entities and are registered under Singapore
law. Eurex Frankfurt AG (Eurex) is the administrating and operating institution of Eurex Deutschland. Eurex Deutschland and Eurex Zürich AG are in the following referred to as the “Eurex Exchanges”.
All intellectual property, proprietary and other rights and interests in this publication and the subject matter hereof (other than certain trademarks and service marks listed below) are owned by DBAG
and its affiliates and subsidiaries including, without limitation, all patent, registered design, copyright, trademark and service mark rights. While reasonable care has been taken in the preparation of
this publication to provide details that are accurate and not misleading at the time of publication DBAG, Clearstream, Eurex, Eurex Clearing, Eurex Bonds, Eurex Repo as well as the Eurex Exchanges
and their respective servants and agents (a) do not make any representations or warranties regarding the information contained herein, whether express or implied, including without limitation any
implied warranty of merchantability or fitness for a particular purpose or any warranty with respect to the accuracy, correctness, quality, completeness or timeliness of such information, and (b) shall
not be responsible or liable for any third party’s use of any information contained herein under any circumstances, including, without limitation, in connection with actual trading or otherwise or for any
errors or omissions contained in this publication.
This publication is published for information purposes only and shall not constitute investment advice respectively does not constitute an offer, solicitation or recommendation to acquire or dispose of
any investment or to engage in any other transaction. This publication is not intended for solicitation purposes but only for use as general information. All descriptions, examples and calculations
contained in this publication are for illustrative purposes only.
Eurex and Eurex Clearing offer services directly to members of the Eurex exchanges respectively to clearing members of Eurex Clearing. Those who desire to trade any products available on the Eurex
market or who desire to offer and sell any such products to others or who desire to possess a clearing license of Eurex Clearing in order to participate in the clearing process provided by Eurex
Clearing, should consider legal and regulatory requirements of those jurisdictions relevant to them, as well as the risks associated with such products, before doing so.
Eurex derivatives are currently not available for offer, sale or trading in the United States or by United States persons (other than EURO STOXX 50® Index Futures, EURO STOXX 50® Index Quanto
Futures, EURO STOXX 50® ex Financials Index Futures, EURO STOXX® Select Dividend 30 Index Futures, EURO STOXX® Index Futures, EURO STOXX® Large/Mid/Small Index Futures, STOXX®
Europe 50 Index Futures, STOXX® Europe 600 Index Futures, STOXX® Europe 600 Banks/Industrial Goods & Services/Insurance/Media/Travel & Leisure/Utilities Futures, STOXX® Europe
Large/Mid/Small 200 Index Futures, DAX®/Mini-DAX®/MDAX®/TecDAX® Futures, SMIM® Futures, SLI Swiss Leader Index® Futures, MSCI World (FMWO, FMWP, FMWN)/Europe (FMED, FMEU,
FMEP)/Europe Value/Europe Growth/Europe ex Switzerland/Emerging Markets (FMEM, FMEF, FMEN)/Emerging Markets Latin America/Emerging Markets EMEA/Emerging Markets Asia/EMU/Frontier
Markets/Kokusai (FMKG, FMKN)/AC Asia Pacific/AC Asia Pacific ex Japan/ACWI/Pacific ex Japan/Pacific (FMPG, FMPA)/Australia/China Free/Hong Kong/India/Indonesia/Japan (FMJP,
FMJG)/Malaysia/Mexico/South Africa/Thailand/UK (FMUK, FMDK)/USA/USA Equal Weighted/USA Momentum/USA Quality/USA Value Weighted Index Futures, TA-25 Index Futures, Eurex Daily Futures
on Mini-KOSPI 200 Futures, Daily Futures on TAIEX Futures, VSTOXX® Futures, EURO STOXX 50® Variance Futures as well as Eurex FX, property and interest rate derivatives).
Trademarks and Service Marks
Buxl®, DAX®, DivDAX®, eb.rexx®, Eurex®, Eurex Bonds®, Eurex Repo®, Eurex Strategy WizardSM, Euro GC Pooling®, FDAX®, FWB®, GC Pooling®,,GCPI®, MDAX®, ODAX®, SDAX®, TecDAX®, USD
GC Pooling®, VDAX®, VDAX-NEW® and Xetra® are registered trademarks of DBAG.
All MSCI indexes are service marks and the exclusive property of MSCI Barra.
ATX®, ATX® five, CECE® and RDX® are registered trademarks of Vienna Stock Exchange AG.
IPD® UK Annual All Property Index is a registered trademark of Investment Property Databank Ltd. IPD and has been licensed for the use by Eurex for derivatives.
SLI®, SMI® and SMIM® are registered trademarks of SIX Swiss Exchange AG.
The STOXX® indexes, the data included therein and the trademarks used in the index names are the intellectual property of STOXX Limited and/or its licensors Eurex derivatives based on the STOXX®
indexes are in no way sponsored, endorsed, sold or promoted by STOXX and its licensors and neither STOXX nor its licensors shall have any liability with respect thereto.
Bloomberg Commodity IndexSM and any related sub-indexes are service marks of Bloomberg L.P.
PCS® and Property Claim Services® are registered trademarks of ISO Services, Inc.
Korea Exchange, KRX, KOSPI and KOSPI 200 are registered trademarks of Korea Exchange Inc.
Taiwan Futures Exchange and TAIFEX are registered trademarks of Taiwan Futures Exchange Corporation. Taiwan Stock Exchange, TWSE and TAIEX are the registered trademarks of Taiwan Stock
Exchange Corporation.
BSE and SENSEX are trademarks/service marks of Bombay Stock Exchange (BSE) and all rights accruing from the same, statutory or otherwise, wholly vest with BSE. Any violation of the above would
constitute an offence under the laws of India and international treaties governing the same.
The names of other companies and third party products may be trademarks or service marks of their respective owners.