global oil to 2030: a quantitative assessment in the context of international affairs...
TRANSCRIPT

ISNETH Zurich
EnErgy and thE EnvironmEnt global oil to 2030: a QuantitativE assEssmEnt in thE ContExt of intErnational affairs
intErnational rElations and sECurity nEtwork
Tom W. O’Donnell, PhD
EnErgy and thE EnvironmEnt global oil to 2030: a QuantitativE assEssmEnt in thE ContExt of intErnational affairs
intErnational rElations and sECurity nEtwork
tablE of ContEnts
International Relations and Security Network (ISN) © 2007 ISN
Introduction ......................................................................................................................................................... 4Oil Demand ............................................................................................................................................................5
oil is the single largest source of world energy ................................................................................5Economic growth and transportation infrastructure ...................................................................6
Resources ............................................................................................................................................................... 8uneven distribution of conventional proven reserves .................................................................9Decline of the “Global North”..................................................................................................................9the new powerhouses.............................................................................................................................. 10
Appendix A: Proven Reserves and Rents .................................................................................................12Appendix B: Conventional vs. non-Conventional Oil .........................................................................13Endnotes ...............................................................................................................................................................14About the Author ..............................................................................................................................................15

in the new century, international affairs are increasingly connected with petroleum. the importance of oil to the global economy and to geo-strategy is not about to diminish, in spite of the most optimistic plans and hopes for alternative means of fueling global transportation, but will be heightened over the next quarter century. herein we hope to give the reader a sober quantitative understanding of this reality. we assess data and projections for the oil sector to 2030, taken from the world’s principle energy forecasting agencies.1 we find that economic growth will persistently drive transportation-based demand for oil distillates. the increasing oil-market supply required to meet this demand is already causing a great expansion of investment in existing oil fields and drive to open up untapped reserves. the progressive depletion of aging Northern-Hemisphere oil fields will continually concentrate global dependence on still-abundant, highly-concentrated Persian gulf oil. Increasingly, five states in the Persian Gulf will together constitute, more so than ever before, “the global oil spigot.” The implications for international affairs from this regional concentration of oil-market supplies are of great moment.
introduCtion
�International Relations and Security Network (ISN) © 2007 ISN

Oil is the single largest source of world energy and will remain so in 2030Figure 1 shows the “World Primary Energy Demand” over time, as given by the international Energy agency (iEa) of the oECd.2 the data to the right are projections to 2030 based on the iEa reference Scenario – the most likely future scenario given present and announced policies of states. all data is given in “million tonnes of oil equivalent” (Mtoe), that is, the amount of oil that would be required to replace each source. there are several things immediately obvious from this and related data:
First: The single largest source of the world’s primary energy is oil and this will continue until 2030, with demand for oil increasing by over 42 percent. in percentage terms, oil now provides about 40 percent of the world’s primary energy. the previous iEa bi-annual forecast in 2004, foresaw the fraction of oil remaining constant at this level until 2030. however, the steep oil-price increases beginning in 2003 led to some fractional diminution of that projection.
The US Department of Energy’s (DOE) Energy information agency (Eia) data, shown in figure 2 as “World Marketed Energy Use by Energy Type from 1980 to 2030,” are similar to the OECD/IEA projections. In the DOE/EIA reference case, world oil demand increases by 47 percent from 2003 to 2030,3 and this, too, is somewhat less than previously forecast, before the price rises from 2003. as seen in Figure 3, oil’s fraction of the total mix of primary energy sources is now seen to fall somewhat in the Eia projection, from 39 percent to 33 percent by the year 2030.4 the consensus, then, from Eia and iEa projections is that by 2030, oil demand will increase by well over 40 percent and will clearly remain the single largest contribution to global primary energy – well above the contributions from either coal or natural gas.
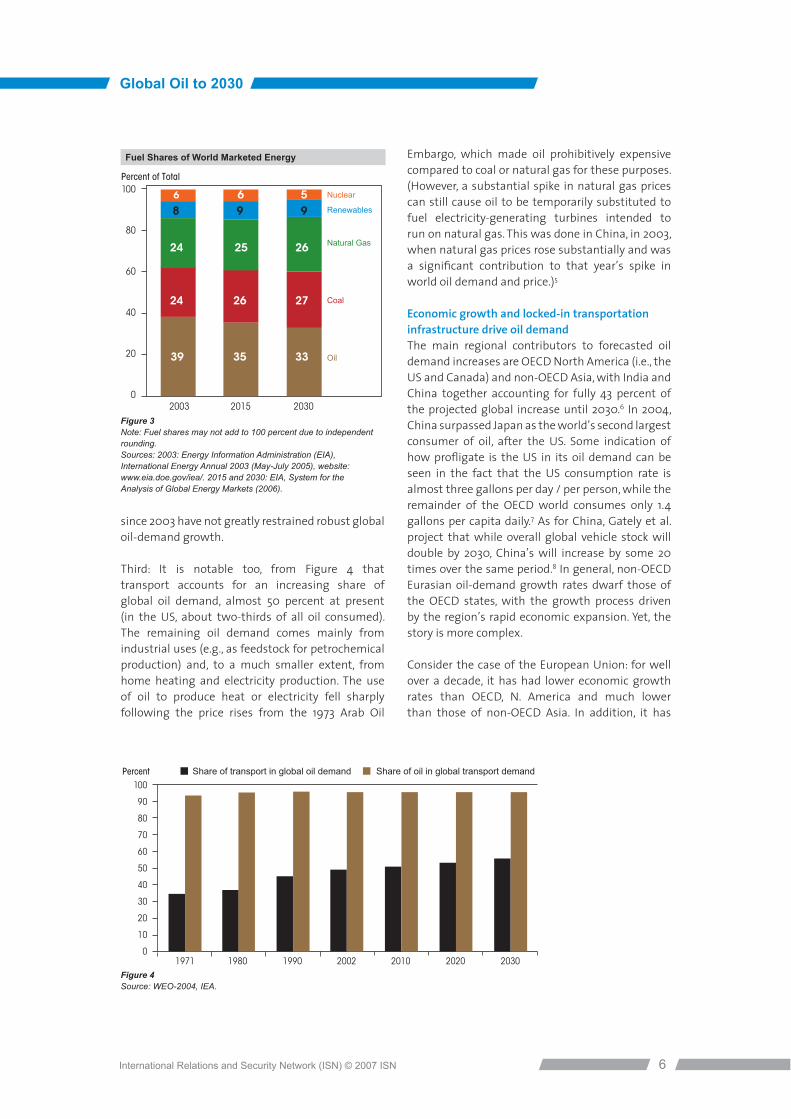
second: oil demand has become highly inelastic (resistant) to price pressures. during the recent three-year period of sharply elevated price hikes (from 2003-2006), demand has continued to grow. the central reality here is that in most of the world, there simply are no feasible transportation alternatives available to owners of autos and trucks but to continue driving (to work, to shop, to transport goods, etc.) despite price increases. globally, only a small percentage of transportation
is oil-independent. This can be seen in Figure 4’s display of iEa data, which shows the percentage increase over time of transportation fueled by oil. oil products now fuel about 95 percent of all transport globally. several factors contribute to this resilience of demand: most importantly, continual decreases over time in energy intensity (that is energy consumption per gdP), especially in all developed states, have insulated these economies from the immediate inflationary pressures that any jump in the price of oil would have caused in the past. so too, other factors are high vehicle-fuel taxation in many developed states and price subsidies in oil-producing states, both of which tend to insulate vehicle operators from the full impact of price rises. hence, the new oil price levels
oil dEmand
Global Oil to 2030
�International Relations and Security Network (ISN) © 2007 ISN
OilGasCoalOtherNuclearHydro
7 000
6 000
5 000
4 000
3 000
2 000
1 000
0
Mtoe
1970 1980 1990 2000 2010 2020 2030
The Reference Scenario: Word Primary Energy Demand
Figure 1Global demand grows by more than half over the next quarter of acentury, with coal use rising most in absolute terms. Source: World Energy Outlook, 2006, IEA.
250
200
150
100
50
0
Quadrillion Btu
1980 1990 2003 2015 2030
OilCoalNatural GasRenewablesNuclear
History Projections
World Marketed Energy Use by Energy Type
Figure 2Sources: History: Energy Information Administration (EIA), International Energy Annual 2003 (May-July 2005), website: www.eia.doe.gov/iea/. Projections: EIA, System for the Analysis.
since 2003 have not greatly restrained robust global oil-demand growth.
third: it is notable too, from figure 4 that transport accounts for an increasing share of global oil demand, almost 50 percent at present (in the us, about two-thirds of all oil consumed). the remaining oil demand comes mainly from industrial uses (e.g., as feedstock for petrochemical production) and, to a much smaller extent, from home heating and electricity production. the use of oil to produce heat or electricity fell sharply following the price rises from the 1973 arab oil
Embargo, which made oil prohibitively expensive compared to coal or natural gas for these purposes. (however, a substantial spike in natural gas prices can still cause oil to be temporarily substituted to fuel electricity-generating turbines intended to run on natural gas. this was done in China, in 2003, when natural gas prices rose substantially and was a significant contribution to that year’s spike in world oil demand and price.)5
Economic growth and locked-in transportation infrastructure drive oil demandthe main regional contributors to forecasted oil demand increases are oECd north america (i.e., the us and Canada) and non-oECd asia, with india and China together accounting for fully 43 percent of the projected global increase until 2030.6 in 2004, China surpassed Japan as the world’s second largest consumer of oil, after the us. some indication of how profligate is the US in its oil demand can be seen in the fact that the us consumption rate is almost three gallons per day / per person, while the remainder of the oECd world consumes only 1.4 gallons per capita daily.7 as for China, gately et al. project that while overall global vehicle stock will double by 2030, China’s will increase by some 20 times over the same period.8 in general, non-oECd Eurasian oil-demand growth rates dwarf those of the oECd states, with the growth process driven by the region’s rapid economic expansion. Yet, the story is more complex.
Consider the case of the European union: for well over a decade, it has had lower economic growth rates than oECd, n. america and much lower than those of non-oECd asia. in addition, it has
Global Oil to 2030
�International Relations and Security Network (ISN) © 2007 ISN
100
80
60
40
20
02003 2015 2030
Percent of Total
33
27
26
9566
98
2524
2624
3539
Nuclear
Renewables
Natural Gas
Coal
Oil
Fuel Shares of World Marketed Energy
Figure 3Note: Fuel shares may not add to 100 percent due to independentrounding. Sources: 2003: Energy Information Administration (EIA),International Energy Annual 2003 (May-July 2005), website:www.eia.doe.gov/iea/. 2015 and 2030: EIA, System for theAnalysis of Global Energy Markets (2006).
100
90
80
70
60
50
40
30
20
10
01971 1980 1990 2002 2010 2020 2030
Share of transport in global oil demand Share of oil in global transport demandPercent
Figure 4 Source: WEO-2004, IEA.

had the most aggressive state-financed R&D and investment in non oil-based transportation (new mass-transit, high-speed trains and system rationalization, etc.). nevertheless, the net impact of lower growth rates and aggressive intervention has been minimal. this can be seen in figure 5, which shows how over three decades, Eu automobile-passenger kilometers traveled have increased at a remarkably consistent rate (truck-freight kilometers have also risen similarly), while rail and bus passenger kilometers have remained quite flat. While oil demand is indeed stimulated by rapid economic expansion, as seen in the cases of China and india, even in societies with relatively low rates of economic growth, transportation based on automobiles and trucks has also continued to expand. the oil-based mode of transportation is deeply locked into the infrastructures of present-day societies worldwide. this reality, which cannot greatly change by 2030, sharply raises the question of how large are the world’s remaining oil resources, what is their geographical distribution, and how available and reliable are they for development.
Global Oil to 2030
7International Relations and Security Network (ISN) © 2007 ISN
4 000
3 500
3 000
2 500
2 000
1 500
1000
500
0
billion Pkm
1970 1974 1978 1982 1986 1990 1994 1998
CarBus & CoachRailwasAir
Automobile & air kmincrease (like U.S.)
... while “traditional” Europeanrailway km are constant
Passenger transport – Growth of traffic by mode of transport, EU-15: 1970–1999
Figure 5*Pkm: transport of one passenger one kilometre

Global Oil to 2030
�International Relations and Security Network (ISN) © 2007 ISN
800.0
700.0
600.0
500.0
400.0
300.0
200.0
100.0
0.0
Billi
on B
arre
ls
Iran
Iraq
Kuwait
SaudiArabia
UAE
No.America
Cent. & So. America
Europe FmrUSSR/E.
Eur.
Mideast Africa Asia/Pacific
Oil Reserves, End-2000 Figure 6.1Source: Oil & Gas Journal.
800.0
700.0
600.0
500.0
400.0
300.0
200.0
100.0
0.0
Billi
on B
arre
ls
Iran
Iraq
Kuwait
SaudiArabia
UAE
Other
No.America
Cent. & So. America
Europe FmrUSSR/E.
Eur.
Mideast Africa Asia/Pacific
Oil Reserves, 1 January 2005 Figure 6.2 Source: Oil & Gas Journal.
800.0
700.0
600.0
500.0
400.0
300.0
200.0
100.0
0
Billi
on B
arre
ls
No.America
Cent. & So. America
Europe FmrUSSR/E.
Eur.
Mideast Africa Asia/Pacific
Iraq & Iran’s future role
Iran IraqIran
Iraq
Kuwait
SaudiArabia
UAE
Other
Oil Reserves, 1 January 2005 Figure 6.4 Source: Oil & Gas Journal.
800.0
700.0
600.0
500.0
400.0
300.0
200.0
100.0
0
Billi
on B
arre
ls
No.America
Cent. & So. America
Europe FmrUSSR/E.
Eur.
Mideast Africa Asia/Pacific
90% Middle-East oil in five Gulf states
Canadiantar-sands
Iran
Iraq
Kuwait
SaudiArabia
UAE
Other
Oil Reserves, 1 January 2005 Figure 6.3 Source: Oil & Gas Journal.
rEsourCEs

Perhaps the most striking feature of conventional petroleum reserves is their uneven geographic distribution. this is of particular interest from the standpoint of international affairs, as geographic concentration of a natural resource raises the possibility of a single state or of a small number of states (acting in concert) exerting predominant influence (that is hegemony) in mediating global access to that resource.
Uneven distribution of conventional proven reservesProven oil reserves are found, in some amount in almost every region of the world, except the deep oceans beyond the continental shelves. figure 6.1 and 6.2 show the distribution of reserves by major region, as given by the Eia for the years 2000 and 2005 respectively.9 the concentration within the Middle East is enormous – about 67 percent of all proven reserves in 2000, while in the later data about 60 percent are there. And, the Middle East’s large share of global oil reserves are, in turn, highly concentrated within the middle East. figure 6.3 shows that 90 percent of middle-East reserves are located in only five countries, all of which border the Persian gulf. these states are (in order of the sizes of their reserves): saudi arabia, iraq, iran, kuwait and the uaE. note, from figure 6.4, that iran and iraq, each taken separately, have more oil reserves than any other entire continent, with the exception of north america.
however, excluding saudi arabia, none of these gulf states are among today’s very largest producers of oil; rather, the us and russia are the second and third largest producers of oil after saudi arabia. figure 7.1 (data from 2003) shows that these three are the powerhouses of global oil production, clearly in a separate league from the next largest producers: iran, mexico, uaE, Canada and the north seas (britain and norway), kuwait and iraq. this second-tier group of seven producers each produce on average only one-third of what the big three each produce. taken together, the big three now produce over one-third of all oil; but, this fact, which has long marked the character of the international oil order, is unsustainable.
Decline of the Global North: the US and Russian Powerhousesmost countries of the global north have already passed the point of their reserves having been half depleted. This nodal point is known as “Hubbard’s Peak.” The US was the previous great oil producer. , playing a role similar to that played by saudi arabia
today, with both the world’s largest reserves, as well as the largest working oil fields, concentrated in west texas and the surrounding areas. however, by 1971 the us had passed the halfway point of depleting its reserves; it has since become progressively more difficult (and expensive) to pump oil from its aging fields. US production in the lower 48 states has been on a downward trajectory ever since. (the discovery of the alaskan north Slope oil field, and its exploitation beginning in the mid-1970s, put online the largest conventional oil field ever found in North America – the last super-giant field added to US reserves. However, by the late 1980s, this field also reached its peak.) In short, although the US remains one of the world’s Big three producers, it is pumping very intensively and unsustainably on rapidly diminishing reserves.
Global Oil to 2030
�International Relations and Security Network (ISN) © 2007 ISN
12
10
8
6
4
2
0
Mbd
SaudiArabia
UnitedStates
Russia Iran Mexico UAE Canada VenezuelaNorthSea
Kuwait Iraq
Ten Top Oil Producers, 2003
Figure 7.1Persian-Gulf States are shown in blue.
SaudiArabia
UnitedStates
Russia Iran Mexico UAE Canada VenezuelaNorth Sea Kuwait Iraq
180
160
140
120
100
80
60
40
20
0
tar sands
R/P (years)
R/P Ratios of Top Ten Oil Producers of 2003
Figure 7.2Source: Calculated from Oil and Gas Journal, 1 January 2007 (Op Cit: DOE/EIA, 9 January 2007) and International Energy Outlook, 200�, Department of Energy/EIA, Report # 0484 (2006).

further, the addition to north american reserves between 2000 and 2005 – seen by comparing Figures 6.1 and 6.3 – is not due to the discovery of another conventional field like the Alaskan Northern slopes. rather, it represents non-conventional tar sands deposits that geologists have known about for generations that are located in alberta, Canada. These have recently been added to Canada’s proven oil reserves, as it has become economical to begin their development given the rise in the price of oil since 2003. this then adds 174 billion barrels to Canada’s proven reserves that previously consisted of only 5.3 billion barrels of conventional oil.10 however, these tar sands are many times more expensive to bring online than the conventional liquid petroleum sources found in the Persian gulf region – or, for that matter, than any conventional oil source – and face many financial, technical and other challenges, not the least being a tremendous environmental impact far beyond that incurred when exploiting conventional oil deposits. while this oil is destined to be “captured” oil, sent south by pipeline to the us market, nevertheless, any increase foreseen in the output of Canadian tar sands will not compensate for the rapid decline in us domestic production.11 as for russia, the other global north powerhouse in the 1990’s, the world’s largest additions to proven reserves occurred in the territories of the former soviet union (fsu), especially within russia. these additions were largely due to the application of modern technology and more powerful pumps to old fields, which revealed more recoverable oil than it had been previously thought was there. and, some new fields were also discovered. The addition
of new technology and investment brought Russia’s rate of production back up significantly, attaining by 2003 75 percent of the level is had pumped in 1990 within the former ussr. however, like the us, russia is now pumping very rapidly on diminishing reserves.
The New Powerhouses: The Rise of Iran, Iraq and the Persian Gulfwhere the future of oil production is slowly headed can be seen by considering reserves-to-production ratios (R/P ration) for today’s top 11 producers, as shown in figure 7.2, where Persian gulf states and Venezuela – the six largest OPEC producers – are highlighted, while the non-oPEC, global north states are shown in black. A country’s R/P ratio is formed by dividing the size of its total proven reserves by its present annual rate of production. this does not give a highly accurate indication of how many years production can continue at present rates, as the rate of extraction slows as a country’s fields age, while, on the other hand, new technology and perhaps new reserves will come into play. However, the R/P ratio is a good means of comparing the relative rates of decline of different countries as major oil producers. there are two ways to interpret figure 7.2. on the one hand, the us and Russia, two of today’s production powerhouses, are clearly producing at rates which, relative to the Persian gulf states, will deplete their reserves rapidly. on the other hand, aside from saudi arabia, all the other countries of the Persian gulf are pumping well below the rates of exploitation seen today in saudi arabia, the us and russia. why this is so is primarily a matter of politics – internal and international. all things being equal, if iraq and
Global Oil to 2030
10International Relations and Security Network (ISN) © 2007 ISN
Net Oil Exports
Mill
ion
Bar
rels
per
Day
7.0
6.0
5.0
4.0
3.0
2.0
1.0
0.071 74 77 80 83 86 89 92 95 98 01 04
Iran’s Oil Production and Consumption 1971-2005E
Figure 8Note: Oil includes crude production and natural gas liquids.Source: IEA.
production (mb/d)
cum
ulat
ive
inve
stm
ent (
billi
on d
olla
rs)
60
50
40
30
20
10
02 3 4 5 6 7 8 9 10
Restoration of production capacityReference ScenarioSlow production expansionRapid production expansion
2010 2010
20102020
2020
20202030
2030
2030
Iraq Oil Investment Scenarios
Figure 9Iraq will need to invest around $� billion to raise oil production capacity to almost �mb/d by 2010 in the Reference Scenario.Source: IEA.

Iran’s oil fields were freely available and safe today for investment, these states could by 2030, produce together as much oil as saudi arabia.
after its invasion of kuwait and subsequent defeat in the gulf war, in 1991, iraq was subject to un and other sanctions on the development of its oil sector right up to the us-british invasion of 2003, which ended the Ba’athist regime. Figure 9 (from a 2004 conference for potential-investors in iraqi oil) gives an idea of how rapidly Iraq’s oil could be ramped up, if politics and security allowed. Production ramp-up scenarios have been studied in detail by hertzmark and Jaffe.12
for the case of iran, figure 8 shows both the country’s historical total production and its internal consumption from before the 1979 islamic revolution and through the 1981-1987 iran-iraq war, until the present. note, that present-day iranian
production is still only about two-thirds of what it was before the revolution, and much of that production is now being absorbed internally by its rapidly expanding population. Iran’s production never recovered from the revolution or from the iran-iraq war. since 1995, iran has been subject to us sanctions on foreign investment in its oil sector and, more recently (January 2007), to new un security Council sanctions. should this political situation change, iran, like iraq, could rapidly attract tens-of-billions of dollars in foreign investment for new upstream-production and refinery technology it has long been unable to access, and quickly move towards becoming something of a production powerhouse.
Data on the size of Iran and Iraq’s reserves indicate that absent internal political conflict and external sanctions on investment, both these states might
quite rapidly, especially given strong global oil demand, over a period of a decade or two, attain membership in the club of the world’s largest producers, while, simultaneously, us and russian high levels of output will decline. the general trend of the increased importance of Persian gulf and, in general, oPEC-produced oil, can be seen in figure 10 showing the iEa projections to 2030 in the standard reference scenario. these developments would, of course, likely produce a very different international oil order, a discussion of which is beyond the scope of our quantitative assessment of the trajectory of demand, proven reserves and supply within the global oil order to 2030.
Global Oil to 2030
11International Relations and Security Network (ISN) © 2007 ISN
120
100
80
60
40
20
01980 1990 2000 2010 2020 2030
OPEC - Middle East OPEC - Other Non-OPEC Non-conventional oil
mb/d
World Oil Production
Figure 10OPEC countries – mainly in Middle East – will account for almost all increases in world oil production to 2030.Source: IEA.

“Proven reserves” are oil resources known to be economically feasible to extract at current market prices. oil reserves that have been discovered and assessed but from which it is not profitable to extract at the present market price are not “proven” reserves. Such fields may later be included in proven reserves if the market price increases sufficiently. (Conversely, some currently proven reserves may be excluded if prices fall to a sufficient degree.) Note too, that there is no requirement that a field has to be placed in production to be listed as proven; many proven reserves have not as yet been developed into producing fields.
reserves can also become proven if new technology is developed that sufficiently cheapens the cost of its extraction even though the price of oil has not risen. the cost of extraction of oil from different quality fields varies greatly across the world, yet it all sells for roughly the same world market price. according to the classical economist david ricardo, owners of natural resources whose costs of extraction from nature are relatively lower than others realize “rents” for their factor of product above the profits earned by those with the most costly means to extract the given natural resource.13
further, the rents realized by these advantaged owners are enhanced as demand increases, as more and more oil that had been previously unprofitable is now brought to market at higher and higher prices.
aPPEndix a: ProvEn rEsErvEs and rEnts
Global Oil to 2030
12International Relations and Security Network (ISN) © 2007 ISN
The term “conventional” oil means liquid oil that can be pumped from underground wells. Conventional oil varies considerably in quality (for example specific gravity, viscosity and sulfur content, etc.), from highly-valued light sweet crude, to medium and heavier crude. the former predominates in the middle East and the latter in, for example, venezuela. the different characteristics of these grades of conventional oil place significantly different constraints on refineries, which must be adjusted to the grade of the oil being processed. In general, US refineries are attuned to receive the relatively heavier oil products characteristic of the western hemisphere.
In contrast, “non-conventional” oil includes what is known in Canada as tar sands oil and which is called “heavy oil” in Venezuela. To be extracted, it must be mined (much like open-pit mining rather than drilling), and heated to a high temperature (usually by steam), to cause it to separate from the sand and other material in which it is found, and to flow. Another non-conventional oil is “shale oil,” an oil-like substance entrapped in shale. This could be extracted either by digging up the rock, crushing and heating it to extract the oil, or it could be extracted by heating the rock in situ beneath the ground, perhaps with steam, and forcing it to flow up through wells drilled to collect it.
aPPEndix b: ConvEntional vs. non-ConvEntional oil
Global Oil to 2030
13International Relations and Security Network (ISN) © 2007 ISN

1�International Relations and Security Network (ISN) © 2007 ISN
1 in making these assessments, we use the most widely-recognized sources, including: the international Energy agency of oECd states, the Energy information agency of the us Department of Energy, the European Union’s Directorate General of Transport and Energy, the Statistical Review of World Energy of British Petroleum, the Oil and Gas Journal, and some academic sources.
2 World Energy Outlook, 2006, IEA. http://www.worldenergyoutlook.org/WEO%202006%20website.pdf, 7 November 2006. “Primary energy” excludes sources such as electricity or hydrogen, which are derived from primary sources.
3 International Energy Outlook, 2006, Energy information agency of the us doE, June 2006, p.2. http://www.eia.doe.gov/oiaf/ieo/pdf/0484(2006).pdf. http://www.eia.doe.gov/oiaf/ieo/excel/figure_10data.xls .
4 International Energy Outlook, 2006, Energy information agency of the us doE, June 2006, p.2. http://www.eia.doe.gov/oiaf/ieo/pdf/0484(2006).pdf
5 Oil Supply and Demand, olivier rech, newsletter of the international association of Energy Economics, Second Quarter, 2006, pp. 15-19. http://www.iaee.org/documents/06spr.pdf#page=15
6 EIA IEO, June 2006. Accessed 7 January, 2007. http://www.eia.doe.gov/oiaf/ieo/oil.html7 EIA, Demand. http://www.eia.doe.gov/pub/oil_gas/petroleum/analysis_publications/oil_
market_basics/demand_text.htm#Global_Oil_Consumption. 8 dermot gately, Joyce dargay and martin sommer, vechicle ownership and income growth,
Worldwide: 1960-2030, July 2006, accessed at: http://www.econ.nyu.edu/dept/courses/gately/research.htm on 8 January, 2007.
9 in turn, from the Oil and Gas Journal.10 Pennwell Corporation, Oil & Gas Journal, Vol. 104.47 (18 December 2006), as cited by DOE/EIA,
http://www.eia.doe.gov/emeu/international/reserves.xls, Footnote 3, accessed 20 January 2007: “... Oil & Gas Journal’s oil reserve estimate for Canada includes 5.2 billion barrels of conventional crude oil and condensate reserves and 174.0 billion barrels of oil sands reserves.”
11 EUROGULF: An EU0GCC Dialogue for Energy Stability and Sustainability, Project Ref.: 4.1041/D/02-008-S07 21089, Supported by the European Commission, Directorate-General for Energy and transport, section 3.5.5.1, p. 68
12 “Iraqi National Oil Company (INOC) Case Study,” Donald Ian Hertzmark and Amy Myers Jaffe,* International Association for Energy Economics (IAEE) Newsletter, 4th Quarter, 2005. pp. 7 – 11.
13 david ricardo, On the Principles of Political Economy and Taxation, (see Chapter 3, “The Rent of Mines”) Published: London: John Murray, 1821. Third Edition. First published: 1817. Accessed 10 January 2007. http://www.econlib.org/library/Ricardo/ricP.html
EndnotEs

Tom O’Donnell is a faculty member at the university of michigan, ann arbor. he is a nuclear physicist whose teaching and research includes the global political economy of oil, energy and environment issues, and political affairs in the middle East.
about thE author
1�International Relations and Security Network (ISN) © 2007 ISN