global opportunities fund international opportunities fund robert gardiner: portfolio manager, ceo...
TRANSCRIPT

GLOBAL OPPORTUNITIES FUNDINTERNATIONAL OPPORTUNITIES FUND
Robert Gardiner: Portfolio Manager, CEO & DORBlake Walker: Portfolio Manager & CIO
Eric Huefner: President & COOMark Siddoway: Head of Client Relations
Grandeur Peak Funds are distributed by ALPS, Inc.
GLOBAL OPPORTUNITIES FUND (GPGOX / GPGIX)
INTERNATIONAL OPPORTUNITIES FUND (GPIOX / GPIIX)

Table of Contents
Firm Background 3Research Process 11Investments Focus 14Sell Discipline 19Portfolio Composition 20Risk Management 21Global Opportunities Portfolio 22International Opportunities Portfolio 25Case for International Micro Caps 26Why Invest With Grandeur Peak 32Contact Us 33Appendix 34
2

Who We Are
• Investment Firm Focused on Global Equities (long)• Long-Term Investment Horizon• Small/Micro Cap Bias
– Faster growth– “Undiscovered” companies– Less efficient markets
• Repeatable Investment Process– Disciplined Global Screening– Rigorous, Bottom Up Due Diligence – Collaborative Analysis– Close Attention to Valuation
3

Who We Are
• Founded July 1, 2011 by Former Wasatch Advisors Team– Robert Gardiner– Blake Walker– Eric Huefner
• 100% Employee Owned– Delaware LLC
• Two Initial Strategies– Global Opportunities Fund– International Opportunities Fund
• Two Share Classes– Investor ($2000 minimum investment)– Institutional ($100,000 minimum investment)
4

Grandeur Peak – What’s In A Name?
Grandeur Peak is a beautiful mountain peak overlooking the Salt Lake valley which provides stunning vistas of the valley below and beyond. Grandeur Peak reminds us of three important things:– One of the best perspectives comes from a broad, global view;– Successful investing, like climbing, takes preparation, discipline,
and passion;– We are hired by our clients in a joint endeavor to ascend the
peak, and we will strive to build a trusted friendship throughout the climb.
5
Grandeur Peak – Core Values
• Passion– We are thorough and passionate global investors
• Quality– We are building what we believe to be the highest quality portfolios
• Discipline– We will be consistent in our approach and process
• Integrity– We do what we say we will do
• Candid– We are candid with each other and our clients
6

Core Investment Beliefs
• In today’s connected world investors need to understand the global landscape of each investment.
• Great investments exist in every corner of the world, and investors need to be looking there to find them.
• The universe of impressive and underfollowed small & micro cap companies around the globe is extensive and growing.
7

Seasoned Team: Founders
• Robert Gardiner, Portfolio Manager, CEO & DOR– 28 years of industry experience– Former Founder and Portfolio Manager of:
• Wasatch Global Opportunities Fund (WAGOX): 11/17/2008 – 6/30/2011• Wasatch Micro Cap Fund (WMICX): 6/19/1995 – 1/31/2007 • Wasatch Micro Cap Value Fund (WAMVX): 7/28/2003 – 1/31/2005• Wasatch Small Cap Value Fund (WMCVX): 12/17/1997– 1/31/2002
• Blake Walker, Portfolio Manager & CIO– 10 years of industry experience– Former Founder and Portfolio Manager of:
• Wasatch International Opportunities Fund (WAIOX): 1/27/2005 – 6/30/2011• Wasatch Global Opportunities Fund (WAGOX): 11/17/2008 – 6/30/2011
• Eric Huefner, President, COO & CCO– 11 years of industry experience
• Former V.P. and Director of Mutual Funds at Wasatch Advisors– 12 years managing businesses for Campbell’s, Kraft/Nabisco & Sara Lee
8

Seasoned Team: Research
• Robert Gardiner, CFA: Analyst, Portfolio Manager & DOR– 25 years of investing experience at
Wasatch Advisors– 10 years of international investing
experience– Highly acclaimed portfolio manager:
profiled in The Wall Street Journal, Forbes, Barron’s, & New York Times.
– Lived in France and speaks French• Blake Walker: Analyst, Portfolio
Manager & CIO– 10 years of international investing
experience at Wasatch Advisors– Acclaimed international small cap
portfolio manager– Lived in France and speaks French
• Amy Sunderland, CFA: Sr. Analyst– Began as a Wasatch analyst in 2003– Previously Goldman private wealth team– Currently lives in Hong Kong & Salt Lake
and speaks Mandarin• Randy Pearce, CFA, MBA: Sr. Analyst
– Began as a Wasatch analyst in 2005– Lived in Brazil and speaks Portuguese
• Spencer Stewart : Sr. Analyst– From sell side at small cap shop, Sidoti– Previously jr analyst at Wasatch Advisors– Lived in Mexico and France and speaks
Spanish and French• Rob Green, MSF: Quantitative Analyst
– Began on the Wasatch Advisors research team in 2006
– Previously at University Venture Fund
9

Research Team: Global Analysts
• We believe understanding a sector globally is critical to finding BICs (Best-In-Class Growth Companies). We have an analyst dedicated to each of the six key global sectors:– Technology: Robert Gardiner
– Healthcare: Robert Gardiner & Blake Walker
– Consumer: Amy Sunderland
– Financials: Randy Pearce
– Energy & Materials: Blake Walker
– Industrials: Spencer Stewart
– Quantitative Analyst, All Industries: Rob Green
10
Research Process: Bottom Up
• Disciplined Screening via DuPont Analysis– 52 week screening schedule keeps us constantly looking at opportunities
• Rigorous Due Diligence– Analyzing the company, industry, competitors, and suppliers– Traveling the world to visit companies and meet senior management
• Collaborative Vetting– Tapping into the experience and insights of the full team in considering
each investment• Build Proprietary Models
– Understanding the key drivers and expected returns for each company• Close Attention to Valuation in Purchase Decision
– Seeking to avoid P/E compression risk– Valuation being a key factor in position size
11

Research Process Flow
Country, Sector, & Proprietary Screens
Initial Review & Global Comparisons
Management Visit/Call
Collaborative BIC Evaluation
Build Earnings Model
Q/V/M Matrix*
Portfolio Construction
Initiate Position
12
Watch ListsA: BIC, but expensiveB: Worth followingC: Pass
Dashboard
ContinuedOnion
Peeling
PositionRevisions
*Q/V/M stands for Quality, Value, and Momentum

Screening Discipline: Multiple Slices
13
Country/State Screen - To be on PM desk Wednesday before he goes home Industry Screen - To be on PMs desk Monday before they go home Standardized Screens- To be on PM desk Monday morning
Week Print Stack of Duponts sorted by NCEBITROA level, quarterly and annual Print Stack of Duponts sorted by NCEBITROA level, quarterly and annual
1 South Africa, Israel Real Estate Investment Trusts IPO Screen/Lockup Screen
2 Minnesota, Wisconsin Real Estate Management & Development HVAL 1 Screen, HVAL 2 Screen, PE/G
3 Taiwan Commercial Banks Net Cash Screen, Most Down Screen, Inside Buying Screen
4 Michigan, Ohio Thrifts & Mortgage Finance Rising Estimates Screen, ROA 2 Screen (momentum turn)
5 South Korea Capital Markets ROA 1 Screen (long term trend), ROA 3 Screen (Level)
6 Southern California Diversified Financial Services IPO Screen/Lockup Screen
7 India, Pakistan Consumer Finance HVAL 1 Screen, HVAL 2 Screen, PE/G
8 Washington, Idaho Insurance Net Cash Screen, Most Down Screen, Inside Buying Screen
9 Japan Machinery Rising Estimates Screen, ROA 2 Screen (momentum turn)
10 Oregon, Nevada Electrical Equipment ROA 1 Screen (long term trend), ROA 3 Screen (Level)
11 Poland, Slovenia, Czech Republic, Hungary, Russia, Rest of Eastern Europe Trading Companies & Distributors IPO Screen/Lockup Screen
12 Utah, Colorado Aerospace & Defense HVAL 1 Screen, HVAL 2 Screen, PE/G
13 Switzerland, Austria Building Products Net Cash Screen, Most Down Screen, Inside Buying Screen
14 Alaska, Hawaii, Montana Marine Rising Estimates Screen, ROA 2 Screen (momentum turn)
15 Italy, Spain Transportation Infrastructure ROA 1 Screen (long term trend), ROA 3 Screen (Level)
16 Arizona, New Mexico Airlines IPO Screen/Lockup Screen
17 Australia, New Zealand Commercial Services & Supplies HVAL 1 Screen, HVAL 2 Screen, PE/G
18 Texas Household Durables Net Cash Screen, Most Down Screen, Inside Buying Screen
19 Hong Kong Textiles Apparel & Luxury Goods Rising Estimates Screen, ROA 2 Screen (momentum turn)
20 Oklahoma, Arkansas Leisure Equipment & Products ROA 1 Screen (long term trend), ROA 3 Screen (Level)
21 United Kingdom, Ireland, British Virgin Islands, Guernsey, Scotland Specialty Retail IPO Screen/Lockup Screen
22 Kansas, Missouri Multiline Retail HVAL 1 Screen, HVAL 2 Screen, PE/G
23 Eastern Canada Internet & Catalog Retail Net Cash Screen, Most Down Screen, Inside Buying Screen
24 Western Canada Distributors Rising Estimates Screen, ROA 2 Screen (momentum turn)
25 Germany, Luxembourg Hotels Restaurants & Leisure ROA 1 Screen (long term trend), ROA 3 Screen (Level)
26 Illinois,Indiana Diversified Consumer Services, Media IPO Screen/Lockup Screen
27 Singapore, Malaysia, Indonesia Auto Components, Automobiles HVAL 1 Screen, HVAL 2 Screen, PE/G
28 Northern California Electronic Equipment & Instruments Net Cash Screen, Most Down Screen, Inside Buying Screen
29 Netherlands, Belgium Communications Equipment Rising Estimates Screen, ROA 2 Screen (momentum turn)
30 Nebraska, North Dakota, South Dakota, Iowa Computers & Peripherals, Office Electronics ROA 1 Screen (long term trend), ROA 3 Screen (Level)
31 France, Portugal Software IPO Screen/Lockup Screen
32 Louisiana, Mississippi, Alabama It Services HVAL 1 Screen, HVAL 2 Screen, PE/G
33 China, Philippines, Thailand, Rest of Asia Internet Software & Services Net Cash Screen, Most Down Screen, Inside Buying Screen
34 Florida Semiconductors & Semiconductor Equipment Rising Estimates Screen, ROA 2 Screen (momentum turn)
35 Greece, Turkey Metals & Mining ROA 1 Screen (long term trend), ROA 3 Screen (Level)
36 Georgia, South Carolina Chemicals, Containers & Packaging IPO Screen/Lockup Screen
37 Bermuda, Cayman Islands, Puerto Rico, Bahamas, Netherland Antilles Construction Materials, Paper & Forest Products HVAL 1 Screen, HVAL 2 Screen, PE/G
38 Kentucky, Tennessee, North Carolina Biotechnology Net Cash Screen, Most Down Screen, Inside Buying Screen
39 Sweden, Faroe Islands Pharmaceuticals Rising Estimates Screen, ROA 2 Screen (momentum turn)
40 Virginia, Wash DC, Maryland Life Sciences Tools & Services ROA 1 Screen (long term trend), ROA 3 Screen (Level)
41 Norway, Iceland Health Care Providers & Services IPO Screen/Lockup Screen
42 Pennsylvania, West Virginia Health Care Equipment & Supplies HVAL 1 Screen, HVAL 2 Screen, PE/G
43 Finland, Denmark Health Care Technology Net Cash Screen, Most Down Screen, Inside Buying Screen
44 New Jersey, Delaware Oil Gas & Consumable Fuels Rising Estimates Screen, ROA 2 Screen (momentum turn)
45 Brazil Energy Equipment & Services ROA 1 Screen (long term trend), ROA 3 Screen (Level)
46 New York Food Products IPO Screen/Lockup Screen
47 Mexico Beverages, Tobacco HVAL 1 Screen, HVAL 2 Screen, PE/G
48 Connecticut, Rhode Island Food & Staples Retailing Net Cash Screen, Most Down Screen, Inside Buying Screen
49 Argentina, Chile, Peru, Columbia, Panama, Rest of Latin America Personal Products Rising Estimates Screen, ROA 2 Screen (momentum turn)
50 Massachusetts Household Products ROA 1 Screen (long term trend), ROA 3 Screen (Level)
51 Egypt, Nigeria, Morocco, Jordan, Ghana, Liberia, Rest of MENA All Utility Industries IPO Screen/Lockup Screen
52 Vermont, New Hampshire, Maine Wireless Telecommunication Services, Diversified Telecommunication Services HVAL 1 Screen, HVAL 2 Screen

Investment Focus: Quality
• High Quality Companies– Financial
• High margins with limited volatility• Strong balance sheet with low debt• High returns on capital
– Business Model• Sustainable competitive advantage• Steady business
– Management• Experienced• Proven
• Our focus on Quality may lead to stronger relative performance during bear (not bull) markets
14

Investment Types
• BICs (Best-In-Class Growth Companies)
• Fallen Angels
• Stalwarts
“Quality” being a desired characteristic across the portfolio
15

Investment Type: Best-In-Class Growth
• BICs– 15%+ earning growth, with plenty of headroom– Quality management team– Good business model with sustainable competitive advantage– Strong financials
• Find them small & undiscovered; buy and hold– Compound the earnings growth– P/E expansion as they become discovered
• P/E to Long-Term Growth Rate (“LTG”) as a key valuation metric
16
Investment Type: Fallen Angels
• Fallen Angels– Quality growth companies– Hit a bump in the road– Temporarily priced as a “value” stock– Growth investor background gives us an advantage here
• Buy them low and hold through the recovery– Capture earnings growth as it returns– Capture P/E expansion as market’s confidence returns
• Price to peak earnings as a key valuation metric
17

Investment Type: Stalwarts
• Stalwarts (mature BICs)– Growth continues (although may only be 10-15%)– Quality management– Great business model with very strong competitive advantage– High cash flow and solid balance sheet
• Often paying dividends and/or buying back stock
• Buy them at a good value– Can’t overpay since growth is slowing
• P/E to LTG+Yield as a key valuation metric
18

Sell Discipline
• Best-in-Class Growth Companies– Valuation (PE/LTG) no longer attractive– Thesis has changed or was wrong
• Fallen Angel– Valuation: Turn around gets priced into the stock– Determine problems are deeper than expected
• Stalwarts– Valuation (PE/LTG+Yield) no longer attractive
• 3D Matrix Tool– Deterioration in Quality, Value and/or Momentum
19

Portfolio Risk Management
• Portfolio Quality– Deep due diligence– Focus on high quality companies
• Portfolio Diversification– Sectors– Countries
• Position Sizes– Smaller positions as we peel the onion on newer companies– Smaller positions where there is greater valuation risk– Smaller positions on riskier business models
20

Global Opportunities Fund
• A Global Go Anywhere Portfolio– 30+ developed, emerging, and frontier countries– Global view provides better understanding of where opportunities exist– Flexibility to shift to where we find the most interesting companies
• Country• Sector• Market Cap
• Primarily Small and Micro Caps – Faster growth– Less discovered– Greater market inefficiencies
• Two Share Classes– Investor (GPGOX): 1.25% fee / 1.75% expense cap ($2000 minimum)– Institutional (GPGIX): 1.25% fee / 1.50% expense cap ($100,000 minimum)
21The objective of the Global Opportunities Fund is long-term growth of capital.

Global Opportunities Fund Composition
• Positions– 100-150 holdings (<0.5% of Fund’s universe)
• Bulk of assets in top 50 positions; long portfolio tail• Largest positions 2-3%; could go to 5%+ for special opportunities
• Broad Country Exposure– U.S., Foreign Developed, Emerging, and some Frontier – Weighting based on bottom up opportunities (benchmark agnostic)
• Broad Industry Exposure– Weighting based on bottom up opportunities (benchmark agnostic)
• Low Turnover– Buy-and-hold philosophy– Evaluating companies on 5+ year horizon
22

International Opportunities Fund
• An International Small/Micro Cap Portfolio– 30+ foreign developed, emerging, and frontier countries– Global view provides better understanding of where opportunities exist– Flexibility to shift to where we find the most interesting companies
• Country• Sector• Market Cap
• International Small and Micro Caps: The Single Most Compelling Market Segment Globally– Faster growth– Less discovered– Compelling Valuations
• Two Share Classes– Investor (GPIOX): 1.25% fee / 1.75% expense cap ($2000 minimum)– Institutional (GPIIX): 1.25% fee / 1.50% expense cap ($100,000 minimum)
23The objective of the International Opportunities Fund is long-term growth of capital.
International Opportunities Fund Composition
• Positions– 100-150 holdings
• Bulk of assets in top 50 positions; long portfolio tail• Largest positions 2-3%; could go to 5%+ for special opportunities
• Broad Country Exposure– Foreign Developed, Emerging, and some Frontier – Weighting based on bottom up opportunities (benchmark agnostic)
• Broad Industry Exposure– Weighting based on bottom up opportunities (benchmark agnostic)
• Low Turnover– Buy-and-hold philosophy– Evaluating companies on 5+ year horizon
24

Fund Differences
• Global Opportunities Fund: More Diversified– Broader Geographic diversification due to significant U.S. component
• International Opportunities Fund excludes the U.S.– Broader Style diversification, including Fallen Angels & Stalwarts
• International Opportunities Fund is focused primarily on Best-in-Class Growth– Broader Market Cap diversification, with Stalwarts frequently being SMID
• International Opportunities Fund is focused on Small and Micro cap companies
• International Opportunities Fund: More Aggressive– Exclusive focus on our favorite global market segment:
• Undiscovered and lesser known foreign small and micro cap companies • Best-in-Class Growth companies
25

Why Our Favorite Market Segment for the Next Decade is…
International Small/Micro Caps
26

Growth is Abroad
27
Foreign Economies are Driving Global Growth
Source: “The Emerging Middle Class in Developing Countries,” Organization for Economic Co-operation and Development (OECD), January 2010
0
1,000
2,000
3,000
4,000
5,000
6,000
2009 2020 2030
Peop
le in
Mid
dle
Clas
s (m
illion
s)
North America Europe Rest of World
The Foreign Middle Class is Expected to Grow Dramatically
Source: International Monetary Fund, 12/31/10.
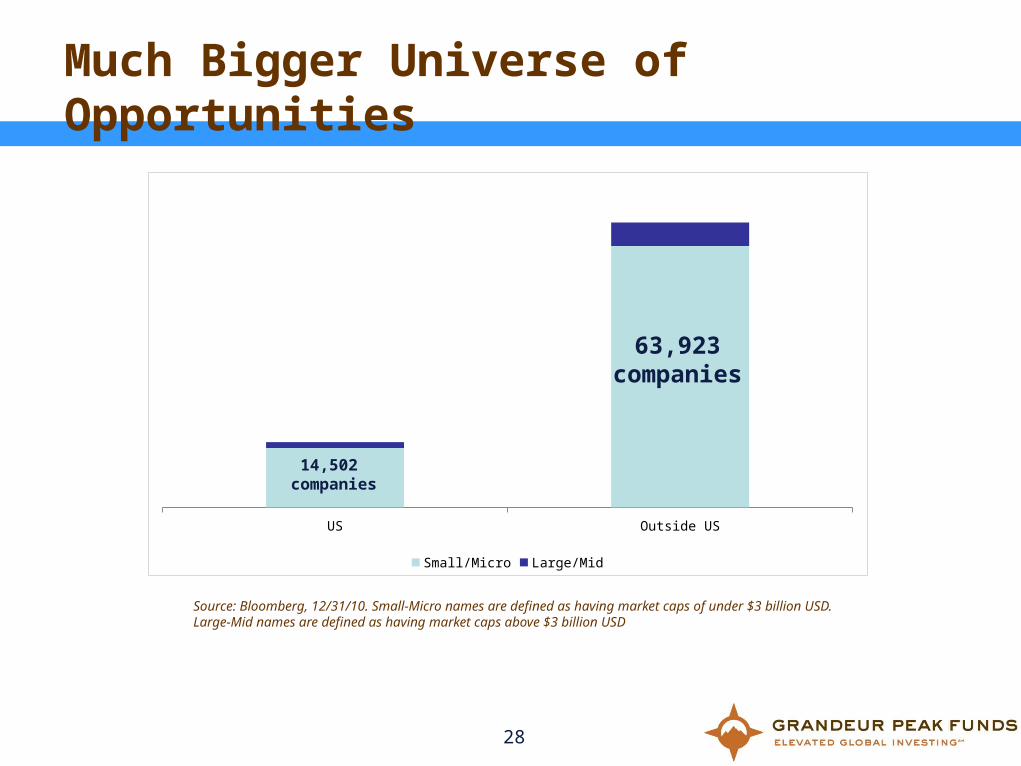
Much Bigger Universe of Opportunities
28
Source: Bloomberg, 12/31/10. Small-Micro names are defined as having market caps of under $3 billion USD. Large-Mid names are defined as having market caps above $3 billion USD
US Outside US
Small/Micro Large/Mid
14,502 companies
63,923companies

More New Companies
29
Foreign Initial Public Offerings (IPOs) have Outpaced U.S. IPOs by Almost 12-to-1
Source: Bloomberg, Data for the time period 1/2/05 – 10/31/10
US: 8%
Outside the US, 92%5631 IPOs

Micro/Small Caps Have the Advantage
• Growth Advantage– Law of large numbers gives smaller companies the growth edge
• For example, $20M in new revenue is 20% growth for a $100M company, but only 2% growth for a $1B company
• Undiscovered Advantage– Micro caps are dramatically underfollowed relative to large caps
30
1
6
12
19
0 5 10 15 20
Average Number of Analysts Covering Stock
Large Cap
MidCap
SmallCap
MicroCap
Foreign Micro & Small Cap Stocks are Less Followed
Source: FactSet 10/31/2010.

U.S. Investors Remain Underinvested Abroad
31
Home Country Bias Leads to Under-Allocation to Foreign Stocks
GDP Investable Universe Typical Allocation0%
20%
40%
60%
80%
100%
19%
32%
80%
81%
68%
20%
US Foreign
Sources:GDP PPP (purchasing power parity) comes from the World Bank as of 12/31/10.Investable Universe come from the IMF (International Monetary Fund) as of 12/31/09.

Why Consider Investing With Grandeur Peak?
32
• Experience– Seasoned, award-winning portfolio managers, with a strong team
• Repeatable Investment Process– Disciplined approach
• Global Perspective– Better understanding of opportunities
• Small/Micro Cap Expertise– Most compelling source of growth
• Nimbleness– Small asset base under the guidance of an experienced team
Past performance is no guarantee of future results

Contact Us
33
Phone:1.855.377.PEAK (7325)
E-Mail:[email protected]
Mail:Grandeur Peak FundsP.O. Box 13664Denver, CO 80201

Appendix
34
Biographies
Robert T. Gardiner, CFAPortfolio Manager, CEO, & Director of Research
Mr. Gardiner is co-manager of the Grandeur Peak Global Opportunities portfolio and the Grandeur Peak Global International Opportunities portfolio. He is also the CEO and Director of Research for Grandeur Peak Global Advisors.
Mr. Gardiner was a senior partner, principal shareholder, and portfolio manager at Wasatch Advisors before founding Grandeur Peak Global Advisors in 2011. Mr. Gardiner has been in the Investment Management industry since 1981, and involved in managing equity portfolios since 1986. He is a highly acclaimed portfolio manager with numerous recognitions. Mr. Gardiner’s experience includes:1986 – 1995 Investment Committee member for the Wasatch Small Cap Growth (WAAEX) and Core Growth (WGROX) funds.1995 – 2006 Founder and Lead Manager of the Wasatch Micro Cap Fund (WMICX)1997 – 2001 Founder and Co-Manager of the Wasatch Small Cap Value Fund (WMCVX)2003 – 2004 Founder and Co-Manager of the Wasatch Micro Cap Value Fund (WAMVX)2005 – 2007 Wasatch Advisors Director of Research2008 – 2011 Founder and Lead Manager of the Wasatch Global Opportunities Fund (WAGOX)
Mr. Gardiner was a Director of Wasatch Advisors and a member of the Executive Management Team from 1994 – 2007. During his time at Wasatch, the firm grew from 1 to 18 products and from $20 million to $11 billion under management. Mr. Gardiner was also a member of the original investment committee for Cross Creek Capital, a wholly-owned subsidiary of Wasatch Advisors investing in late stage private equity.
Mr. Gardiner graduated Magna Cum Laude from the University of Utah with a B.A. in Physics, a B.S. in Mathematics, and minors in Chemistry and French. He speaks French and lived in France for two years. Mr. Gardiner holds the Chartered Financial Analyst designation and is a member of the Salt Lake City Society of Financial Analysts. Robert is a dedicated father of five, an outdoor enthusiast, and currently serves as the local Boy Scout Troup Leader.
35Past performance is no guarantee of future results
Biographies
Blake H. WalkerPortfolio Manager & Chief Investment Officer
Mr. Walker is co-manager of the Grandeur Peak International Opportunities portfolio and the Grandeur Peak Global Opportunities portfolio. He is also the Chief Investment Officer for Grandeur Peak Global Advisors.
Mr. Walker was a partner at Wasatch Advisors and a portfolio manager co-managing two funds at Wasatch Advisors before co-founding Grandeur Peak Global Advisors in 2011. Mr. Walker joined the research team at Wasatch Advisors in 2001 and launched the Wasatch International Opportunities Fund (WAIOX) in 2005. He teamed up with Robert Gardiner in 2008 to launch the Wasatch Global Opportunities Fund (WAGOX) while continuing as the lead manager of the International Opportunities Fund. Mr. Walker is an award-winning international portfolio manager. His experience includes:2001 – 2005 Research Analyst on the Wasatch Micro Cap Fund (WMICX) and Wasatch International Growth Fund (WAIGX) 2005 – 2011 Founder and Lead Manager of the Wasatch International Opportunities Fund (WAIOX)2008 – 2011 Founder and Co-Manager of the Wasatch Global Opportunities Fund (WAGOX)
Mr. Walker has a B.S. in Accounting from Brigham Young University. He is originally from Toronto, Canada. Mr. Walker speaks French and lived in France for two years. Blake is an engaged father of three who shares with them his passion for skiing, basketball, and hockey.
36Past performance is no guarantee of future results

Biographies
Eric W. Huefner, MBAPresident, COO, & CCO
Mr. Huefner is President, COO, and CCO of Grandeur Peak Global Advisors. Before co-founding Grandeur Peak Global Advisors in 2011, Mr. Huefner was a partner, vice president, and the director of the $8B mutual fund business at Wasatch Advisors. Mr. Huefner was also a vice president of Wasatch Funds.
Mr. Huefner’s experience at Wasatch Advisors spanned eleven years. He joined the firm’s operation team in 1980, and then went on to become a research analyst and member of the investment committee before deciding to pursue an MBA. Mr. Huefner returned to Wasatch Advisors in 2006 to manage the mutual fund business and lead the firm’s marketing efforts.
Prior to rejoining Wasatch Advisors, Mr. Huefner was a Sr. Business Director managing the V8 Beverages line for Campbell’s. He spent the prior 12 years in various management positions at Kraft/Nabisco, Sara Lee, and Campbell’s. Before business school, Mr. Huefner spent three years as a middle and upper school math teacher, and a basketball, golf, soccer, and lacrosse coach.
Mr. Huefner graduated Magna Cum Laude from Harvard University with an A.B. in Economics. He received an MBA with honors from the University of North Carolina at Chapel Hill. Mr. Huefner has lived in Israel and Switzerland. He currently serves as a Trustee on The Waterford School Board of Trustees. Eric cherishes his role as father to four girls and is often found coaching his daughter’s athletic teams.
37

Biographies
Amy H. Sunderland, CFASr. Research Analyst
Ms. Sunderland is a Sr. Research Analyst at Grandeur Peak Global Advisors, with a specialty focus on the consumer sector.
Ms. Sunderland was a junior and later senior research analyst at Wasatch Advisors from 2003-2011. She was a general analyst on the Wasatch Small Cap Fund (WAAEX) and the Wasatch Micro Cap Fund (WMICX), as well as a consumer sector specialist. Before Wasatch, Ms. Sunderland worked on the Goldman Sachs’ Private Wealth Management team in Salt Lake City, Singapore and Hong Kong.
Ms. Sunderland graduated Magna Cum Laude in the top 1% of her class from the University of Utah where she earned a B.S. in Finance and Business Information Systems. Ms. Sunderland was selected as the Outstanding Finance Scholar of the Year by the dean, and a Coca-Cola Scholar.
Ms. Sunderland was born in China and is fluent in Mandarin Chinese. She moved to Salt Lake City at age 10, bought her first house at age 12, and built a successful real estate business. Ms. Sunderland began investing in stocks at age 14 and has been a passionate investor ever since. Amy currently resides in Salt Lake City and Hong Kong with her husband and son. She enjoys reading, kickboxing, basketball, camping, hiking, and traveling to places that are off the beaten path.
Randy E. Pearce, CFA, MBASr. Research Analyst
Mr. Pearce is a Sr. Research Analyst at Grandeur Peak Global Advisors, with a specialty focus on the financial sector.
Mr. Pearce was a junior and later senior research analyst at Wasatch Advisors from 2005-2009. He was a financial sector specialist and a general analyst on the Wasatch Strategic Income Fund (WASIX)—a global equity product with an emphasis in financial companies. In 2010, Mr. Pearce interned at Thornburg Investment Management as a global equities analyst while earning his MBA.
Mr. Pearce has a B.A. in Business Administration from the University of Utah and an MBA from the University of California at Berkley. He holds the CFA designation, having passed each of the three levels on his first attempt. Mr. Pearce speaks Portuguese and lived in Brazil for two years. Randy is the father of three and enjoys skiing, biking, tennis, and reading.
38

Biographies
Spencer P. StewartSr. Research Analyst
Mr. Stewart is a Sr. Research Analyst at Grandeur Peak Global Advisors, with a specialty focus on the industrials sector.
Mr. Stewart comes from small cap boutique, Sidoti & Company, in New York City where he was one of the firm’s leading institutional sales people. Mr. Stewart’s investing passion was evident as he was the top stock picker at Sidoti in the alpha capture program in which the firm participated. Previously, Mr. Stewart also spent four years as a Jr. Research Analyst at Wasatch Advisors.
Mr. Stewart is the second son of Wasatch Advisors founder and chairman, Sam Stewart, to join his father in the investments profession. Spence has lived in Mexico and France and speaks Spanish and French. He enjoys running marathons and is actively involved with the Boy Scouts of America. Spence has relocated from New York City to Salt Lake City to join the Grandeur Peak team.
Robert S. Green, MSFQuantitative Research Analyst
Mr. Green is a Quantitative Research Analyst at Grandeur Peak Global Advisors.
Mr. Green was a research assistant and then a quantitative portfolio analyst at Wasatch Advisors from 2006-2011. He worked across the entire research team, as well as having specific roles on the Wasatch Global Science & Technology Fund (WAGTX) and the Wasatch Global Opportunities Fund (WAGOX). Prior to Wasatch, Mr. Green worked as an associate on the University Venture Fund at the University of Utah.
Mr. Green graduated Summa Cum Laude from Westminster College in Salt Lake City, UT with a B.S. in Business Finance and a Minor in Economics. He received a Master of Science in Finance from The University of Utah. Mr. Green is a Level 3 CFA candidate. Rob is the father of five and enjoys golfing, running, snowboarding, and travelling. Rob also enjoys volunteering in the community and is actively involved in the neighborhood Cub Scout program.
39

Biographies
Mark Siddoway, CFA, CAIA
Head of Client Relations
Mr. Siddoway is the Head of Client Relations at Grandeur Peak Global Advisors. Before joining Grandeur Peak Global Advisors in 2011, Mr. Siddoway was the Director of Public Markets Investments at Lehigh University, where he was responsible for investing roughly 80% of Lehigh’s $1.2B investment portfolio.
Prior to his role at Lehigh University, Mr. Siddoway had spent five years as the Deputy CIO at Utah Retirement Systems (URS) , the retirement portfolio for public employees in the state of Utah. His additional industry experience includes roles as a fixed income portfolio manager at Sentry Insurance and as a credit analyst at Beneficial Life Insurance.
Mr. Siddoway graduated from Brigham Young University with a B.A. in Music. He earned an MBA from Brigham Young University, where he won the Stoddard Prize as the top finance student. Mr. Siddoway holds the CFA designation and the CAIA (Chartered Alternative Investment Analyst) designation.
Mr. Siddoway speaks French and lived in France for two years. Mark is the proud father of six children. He loves the arts, music, and film. In fact, Mark’s first career was as an independent recording engineer, before he returned to business school and moved into finance.
40

Biographies
Amy A. Hone, MBA
Vice President, Trading & Operations
Ms. Hone is the Vice President of Trading & Operations at Grandeur Peak Global Advisors. Before joining Grandeur Peak Global Advisors in 2011, Ms. Hone was the Chief Compliance Officer and Director of Internal Audit at Marlin Business Bank in Salt Lake City.
Ms. Hone spent fifteen years in the back office at Wasatch Advisors, including eight years as the Director of Operations, where she helped the firm navigate from being a domestic investment firm to becoming a global investment manager. Ms. Hone’s prior experience also includes two years at American Express as a Senior Manager of Internal Audit.
Ms. Hone graduated from the University of Phoenix with a Bachelor’s degree in Business Administration. She earned an MBA from the University of Utah, with a focus on Management. Ms. Hone is the Chairman of the Board for the non-profit organization People Helping People, and was a founding member of the Women’s Financial Network. Amy is an enthusiastic mother of two and loves exploring the Utah outdoors with her family.
41
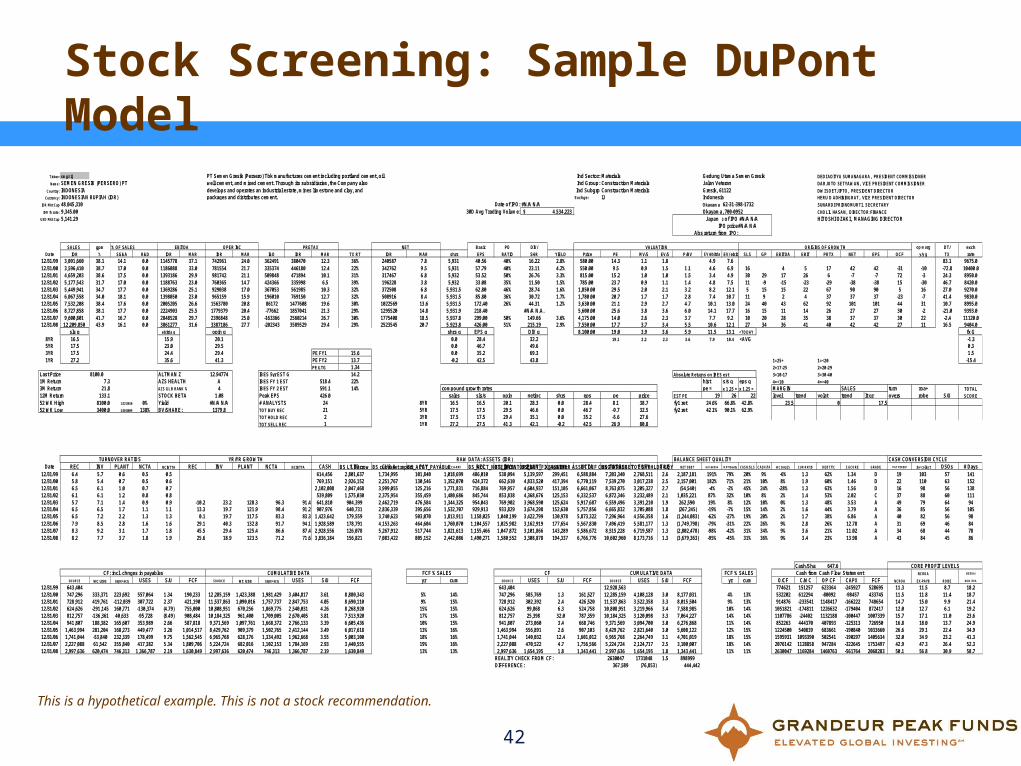
Stock Screening: Sample DuPont Model
42
Ticker: smgr ij smgr ij EQUITY PT Semen Gresik (Persero) Tbk manufactures cement including portland cement, oil Ind Sector: Materials Gedung Utama Semen Gresik DEDI ADITYA SUMANAGARA, PRESIDENT COMMISSIONER
Name: SEMEN GRESIK (PERSERO) PT well cement, and mixed cement. Through its subsidiaries, the Company also Ind Group: Construction Materials Jalan Veteran DARJOTO SETYAWAN, VICE PRESIDENT COMMISSIONER
Country: INDONESIA develops and operates an industrial estate, mines limestone and clay, and Ind Subgrp Construction Materials Gresik, 61122 DWI SOETJIPTO, PRESIDENT DIRECTOR
Currency: INDONESIAN RUPIAH (IDR) packages and distributes cement. Exchge: IJ Indonesia HERU D ADHININGRAT, VICE PRESIDENT DIRECTOR
IDR Mkt Cap 48,045,310 Date of IPO: #N/A N/A Okayama City62-31-398-1732 SUNARDI PRIONOMURTI, SECRETARY
IDR fx rate: 9,345.00 30D Avg Trading Volume: Okayama, 700-0952 CHOLIL HASAN, DIRECTOR:FINANCE
USD Mkt Cap 5,141.29 (Y = yearly, Q = Quarterly) JapanDate of IPO #N/A N/A HITOSHI OZAKI, MANAGING DIRECTORPeriodicity: Y IPO price#N/A N/A
# of Periods: 10 Abs return from IPO:
SALES gpm % OF SALES Basic PO DIV/ op marg DT/ exch
Date IDR % SG&A R&D IDR MAR IDR MAR I&O IDR MAR TX RT IDR MAR shrs EPS RATIO SHR YIELD Price PE MV/S EV/S P/BV EV/ebitda EV/ ebit SLS GP EBITDA EBIT PRTX NET EPS OCF y/y g TX rate12/31/99 3,091,660 38.1 14.1 0.0 1145778 37.1 742961 24.0 362491 380470 12.3 36% 240587 7.8 5,931 40.56 40% 16.22 2.8% 580.00 14.3 1.1 1.8 4.9 7.6 83.1 9675.012/31/00 3,596,410 38.7 17.0 0.0 1186088 33.0 781554 21.7 335374 446180 12.4 22% 342762 9.5 5,931 57.79 40% 23.11 4.2% 550.00 9.5 0.9 1.5 1.1 4.6 6.9 16 4 5 17 42 42 -31 -10 -72.8 10400.012/31/01 4,659,203 38.6 17.5 0.0 1393186 29.9 981742 21.1 509848 471894 10.1 31% 317467 6.8 5,932 53.52 50% 26.76 3.3% 815.00 15.2 1.0 1.0 1.5 3.4 4.9 30 29 17 26 6 -7 -7 72 -3 24.3 8950.012/31/02 5,177,543 31.7 17.0 0.0 1188763 23.0 760365 14.7 424366 335998 6.5 39% 196228 3.8 5,932 33.08 35% 11.50 1.5% 785.00 23.7 0.9 1.1 1.4 4.8 7.5 11 -9 -15 -23 -29 -38 -38 15 -30 46.7 8420.012/31/03 5,449,941 34.7 17.7 0.0 1369286 25.1 929038 17.0 367053 561985 10.3 32% 372508 6.8 5,931.5 62.80 46% 28.74 1.6% 1,850.00 29.5 2.0 2.1 3.2 8.2 12.1 5 15 15 22 67 90 90 5 16 27.0 9270.012/31/04 6,067,558 34.0 18.1 0.0 1398050 23.0 965159 15.9 196010 769150 12.7 32% 508916 8.4 5,931.5 85.80 36% 30.72 1.7% 1,780.00 20.7 1.7 1.7 2.8 7.4 10.7 11 9 2 4 37 37 37 -23 -7 41.4 9830.012/31/05 7,532,208 38.4 17.6 0.0 2005205 26.6 1563780 20.8 86172 1477608 19.6 30% 1022569 13.6 5,931.5 172.40 26% 44.31 1.2% 3,630.00 21.1 2.9 2.7 4.7 10.1 13.0 24 40 43 62 92 101 101 44 31 10.7 8995.012/31/06 8,727,858 38.1 17.7 0.0 2224903 25.5 1779379 20.4 -77662 1857041 21.3 29% 1295520 14.8 5,931.9 218.40 #N/A N.A. 5,600.00 25.6 3.8 3.6 6.0 14.1 17.7 16 15 11 14 26 27 27 30 -2 -21.0 9393.012/31/07 9,600,801 41.7 16.7 0.0 2848528 29.7 2396848 25.0 -163366 2560214 26.7 30% 1775408 18.5 5,937.8 299.00 50% 149.66 3.6% 4,175.00 14.0 2.6 2.3 3.7 7.7 9.2 10 20 28 35 38 37 37 30 22 -2.4 11120.012/31/08 12,209,850 43.9 16.1 0.0 3861277 31.6 3387186 27.7 -202343 3589529 29.4 29% 2523545 20.7 5,923.8 426.00 51% 215.19 2.9% 7,550.00 17.7 3.7 3.4 5.5 10.6 12.1 27 34 36 41 40 42 42 27 11 16.5 9404.0
sls g ebitda g opin g shrs g EPS g DIV g 8,100.00 19.0 3.9 3.6 5.9 11.5 13.1 <TODAY fx G8YR 16.5 15.9 20.1 0.0 28.4 32.2 19.1 2.2 2.3 3.6 7.9 10.4 <AVG -1.35YR 17.5 23.0 29.5 0.0 46.7 49.6 0.33YR 17.5 24.4 29.4 PE FY1 15.6 0.0 35.2 69.3 1.51YR 27.2 35.6 41.3 PE FY2 13.7 -0.2 42.5 43.8 1=25+ 1=<20 -15.4
PE/LTG 1.34 2=17-25 2=20-29Last Price 8100.0 ALTMAN Z 12.94774 IBES 5yr EST G 14.2 Absolute Returns on IBES est 3=10-17 3=30-401M Return 7.3 AZS HEALTH A IBES FY 1 EST 518.4 22% hist s/s g eps g 4=<10 4=>403M Return 21.8 AZS GLB RANK % 4 IBES FY 2 EST 591.1 14% compound growth rates pe = x 1.25 = x 1.25 = MARGIN SALES turn roa+ TOTAL12M Return 133.1 STOCK BETA 1.08 Peak EPS 426.0 sales sls/s opin netinc shrs eps pe price EST PE 19 26 22 level trend volat trend lt gr overs robe S/U SCORE
52 WK High 8100.0 1/22/2010 0% Yield #N/A N/A # ANALYSTS 24 8YR 16.5 16.5 20.1 28.3 0.0 28.4 8.1 38.7 fy1 ret 24.6% 66.8% 42.8% 23.5 0 17.552 WK Low 3400.0 3/10/2009 138% BV/SHARE: 1379.8 TOT BUY REC 21 5YR 17.5 17.5 29.5 46.6 0.0 46.7 -9.7 32.5 fy2 ret 42.1% 90.1% 62.9%
TOT HOLD REC 2 3YR 17.5 17.5 29.4 35.1 0.0 35.2 -5.6 27.6 TOT SELL REC 1 1YR 27.2 27.5 41.3 42.1 -0.2 42.5 26.9 80.8
BALANCE SHEET QUALITY CASH CONVERSION CYCLEDate REC INV PLANT NCTA NCINTTA REC INV PLANT NCTA NCINTTA CASH LTD CUR A PAY NCCA-PAY REC INV PLANT g will etc NCTA TASS EQTY TA/E NET DEBT N.DT/EBITDA N.DT/Equity CASH/SLS CASH/TA WC/SALES CUR RATIO DEBT/TC Z-SCORE GRADE PAY PERIOD inv collect DSOs # DaysBS LT Borrow BS cur asset reportBS_ACCT_PAYABLE BS_ACCT_NOTE_RCVBS_INVENTORIESBS_NET_FIX_ASSETBS OTHER ASSET DEF CHNG OTHER BS TOT ASSETTOT SHRHLDR EQY
12/31/99 6.4 5.7 0.6 0.5 0.5 614,456 2,801,637 1,734,995 101,840 1,018,699 486,010 538,094 5,139,597 299,451 6,588,884 7,203,340 2,768,511 2.6 2,187,181 191% 79% 20% 9% -6% 1.3 62% 1.34 D 19 103 57 14112/31/00 5.8 5.4 0.7 0.5 0.6 769,151 2,926,152 2,251,767 130,546 1,352,070 624,372 662,610 4,833,520 417,394 6,770,119 7,539,270 3,017,238 2.5 2,157,001 182% 71% 21% 10% 8% 1.9 60% 1.46 D 22 110 63 15212/31/01 6.5 6.1 1.0 0.7 0.7 2,102,008 2,047,468 3,999,055 125,216 1,771,831 716,884 769,957 4,604,937 151,105 6,661,067 8,763,075 3,205,327 2.7 (54,540) -4% -2% 45% 24% -28% 1.3 63% 1.56 D 16 98 56 13812/31/02 6.1 6.1 1.2 0.8 0.8 539,809 1,575,030 2,375,954 355,459 1,480,686 845,744 853,838 4,368,676 125,153 6,332,537 6,872,346 3,232,489 2.1 1,035,221 87% 32% 10% 8% 2% 1.4 53% 2.02 C 37 88 60 11112/31/03 5.7 7.1 1.4 0.9 0.9 -10.2 23.2 128.3 96.3 91.4 641,810 904,399 2,462,719 476,584 1,344,325 954,043 769,902 3,968,590 125,624 5,917,687 6,559,496 3,391,210 1.9 262,590 19% 8% 12% 10% 0% 1.3 48% 3.53 A 49 79 64 9412/31/04 6.5 6.5 1.7 1.1 1.1 13.3 19.7 121.9 98.4 91.2 907,976 640,731 2,836,339 395,656 1,532,707 929,913 933,829 3,674,298 152,630 5,757,856 6,665,832 3,705,088 1.8 (267,245) -19% -7% 15% 14% 2% 1.6 44% 3.79 A 36 85 56 10512/31/05 6.5 7.2 2.2 1.3 1.3 0.1 19.7 117.5 83.3 83.3 1,423,642 179,559 3,740,623 503,070 1,813,911 1,158,025 1,040,199 3,422,799 130,978 5,873,322 7,296,964 4,556,358 1.6 (1,244,083) -62% -27% 19% 20% 2% 1.7 38% 6.86 A 40 82 56 9812/31/06 7.9 8.5 2.8 1.6 1.6 29.1 40.3 132.8 91.7 94.1 1,928,589 178,791 4,153,263 464,604 1,760,070 1,104,557 1,025,982 3,162,919 177,654 5,567,830 7,496,419 5,581,177 1.3 (1,749,798) -79% -31% 22% 26% 9% 2.8 26% 12.78 A 31 69 46 8412/31/07 8.3 9.2 3.1 1.7 1.8 45.5 29.4 125.4 86.6 87.4 2,928,556 126,078 5,267,912 517,744 1,821,613 1,155,466 1,047,872 3,101,866 143,289 5,586,672 8,515,228 6,719,587 1.3 (2,802,478) -98% -42% 31% 34% 9% 3.6 21% 11.02 A 34 68 44 7812/31/08 8.2 7.7 3.7 1.8 1.9 25.6 18.9 123.5 71.2 71.6 3,836,184 156,821 7,083,422 805,152 2,442,086 1,490,271 1,580,552 3,308,878 194,337 6,766,776 10,602,960 8,173,716 1.3 (3,679,363) -95% -45% 31% 36% 9% 3.4 23% 13.98 A 43 84 45 86
Cash/Share 647.6NCROA EBITDA/
SOURCE wc use capx+acq USES S/U FCF SOURCE wc use capx+acq USES S/U FCF yr cum SOURCE USES S/U FCF SOURCE USES S/U FCF yr cum O/CF C/WC OP CF CAPX FCF NCROA EX-PAYB ROBE NGW ROA
12/31/99 643,404 643,404 12,928,563 774621 151257 623364 -245927 528695 11.3 11.5 8.7 18.212/31/00 747,296 333,371 223,692 557,064 1.34 190,233 12,285,159 1,423,388 1,981,429 3,404,817 3.61 8,880,343 5% 14% 747,296 585,769 1.3 161,527 12,285,159 4,108,128 3.0 8,177,031 4% 13% 532202 612294 -80092 -98457 433745 11.5 11.8 11.4 18.712/31/01 728,912 419,761 -112,039 307,722 2.37 421,190 11,537,863 1,090,016 1,757,737 2,847,753 4.05 8,690,110 9% 15% 728,912 302,392 2.4 426,520 11,537,863 3,522,358 3.3 8,015,504 9% 13% 914876 -233541 1148417 -166222 748654 14.7 15.0 9.9 21.412/31/02 624,626 -291,145 160,771 -130,374 (4.79) 755,000 10,808,951 670,256 1,869,775 2,540,031 4.26 8,268,920 15% 15% 624,626 99,868 6.3 524,758 10,808,951 3,219,966 3.4 7,588,985 10% 14% 1051821 -174811 1226632 -179404 872417 12.0 12.7 6.1 19.212/31/03 812,757 -136,361 40,633 -95,728 (8.49) 908,484 10,184,325 961,400 1,709,005 2,670,405 3.81 7,513,920 17% 15% 812,757 25,398 32.0 787,359 10,184,325 3,120,098 3.3 7,064,227 14% 14% 1107786 -24402 1132188 -100447 1007339 15.7 17.1 11.0 23.612/31/04 941,807 188,382 165,607 353,989 2.66 587,818 9,371,569 1,097,761 1,668,372 2,766,133 3.39 6,605,436 10% 15% 941,807 273,060 3.4 668,746 9,371,569 3,094,700 3.0 6,276,868 11% 14% 852263 444370 407893 -125313 726950 16.8 18.0 13.7 24.912/31/05 1,463,994 281,204 168,273 449,477 3.26 1,014,517 8,429,762 909,379 1,502,765 2,412,144 3.49 6,017,618 13% 16% 1,463,994 556,891 2.6 907,103 8,429,762 2,821,640 3.0 5,608,122 12% 15% 1224500 540839 683661 -190840 1033660 26.6 29.1 22.4 34.912/31/06 1,741,044 -53,840 232,339 178,499 9.75 1,562,545 6,965,768 628,176 1,334,492 1,962,668 3.55 5,003,100 18% 16% 1,741,044 140,032 12.4 1,601,012 6,965,768 2,264,749 3.1 4,701,019 18% 15% 1595931 1093390 502541 -190297 1405634 32.0 34.9 23.2 41.312/31/07 2,227,088 61,542 355,840 417,382 5.34 1,809,706 5,224,724 682,016 1,102,153 1,784,169 2.93 3,440,555 19% 16% 2,227,088 470,522 4.7 1,756,566 5,224,724 2,124,717 2.5 3,100,007 18% 14% 2076142 1128858 947284 -322645 1753497 42.9 47.3 26.4 52.312/31/08 2,997,636 620,474 746,313 1,366,787 2.19 1,630,849 2,997,636 620,474 746,313 1,366,787 2.19 1,630,849 13% 13% 2,997,636 1,654,195 1.8 1,343,441 2,997,636 1,654,195 1.8 1,343,441 11% 11% 2630047 1169284 1460763 -561764 2068283 50.1 56.8 30.9 58.7
REALITY CHECK FROM CF: 2630047 1731048 1.5 898999DIFFERENCE: 367,589 (76,853) 444,442
4,534,223$
EBITDA OPER INC PRETAX NET VALUATION ORIGINS OF GROWTH
TURNOVER RATIOS YR/YR GROWTH RAW DATA: ASSETS (IDR)
CORE PROFIT LEVELSCF: incl. chnges in payables CUMULATIVE DATA FCF % SALES CF CUMULATIVE DATA FCF % SALES Cash from Cash Flow Statement
This is a hypothetical example. This is not a stock recommendation.

Disclosures
The objective of both the Grandeur Peak Global Opportunities Fund and the Grandeur Peak International Opportunities Fund is long-term growth of capital. These Funds are new and have limited operating history.
Mutual fund investing involves risks and loss of principal is possible. Investing in small and micro cap funds will be more volatile and loss of principal could be greater than investing in large cap or more diversified funds. Investing in foreign securities entails special risks, such as currency fluctuations and political uncertainties, which are described in more detail in the prospectus. Investments in emerging markets are subject to the same risks as other foreign securities and may be subject to greater risks than investments in foreign countries with more established economies and securities markets.
An investor should consider investment objectives, risks, charges, and expenses carefully before investing. To obtain a prospectus, containing this and other information, visit www.grandeurpeakglobal.com or call 1-855-377-PEAK (7325). Please read it carefully before investing.
Grandeur Peak Funds will deduct a 2.00% redemption proceeds fee on Fund shares held 60 days or less. The Advisor has contractually agreed to limit the expenses on Investor share classes to 1.75% and on Institutional share classes to 1.50% until at least 8/31/2013. For more complete information including charges, risks and expenses, read the prospectus carefully.
Wasatch Advisors is not affiliated with Grandeur Peak Global Advisors or with ALPS Distributors, Inc.
CFA® is a trademark owned by CFA Institute. The Chartered Financial Analyst (CFA) designation is issued by the CFA Institute. Candidates must meet one of the following prerequisites: undergraduate degree and 4 years of professional experience involving investment decision-making, or 4 years qualified work experience (full time, but not necessarily investment related). Candidates are then required to undertake extensive self-study programs (250 hours of study for each of the 3 levels) and pass examinations for all 3 levels.
Valuation is the process of determining the current worth of an asset or company.
P/E is the Price-to-Earnings ratio (the ratio of the current price divided by typically the earnings over the past 12 months) .
Peak Earnings are the highest level of earnings the company has achieved historically.
DuPont is a template for statistical analysis of various financial metrics of a company.
43

Disclosures Continued
P/E Compression Risk is the risk that a company trading at a high P/E ratio may grow its earnings yet not trade for a higher price due to a declining P/E ratio
©2011 Grandeur Peak Global Advisors, LLC
Grandeur Peak Funds are distributed by ALPS Distributors, Inc. (“ADI”). Eric Huefner and Mark Siddoway are registered representatives of ADI.
GPG000119 9/30/2012
44