global payments reportoffers.worldpayglobal.com/rs/850-joa-856/images... · global payment trends...
TRANSCRIPT

The art and science of global payments
A definitive report from Worldpay
Global Payments Report
NOVEMBER 2018


ContentsIntroduction 4
Global payment trends 7
Key insights 19
Market guides 31
Methodology 104
Payment terms 106

The art and science of global paymentsIntroduction
4

An individual payment is a simple act. Timeless and enduring, payments serve the same ends today as they did thousands of years ago. Our methods of recording and exchanging value evolve with technology: from livestock to gold coins, paper money to digital wallets. Yet the essence of a payment remains unchanged: Goods and services are exchanged for a payment of a value mutually agreed to between buyer and seller.
Payments represent the sum of our experiences. Payments document our needs, our desires, and our ever-shifting values. Payments tell the story of human history through economics, recording those needs, desires, and values. The diversity of our payment landscape arises naturally from our respective cultural, political, and economic differences.
This deceptive complexity means making sense of global payments requires both art and science. The science of global payments starts with the importance of commerce and mobile revolutions, and the role of machine learning and artificial intelligence in optimizing conversion rates and fighting fraud. The science involves understanding the forces driving the creation of hundreds of alternative payment methods. It also underscores the importance of payments in creating positive user experiences with brands. Science is necessary to appreciate the complexity of global payments. But it’s not sufficient.
The art of payments is every bit as essential to understanding commerce. Consumer behaviors and preferences are as diverse as the cultures of the world—they defy easy answers or cookie-cutter solutions. Payments are far too complex to be understood by algorithm alone. Navigating the changing world of payments requires something beyond spreadsheets and charts. Today’s payment landscape also requires the tools of an artist: inspiration, persistence, and creativity.
This report offers insight into the art and science of payments. We’ll start with science by offering a high-level data analysis of the ways we pay globally, both online and at the point of sale. We’ll then turn to the art of payments: the opportunities posed by China’s growth; the unique needs of Millennials and their emerging spending power; the dissolution of channels and the unification of commerce; how deferred payments enable the immediacy of The Now Economy; and the future of invisible payments (spoiler alert: the future is now). Finally, we’ll take a deeper dive and detail the payment landscape for 36 individual country markets from around the world.
Whether you’re looking to expand your business internationally, optimize your payments mix in existing markets, or simply gain a deeper understanding of the current state of the art (and science) of payments, this report is for you.

6

Global Payment TrendsGlobal payment methods breakdown
7

Global payment trendsWorldpay’s 2018 snapshot of global payment methods reveals a complex landscape brimming with diversity. Alternative payment methods are rising to meet the needs of consumers online, led by eWallets and bank transfers. Though its long reign of supremacy is nearing its end, cash remains the leading payment method at the point of sale. This complex landscape opens doors to increase consumer satisfaction by offering the right mix of payment options.
The meteoric rise of eCommerce is expected to surpass $4.6 trillion globally by 2022. How we transact is changing too: alternatives to credit and debit cards now account for more than half of eCommerce transaction volume. Our survey of 36 countries found at least 140 online payment methods in use today.
eWallets have vaulted to the forefront of payments change by offering seamless convenience. Online shopping demands equal measures of convenience and security. Digital wallets deliver on both counts. Mobile applications integrate the act of payment into daily lifestyles and routines, while preloaded credentials speeds online checkout. eWallets do all of this safely with encryption, tokenization, and device authentication providing extra layers of security. We expect continued growth in China and a surge of adoption in North America will propel eWallets to become the leading eCommerce payment method globally within five years. Bank transfers are also growing in popularity as an online payment method. Factors contributing to the growth of bank transfers include convenience for consumers, lower costs of acceptance and fewer chargebacks for merchants, a regulatory push from PSD2/Open Banking mandates in Europe, and a rise of banked populations in emerging markets.
The point of sale continues to witness radical transformations as spend shifts dramatically from cash to eWallets. Predictions of a cashless future won’t be realized anytime soon; indeed, cash remains the most popular payment method at the point of sale globally today. However, the use of cash is on the decline in every global region with even more dramatic shifts forecasted. We project that cash will be supplanted by debit cards as the leading point of sale payment method in 2019, falling to fourth place in 2022 trailing debit cards, credit cards, and eWallets. Though shifting share within regions, we expect traditional credit card and debit card use to hold steady at the point of sale through 2022.
8

Global POS payment methodsGlobal eCom payment methods
2018* 2022**
Cash 31% 17%
Debit Card 29% 30%
Credit Card 20% 22%
eWallet 16% 28%
Charge Card 2% 2%
Pre-Paid Card 1% 1%
2018* 2022**
eWallet 36% 47%
Credit Card 23% 17%
Debit Card 12% 11%
Bank Transfer 11% 11%
Charge & Deferred Debit Card 8% 6%
Cash on Delivery 5% 3%
Pre-Paid Card 2% 1%
PostPay 1% 1%
eInvoices 1% 1%
PrePay 1% 0%
Other 0% 0%
2022**2022**2018* 2018*
* Estimated **Forecasted Numbers adjusted for rounding may impact totals.
9

North America payment trendsThe developed economies of North America offer a study in contrast when it comes to payment preferences. North America is corporate home to global innovators in payment technology, retail, and financial services. Comparably affluent and savvy US and Canadian consumers demand the latest in secure and convenient payment methods. Yet the pace of progress toward contemporary technologies like eWallets is tempered by mature technology infrastructures, habits, and preferences established over generations. Entrenched payment habits are proving resilient in this mature market both in-store and online.
Credit cards remain the undisputed champion of consumer payments in North America. Credit cards dominate as the method of choice both online and at the point of sale. The North American consumer is heavily banked—the US Federal Reserve estimated
the unbanked share of Americans fell to just 5% in 20171—so unsurprisingly, debit cards remain a strong preference with 34% of spend at the point of sale and 19% share online. Taken together, card-based* payments represent almost three-fourths of point of sale spend and over half of eCommerce volume. Despite the proliferation of many new payment options globally, POS spend in North America remains overwhelmingly dominated by cash, credit, and debit. The near-universal acceptance of card payments and the ingrained habits of generations have proven difficult to break. Cash remains formidable at the POS, yet its use continues to drop. The ease and convenience of contactless payments is driving the decline of cash, as are alternative options such as eWallets.
Consensus projections see the North American eCommerce market growing at a healthy sustained rate of between 9% and 10% annually through 2022. Challenging headwinds remain, however, notably concerns about fraud and the overall convenience. Fear of fraud and inconvenience are among the top reasons that consumers avoid online shopping. Payment methods of the present and future that can thread that needle to offer both greater security and greater convenience will be well positioned for success.
North America is coveted for its consumer spending power and will continue to present a highly competitive and lucrative market. Looking to the next five years for the North American market, we expect the use of cash to drop by about 5% at the point of sale. The majority of that spend will migrate to eWallets, which we project will more than double in POS share by 2022. On the eCommerce side, our research suggests that eWallet adoption will surge in North America and move towards the global average in the next five years.
1. https://bankingjournal.aba.com/2018/05/fed-survey-unbanked-share-of-americans-falls-to-5-percent/
*Credit cards and debit cards10

North America POS payment methodsNorth America eCom payment methods
2018* 2022**
Credit Card 41% 44%
Debit Card 34% 32%
Cash 16% 11%
Charge Card 4% 4%
eWallet 3% 7%
Pre-Paid Card 2% 2%
2018* 2022**
Credit Card 34% 27%
eWallet 20% 33%
Debit Card 19% 19%
Charge & Deferred Debit Card 13% 11%
Bank Transfer 6% 5%
Cash on Delivery 4% 2%
Pre-Paid Card 3% 2%
PrePay 1% 0%
Other 1% 0%
eInvoices 0% 0%
PostPay 0% 0%
2022**2022**2018* 2018*
11
* Estimated **Forecasted Numbers adjusted for rounding may impact totals.

Latin America payment trendsLatin America is a dynamic market offering a landscape of change and opportunity in payments. Macroeconomic headwinds and political instability that have constrained growth in recent years are both easing, reviving hopes that the economic fertility of the region can be more fully realized. Overall retail sales and especially eCommerce growth will far exceed the 2% growth estimates for the region’s economy as a whole. Our research points to strong eCommerce growth in Latin America—we project over $61 billion in transactional value in 2018 rising to over $94 billion in 2022.
Cash dominates at the point of sale throughout Latin America, reflecting the region’s comparably low rate of banked consumers. Following close behind cash are credit cards that continue to lead electronic payments at the point of sale. The payments landscape for eCommerce is significantly more complex and dynamic. Credit cards are the overwhelming choice for purchases online. Credit accounts for 44.6% of eCommerce spend overall and even higher rates in certain verticals such as travel. Beyond that, online spend is fragmented with debit cards, charge cards, eWallets, and bank transfers all making a stand for market share.
Installment based purchasing continues to be a defining characteristic of the payment market in Latin America. Installment agreements offer a structured loan over the card’s credit line. Lower interest rates and repayment flexibility make this an attractive and regionally appropriate option. Installment payment agreements are especially popular for higher priced consumer goods such as appliances. Payment industry leaders join with local issuers to make this option practical by authorizing the full transaction but settling it in installments.
Latin America is home to a wealth of financial technology and eCommerce innovation including Argentina based MercadoLibre, Latin America’s most popular digital platform. Argentina was home to pioneering eCommerce efforts and continues to offer inviting opportunity online. Boasting a growing base of young, educated, and internet-savvy consumers, the highest ratio of mobile users in the region all help explain Argentina’s enviable 16% annual eCommerce growth rate.
Looking forward, we expect that the overwhelming dominance of cash will begin to wane. Cash will remain the most popular point of sale payment method, though we project a significant drop in cash share through 2022. That spend will shift to credit cards, debit cards, and eWallets, each of which will see a large increase in payment share. Within eCommerce, we project that credit cards will continue to be strong, but will lose share to debit cards, eWallets, and bank transfers.
12

Latin America POS payment methodsLatin America eCom payment methods
2018* 2022**
Cash 58% 36%
Credit Card 21% 29%
Debit Card 16% 24%
eWallet 3% 9%
Pre-Paid Card 1% 2%
Charge Card 0% 0%
2018* 2022**
Credit Card 45% 29%
eWallet 15% 18%
Debit Card 10% 16%
Bank Transfer 9% 8%
PostPay 8% 14%
Charge & Deferred Debit Card 7% 7%
Cash on Delivery 4% 3%
Pre-Paid Card 2% 3%
PrePay 1% 2%
eInvoices 0% 0%
Other 0% 0%
2022**2022**2018* 2018*
13
* Estimated **Forecasted Numbers adjusted for rounding may impact totals.

EMEA offers a study in stark contrasts, with vast differences in the economies, cultures, and politics within each country. Each local payment landscape reflects unique circumstances and defies broad brushstrokes. Instead, these differences demand focused attention on their merits and expert guidance to navigate properly.
Payments at the point of sale in EMEA are split relatively equally among cash and card-based payments, with debit cards the far and away leader over credit cards. Those averages, however, mask distinct differences within the region. Debit cards are strongly preferred at the point of sale by consumers in Denmark, the Netherlands, and Norway. Cash is king in the UAE and dominates in Nigeria, but is receding from its once dominant position in the majority of Western European countries. eCommerce in EMEA paints an evenly distributed picture with debit cards, credit cards,eWallets, and bank transfers all making their case. Bank transfers
show remarkable strength and lead eCommerce payment share in countries as diverse as Germany and Nigeria, while eWallets have become the leading payment option among Danish consumers.
Future payment innovation in EMEA is poised to flourish under the European Union’s Second Payment Services Directive (PSD2). PSD2 updates the EU’s regulatory framework in an effort to boost competition and innovation in payment services, affecting merchants, consumers, and payment institutions. Informed consent of data sharing combined with improved security and customer authentication aims to increase privacy, reduce fraud, and provide more personalized consumer services. PSD2 went into effect in January 2018. The EU offers a test case for the rest of the world, with regulatory bodies and payment industry leaders from other regions watching developments closely.
Looking to the next five years within eCommerce, we project eWallets will maintain their top position and bank transfers will move into second place displacing credit and debit cards. European consumers have a strong history of preference to bank-based payments as opposed to credit utilities. We expect that trend to not only continue but to accelerate. We project this disposition to non-cash payments will continue at the point of sale, with debit cards surpassing cash as the most prevalent payment method at the POS by 2020. Further, PSD2 is likely to generate innovations at the point of sale such as increased use of bank transfers. We also estimate the use of cash at the point of sale will decline from 47% to 30% over the next five years, with debit cards and eWallets capturing the majority of that spend.
EMEA payment trends

EMEA POS payment methods
2018* 2022**
Cash 47% 30%
Debit Card 36% 44%
Credit Card 7% 10%
Charge Card 6% 6%
eWallet 3% 8%
Pre-Paid Card 1% 1%
2018* 2022**
eWallet 21% 24%
Credit Card 20% 14%
Debit Card 20% 17%
Bank Transfer 16% 20%
Charge & Deferred Debit Card 10% 10%
Cash on Delivery 7% 7%
eInvoices 3% 7%
PrePay 1% 1%
Pre-Paid Card 1% 1%
Other 1% 0%
PostPay 0% 0%
EMEA eCom payment methods
2022**2022**2018* 2018*
15
* Estimated **Forecasted Numbers adjusted for rounding may impact totals.

Asia Pacific payment trendsAsia stands at the forefront of payment innovation particularly in mobile commerce. Asian consumers demand and expect equal measures of seamless ease and security in all aspects of their digital lives, most of all when it comes to shopping and payments. Payment methods vary widely across the region, both between and within countries and across the spectrums of development from urban to rural. Companies operating in Asia thus face a complicated and demanding payment landscape.
The outlook for eCommerce across Asia continues to be defined by extraordinary rates of growth, with five year compound annual growth rates projected at 21.3% in Malaysia, 20.2% in Vietnam, 18.6% in the Philippines and Indonesia. Though eCommerce growth captures headlines, growth at the point of sale is helping to redefine the contours of regional commerce. Taiwan’s point of sale is set to grow at 10%, for example, trailing close behind China’s expected 11% point of sale growth.
In China, the headline payments story remains the widespread adoption of digital wallets. Led decisively by Alipay and WeChat Pay, app-based payments via mobile devices redefine the scope of the possible. Chinese consumers are categorically choosing the seamless integration and trusted environment offered by these all-inclusive apps. eWallet use is ubiquitous in China online, accounting for nearly two-thirds of eCommerce transactions. eWallets are so popular among Chinese consumers that they also lead payments at the point of sale, representing more than a third of card-present market share.
Elsewhere in the region, we forecast growth and dramatic shifts in payments in India. Home to the world’s second largest population that remains far from saturation in either internet access or mobile phone penetration, we project eCommerce growth in India at 21.2% CAGR for the next five years. Unique and challenging eCommerce payment pictures are present throughout the region. Bank
transfers lead the way online in Indonesia, Thailand, and Malaysia. Though cash on delivery only accounts for just over 4.5% of eCommerce spend regionally, it’s the leading payment method in the Philippines.
Looking forward, Asia offers seemingly infinite promise for commerce and payments. Though local economic development conditions are determinative, some regional trends are apparent. At the point of sale, we project dramatic shifts from cash to eWallets over the next five years with debit and credit cards maintaining current share. On the eCommerce side, we project continued global leadership in the adoption of eWallets; led by China, we expect eWallets to account for two-thirds of regional payment volume by 2022.
16

Asia Pacific POS payment methods
2018* 2022**
Cash 30% 14%
eWallet 27% 42%
Debit Card 26% 26%
Credit Card 16% 16%
Pre-Paid Card 1% 1%
Charge Card 0% 0%
Asia Pacific eCom payment methods
2018* 2022**
eWallet 52% 66%
Credit Card 17% 11%
Bank Transfer 12% 11%
Debit Card 5% 3%
Cash on Delivery 4% 2%
Charge & Deferred Debit Card 4% 3%
PostPay 2% 2%
Pre-Paid Card 2% 1%
PrePay 0% 0%
eInvoices 0% 0%
Other 0% 0%
2022**2022**2018* 2018*
17
* Estimated **Forecasted Numbers adjusted for rounding may impact totals.

18

Key Insights
19

China’s growth, boundless opportunity
20

The context of commerce can be reinvented in a single generation. Take the case of China. Commercial opportunities stem from technology just as much as shifts in geo-political norms.
Free-market reforms and the opening of the economy to foreign trade and investment unleashed China’s latent economic fertility. Special economic zones (SEZs) and the age of the internet further fueled China’s rise. The World Bank cited China’s growth as the fastest sustained expansion by a major economy in history, with GDP growth hovering at 9.5% through 2017.1
Free of the legacy infrastructure of the West, China didn’t have to reimagine retail transformation the way developed economies did in the late 90s. China’s leapfrog to the forefront of the global economy leveraged the rise of affordable and widely available technology, including mobile phones. China boasts the world’s largest online population (~772 million in 2017) with a remarkable 97.5% of Chinese consumers accessing the internet via their mobile devices.2
Our research shows clear signs of these mileposts. China’s eCommerce spend per capita spend sits just above average globally. Yet the percentage of payments made via eWallets is staggering—35.7% at the point of sale, 64.8% in eCommerce. Even the most mature online economies pale in comparison.
Online retail, social communication, gaming, and payments all grew up together in China. Chinese consumer services never needed to shift toward creating “seamless experiences”—they were seamlessly integrated from the ground up.
Chinese internet giant Tencent typifies this convergence. Tencent’s WeChat app has over one billion active monthly users, 900 million of whom use WeChat Pay, its integrated mobile payments platform.3 Chinese consumers shop, chat, split bills among one another, share discounts and codes based on purchases, and securely purchase a seemingly infinite selection of items, all within the same trusted application.
The power of the “leapfrog” analogy comes into focus when considering some of the innovations offered by JD.com, a leading Chinese eCommerce company. Much of rural China is far removed from conventional supply chains. Yet a lack of extensive infrastructure doesn’t mean a lack of consumers looking to tap into eCommerce. To the contrary, millions of rural Chinese yearn to engage in eCommerce.
JD.com has sought to solve this problem with new technologies such as robots and drone delivery. Deliveries are also made conventionally to even the most remote regions, providing deliveries beyond the reach (or regularity) of the Chinese postal service. Innovation has a human element as well. JD.com’s delivery unit, JD Logistics, sends uniformed representatives, often from the local areas they serve, to make deliveries and represent the company in a more personal manner.4 This combination of technological innovation and personal touch may prove to be a decisive competitive advantage in the battle for the world’s largest market.
Businesses seeking to serve Chinese consumers need to recognize and conform to an entirely different set of expectations. This is certainly true of eCommerce and increasingly the case for serving Chinese tourists as they travel abroad in larger numbers. Serving the Chinese consumer means, at a minimum, accepting Alipay and WeChat Pay, as well as UnionPay, the dominant Chinese card brand scheme.
In the end, knowledge of how a Chinese consumer behaves online and at the point of sale makes the big world small.
1. The World Bank, China overview: https://www.worldbank.org/en/country/china/overview
2. China Internet Network Information Center, The 41st Statistical Report on Internet Development in China, January 2018: https://cnnic.com.cn/IDR/ReportDownloads/
3. Business Insider, “AliPay, WeChat Pay so common Chinese street vendors, musicians use it,” May 29, 2018.
4. Fan, Jiayang, “How e-Commerce is transforming rural China,” The New Yorker, July 23, 2018.
21

Millennials – Don’t judge a consumer cohort by its cover
22

We’re living among the largest youth population in global history. In 2017, more than half of the world’s 7.6 billion people were under aged 30.1 At the center of this youth boom are the Millennials, those born between 1980 and 2000.
Born and raised in the digital era, this celebrated generation is far from uniform. The cultural, economic, political, and social experiences of Millennials are as diverse as their home nations. Their shared experiences, however, are profound. Global media has forever changed this generation’s relationship with the world. Previously unimagined levels of immediate connection are experienced by Millennials as natural and inevitable. Social media’s ability to convey reality in real-time reflects and shapes their worldview. What’s new for most is native for Millennials.
Millennials are generally considered more progressive than previous generations, seeking work that incorporates social good. What motivates their behaviors is often local. Those local drivers also influence attitudes around consumption and money. They shape Millennial behaviors both as consumers and as payers.
Our research finds US and UK Millennials (80% for each) mostly on par with citizens across age segments when it comes to having shopped online in the last month (71% and 79% for the US and UK, respectively). That’s no surprise where retail delivery and payments habits are ingrained. However, the examples of Mexico (46% of Millennials versus 13% of all respondents) and China (86% of Millennials versus 54% of all respondents) paint very different pictures locally.
These behaviors may also foretell very different approaches to payments. We find that 28% of Millennials globally have used a mobile wallet at the point of sale, versus 20% of all respondents globally. China and India have the two largest global youth populations. We found 74% of Chinese Millennials and 75% of India’s Millennials have used a mobile wallet at the point of sale. Mobile wallet adoption by US and UK youth is less than half of their Chinese and Indian peers.
So how should businesses view their ongoing relationships with the largest generational cohort? It starts with a localized understanding of extreme diversity. For instance, the burden of student debt and high housing costs among American and European Millennials influence consumption and payment behaviors. Elsewhere, Millennials’ comfort with technology, relative digital freedom, and burgeoning consumerism
fuels both purchase and payment behaviors—as suggested by the large differences in payment behaviors our research notes in China and India.
While Millennials typically expect more from businesses and are often willing to pay more for experiences, they’re also demanding more as a group from businesses societally. What motivates them culturally, politically, and socially also motivates their attitudes about business.
These attitudes are apparent in their beliefs as employees. The 2018 Deloitte Millennial Survey suggests where businesses are “out of step” with Millennial priorities.2 There are big gaps between what Millennials believe employers should try to achieve versus their perceptions of organizational priorities. Those gaps include job generation, improving society, and enhancing the livelihood of employees.
Millennials are loyal to big businesses and big brands, but they’re also quietly exacting in their expectations of businesses—both in terms of creating the best experiences and influencing social norms. Their native digital reality means Millennials don’t follow in the footsteps of their parents in many ways, including payment preferences.
Understanding the socio-demographic diversity of your customers and reconciling localized attitudes and behaviors to your own commercial and payments strategies will be critical to success, however and wherever you sell.
1. The World Economic Forum, “Global Shapers Survey 2017.” http://www.shaperssurvey2017.org/ static/data/WEF_GSC_Annual_Survey_2017.pdf
2. 2018 Deloitte Millennial Survey, © 2018, Deloitte Touche Tohmatsu Limited, https://www2.deloitte. com/global/en/pages/about-deloitte/articles/millennialsurvey.html 23

The now economy
24

Whatever we buy, whenever we buy, however we buy, the global consumer economy has become a Now Economy. Satisfying consumer needs instantly, at scale, was once only a dream. Customers expect to be gratified instantly. That changes the equation of how we order, receive, and pay for goods, services, and content. In the Now Economy, providing service with a sense of immediacy is no longer a preference—it’s essential.
The ability to order virtually anything, anywhere, at any time completely resets expectations for immediacy. The Now Economy reflects those expectations rippling throughout the consumer experience, with more weight than ever on faster access to goods and content. An example is fast couture fashion—major fashion houses blanket social media during their shows and make their collections available online for immediate purchase.
The rising delivery expectations of The Now Economy are likely to be served by emerging technologies like robots and drones. For consumers, drones promise to deliver on the immediate gratification for more products faster, and even to remote locations. For merchants, drones promise to increase efficiency and reduce costs for the ‘last mile.’ Small scale drone delivery is now a reality in China, with eCommerce giant JD.com among the first to market.
The concept of “buy now, pay later” has been part of commerce for generations, from IOUs to credit cards. The Now Economy extends that concept to be more flexible and accessible than ever. “Buy now, pay later” services such as Affirm, AfterPay, and Klarna are gaining widespread popularity for removing common barriers at the critical moment of purchase decision. Retailers seek to reduce shopping cart abandonment rates by eliminating friction. Friction at checkout arises from many factors including security concerns, unexpected shipping charges, and cost. “Buy now, pay later” options help reduce price friction and increase conversion rates.
A June 2018 survey found that 74% of US internet users believed the ability to try items before they purchased them would remove a barrier to online shopping. 1 New payment options seek to address that concern head-on by allowing shopping risk-free. Emerging technologies that allow consumers to try before they buy—such as virtual and augmented reality—are expensive to adopt, so these new credit options offer quicker and more effective ways for companies to deliver that option to customers. Instead of buy now, pay later, it’s try before you buy. The buyer gets her item straight away. If she likes it, she pays for it within a specified time. If not, she returns it at no cost.
In The Now Economy, consumers are in control. For merchants, The Now Economy demands crafting a more sophisticated understanding of—and response to—evolving expectations. Intelligently collecting and analyzing data to better understand how consumers interact with businesses is—and will continue to be—central to successful merchant strategizing. An effective eCommerce strategy might include offering alternative payment options, or flexible financing services that allow consumers to receive their goods as quickly as they wish, or a no-quibbles returns policy that offers all the same immediacy and instant resolution.
The Now Economy poses daunting challenges and profound opportunities. Consumer demands for instant gratification reflect a natural evolution: the immediacy we’ve grown accustomed to shapes our expectations for service wherever it takes place. That’s a challenging but very achievable bar of engagement and service. The opportunity is simply immense as merchants that can embrace the insights of The Now Economy will connect with consumers on a personalized basis—at scale.
1. eMarketer, “US Internet Users Who Believe the Ability to Try Items Before Paying Would Remove a Barrier to Digital Shopping,” May 2018. 25
The invisible touch of payments
26

Throughout human history, payment methods have evolved ever smaller. From livestock to gold coins, cash to checks, plastic credit cards to digital wallets, the march of payment history evolves from the concrete to the abstract.
Recurring payments set the stage for the revolution in subscription services. From music to movies and beauty services to groceries, subscription services allow consumers to focus on experiences, with the friction of payments fading away. That’s the essence of invisible payments: convenience so seamless that the very act of payment is effortless.
Connected cars, automatic replenishment via IoT devices, and increasingly friction-free checkout experiences at the physical point of sale are just a few of the practical applications of invisible payments. Imagine needing nothing more than your car and your consent to seamlessly pay for parking, gas, tolls, or purchases at drive-through restaurants. Those realities are well within sight, with a flurry of exciting developments in connected cars and payment integrations on the horizon. 1
Invisible payments are finding practical application today with automatic replenishments that allow consumers to pre-arrange payment to replenish balances for ongoing services. Commuters use automatic replenishment to pay for tolls via devices affixed to their vehicles. Looking forward, IoT solutions promise to link measurement devices to ordering and payment for everything from coffee to dishwashing detergent. 2
Given increasing consumer expectation that payments “just happen,” retailers will want to create seamless payment flows to reduce “bad” friction. But some friction—like authentication—is not only good, it’s essential. A 2018 comScore survey showed that concerns over data security and providing payment information are leading points of friction against more widespread adoption of purchases using smart speakers. 3
Consumer expectations for safe payments demand that merchants make secure user authentication as seamless as the act of payment.
A logical destination for invisible payments points to checkout-free, in-store shopping experiences. Some of the world’s largest retailers and technology companies are developing systems that aim to make the friction of checkout a thing of the past.4 Juniper Research projects that retail spend using “just walk out” smart checkout technology will grow from $253 million in 2018 to more than $45 billion in transactions by 2023. 5
Still, as invisible payments take complete hold of more “carts,” there’s an imperative for merchants to not only secure them fully, but to approve or not approve the right payments at the right times. This includes more use of payments enabled by biometrics, facial recognition, voice recognition, fingerprints and irises, and proximity based technologies like beacons. 6 It also includes richer use of processing technologies and tools rooted in machine-learning that scour the universe of fraud to determine which payments do and do not get approved, in real time.
Invisible payments are emerging as practical applications among businesses large and small, across verticals and geographies, every day. Retailers should look to their payment partners for advice on how to use invisible payments to produce better user experiences, predictable revenue, and loyal customers. More than just delivering “invisible,” look for opportunities to deliver value-added services alongside the invisible act of payment—such as automatic adds to loyalty schemes.
1. Visa, “Road ahead: Connected cars coming to a lot near you” usa.visa.com/visa-everywhere/inno vation/connected-car.html
2. CB Insights, “Walmart’s IoT Patent Application Takes Aim At Amazon Dash,” May 4 2017. https:// www.cbinsights.com/research/walmart-iot-patent/
3. comScore via eMarketer, “Reasons that US Smart Speaker Users Do Not Make Purchases via Smart Speaker, March 2018.”
4. Reuters, “Exclusive: Microsoft takes aim at Amazon with push for checkout-free retail,” June 13 2018.
5. Juniper Research, “’Just Walk Out’ Shopping & Other Smart Checkout Tech To Reach Over $45 Billion Transactions By 2023, As Retailers Strive to Eliminate Lines,” Sep 25, 2018, https://www.juniperres earch.com/press/press-releases/just-walk-out-shopping-other-smart-checkout
6. Alizila, “Take a Tour of Hema Supermarket and Experience ‘New Retail’,” https://www.alizila.com/ video/take-tour-hema-supermarket-experience-new-retail/ 27

It’s all commerce
28

Generations ago, commerce was simple. Businesses organized simply too. Later, advances in technology led to new modes of selling. Channels formed as a natural response and commerce became more complex. Poor coordination among channels often produced inconsistent experiences for customers. Multichannel efforts promised greater coordination, while omnichannel approaches emphasized a consistent customer experience at every touchpoint.
Today, it’s not just that channels are blending—the very notion of channel now seems antiquated. So perhaps it’s time to change the channel paradigm altogether. Because today, it’s all commerce.
The gravity-defying rise of mobile commerce continues to reshape our societies. Mobile commerce accounted for well over half (58.9%) of the more than $2.3 trillion in global eCommerce sales in 2017, a stunning 40.3% increase over 2016. 1 Our research projects that global mCommerce will surpass desktop sales as early as 2023. The mobile phone is the central disruptive figure in many industries. Yet “mobile” is often thought of as simply another channel. Even more profound, the mobile phone serves as a revolutionary catalyst, freeing all commerce from any conception of channel. What the mobile phone started is now spilling over virtually everywhere.
Meanwhile, predictions of the physical store’s demise are premature at best, with nearly 90% of global retail still taking place at the point of sale. PwC’s Global Consumer Insights Survey suggests that shopping in-store is more popular than ever with 44% of global consumers surveyed shopping at the point of sale every week. 2 The in-person shopping experience is fixed firmly in place.
What happens when the irresistible force of eCommerce meets the immovable object of the physical store? Like water, commerce fills every available space. Voice-activated personal assistants now occupy our phones, car, and homes, making commerce as simple as announcing our desires. Infinitely versatile apps virtualize checkout, making once friction-filled experiences easy. Contextual commerce links social media directly to shopping. Conversational commerce enables personalized shopping through live chat and automated chat bots. The Internet of Things integrates commerce into seemingly everything, from our cars as we pass through tolls to sensors in our appliances. It’s all commerce.
What’s to be learned from the confluence of channels? For merchants, it’s all commerce means considering how physical store, online, and app-driven device experiences best integrate into holistic experiences that require no stitching. It’s all commerce means changing how businesses think about serving their customers.
Payments are essential to that mission. Payments are foundational to providing safe, frictionless experiences to consumers, however they shop. It’s all commerce means providing payment options that serve ever-increasing convenience, without sacrificing essential security that customers demand. For retailers, it’s all commerce means working with their payment partners to manage the complexity arising from an explosion of use cases.
For merchants, the fact that it’s all commerce means more complexity than ever. Complexity doesn’t require opening a virtual storefront at every consumer touchpoint. Managing complexity starts with the customer. It’s all commerce isn’t about trying to be everything to everyone. It’s about transcending channel, clearing the clutter, and delighting your customers.
Commerce is as ubiquitous as the air we breathe, with channels leading to a confluence that is now a global flood. It’s an exciting time for retailers, for consumers, and for the payments that connect us. It’s all commerce means commerce that is simple once again.
1. eMarketer, “Worldwide Retail and Ecommerce Sales: eMarketer’s Updated Forecast and New Mcommerce Estimates for 2016—2021,” Jan 29, 2018.
2. PwC’s Global Consumer Insights Survey 2018: “From mall to mobile: Adjusting to new consumer habits,” pwc.com/gx/en/industries/consumer-markets/consumer-insights-survey.html.
29

30

Market Guides
31

The gap between credit card and eWallet is closing when it comes to how Argentine consumers pay online. Credit cards meet consumers’ preference to pay by installment and eWallets provide convenience. There’s been no change in preferences among other payment methods such as bank transfer and debit card.
ARGENTINA
FAST STATS2017 eCom SPEND
PER CAPITA
US $177
2017 % eCom SPEND USING
MOBILE WALLET
22%
2018* - 2022** eCom CAGR
16%
2017 POS SPEND PER CAPITA
US $3,819
2017 % POS SPEND USING
MOBILE WALLET
4%
2018* - 2022** POS CAGR
16%
2018* INTERNET PENETRATION
81%32

2017 CARD PRESENT MIX BY PAYMENT METHOD
Cash
Credit Card
Debit Card
eWallet
Pre-paid Card
44%33%
18%4%
1%
2017 CARD NOT PRESENT MIX BY PAYMENT METHOD
Credit Card
eWallet
Bank Transfer
Debit Card
Charge & Deferred Debit Card
Cash on Delivery
PostPay
PrePay
Pre-paid Card
Other
27%22%
14%10%
8%
8%
7%
2%
2%
0%
TOP TIPeWallets are coming into their own in Argentina. You should look to broaden your payment method offerings. Consider local eWallets such as MercadoPago to help boost conversion rates, online and at the point of sale.
2017 CARD BRAND BREAKDOWNS (eCom and POS)
Visa 59%
Mastercard 23%
American Express 7%
Tarjeta Naranja 5%
Others 2%
Cabal 2%
Banco Credicoop 1%
S.A.C.I. Falabella 1%
US$11bn
US$171bn
US$11bn
US$8bnUS$7bn
US$3bn2018* 2022**
POS and eCom PROJECTED GROWTH
US$19bn
US$309bn
eCom turnover
DesktopMobile
POS
POPULAR ALTERNATIVE PAYMENT METHODS
33
* Estimated **Forecasted
Numbers adjusted for rounding may impact totals.

FAST STATS
Credit cards remain the top payment preference for online shopping but Australians have also embraced other methods over the last year. Bank transfer and debit cards have been used more while cash on delivery is slowing down. And while eWallets remain one of the popular payment types for online shopping, they have some catching up to do at the point of sale.
AUSTRALIA
2017 eCom SPEND PER CAPITA
US $1,169
2017 % eCom SPEND USING
MOBILE WALLET
18%
2018* - 2022** eCom CAGR
8%
2017 POS SPEND PER CAPITA
US $24,535
2017 % POS SPEND USING
MOBILE WALLET
2%
2018* - 2022** POS CAGR
3%
2018* INTERNET PENETRATION
92%34

2017 CARD BRAND BREAKDOWNS (eCom and POS)
Visa 38%
Mastercard 29%
eftpos 25%
American Express 8%
2018*
2017 CARD PRESENT MIX BY PAYMENT METHOD
Debit Card
Credit Card
Cash
Charge Card
eWallet
38%33%
19%8%
2%
Credit Card
eWallet
Bank Transfer
Debit Card
PostPay
Charge & Deferred Debit Card
Cash on Delivery
eInvoices
PrePay
Pre-paid Card
Other
2017 CARD NOT PRESENT MIX BY PAYMENT METHOD
37%18%17%
12%
4%
4%
3%
3%
1%
1%
0%
TOP TIPAustralian consumers lean towards convenience. Offering the easiest ways to pay could increase sales. That means simplifying your checkout experiences and offering eWallets like PayPal and Visa Checkout, as well as the most popular card brands in market, to capture your share. Also consider adding AfterPay to serve consumers who prefer eInvoicing and PostPay.
US$32bn
US$613bn
US$18bn
US$14bn
POS and eCom PROJECTED GROWTH
US$18bn
US$25bn
2022**
US$44bn
US$688bn
POPULAR ALTERNATIVE PAYMENT METHODS
eCom turnover
DesktopMobile
POS
35
* Estimated **Forecasted
Numbers adjusted for rounding may impact totals.

FAST STATS
Belgians stay with the traditional when it comes to payment methods. Credit cards lead the way online and debits card lead at the point of sale. While online eWallet use was 17% in 2016, traction has slowed in the last year, and hasn’t yet been adopted when it comes to point of sale shopping, leaving room for growth all around when it comes to digital payments.
BELGIUM
2017 eCom SPEND PER CAPITA
US $1,057
2017 % eCom SPEND USING
MOBILE WALLET
13%
2018* - 2022** eCom CAGR
8%
2017 POS SPEND PER CAPITA
US $14,508
2017 % POS SPEND USING
MOBILE WALLET
2%
2018* - 2022** POS CAGR
1%
2018* INTERNET PENETRATION
89%36

POPULAR ALTERNATIVE PAYMENT METHODS
2017 CARD PRESENT MIX BY PAYMENT METHOD
Debit Card
Cash
Credit Card
eWallet
44%38%
16%2%
Credit Card
Bank Transfer
Debit Card
eWallet
eInvoices
Cash on Delivery
Charge & Deferred Debit Card
Pre-paid Card
Other
2017 CARD NOT PRESENT MIX BY PAYMENT METHOD
26%21%
20%13%
8%
6%
4%
1%
1%
TOP TIPSlowing eWallet growth leaves us suggesting that you only offer those that have made a market in Belgium before doubling-down on card brands. Offer all major local brands to bring in Belgian consumers.
2017 CARD BRAND BREAKDOWNS (eCom and POS)
Bancontact 82%
Visa 13%
Mastercard 4%
American Express 1%
2018*
US$13bn
US$166bn
US$11bn
US$2bn
POS and eCom PROJECTED GROWTH
US$14bn
US$4bn
2022**
US$18bn
US$172bn
eCom turnover
DesktopMobile
POS
37
* Estimated **Forecasted
Numbers adjusted for rounding may impact totals.

Installment payments are common practice for Brazilians helping to keep credit cards at the top of the list of preferred payment types in online shopping. Point of sale shopping is dominated by only three payment types: cash, credit cards, and debit cards. eWallet use at the point of sale doesn’t yet match online adoption.
BRAZIL
FAST STATS2017 eCom SPEND
PER CAPITA
US $116
2017 % eCom SPEND USING
MOBILE WALLET
13%
2018* - 2022** eCom CAGR
6%
2017 POS SPEND PER CAPITA
US $3,746
2017 % POS SPEND USING
MOBILE WALLET
3%
2018* - 2022** POS CAGR
5%
2018* INTERNET PENETRATION
68%38

POPULAR ALTERNATIVE PAYMENT METHODS
2017 CARD PRESENT MIX BY PAYMENT METHOD
Cash
Credit Card
Debit Card
eWallet
52%26%
18%3%
Credit Card
PostPay
eWallet
Bank Transfer
Debit Card
Charge & Deferred Debit Card
Cash on Delivery
Pre-paid Card
Other
PrePay
eInvoices
2017 CARD NOT PRESENT MIX BY PAYMENT METHOD
60%15%13%
6%
2%
2%
1%1%
0%0%
0%
TOP TIPInstallment payments aren’t going anywhere in Brazil, so make sure you’re offering options such as Boleto Bancário in addition to traditional credit cards to make the most of this still-growing eCommerce opportunity. Cash is the first preference for point of sale but credit and debit cards are also popular. Implement the most popular local card brands such as Elo.
2017 CARD BRAND BREAKDOWNS (eCom and POS)
Mastercard 45%
Visa 39%
Elo 12%
Itaú Unibanco 1%
Others 1%
American Express 1%
2018*
US$28bn
US$791bn
US$19bn
US$9bn
POS and eCom PROJECTED GROWTH
US$21bn
US$18bn
2022**
US$39bn
US$964bn
eCom turnover
DesktopMobile
POS
39
* Estimated **Forecasted
Numbers adjusted for rounding may impact totals.

Among Canadians, credit cards remain the overwhelming choice for all purchases online and off. Other payment types such as eWallets and bank transfers have gained some traction over the last year. eWallets are the second most popular payment type for online shopping, but have opportunity to scale at the point of sale — only 1% of Canadian consumers use an eWallet for card present purchases.
CANADA
FAST STATS2017 eCom SPEND
PER CAPITA
US $1,334
2017 % eCom SPEND USING
MOBILE WALLET
16%
2018* - 2022** eCom CAGR
10%
2017 POS SPEND PER CAPITA
US $18,727
2017 % POS SPEND USING
MOBILE WALLET
1%
2018* - 2022** POS CAGR
5%
2018* INTERNET PENETRATION
93%40

POPULAR ALTERNATIVE PAYMENT METHODS
2017 CARD BRAND BREAKDOWNS (eCom and POS)
Visa 39%
Interac 35%
Mastercard 24%
American Express 3%
2018*
US$55bn
US$695bn
US$43bn
US$13bn
POS and eCom PROJECTED GROWTH
US$58bn
US$22bn
2022**
US$80bn
US$854bn
Credit Card
eWallet
Bank Transfer
Debit Card
Cash on Delivery
Charge & Deferred Debit Card
Pre-paid Card
2017 CARD NOT PRESENT MIX BY PAYMENT METHOD
64%16%
9%5%
4%
1%
1%
TOP TIPThough a relatively mature payments market, there has been some growth in eWallets in Canada. Enterprising companies wanting to get ahead of the curve should offer PayPal and eWallets like Visa Checkout and Masterpass. Point of sale shopping is dominated by credit and debit card use so accepting the most popular brands is important: Visa, Interac, and Mastercard.
2017 CARD PRESENT MIX BY PAYMENT METHOD
Credit Card
Debit Card
Cash
Charge Card
Pre-paid Card
eWallet
51%26%
13%7%
2%1%
eCom turnover
DesktopMobile
POS
41
* Estimated **Forecasted
Numbers adjusted for rounding may impact totals.

Chinese consumers have adopted eWallets like no other nation in the world. That trend isn’t slowing, as eWallets are the top payment method online and at the point of sale. Online retail sales increased 32% in 2017 solidifying this market as a world leader in eCommerce. More traditional forms of payment have yet to challenge that mobile adoption.
CHINA
FAST STATS2017 eCom SPEND
PER CAPITA
US $787
2017 % eCom SPEND USING
MOBILE WALLET
65%
2018* - 2022** eCom CAGR
9%
2017 POS SPEND PER CAPITA
US $10,911
2017 % POS SPEND USING
MOBILE WALLET
36%
2018* - 2022** POS CAGR
11%
2018* INTERNET PENETRATION
61%42

POPULAR ALTERNATIVE PAYMENT METHODS
2017 CARD BRAND BREAKDOWNS (eCom and POS)
China UnionPay 99%
Other 1%
2018*
US$1,260bn
US$15,206bn
POS and eCom PROJECTED GROWTH
2022**
US$1,785bn
US$23,055bn
US$515bn
US$600bnUS$746bn
US$1,185bn
2017 CARD PRESENT MIX BY PAYMENT METHOD
eWallet
Debit Card
Cash
Credit Card
36%31%
21%12%
eWallet
Bank Transfer
Credit Card
Charge & Deferred Debit Card
Debit Card
Cash on Delivery
Pre-paid Card
PrePay
Other
2017 CARD NOT PRESENT MIX BY PAYMENT METHOD
65%11%
9%5%
5%
3%
2%
0%
0%
TOP TIPmCommerce is far outstripping traditional desktop purchasing in China so you will want to offer local eWallet leaders Alipay and WeChat Pay. These eWallets and others are also a must at the point of sale, more so than in any major global market.
eCom turnover
DesktopMobile
POS
43
* Estimated **Forecasted
Numbers adjusted for rounding may impact totals.

Credit cards have gained significant ground in the last year for Colombians shopping online, overtaking bank transfer as the dominant payment method of choice. Bank transfers maintain their fair share of the online market. When it comes to point of sale shopping, cash is still king. However, it is unclear if credit or debit cards will prevail as consumers rely equally on both. There’s significant growth opportunity for digital payments, with negligible adoption of eWallets to date, online and off.
COLOMBIA
FAST STATS2017 eCom SPEND
PER CAPITA
US $99
2017 % eCom SPEND USING
MOBILE WALLET
0%
2018* - 2022** eCom CAGR
23%
2017 POS SPEND PER CAPITA
US $1,397
2017 % POS SPEND USING
MOBILE WALLET
1%
2018* - 2022** POS CAGR
4%
2018* INTERNET PENETRATION
67%44

POPULAR ALTERNATIVE PAYMENT METHODS
2017 CARD BRAND BREAKDOWNS (eCom and POS)
Mastercard 51%
Visa 44%
American Express 2%
Diners Club 1%
Others 1%
US$6bn
US$69bn
US$5bn
US$4bnUS$4bn
US$2bn2018* 2022**
POS and eCom PROJECTED GROWTH
US$8bn
US$81bn
2017 CARD PRESENT MIX BY PAYMENT METHOD
Cash
Credit Card
Debit Card
eWallet
Pre-paid Card
55%22%22%
1%
0%
2017 CARD NOT PRESENT MIX BY PAYMENT METHOD
Credit Card
Bank Transfer
eWallet
Cash on Delivery
Debit Card
Other
50%25%
10%8%
6%
1%
TOP TIPThe boost in credit card usage suggests that you accept all major card brands to make the most of the Colombian market online and at the point of sale.
eCom turnover
DesktopMobile
POS
45
* Estimated **Forecasted
Numbers adjusted for rounding may impact totals.

Danish consumers have shown no change in their top online payment preferences. eWallets continue to be the most popular online payment method although their use at physical points of sale has yet to take hold. eWallets and debit cards continue to compete in the eCommerce race for top preference with consumers. With a merchant focus on accepting the Dankort card, debit cards are the overwhelming choice of Danish consumers when it comes to shopping at the point of sale.
DENMARK
FAST STATS2017 eCom SPEND
PER CAPITA
US $3,188
2017 % eCom SPEND USING
MOBILE WALLET
26%
2018* - 2022** eCom CAGR
9%
2017 POS SPEND PER CAPITA
US $19,916
2017 % POS SPEND USING
MOBILE WALLET
2%
2018* - 2022** POS CAGR
-1%
2018* INTERNET PENETRATION
100%46

POPULAR ALTERNATIVE PAYMENT METHODS
2017 CARD BRAND BREAKDOWNS (eCom and POS)
Dankort 71%
Mastercard 15%
Visa 13%
US$21bn
US$116bn
US$17bn
US$12bnUS$14bn
US$7bn2018* 2022**
POS and eCom PROJECTED GROWTH
US$29bn
US$112bn
2017 CARD PRESENT MIX BY PAYMENT METHOD
Debit Card
Cash
Credit Card
eWallet
76%16%
6%2%
2017 CARD NOT PRESENT MIX BY PAYMENT METHOD
eWallet
Debit Card
Credit Card
Bank Transfer
Charge & Deferred Debit Card
eInvoices
Cash on Delivery
Pre-paid Card
26%24%
18%15%
8%
5%
3%
1%
TOP TIPDenmark trends towards local card brands and eWallets. Ensure your payment offerings here are updated with customer preferences including local eWallets like MobilePay, as well local card brands like the Dankort card.
eCom turnover
DesktopMobile
POS
47
* Estimated **Forecasted
Numbers adjusted for rounding may impact totals.

No single payment method emerges as the clear leader in the online space. That’s likely due, in part, to French consumer aversion to debt. That makes forms of non-credit payment popular, offline and online. Digital payments such as eWallets are competing for online use but have yet to become popular for point of sale shopping.
FRANCE
FAST STATS2017 eCom SPEND
PER CAPITA
US $1,463
2017 % eCom SPEND USING
MOBILE WALLET
21%
2018* - 2022** eCom CAGR
8%
2017 POS SPEND PER CAPITA
US $14,339
2017 % POS SPEND USING
MOBILE WALLET
1%
2018* - 2022** POS CAGR
1%
2018* INTERNET PENETRATION
89%48

POPULAR ALTERNATIVE PAYMENT METHODS
2017 CARD BRAND BREAKDOWNS (eCom and POS)
Cartes Bancaires 91%
Others 5%
Mastercard 2%
American Express 1%
US$109bn
US$967bn
US$87bn
US$62bnUS$81bn
US$28bn
2018* 2022**
POS and eCom PROJECTED GROWTH
US$149bn
US$988bn
2017 CARD PRESENT MIX BY PAYMENT METHOD
Debit Card
Cash
Charge Card
Credit Card
eWallet
46%30%
16%7%
1%
2017 CARD NOT PRESENT MIX BY PAYMENT METHOD
Charge & Deferred Debit Card
eWallet
Debit Card
Credit Card
Bank Transfer
Cash on Delivery
PrePay
eInvoices
Pre-paid Card
Other
22%
21%17%
16%
12%
5%
3%
2%
1%
1%
TOP TIPLocal card brands are imperative at the point of sale so offer Cartes Bancaires for quick and easy checkout experiences. Forward thinking companies may want to start accepting eWallets at the point of sale as digital payment popularity potentially increases. Expected growth in mobile commerce over the next few years may create a tipping point for the use of mobile-driven payments at the point of sale.
eCom turnover
DesktopMobile
POS
49
* Estimated **Forecasted
Numbers adjusted for rounding may impact totals.

From Berlin to Bonn, and points between, German consumers prefer bank transfer for online payments. Use of credit cards online has shown some uptick. And growth of invoicing and charge cards suggest a change in how cash is being used online. Cash still dominates at the point of sale with 55% of share.
GERMANY
FAST STATS2017 eCom SPEND
PER CAPITA
US $1,074
2017 % eCom SPEND USING
MOBILE WALLET
20%
2018* - 2022** eCom CAGR
10%
2017 POS SPEND PER CAPITA
US $12,241
2017 % POS SPEND USING
MOBILE WALLET
5%
2018* - 2022** POS CAGR
2%
2018* INTERNET PENETRATION
93%50

POPULAR ALTERNATIVE PAYMENT METHODS
2017 CARD PRESENT MIX BY PAYMENT METHOD
Cash
Debit Card
Charge Card
eWallet
Credit Card
55%25%
12%5%
1%
2017 CARD NOT PRESENT MIX BY PAYMENT METHOD
Bank Transfer
eWallet
Credit Card
Charge & Deferred Debit Card
Cash on Delivery
eInvoices
Debit Card
Other
PostPay
Pre-paid Card
PrePay
27%20%
18%11%
9%
8%
2%
2%
1%
1%
TOP TIPGerman consumers look for simplicity in commerce. Optimize the mix of payment methods, online and off, to create a seamless payment experience and make sure popular local payment methods, like Girocard, are accepted. eWallets are getting some use at the point of sale, so promoting employee awareness and training will help consumers speed through checkout.
2017 CARD BRAND BREAKDOWNS (eCom and POS)
Girocard 71%
Visa 14%
Mastercard 12%
American Express 2%
US$97bn
US$1,018bn
US$90bn
US$50bn
US$69bn
US$28bn
2018* 2022**
POS and eCom PROJECTED GROWTH
US$141bn
US$1,090bn
0%
eCom turnover
DesktopMobile
POS
51
* Estimated **Forecasted
Numbers adjusted for rounding may impact totals.
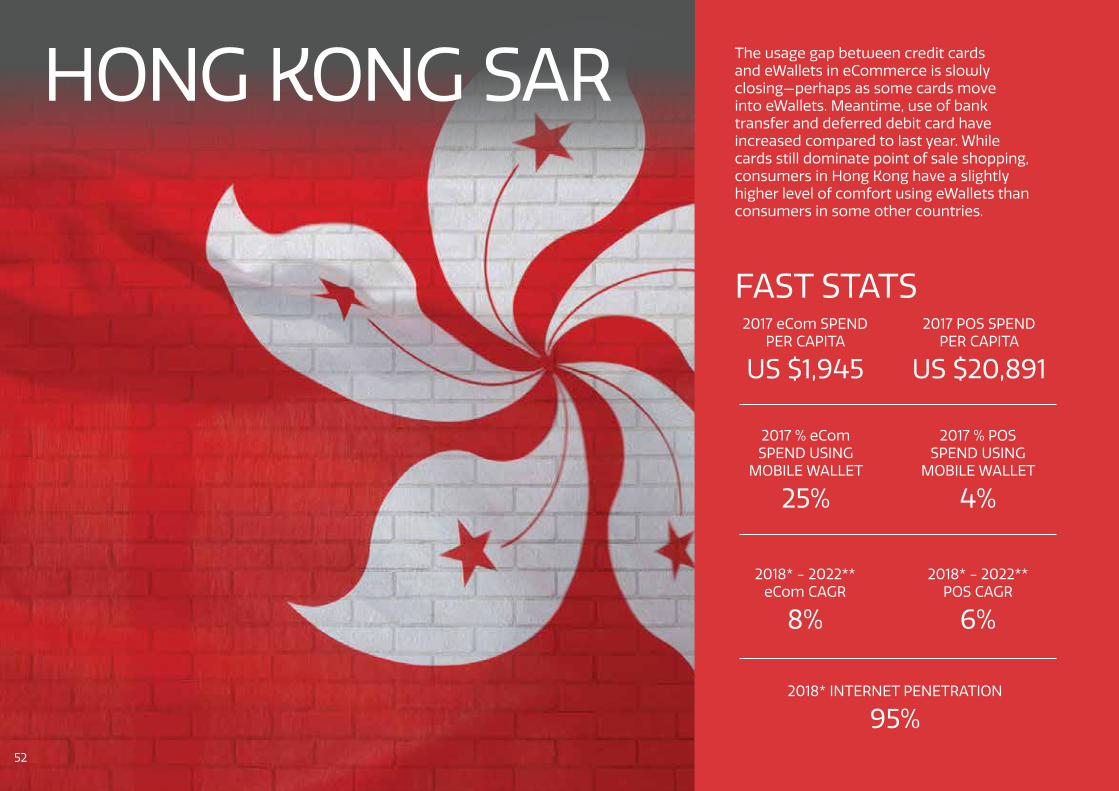
The usage gap between credit cards and eWallets in eCommerce is slowly closing—perhaps as some cards move into eWallets. Meantime, use of bank transfer and deferred debit card have increased compared to last year. While cards still dominate point of sale shopping, consumers in Hong Kong have a slightly higher level of comfort using eWallets than consumers in some other countries.
HONG KONG SAR
FAST STATS2017 eCom SPEND
PER CAPITA
US $1,945
2017 % eCom SPEND USING
MOBILE WALLET
25%
2018* - 2022** eCom CAGR
8%
2017 POS SPEND PER CAPITA
US $20,891
2017 % POS SPEND USING
MOBILE WALLET
4%
2018* - 2022** POS CAGR
6%
2018* INTERNET PENETRATION
95%52

POPULAR ALTERNATIVE PAYMENT METHODS
2017 CARD PRESENT MIX BY PAYMENT METHOD
Credit Card
Debit Card
Cash
Pre-paid Card
eWallet
Charge Card
47%26%
14%6%
4%
3%
2017 CARD NOT PRESENT MIX BY PAYMENT METHOD
Credit Card
eWallet
Bank Transfer
Charge & Deferred Debit Card
Cash on Delivery
Debit Card
Pre-paid Card
44%25%
12%10%
5%
3%
1%
TOP TIPWith the recent increase in eWallet use both online and at point of sale, keep an eye out over the coming year for those that are attracting heaviest adoption, especially Alipay. Getting in early and on-boarding these eWallets could place you ahead of the competition over the long term.
2017 CARD BRAND BREAKDOWNS (eCom and POS)
EPS 32%
China UnionPay 30%
Visa 15%
Mastercard 12%
American Express 7%
Others 4%
US$16bn
US$155bn
US$9bnUS$8bnUS$8bn
2018* 2022**
POS and eCom PROJECTED GROWTH
US$22bn
US$194bn
US$14bn
eCom turnover
DesktopMobile
POS
53
* Estimated **Forecasted
Numbers adjusted for rounding may impact totals.

Cash continues to be the primary payment method for point of sale purchases and eWallets dominate for online payments. Cash on delivery and bank transfers are equally used as the second most preferred methods of payment online. eWallet use at the point of sale remains healthy, although not to the degree of use online. As internet penetration and the digital economy continues to grow, there will be room for ongoing shift of payment forms.
INDIA
FAST STATS2017 eCom SPEND
PER CAPITA
US $27
2017 % eCom SPEND USING
MOBILE WALLET
26%
2018* - 2022** eCom CAGR
21%
2017 POS SPEND PER CAPITA
US $659
2017 % POS SPEND USING
MOBILE WALLET
6%
2018* - 2022** POS CAGR
11%
2018* INTERNET PENETRATION
45%54

POPULAR ALTERNATIVE PAYMENT METHODS
2017 CARD PRESENT MIX BY PAYMENT METHOD
Cash
Debit Card
Credit Card
eWallet
Pre-paid Card
Charge Card
72%11%
9%6%
1%1%
2017 CARD NOT PRESENT MIX BY PAYMENT METHOD
eWallet
Cash on Delivery
Bank Transfer
Credit Card
Debit Card
Charge & Deferred Debit Card
Pre-paid Card
Other
PrePay
26%19%19%
16%
12%
4%
2%
1%
1%
TOP TIPConsumers in India have typically found eCommerce to be inconvenient but that is starting to change with mCommerce adoption and simpler payment methods taking hold in eCommerce. Keep an eye on the market and be ready to expand your selection of payment methods to keep up with local customers. Enabling eWallets, such as Paytm, at the point of sale could also help differentiate your business.
2017 CARD BRAND BREAKDOWNS (eCom and POS)
Visa 48%
Mastercard 33%
RuPay 15%
American Express 4%
US$44bn
US$893bn
US$41bn
US$54bn
US$24bnUS$20bn
2018* 2022**
POS and eCom PROJECTED GROWTH
US$95bn
US$1,364bn
eCom turnover
DesktopMobile
POS
55
* Estimated **Forecasted
Numbers adjusted for rounding may impact totals.

A mix of the traditional and digital lead the way for Indonesian eCommerce purchases. Bank transfer and eWallets have solidified their positions as preferred options with both experiencing an increase in use over last year. Cash on delivery has overtaken credit cards as the third choice for online payments. However, cash continues to dominate for point of sale purchases, although eWallets remain a contender for preference compared to credit and debit cards.
INDONESIA
FAST STATS2017 eCom SPEND
PER CAPITA
US $41
2017 % eCom SPEND USING
MOBILE WALLET
24%
2018* - 2022** eCom CAGR
19%
2017 POS SPEND PER CAPITA
US $1,173
2017 % POS SPEND USING
MOBILE WALLET
5%
2018* - 2022** POS CAGR
5%
2018* INTERNET PENETRATION
34%56

POPULAR ALTERNATIVE PAYMENT METHODS
2017 CARD PRESENT MIX BY PAYMENT METHOD
Cash
Debit Card
Credit Card
eWallet
79%8%7%
5%
2017 CARD NOT PRESENT MIX BY PAYMENT METHOD
Bank Transfer
eWallet
Cash on Delivery
Credit Card
Charge & Deferred Debit Card
Debit Card
PrePay
30%24%
17%14%
7%
7%
1%
TOP TIPWhat keeps most Indonesians from shopping online is fraud. Make sure you offer locally trusted payment methods, like INDOMOG and KasPay, within a secure payment experience. Examine your global approach to fraud management, especially where fraud is a major concern among consumers. Consider implementing eWallet acceptance at the point of sale to stay competitive.
2017 CARD BRAND BREAKDOWNS (eCom and POS)
Mastercard 47%
Visa 44%
Others 7%
JCB 1%
Bank Central Asia 1%
US$14bn
US$313bn
US$10bn
US$6bn
2018* 2022**
POS and eCom PROJECTED GROWTH
US$28bn
US$381bn
US$17bn
US$8bn
eCom turnover
DesktopMobile
POS
57
* Estimated **Forecasted
Numbers adjusted for rounding may impact totals.

Italians prefer their Euro when it comes to shopping at the point of sale as cash and debit card payments make up 83% of the market. On the eCommerce front, the Italian preference for credit cards continues to grow with eWallet as a preference pacing right behind.
ITALY
FAST STATS2017 eCom SPEND
PER CAPITA
US $469
2017 % eCom SPEND USING
MOBILE WALLET
31%
2018* - 2022** eCom CAGR
12%
2017 POS SPEND PER CAPITA
US $11,958
2017 % POS SPEND USING
MOBILE WALLET
2%
2018* - 2022** POS CAGR
3%
2018* INTERNET PENETRATION
64%58

POPULAR ALTERNATIVE PAYMENT METHODS
2017 CARD PRESENT MIX BY PAYMENT METHOD
Cash
Debit Card
Charge Card
Pre-paid Card
Credit Card
eWallet
61%22%
9%5%
2%
2%
2017 CARD NOT PRESENT MIX BY PAYMENT METHOD
Credit Card
eWallet
Bank Transfer
Cash on Delivery
Charge & Deferred Debit Card
Debit Card
Pre-paid Card
PrePay
Other
36%31%
8%7%
6%
6%
4%
1%
1%
TOP TIPWith credit cards being the number one choice for eCommerce, ensure you are offering local card brands like Bancomat. Offer consumers the ability to checkout in their preferred currency to create seamless payment experiences. Point of sale purchases are split among multiple card types so enable the top card brands to meet consumer demands.
2017 CARD BRAND BREAKDOWNS (eCom and POS)
Bancomat 44%
Mastercard 27%
Visa 24%
Poste Italiane SpA 4%
American Express 1%
US$33bn
US$726bn
US$27bnUS$24bn
US$21bn
US$13bn2018* 2022**
POS and eCom PROJECTED GROWTH
US$51bn
US$806bn
eCom turnover
DesktopMobile
POS
59
* Estimated **Forecasted
Numbers adjusted for rounding may impact totals.

Japanese consumers are steady in their payment preferences with no fundamental change from last year. Cash is first at the physical counter, and credit cards remain the second most popular card-present payment type. Use of eWallets trails other mature commerce markets, both online and at point of sale.
JAPAN
FAST STATS2017 eCom SPEND
PER CAPITA
US $1,158
2017 % eCom SPEND USING
MOBILE WALLET
3%
2018* - 2022** eCom CAGR
6%
2017 POS SPEND PER CAPITA
US $14,530
2017 % POS SPEND USING
MOBILE WALLET
3%
2018* - 2022** POS CAGR
-1%
2018* INTERNET PENETRATION
100%60

POPULAR ALTERNATIVE PAYMENT METHODS
2017 CARD PRESENT MIX BY PAYMENT METHOD
Cash
Credit Card
Pre-paid Card
eWallet
67%27%
3%3%
2017 CARD NOT PRESENT MIX BY PAYMENT METHOD
Credit Card
PostPay
Bank Transfer
Cash on Delivery
eWallet
Debit Card
Pre-paid Card
Charge & Deferred Debit Card
56%20%
13%5%
3%
2%
1%1%
TOP TIPWith little change in the payment landscape we suggest focusing on improving the payment experience and creating new ways for customers to make payments quickly. Expand point of sale payment options and streamline online payment pages to ensure acceptance of Konbini and JCB. Make sure customers can purchase in their preferred currency as cross-border eCommerce sales rise in popularity.
2017 CARD BRAND BREAKDOWNS (eCom and POS)
Visa 39%
JBC 29%
Mastercard 20%
J-Debit 8%
American Express 3%
US$159bn
US$1,840bn
US$155bn
US$49bnUS$124bn
US$35bn
2018* 2022**
POS and eCom PROJECTED GROWTH
US$204bn
US$1,733bn
eCom turnover
DesktopMobile
POS
61
* Estimated **Forecasted
Numbers adjusted for rounding may impact totals.

When it comes to commerce online, bank transfer tops consumer preference, outpacing both credit and debit cards. In the last year, however, credit cards have lost some preferential luster, while debit cards and cash on delivery are gaining ground. While cash continues to lead for point of sale purchase, there’s an uptick in consumers handing over credit cards to pay.
MALAYSIA
FAST STATS2017 eCom SPEND
PER CAPITA
US $110
2017 % eCom SPEND USING
MOBILE WALLET
7%
2018* - 2022** eCom CAGR
21%
2017 POS SPEND PER CAPITA
US $4,493
2017 % POS SPEND USING
MOBILE WALLET
1%
2018* - 2022** POS CAGR
6%
2018* INTERNET PENETRATION
87%62

POPULAR ALTERNATIVE PAYMENT METHODS
2017 CARD PRESENT MIX BY PAYMENT METHOD
Cash
Credit Card
Debit Card
Charge Card
Pre-paid Card
eWallet
70%21%
5%2%
2%1%
2017 CARD NOT PRESENT MIX BY PAYMENT METHOD
Bank Transfer
Credit Card
Debit Card
Cash on Delivery
eWallet
Charge & Deferred Debit Card
PrePay
Pre-paid Card
45%20%
11%9%
7%6%
1%
1%
TOP TIPMalaysian shoppers are concerned about fraud while shopping online. Offering a secure online experience with trusted local payment methods will help convince local customers. With credit card growth at the point of sale, ensure you can accept the most popular cards.
2017 CARD BRAND BREAKDOWNS (eCom and POS)
Visa 49%
Mastercard 32%
Bankcard 17%
American Express 2%
US$5bn
US$144bn
2018* 2022**
POS and eCom PROJECTED GROWTH
US$11bn
US$179bn
US$4bn
US$2bn
US$6bn
US$3bn
eCom turnover
DesktopMobile
POS
63
* Estimated **Forecasted
Numbers adjusted for rounding may impact totals.

Cash has a firm grip on Mexican consumers at the point of sale, leaving huge growth potential for other payment methods. The eWallet as the preferred method of payment online is rising with the growth of eCommerce, but still has some ground to fully catch up with credit and debit card preferences.
MEXICO
FAST STATS2017 eCom SPEND
PER CAPITA
US $125
2017 % eCom SPEND USING
MOBILE WALLET
14%
2018* - 2022** eCom CAGR
13%
2017 POS SPEND PER CAPITA
US $3,283
2017 % POS SPEND USING
MOBILE WALLET
3%
2018* - 2022** POS CAGR
4%
2018* INTERNET PENETRATION
72%64

POPULAR ALTERNATIVE PAYMENT METHODS
2017 CARD PRESENT MIX BY PAYMENT METHOD
Cash
Debit Card
Credit Card
eWallet
Pre-paid Card
Charge Card
76%10%8%
3%
2%
1%
2017 CARD NOT PRESENT MIX BY PAYMENT METHOD
Credit Card
Debit Card
Charge & Deferred Debit Card
eWallet
Bank Transfer
Cash on Delivery
Pre-paid Card
PrePay
30%24%
15%
14%
7%
6%
3%
1%
TOP TIPThough still in its early stages, eWallets are starting to take off in Mexico. Explore accepting popular eWallets, such as MercadoPago and PayPal, which are trusted and viewed as secure locally. Consider point of sale security measures when cards are preferred.
2017 CARD BRAND BREAKDOWNS (eCom and POS)
Visa 60%
Mastercard 33%
American Express 5%
Carnet 2%
US$18bn
US$430bn
US$12bn
US$16bn
US$10bn
US$8bn
2018* 2022**
POS and eCom PROJECTED GROWTH
US$28bn
US$504bn
eCom turnover
DesktopMobile
POS
65
* Estimated **Forecasted
Numbers adjusted for rounding may impact totals.

The Dutch lean heavily on forms of cash over credit for purchases, online and off. While there’s been an increase in credit card use in the last year for online purchases, bank transfer continues to be the dominant payment choice in eCommerce, with eWallets also gaining traction. Debit and cash make up the majority of point of sale purchases perhaps due to a strong aversion to carrying debt.
NETHERLANDS
FAST STATS2017 eCom SPEND
PER CAPITA
US $1,578
2017 % eCom SPEND USING
MOBILE WALLET
10%
2018* - 2022** eCom CAGR
14%
2017 POS SPEND PER CAPITA
US $11,989
2017 % POS SPEND USING
MOBILE WALLET
3%
2018* - 2022** POS CAGR
1%
2018* INTERNET PENETRATION
90%66

POPULAR ALTERNATIVE PAYMENT METHODS
2017 CARD PRESENT MIX BY PAYMENT METHOD
Debit Card
Cash
Credit Card
Charge Card
eWallet
67%20%
5%4%
3%
2017 CARD NOT PRESENT MIX BY PAYMENT METHOD
Bank Transfer
Credit Card
eWallet
eInvoices
Cash on Delivery
Debit Card
Charge & Deferred Debit Card
59%14%
10%6%
6%
3%2%
TOP TIPiDEAL continues to lead payment preferences in the Netherlands. However, eWallet use, such as Payconiq, is gaining some traction in this convenience-driven market. Consider expanding your payment method offerings to include eWallets for both online and point of sale purchases.
2017 CARD BRAND BREAKDOWNS (eCom and POS)
Mastercard 95%
Visa 4%
US$31bn
US$206bn
US$33bn
US$20bnUS$23bn
US$8bn2018* 2022**
POS and eCom PROJECTED GROWTH
US$53bn
US$215bn
eCom turnover
DesktopMobile
POS
67
* Estimated **Forecasted
Numbers adjusted for rounding may impact totals.

Cards are by far the most popular payment method, online and at point of sale, for New Zealanders. Consumers continue to reach for credit cards first when it comes to purchasing online. However, eWallets, bank transfer, and debit cards compete equally for share. Consumers here rely very little on cash at the physical point of sale making way for this market to solidify digital payments as the norm.
NEW ZEALAND
FAST STATS2017 eCom SPEND
PER CAPITA
US $855
2017 % eCom SPEND USING
MOBILE WALLET
19%
2018* - 2022** eCom CAGR
8%
2017 POS SPEND PER CAPITA
US $12,793
2017 % POS SPEND USING
MOBILE WALLET
2%
2018* - 2022** POS CAGR
5%
2018* INTERNET PENETRATION
92%68

POPULAR ALTERNATIVE PAYMENT METHODS
2017 CARD PRESENT MIX BY PAYMENT METHOD
Debit Card
Credit Card
Cash
Charge Card
eWallet
47%39%
8%4%
2%
2017 CARD NOT PRESENT MIX BY PAYMENT METHOD
Credit Card
eWallet
Bank Transfer
Debit Card
Cash on Delivery
Charge & Deferred Debit Card
Pre-paid Card
36%19%19%
18%
4%3%
1%
TOP TIPWith eWallets, bank transfers, and debit cards gaining ground online in New Zealand, consider adding top payment methods such as PayPal and Visa Checkout to match local consumer preferences. The majority of purchases are made with debit or credit cards so offering all card brands for point of sale purchases is essential.
2017 CARD BRAND BREAKDOWNS (eCom and POS)
EFTPOS 51%
Visa 32%
Mastercard 13%
American Express 3%
Others 2%
US$4bn
US$62bn
US$3bnUS$3bn
US$3bn
US$2bn
2018* 2022**
POS and eCom PROJECTED GROWTH
US$6bn
US$76bn
eCom turnover
DesktopMobile
POS
69
* Estimated **Forecasted
Numbers adjusted for rounding may impact totals.

Cash forms of payment are most preferred over cards both online and off in this African market. Bank transfer and cash on delivery make up nearly half of payments in eCommerce. While credit cards are not generally part of the spend culture, debit cards do get some use, online and off. Digital payments are still in growth mode as smartphone adoption and internet penetration continue to increase.
NIGERIA
FAST STATS2017 eCom SPEND
PER CAPITA
US $5
2017 % eCom SPEND USING
MOBILE WALLET
10%
2018* - 2022** eCom CAGR
27%
2017 POS SPEND PER CAPITA
US $964
2017 % POS SPEND USING
MOBILE WALLET
1%
2018* - 2022** POS CAGR
5%
2018* INTERNET PENETRATION
25%70

POPULAR ALTERNATIVE PAYMENT METHODS
2017 CARD PRESENT MIX BY PAYMENT METHOD
Cash
Debit Card
eWallet
97%2%1%
2017 CARD NOT PRESENT MIX BY PAYMENT METHOD
Bank Transfer
Cash on Delivery
Debit Card
eWallet
Pre-paid Card
PrePay
Credit Card
Charge & Deferred Debit Card
25%24%
16%10%
8%
7%
7%3%
TOP TIPCash on delivery is by far the preferred eCommerce payment method in Nigeria. Work to secure a cash on delivery partner to serve local demand. Cash is still heavily relied on at the point of sale. As digital payment popularity increases, watch for trends and payment methods that consumers adopt to give your business an edge.
2017 CARD BRAND BREAKDOWNS (eCom and POS)
Verve 58%
Visa 23%
Mastercard 19%
US$1bn
US$184bn
US$1bn
US$2bn
US$1bnUS$1bn
2018* 2022**
POS and eCom PROJECTED GROWTH
US$3bn
US$227bn
eCom turnover
DesktopMobile
POS
71
* Estimated **Forecasted
Numbers adjusted for rounding may impact totals.

Credit cards and bank transfer are the payment methods of choice online for Norwegians. eInvoices have gained in popularity online with their share of purchase now on par with eWallets. Non-cash payments command both point of sale and online experiences, pushing Norway closer to becoming a cashless society. eWallets for point of sale purchases are now equal to those made with cash.
NORWAY
FAST STATS2017 eCom SPEND
PER CAPITA
US $2,347
2017 % eCom SPEND USING
MOBILE WALLET
12%
2018* - 2022** eCom CAGR
12%
2017 POS SPEND PER CAPITA
US $20,844
2017 % POS SPEND USING
MOBILE WALLET
4%
2018* - 2022** POS CAGR
3%
2018* INTERNET PENETRATION
99%72

POPULAR ALTERNATIVE PAYMENT METHODS
2017 CARD PRESENT MIX BY PAYMENT METHOD
Debit Card
Credit Card
Cash
eWallet
Charge Card
73%16%
4%4%
2%
2017 CARD NOT PRESENT MIX BY PAYMENT METHOD
Credit Card
Bank Transfer
eWallet
eInvoices
Charge & Deferred Debit Card
Debit Card
Other
Cash on Delivery
28%21%
12%12%
10%
9%
5%
4%
TOP TIPConsumer payment preferences vary in Norway, reflecting Norwegians hunger for convenience. Accepting local methods and card brands is essential to a high online conversion rate. Debit cards are heavily used at the point of sale with eWallets gaining in popularity.
2017 CARD BRAND BREAKDOWNS (eCom and POS)
BankAxept 73%
Mastercard 13%
Visa 11%
American Express 1%
Others 1%
Diners Club 1%
US$15bn
US$111bn
US$13bn
US$10bnUS$9bnUS$5bn2018* 2022**
POS and eCom PROJECTED GROWTH
US$23bn
US$124bn
eCom turnover
DesktopMobile
POS
73
* Estimated **Forecasted
Numbers adjusted for rounding may impact totals.

Online payment preferences haven’t changed in the last year with cash on delivery topping the list. eCommerce continues to grow rapidly, despite a shipping infrastructure that’s still developing. Cash retains control over point of sale payments with no other payment preferences competing for market share.
PHILIPPINES
FAST STATS2017 eCom SPEND
PER CAPITA
US $25
2017 % eCom SPEND USING
MOBILE WALLET
15%
2018* - 2022** eCom CAGR
19%
2017 POS SPEND PER CAPITA
US $2,131
2017 % POS SPEND USING
MOBILE WALLET
1%
2018* - 2022** POS CAGR
4%
2018* INTERNET PENETRATION
72%74

POPULAR ALTERNATIVE PAYMENT METHODS
2017 CARD PRESENT MIX BY PAYMENT METHOD
Cash
Pre-paid Card
Credit Card
Debit Card
eWallet
78%8%8%
5%
1%
2017 CARD NOT PRESENT MIX BY PAYMENT METHOD
Cash on Delivery
Credit Card
Bank Transfer
eWallet
Debit Card
Charge & Deferred Debit Card
Pre-paid Card
PostPay
Other
PrePay
27%16%
15%15%
11%
7%
6%
1%
1%
1%
TOP TIPConsumers in the Philippines express a strong preference for cash on delivery for online purchases. Provide this option to capture customers who don’t use cards. Accept a variety of card brands at the point of sale for instances where card payments are preferred.
2017 CARD BRAND BREAKDOWNS (eCom and POS)
BancNet 36%
Mastercard 33%
Visa 24%
MegaLink 3%
Expressnet 2%
American Express 1%
JCB 1%
US$3bn
US$227bn
US$2bn
US$4bn
US$2bnUS$2bn
2018* 2022**
POS and eCom PROJECTED GROWTH
US$6bn
US$265bn
eCom turnover
DesktopMobile
POS
75
* Estimated **Forecasted
Numbers adjusted for rounding may impact totals.

Polish consumers still strongly favor using bank transfer for online purchases. eWallet use has grown slightly over the last year, pushing debit cards down to the third most popular eCommerce payment method. While cash leads at the point of sale, digital payments via debit card command a fair amount of use among consumers. Many businesses are activating contactless card acceptance at the point of sale, setting Poland up for greater shifts to digital payments in the future.
POLAND
FAST STATS2017 eCom SPEND
PER CAPITA
US $303
2017 % eCom SPEND USING
MOBILE WALLET
17%
2018* - 2022** eCom CAGR
7%
2017 POS SPEND PER CAPITA
US $6,238
2017 % POS SPEND USING
MOBILE WALLET
1%
2018* - 2022** POS CAGR
5%
2018* INTERNET PENETRATION
78%76

POPULAR ALTERNATIVE PAYMENT METHODS
2017 CARD PRESENT MIX BY PAYMENT METHOD
Cash
Debit Card
Credit Card
eWallet
64%29%
5%1%
2017 CARD NOT PRESENT MIX BY PAYMENT METHOD
Bank Transfer
eWallet
Debit Card
Cash on Delivery
Credit Card
Charge & Deferred Debit Card
eInvoices
41%17%
16%12%
7%
6%
1%
TOP TIPThough bank transfers, including PayU and Przelewy24, still lead online in Poland, keep an eye on eWallets that are gaining traction. Consider adding the most popular eWallets to keep pace with local customers’ online payment preferences. Activate contactless card technology at the point of sale to keep up with emerging trends in digital payments.
2017 CARD BRAND BREAKDOWNS (eCom and POS)
Visa 56%
Mastercard 44%
US$13bn
US$237bn
US$11bn
US$5bnUS$10bn
US$2bn
2018* 2022**
POS and eCom PROJECTED GROWTH
US$17bn
US$284bn
eCom turnover
DesktopMobile
POS
77
* Estimated **Forecasted
Numbers adjusted for rounding may impact totals.

Online credit card use has doubled since last year pushing this payment method into the top three for eCommerce purchases, replacing cash on delivery. Although still preferred, debit card use is down while eWallet use has increased. This suggests that some consumers have moved debit cards into their eWallets for increased simplicity when shopping online. Russian consumers rely on funds available in their bank accounts with cash and debit cards almost exclusively preferred for point of sale purchases. In fact, eWallets and credit cards get minimal use at the point of sale.
RUSSIA
FAST STATS2017 eCom SPEND
PER CAPITA
US $231
2017 % eCom SPEND USING
MOBILE WALLET
24%
2018* - 2022** eCom CAGR
9%
2017 POS SPEND PER CAPITA
US $8,612
2017 % POS SPEND USING
MOBILE WALLET
2%
2018* - 2022** POS CAGR
4%
2018* INTERNET PENETRATION
86%78

POPULAR ALTERNATIVE PAYMENT METHODS
2017 CARD PRESENT MIX BY PAYMENT METHOD
Cash
Debit Card
eWallet
Credit Card
60%35%
2%2%
2017 CARD NOT PRESENT MIX BY PAYMENT METHOD
Debit Card
eWallet
Credit Card
Cash on Delivery
Bank Transfer
Charge & Deferred Debit Card
Pre-paid Card
36%24%
15%9%
7%
7%
2%
TOP TIPLocal eWallets in Russia have a large enough share that now is the time to implement eWallet acceptance. eWallets like Yandex.Money, WebMoney, and Qiwi offer a simple way to checkout. The size and growth of mCommerce indicates consumers are ready for this payment method. eWallets also provide convenience at the point of sale including quicker checkout and stronger security.
2017 CARD BRAND BREAKDOWNS (eCom and POS)
Visa 45%
Mastercard 37%
MIR 11%
Golden Crown 3%
Others 3%
US$38bn
US$1,247bn
US$34bn
US$20bnUS$27bn
US$11bn
2018* 2022**
POS and eCom PROJECTED GROWTH
US$54bn
US$1,465bn
eCom turnover
DesktopMobile
POS
79
* Estimated **Forecasted
Numbers adjusted for rounding may impact totals.

Cards continue as the most preferred way to pay online and off. There’s been no change in online checkout preferences in the last year with credit cards leading the way and eWallets contending for second place. While cash is the top payment preference at the point of sale, cards are preferred by more consumers with credit and debit card purchases making up 53% of point of sale purchases. Despite the country’s tech-savvy culture and high smartphone adoption rate, eWallets haven’t changed payment habits yet, although they do contend with bank transfer for second-place share online.
SINGAPORE
FAST STATS2017 eCom SPEND
PER CAPITA
US $889
2017 % eCom SPEND USING
MOBILE WALLET
10%
2018* - 2022** eCom CAGR
7%
2017 POS SPEND PER CAPITA
US $21,481
2017 % POS SPEND USING
MOBILE WALLET
4%
2018* - 2022** POS CAGR
5%
2018* INTERNET PENETRATION
85%80

POPULAR ALTERNATIVE PAYMENT METHODS
2017 CARD PRESENT MIX BY PAYMENT METHOD
Cash
Credit Card
Debit Card
eWallet
Pre-paid Card
Charge Card
40%30%
23%4%
2%
2%
2017 CARD NOT PRESENT MIX BY PAYMENT METHOD
Credit Card
eWallet
Bank Transfer
Cash on Delivery
Charge & Deferred Debit Card
Debit Card
67%10%10%
5%
4%
4%
TOP TIPIn addition to local and global card brands, look at popular eWallets like Apple Pay and PayPal that are slowly gaining trust and acceptance. eWallets provide convenience online and at the point of sale by facilitating quick checkout. The use of biometrics at the point of sale also adds a layer of security protecting your business from potential fraud.
2017 CARD BRAND BREAKDOWNS (eCom and POS)
NETS 37%
Visa 32%
Mastercard 24%
American Express 5%
Diners Club 1%
US$6bn
US$122bn
US$3bnUS$3bn
2018* 2022**
POS and eCom PROJECTED GROWTH
US$7bn
US$149bn
US$4bnUS$3bn
eCom turnover
DesktopMobile
POS
81
* Estimated **Forecasted
Numbers adjusted for rounding may impact totals.

South African consumers rely on relatively traditional payment methods for purchases, online and at point of sale—through a mixture of cash, debit, credit, and bank transfer. Credit cards and bank transfer continue to drive the eCommerce market. While consumers put their trust in cash at the physical store counter, cards are also used a fair amount. Smartphone adoption is high in South Africa and eWallet use at the point of sale has gained some traction as contactless technology becomes more widespread.
SOUTH AFRICA
FAST STATS2017 eCom SPEND
PER CAPITA
US $38
2017 % eCom SPEND USING
MOBILE WALLET
17%
2018* - 2022** eCom CAGR
10%
2017 POS SPEND PER CAPITA
US $3,698
2017 % POS SPEND USING
MOBILE WALLET
5%
2018* - 2022** POS CAGR
3%
2018* INTERNET PENETRATION
65%82

POPULAR ALTERNATIVE PAYMENT METHODS
2017 CARD PRESENT MIX BY PAYMENT METHOD
Cash
Debit Card
Credit Card
eWallet
Charge Card
57%23%
15%5%
1%
2017 CARD NOT PRESENT MIX BY PAYMENT METHOD
Credit Card
Bank Transfer
eWallet
Debit Card
Cash on Delivery
Charge & Deferred Debit Card
PrePay
Pre-paid Card
25%20%
17%16%
12%
5%
3%
2%
TOP TIPTo make South African consumers feel secure when shopping online, offer trusted payment methods in a secure payment experience. Educate staff and consumers about the security used for eWallets at the point of sale, including biometrics.
2017 CARD BRAND BREAKDOWNS (eCom and POS)
Visa 50%
Mastercard 48%
American Express 1%
US$213bn
2018* 2022**
POS and eCom PROJECTED GROWTH
US$238bn
US$2bn
US$4bn
US$1bnUS$1bn
US$2bnUS$1bn
eCom turnover
DesktopMobile
POS
83
* Estimated **Forecasted
Numbers adjusted for rounding may impact totals.

South Korea remains one of the largest eCommerce markets in Asia and payment by credit card is still the most preferred method online. Bank transfer payments have risen in the last year, now on par with eWallets. It’s cards, and not cash, that are king in the Korean store. While smartphone adoption is high, consumers are still wary of contactless payments for point of sale shopping.
SOUTH KOREA
FAST STATS2017 eCom SPEND
PER CAPITA
US $876
2017 % eCom SPEND USING
MOBILE WALLET
10%
2018* - 2022** eCom CAGR
11%
2017 POS SPEND PER CAPITA
US $14,197
2017 % POS SPEND USING
MOBILE WALLET
3%
2018* - 2022** POS CAGR
6%
2018* INTERNET PENETRATION
97%84

POPULAR ALTERNATIVE PAYMENT METHODS
2017 CARD PRESENT MIX BY PAYMENT METHOD
Credit Card
Debit Card
Cash
eWallet
64%21%
11%3%
2017 CARD NOT PRESENT MIX BY PAYMENT METHOD
Credit Card
Bank Transfer
eWallet
Debit Card
Cash on Delivery
Other
65%10%10%7%
6%
2%
TOP TIPTap into the potential of South Korean consumers by offering local card brands and payment methods. Consider adding bank transfers as an eCommerce payment option given their popularity among South Korean consumers. Explore popular eWallet options for point of sale acceptance.
2017 CARD BRAND BREAKDOWNS (eCom and POS)
Others 29%
Visa 21%
Mastercard 14%
Shinhan Financial Group 10%
BC Card 8%
KB Kookmin Card Co Ltd 7%
Samsung Card 6%
Hyundai Card 5%
US$45bn
US$734bn
US$19bnUS$17bn
2018* 2022**
POS and eCom PROJECTED GROWTH
US$68bn
US$915bn
US$49bn
US$29bn
eCom turnover
DesktopMobile
POS
85
* Estimated **Forecasted
Numbers adjusted for rounding may impact totals.

The eCommerce race is on as the top three payment methods of choice compete for primary market share among Spanish consumers. While eWallets compete for use online, they have some catching up to do when it comes to shopping at the point of sale. Spaniards continue to rely heavily on paying with cash in some form as debit, bank transfer, cash, and cash on delivery make up the majority of the payment market, online and off.
SPAIN
FAST STATS2017 eCom SPEND
PER CAPITA
US $761
2017 % eCom SPEND USING
MOBILE WALLET
19%
2018* - 2022** eCom CAGR
10%
2017 POS SPEND PER CAPITA
US $12,383
2017 % POS SPEND USING
MOBILE WALLET
3%
2018* - 2022** POS CAGR
2%
2018* INTERNET PENETRATION
87%86

POPULAR ALTERNATIVE PAYMENT METHODS
2017 CARD PRESENT MIX BY PAYMENT METHOD
Cash
Debit Card
Charge Card
Credit Card
eWallet
64%19%
10%4%
3%
2017 CARD NOT PRESENT MIX BY PAYMENT METHOD
Credit Card
Debit Card
eWallet
Charge & Deferred Debit Card
Bank Transfer
Cash on Delivery
Pre-paid Card
Other
20%20%19%
13%
13%
11%
3%
1%
TOP TIPWith most payment methods having some market share in Spain, online and off, you’d be well advised to offer a broad selection of payment methods to capture all potential customers. Along with seamless payment experiences, this should set you up for success.
2017 CARD BRAND BREAKDOWNS (eCom and POS)
Visa 68%
Mastercard 30%
American Express 2%
US$40bn
US$576bn
US$33bn
US$26bnUS$27bn
US$13bn2018* 2022**
POS and eCom PROJECTED GROWTH
US$58bn
US$630bn
eCom turnover
DesktopMobile
POS
87
* Estimated **Forecasted
Numbers adjusted for rounding may impact totals.

With high internet penetration, smartphone use, and a thriving eCommerce market, Sweden is a leader in the global race toward a cashless society. The Swedes’ enthusiasm for digital payment methods is apparent as debit cards, bank transfer, and eInvoices continue to dominate the online market, while cards at the point of sale also capture the largest market share. While not as popular, eWallets continue to capture the attention of some consumers, especially online.
FAST STATS2017 eCom SPEND
PER CAPITA
US $1,340
2017 % eCom SPEND USING
MOBILE WALLET
7%
2018* - 2022** eCom CAGR
9%
2017 POS SPEND PER CAPITA
US $16,814
2017 % POS SPEND USING
MOBILE WALLET
2%
2018* - 2022** POS CAGR
-1%
2018* INTERNET PENETRATION
88%
SWEDEN
88

POPULAR ALTERNATIVE PAYMENT METHODS
2017 CARD PRESENT MIX BY PAYMENT METHOD
Debit Card
Credit Card
Cash
Charge Card
eWallet
59%19%
17%3%
2%
2017 CARD NOT PRESENT MIX BY PAYMENT METHOD
Debit Card
Bank Transfer
eInvoices
Credit Card
Charge & Deferred Debit Card
eWallet
Other
30%21%
20%12%
9%
7%
2%
TOP TIPSweden’s financial technology sector is a global leader in the movement toward eInvoices. To make an impact in Sweden, offer preferred local payment methods such as Klarna, in addition to local eWallets.
2017 CARD BRAND BREAKDOWNS (eCom and POS)
Mastercard 64%
Visa 33%
American Express 2%
Diners Club 1%
US$15bn
US$171bn
US$13bn
US$8bnUS$10bn
US$5bn
2018* 2022**
POS and eCom PROJECTED GROWTH
US$21bn
US$168bn
eCom turnover
DesktopMobile
POS
89
* Estimated **Forecasted
Numbers adjusted for rounding may impact totals.

Compared to last year, credit cards are losing ground to other payment methods such as bank transfer, PostPay, and charge/deferred debit cards when it comes to Taiwanese payment preference in online payments. Credit cards remain the most preferred payment method online but still lag behind cash when it comes to shopping at the point of sale.
FAST STATS2017 eCom SPEND
PER CAPITA
US $1,126
2017 % eCom SPEND USING
MOBILE WALLET
14%
2018* - 2022** eCom CAGR
8%
2017 POS SPEND PER CAPITA
US $12,514
2017 % POS SPEND USING
MOBILE WALLET
3%
2018* - 2022** POS CAGR
10%
2018* INTERNET PENETRATION
88%
TAIWAN (CHINA)
90

POPULAR ALTERNATIVE PAYMENT METHODS
2017 CARD PRESENT MIX BY PAYMENT METHOD
Cash
Credit Card
Debit Card
eWallet
Pre-paid Card
54%32%
10%3%
1%
2017 CARD NOT PRESENT MIX BY PAYMENT METHOD
Credit Card
Bank Transfer
eWallet
PostPay
Cash on Delivery
Charge & Deferred Debit Card
Pre-paid Card
Debit Card
27%19%
14%13%
13%
8%
4%
2%
TOP TIPWith recent shifts in payment preferences, explore adding payment methods such as PostPay and other local options to keep up with your customers. Locals also value security so it would be wise to optimize secure online payment experiences. Accept a variety of card brands at the point of sale to satisfy card-carrying consumers.
2017 CARD BRAND BREAKDOWNS (eCom and POS)
Visa 41%
Smartpay 32%
Mastercard 19%
JCB 4%
Others 2%
American Express 1%
US$29bn
US$295bn
US$19bnUS$21bn
US$16bn
US$13bn
2018* 2022**
POS and eCom PROJECTED GROWTH
US$40bn
US$432bn
eCom turnover
DesktopMobile
POS
91
* Estimated **Forecasted
Numbers adjusted for rounding may impact totals.

Bank transfer rises to the top of eCommerce payment preferences in Southeast Asia’s second largest economy. However, online eWallet use is on par with cash on delivery. Point of sale shoppers still prefer cash, but don’t discount credit cards which also get a fair amount of use.
THAILAND
FAST STATS2017 eCom SPEND
PER CAPITA
US $358
2017 % eCom SPEND USING
MOBILE WALLET
20%
2018* - 2022** eCom CAGR
12%
2017 POS SPEND PER CAPITA
US $2,608
2017 % POS SPEND USING
MOBILE WALLET
2%
2018* - 2022** POS CAGR
2%
2018* INTERNET PENETRATION
63%92

POPULAR ALTERNATIVE PAYMENT METHODS
2017 CARD PRESENT MIX BY PAYMENT METHOD
Cash
Credit Card
Debit Card
Pre-paid Card
eWallet
68%23%
6%2%
2%
2017 CARD NOT PRESENT MIX BY PAYMENT METHOD
Bank Transfer
Cash on Delivery
eWallet
Credit Card
PostPay
Debit Card
Other
Pre-paid Card
28%20%20%
13%
8%
6%
3%
2%
TOP TIPThai consumers prefer cash on delivery and bank transfers for online purchasing so offer local payment options with a built-in user base to make the most of this large eCommerce market. Accept all card brands to capture point of sale shoppers.
2017 CARD BRAND BREAKDOWNS (eCom and POS)
Visa 72%
Mastercard 23%
Thai Payment Network 3%
American Express 1%
US$29bn
US$180bn
2018* 2022**
POS and eCom PROJECTED GROWTH
US$44bn
US$192bn
US$16bn
US$13bn
US$28bn
US$15bn
eCom turnover
DesktopMobile
POS
93
* Estimated **Forecasted
Numbers adjusted for rounding may impact totals.

It’s cash for point of sale and credit cards for eCommerce that are the preferences of Turkish consumers. However, bank transfers have displaced eWallets as the second most preferred form of payment online. As internet penetration continues to expand here, and with ongoing support behind a move to cashless payments, digital payments have strong growth opportunity across channels.
TURKEY
FAST STATS2017 eCom SPEND
PER CAPITA
US $141
2017 % eCom SPEND USING
MOBILE WALLET
4%
2018* - 2022** eCom CAGR
19%
2017 POS SPEND PER CAPITA
US $2,494
2017 % POS SPEND USING
MOBILE WALLET
2%
2018* - 2022** POS CAGR
2%
2018* INTERNET PENETRATION
66%94

POPULAR ALTERNATIVE PAYMENT METHODS
2017 CARD PRESENT MIX BY PAYMENT METHOD
Cash
Credit Card
Debit Card
eWallet
70%25%
4%2%
2017 CARD NOT PRESENT MIX BY PAYMENT METHOD
Credit Card
Bank Transfer
eWallet
Debit Card
Cash on Delivery
81%9%
4%3%
3%
TOP TIPConsumers here are concerned about fraud but are driven by convenience. That means developing a payment process, online and off, with the right balance between convenience and security is the key to serving Turkish consumers.
2017 CARD BRAND BREAKDOWNS (eCom and POS)
Visa 55%
Mastercard 43%
American Express 1%
Others 1%
US$15bn
US$205bn
US$18bn
US$12bnUS$11bn
US$4bn
2018* 2022**
POS and eCom PROJECTED GROWTH
US$30bn
US$226bn
eCom turnover
DesktopMobile
POS
95
* Estimated **Forecasted
Numbers adjusted for rounding may impact totals.

Cash remains king among United Arab Emirates consumers, where even cash on delivery is the second most preferred payment method online. Credit card fraud and security are a concern among consumers, but it hasn’t deterred consumers from using them online. And, in the universe of non-cash, non-card forms of payment, mobile wallets capture a higher than average share of point of sale spend, suggesting the potential growing trust in biometrics as a form of security.
UAE
FAST STATS2017 eCom SPEND
PER CAPITA
US $791
2017 % eCom SPEND USING
MOBILE WALLET
18%
2018* - 2022** eCom CAGR
10%
2017 POS SPEND PER CAPITA
US $25,697
2017 % POS SPEND USING
MOBILE WALLET
6%
2018* - 2022** POS CAGR
4%
2018* INTERNET PENETRATION
96%96

POPULAR ALTERNATIVE PAYMENT METHODS
2017 CARD PRESENT MIX BY PAYMENT METHOD
Cash
Credit Card
eWallet
Pre-paid Card
Debit Card
Charge Card
70%16%
6%6%
2%
1%
2017 CARD NOT PRESENT MIX BY PAYMENT METHOD
Credit Card
Cash on Delivery
eWallet
Bank Transfer
Debit Card
Charge & Deferred Debit Card
PrePay
Pre-paid Card
Other
26%19%
18%14%
10%
5%
4%
3%
1%
TOP TIPConsumers in the UAE are concerned about fraud and often find online shopping inconvenient. Building secure and seamless payment experiences as well as offering their top payment preferences like PayPal will help convert more sales online. eWallet use is gaining traction at the point of sale so implement the most popular options to meet consumer demand.
2017 CARD BRAND BREAKDOWNS (eCom and POS)
Visa 61%
Mastercard 36%
American Express 2%
Diners Club 1%
US$244bn
2018* 2022**
POS and eCom PROJECTED GROWTH US$291bn
US$9bn
US$13bn
US$4bnUS$4bn
US$8bn
US$4bn
eCom turnover
DesktopMobile
POS
97
* Estimated **Forecasted
Numbers adjusted for rounding may impact totals.

UK consumers stayed steady with their payment preferences at the point of sale and online with no fundamental change year-over-year. The commanding preference of cards among UK consumers, online and off, continues to show comfort that’s lacking among other global consumers. Cards and eWallets continue to rule as the primary payment methods.
UK
FAST STATS2017 eCom SPEND
PER CAPITA
US $3,063
2017 % eCom SPEND USING
MOBILE WALLET
23%
2018* - 2022** eCom CAGR
9%
2017 POS SPEND PER CAPITA
US $20,403
2017 % POS SPEND USING
MOBILE WALLET
5%
2018* - 2022** POS CAGR
5%
2018* INTERNET PENETRATION
99%98

POPULAR ALTERNATIVE PAYMENT METHODS
2017 CARD PRESENT MIX BY PAYMENT METHOD
Debit Card
Cash
Credit Card
eWallet
Charge Card
Pre-paid Card
55%22%
15%5%
2%
1%
2017 CARD NOT PRESENT MIX BY PAYMENT METHOD
Debit Card
eWallet
Credit Card
Bank Transfer
Cash on Delivery
Charge & Deferred Debit Card
PrePay
Pre-paid Card
eInvoices
32%23%
18%9%
7%
6%
2%
2%
1%
TOP TIPUK customers have come to trust eCommerce payments. Simplifying your online payment experience and making it as quick as possible will best serve this convenience-focused market. Consider implementing popular eWallet options at the point of sale like PayPal and Visa Checkout.
2017 CARD BRAND BREAKDOWNS (eCom and POS)
Visa 85%
Mastercard 14%
American Express 1%
US$225bn
US$1,357bn
US$199bn
US$115bnUS$161bn
US$64bn
2018* 2022**
POS and eCom PROJECTED GROWTH
US$314bn
US$1,649bn
eCom turnover
DesktopMobile
POS
99
* Estimated **Forecasted
Numbers adjusted for rounding may impact totals.

While payment options are plentiful in the US, American consumers are firmly rooted in their preference of paying by credit card. Credit and debit cards continue to dominate the market as preferred payment types with eWallets competing for share of online purchase. Established alternative payment methods continue to command share, while other options such as bank transfer, cash on delivery, and pre-pay show little growth over last year.
US
FAST STATS2017 eCom SPEND
PER CAPITA
US $2,271
2017 % eCom SPEND USING
MOBILE WALLET
20%
2018* - 2022** eCom CAGR
9%
2017 POS SPEND PER CAPITA
US $24,248
2017 % POS SPEND USING
MOBILE WALLET
3%
2018* - 2022** POS CAGR
7%
2018* INTERNET PENETRATION
79%100

POPULAR ALTERNATIVE PAYMENT METHODS
2017 CARD PRESENT MIX BY PAYMENT METHOD
Credit Card
Debit Card
Cash
Charge Card
eWallet
Pre-paid Card
40%35%
16%4%
3%
2%
2017 CARD NOT PRESENT MIX BY PAYMENT METHOD
Credit Card
Debit Card
eWallet
Charge & Deferred Debit Card
Bank Transfer
Cash on Delivery
Pre-paid Card
PrePay
Other
32%20%20%
13%
6%
4%
3%
1%
1%
TOP TIPIf you’ve yet to implement chip card technology at the point of sale, now’s the time. Chip cards help protect your business and your customers from potential fraud. Chip card infrastructure generally aligns with enabling NFC to take advantage of growing interest in mobile eWallets.
2017 CARD BRAND BREAKDOWNS (eCom and POS)
Visa 57%
Mastercard 23%
American Express 9%
Others 5%
Star 2%
Diners Club 1%
Pulse 1%
Discover 1%
US$7,956bn
US$791bn
US$360bn
US$617bn
US$207bn
2018* 2022**
POS and eCom PROJECTED GROWTH US$10,329bn
US$824bn
US$1,151bn
eCom turnover
DesktopMobile
POS
101
* Estimated **Forecasted
Numbers adjusted for rounding may impact totals.

VIETNAM
FAST STATS2017 eCom SPEND
PER CAPITA
US $65
2017 % eCom SPEND USING
MOBILE WALLET
17%
2018* - 2022** eCom CAGR
20%
2017 POS SPEND PER CAPITA
US $1,391
2017 % POS SPEND USING
MOBILE WALLET
2%
2018* - 2022** POS CAGR
3%
2018* INTERNET PENETRATION
52%102
Vietnamese consumer preference remains steeped in cash payments. Cash on delivery and bank transfer still lead for card not present payments. However, the preference for eWallets online is up, nudging out credit cards for third place among preferred payment methods. Preference for cash usage at the physical point of sale dominates while eWallets have reached near parity with credit cards at point of sale.

POPULAR ALTERNATIVE PAYMENT METHODS
2017 CARD PRESENT MIX BY PAYMENT METHOD
Cash
Debit Card
Credit Card
eWallet
86%9%
3%2%
2017 CARD NOT PRESENT MIX BY PAYMENT METHOD
Cash on Delivery
Bank Transfer
eWallet
Credit Card
Charge & Deferred Debit Card
Debit Card
PrePay
Pre-paid Card
24%22%
17%15%
12%
6%
3%
1%
TOP TIPVietnam leans towards non-traditional eCommerce payment methods so offer all local options including cash on delivery, bank transfers, and eWallets. Providing a full selection including accepting cards at the point of sale will support your goals in this diverse payment market.
2017 CARD BRAND BREAKDOWNS (eCom and POS)
Visa 53%
Mastercard 41%
Others 4%
American Express 3%
US$135bn
2018* 2022**
POS and eCom PROJECTED GROWTH US$153bn
US$7bn
US$16bn
US$6bn
US$4bn
US$10bn
US$4bn
eCom turnover
DesktopMobile
POS
103
* Estimated **Forecasted
Numbers adjusted for rounding may impact totals.

2018 Global Payments Report – Methodology
104

The Global Payments Report offers a snapshot of the current payment landscape: globally, by region, and in 36 select countries. The report includes projected scenarios and trends over the next five years. In addition we offer a series of essays with Worldpay’s perspectives on key issues in the payments world.
The report draws upon Worldpay’s decades of experience in providing payment solutions. The nature and scope of that experience broadened greatly in January 2018 when payment leaders Worldpay and Vantiv combined forces to form Worldpay, Inc. Worldpay’s expanded resources provide a view of global spend informed by our processing of more than 40 billion transactions annually via more than 300 payment types, across 146 countries and over 126 currencies. This report also benefits from the strength of our growing team of payments experts and market intelligence analysts based in the US, the UK, and around the globe.
The online and offline payment worlds continue to converge. Serving the channel-agnostic needs of merchants and consumers starts with a holistic understanding of payments. Accordingly, this report has evolved in 2018 to include analysis of payment methods used at the physical point of sale (POS). Previous Global Payments Reports focused exclusively on eCommerce payment methods. This expanded report offers a broader and more complete view of today’s global payment landscape.
This report asserts Worldpay’s own view of the market, based on internal expertise, our own research, and third-party vendor data. Worldpay’s Market Intelligence team compiles the Global Payments Report using a mixture of third party vendors and other publicly available data. This data is analyzed using Worldpay’s proprietary data model and categorization scheme, with support from McKinsey, the leading management consultancy. The resulting data is rigorously tested and validated by experts from McKinsey as well as Worldpay’s product and regional commercial teams. eCommerce market size and growth data were sourced from GlobalData’s E-Commerce Analytics database. GlobalData collected
this information using consumer surveys, B2B surveys, and desk research. Point of sale market size data was sourced from GlobalData and McKinsey. Projected POS growth figures were sourced from McKinsey’s Global Payments Map database. McKinsey has been continuously maintaining its payments database from more than 200 sources globally, including public sources, consumer surveys, and local research team inputs. All market size data relate to the industry as a whole, not Worldpay’s business.
Payment methods breakdown and forecast by country and region is calculated using a data model developed by Worldpay. Worldpay’s model includes eCommerce and point of sale data from GlobalData’s 2018 Consumer Payments Insights survey of 45,000 consumers in 31 countries, as well as data from McKinsey, historical trends of individual payments methods, and macroeconomic variables including GDP and nominal household consumption. Additional secondary sources for this report include eMarketer, Euromonitor, Statista, and yStats; data from local card banking and payments associations; card scheme and payment providers; eCommerce industry reports and studies; news articles; and international organizations including the World Bank and International Monetary Fund. Card scheme figures were sourced from Euromonitor and GlobalData with further analysis from Worldpay and are representative of all payments including eCommerce and point of sale.
Any indicative predictions based on the data we have used should be treated as such. All projections are subject to changes in world events, market dynamics and other forces over the period concerned (to 2022).

106
Payment Terms

Alternative Payment methods Methods of payment that are not linked to the global card brand networks such as Visa, Mastercard, or American Express.
Internet penetrationInternet users are individuals who have used the internet (from any location) in the last three months. The internet can be used via a computer, mobile phone, personal digital assistant, games machine, digital TV, etc.
Point of sale (POS)All transactions where the card is present.
In-storeOften used interchangeably with “point of sale”. All transactions that occur at the physical point of sale. Bank TransfersConsumers pay for goods using their online banking facility. They are either redirected to their bank or select their bank from a provider’s page. Examples: iDEAL, SOFORT banking, eNETS, Przelewy24, SafetyPay
Cash on DeliveryA transaction in which a payment for goods is made at the time of delivery. Examples: Merchant and bespoke delivery company services
eInvoicesWhen using eInvoices, consumers can pay for goods after delivery, without sharing credit card or bank details.Examples: Klarna, AfterPay
eWalletsAn electronic card used for transactions made online through a computer or a smartphone, like a credit card or debit card. When used with a smartphone, consumers store the credentials of their preferred card for payments and use biometrics to authorize the transaction. Examples: Alipay, Tenpay, PayPal, Qiwi, Yandex.Money
PrePayAllows consumers to fund a card and make purchases without a credit card or bank account.Examples: paysafecard, Neosurf
PostPayWhen a consumer selects a product online, they pay for it later at an affiliated outlet or store. Examples: Konbini, Boleto Bancario
Pre-Paid CardsThese are cards that run on scheme networks such as Visa and Mastercard. These cards can be used to make purchases or withdraw cash in the same way as a debit or credit card. Examples: Virgin Money
Debit CardsDebit cards are backed by major card brands and draw funds directly from a consumer’s bank account.
Charge & Deferred Debit CardsA pay-later card that charges no interest but requires the cardholder to pay the outstanding balance in full upon receipt of the statement, typically on a monthly basis. This includes deferred debit cards.Examples: American Express
Credit CardsCredit cards are backed by major card brands and allow consumers to make purchases on credit.
OthersThese include mobile carrier billing, crypto-currencies and other emerging technologies.Examples: Bitcoin, Zong, BOKU
107

worldpay.com
© 2018 Worldpay, LLC and/or its affiliates. All rights reserved. Worldpay, the logo and any associated brand names are trademarks or registered trademarks of Worldpay, LLC and/or its affiliates in the US, UK or other countries. All other trademarks are the property of their respective owners.
This content is for information purposes only. We have taken care in the preparation of this information but will not be responsible for any loss or damage including loss of profits, indirect, special or consequential loss arising as a result of any information in this document or reliance on it. The content of this material may not be reproduced without prior consent of Worldpay. This material may include information on third parties and their services. The reference to these third parties is for information purposes only and does not constitute an endorsement or recommendation of the third party or their service.
About Worldpay
Worldpay, Inc. (NYSE: WP; LSE: WPY) is a leading payments technology company with unique capability to power global integrated omni-commerce. With industry-leading scale and an unmatched integrated technology platform, Worldpay offers clients a comprehensive suite of products and services globally, delivered through a single provider.
Worldpay processes over 40 billion transactions annually through more than 300 payment types across 146 countries and 126 currencies. The company’s growth strategy includes expanding into high-growth markets, verticals and customer segments, including global eCommerce, Integrated Payments and B2B.
Worldpay, Inc. was formed in 2018 through the combination of the No. 1 merchant acquirers in the U.S. and the U.K. Worldpay, Inc. trades on the New York Stock Exchange as “WP” and the London Stock Exchange as “WPY.”
For further inquiries, please contact [email protected]
Acknowledgements
The 2018 Global Payments Report was a collaborative effort among Worldpay team members coming together from throughout the globe. We’d like to acknowledge our colleagues who lead the way and made it happen.
• Corporate Marketing: Leah Asdell, Sharon Brant, Marco Chardi, Javier Nieto, Kimberly Reese, David Rhodes, Alex Smith, John Stevens, Phillip Zerbo, and Jessie Zhang
• Corporate Communications: Andrew Ciafardini, Adam Kiefaber, Emily Lahey, Riley MacDonald, Jarod Warwick, and Ian Wissman
• Product: Sakshi Anand, Bill Cohn, MP Brennan, Christopher Chapman, Anita Digbandjoa, Dan Fagan, Olann Kerrison, Ray Moorman, Stuart Moss, Sophie Tre-Vett, Wayne Viegas, and Stuart Wilson
• Go-to-Market: Shelly Belvill, Kathryn Brownstone, Liz Crider, Claudia Crangasu, Chandni Dighe, Sarah Gieringer, Paul Heaton, Carolina Libardi, Neeharika Nagisetty, Kristin Reischel, Beth Starkey, Sandra Taylor, Joyce Tiang, and Kristine Woods
• Sales Enablement: Maria Prados and Eric Queathem
• Digital Marketing: Chad Bontrager, Gareth Goodridge, Sarah Greig, Katie Johnson, Matt Milner, Simon Truscott, and Lindsay Lakin
• Sales: Motie Bring, Casey Bullock, Juan D’Antiochia, Eelco Dettingmeijer, Mark Fleming, Linus Goh, Erik Lu, Lee Merryweather, Emily Moore, Alison Morris, Phil Pomford, Esteban Sarubbi, Philip Shi, Sameer Talwar, Josette van de Bult, Lucio Vargas, and Lutfillo Yuldoshev
• Legal: Timothy Fink and Emma Metcalfe-Eichhorn
• Investor Relations: Nathan Rozof, Lucinda McGrath, and Hannah Watson
Special thanks are also extended to the external agencies that supported the report’s production: Golin, Gorilla Gorilla!, Prism Create, Revere, and Stereo