global pharmacy workforce and migration report
TRANSCRIPT


Global Pharmacy Workforce and Migration Report | 1

2 | International Pharmaceutical Federation (FIP)
Copyright © 2006 by International Pharmaceutical Federation (FIP)
All rights reserved. No part of this publication may be stored in anyretrieval system or transcribed by any form or means – electronic,mechanical, recording, or otherwise without acknowledgement andprior permission of FIP. FIP shall not be held liable for any damagesincurred resulting from the use of any data and information fromthis report.
This report is available electronically for download at: www.fip.org/hr
Written by: Xuan Hao Chan, Tana Wuliji; FIP Project Coordinators
Design by: Inês Figueiredo
Printed by: Visão Gráfica - Portugal

Global Pharmacy Workforce and Migration Report | 3
Acknowledgements ....................................................................... ........................................................................................................................5
Foreword ........................................................................................ ........................................................................................................................5
Introduction............................... ........................................................................................................................................................ ....................7
FIP Global Pharmacy and Workforce Study Methods.................................... ...................................................................................................9
Part 1: Workforce description ............................................................ ...........................................................................................................111.1 Global overview: pharmacists density......................................... ...........................................................................................................111.2 Pharmacist gender distribution................................................... ...........................................................................................................111.3 Regional observations................... ........................................................................................................................................................ ..121.4 Workforce shortages and imbalances ................................. ..................................................................................................................14
Part 2: Continuing Professional Development and Continuing Education ........... ..........................................................................172.1 CPD and CE survey respondents................................................................................. ..........................................................................172.2 Mandatory CPD and CE....................................................... ..................................................................................................................182.3 Incentives ............................................................................. ..................................................................................................................182.4 Penalties........................................ ........................................................................................................................................................ ..192.5 CPD and CE learning portfolios.. ........................................................................................................................................................ ..19
Part 3: Migration of pharmacists ....... ........................................................................................................................................................ ..213.1 Extent of pharmacist migration... ........................................................................................................................................................ ..213.2 Australia ................................................................................................................................................. .................................................223.3 Canada........................................................................................................................... ..........................................................................233.4 Ghana..................................... ........................................................................................................................................................ .........243.5 Ireland.................................... ........................................................................................................................................................ .........243.6 Kenya ..................................... ........................................................................................................................................................ .........243.7 New Zealand.......................... ........................................................................................................................................................ .........243.8 United Kingdom............................................................................................................... ......................................................................253.9 Registration of foreign pharmacists .................................................................................................... .................................................26
Part 4: Pharmacy Technicians ............................................ ..........................................................................................................................27
Part 5: Actions and Directions .................................................................................................................... .................................................295.1 Workforce regulation and description................................................................................................. .................................................295.2 Workforce shortage ...................................................................................... ..........................................................................................305.3 Distribution imbalance ................................................................................ ..........................................................................................305.4 CPD and practice development ................................................................... ..........................................................................................30
Appendix............................ ........................................................................................................................................................ ..........................311 Global Pharmacy Workforce Survey.................................................... ..................................................................................................332 Continuing Professional Development (CPD) /Continuing Education (CE) Survey.........................................................................373 Migration Study Survey........................................................ ..................................................................................................................414a Pharmacists densities per 100,000 population by income classification................................................................................. .........424b Pharmacists densities per 100,000 population by WHO regions.................................................................... ..................................435 Summary of CPD and CE systems by country ........... .........................................................................................................................446 Registration of foreign pharmacists.................................................................... ..................................................................................477 Summary of data on pharmacy technicians................................................... ......................................................................................508 Acknowledgements .......................................................................................................... ......................................................................52

4 | International Pharmaceutical Federation (FIP)

Global Pharmacy Workforce and Migration Report | 5
This landmark report has been made possible due to the
time, efforts and contribution of over 100 individuals from
pharmacy professional and regulatory bodies, training institu-
tions and Ministries of Health from 41 countries worldwide.
We would like to express our gratitude to all that have provided
statistical data and information for this report.
We appreciate the input of the Human Resources for Health
Department of the World Health Organization (WHO), and
their invaluable advice and recommendations on the report
analysis and data collection processes.
The authors would like to especially thank Mr A.J.M. Hoek,
General Secretary and CEO; and Ms Myriah Lesko, Project
Coordinator; for their ongoing support.
Lastly, we also acknowledge the contributions of the FIP Bur-
eau and Board of Pharmaceutical Practice, International
Organization for Migratiom (IOM), pharmacy educators and
academic associations, who were involved in the review of
this document.
On behalf of the International Pharmaceutical Federation,
it is with great importance that we bring to you the official
FIP Global Pharmacy Workforce and Migration Report.
Human resources for health has been a significant focus of
FIP over the last year in the build up to the 2006 World
Health Day of the World Health Organization. This report
compiles data on many aspects affecting the constantly
changing profile of pharmacy human resources around the
world. FIP strongly believes that an expertly skilled and
competent - but also motivated and professionally fulfilled
- pharmacy workforce is of pinnacle importance in the safe
and effective delivery of healthcare. FIP is committed to col-
laborating with Member Organisations to develop an evidence
base for action to strengthen the pharmacy workforce.
With this report, we invite Member Organisations and key
stakeholders to examine those issues affecting the pharmacy
workforce in their own countries, and to join FIP in celebrating
the profession and planning for its future direction.
Jean ParrotPresident
International Pharmaceutical Federation

6 | International Pharmaceutical Federation (FIP)

Global Pharmacy Workforce and Migration Report | 7
All over the world, health care systems are undergoing
dramatic changes. As populations age and disease burden
increases due to HIV/AIDS and chronic diseases, we see a
corresponding growth in demands on health systems and
patient needs. The increased pressure on health care systems
stretches the health workforce to meet the accelerating demand
for health care providers, services and managed care facilities.
No examination of these mounting issues is complete without
a critical evaluation of global and national human resources.
This must be taken into consideration in the development
of health, labour and education policies. Data collection is
the key initial step to understanding the current health care
labour market.
In many countries, pharmacists are the most accessible of
all healthcare workers and as such play a key role in the
delivery of healthcare services at all levels. In an era of rapidly
accelerating change in healthcare delivery, the roles of pharma-
cists are being constantly redefined. As roles change, compe-
tency and training requirements change. Thus it is vital that
international data relating to the pharmacy workforce be
available to be considered in international and national health
care policies and workforce planning.
The International Pharmaceutical Federation developed the
Global Pharmacy Workforce and Migration Study with the
support of FIP Member Organisations, to build an evidence
base on the pharmacy workforce, raise awareness of global
trends affecting the workforce and engage partners to develop
strategies to address these.
This report for the first time presents global data on the
distribution of pharmacists, Continuing Professional Develop-
ment systems, and migration of pharmacists. This report is
one of the major projects of FIP on Human Resources for
Health, in the lead up to 2006 World Health Day and the
launch of the WHO Ten Year Action Plan for Strengthening
the Health Workforce.
The 2006 World Health Day celebrates the healthcare worker
on the 7 th of April with the theme of Human Resources for
Health. The 2006 World Health Report will cover issues
relating to health professionals such as pharmacists, physic-
ians, nurses, dentists and allied healthcare workers. This,
together with other activities leading up to the day, aim to
raise awareness of the need to address issues relating to the
distribution, training, competence, capacity, and migration
of health professionals.
“Sufficient investment in the recruitment, training,
retention and involvement in health policy of health
care professionals is the key to the quality and safety
of care”Ton Hoek, General Secretary, FIP
FIP participated in the WHO Human Resources and National
Health Systems – Shaping the Agenda for Action Workshop in
20021. This workshop involved a range of stakeholders
including ministries of health and professional organisations
to identify the following four priorities for action:
• examine and prepare for the effect of HIV/AIDS on the
health workforce and workload;
• advocate for fair incentives and motivation to remunerate
and retain health workers;
• address and map imbalances regionally and at a country
level;
• and collect evidence and explore the effect of strategies
to manage the migration of health workers.
Health workers save lives and are the interface between
health systems and the community. Imbalances in human
resources for health will only exacerbate imbalances in access
to quality health care and compromise patient safety. In
2002, the World Health Professions Alliance partners (FIP,
International Council of Nurses and the World Medical
Association) called for increased attention to patient safety,
a health care challenge that is inextricably linked to human
resources for health2. The WHPA urged WHO, governments
and others to examine ways and means of attracting and
retaining appropriately qualified health workers.
The FIP Global Pharmacy Workforce and Migration Report
serves as an international starting point to provide a snapshot
of the current workforce issues in pharmacy and give direction
on required actions to build capacity and strengthen the pro-
fession. It is the vision of the Federation to set the international

8 | Introduction
agenda in addressing pharmacy workforce issues and to pro-
vide guidance in the development of solutions.
With this report, FIP urges pharmacy professional and regu-
latory bodies, policy makers, pharmacy education providers,
and pharmacists to document the profession, build an evi-
dence base, and develop national strategies and actions to
address workforce issues and strengthen the pharmacy
workforce as an integral part of the health care system.
References
1. World Health Organization. Human Resources and
National Health Systems: Shaping the Agenda for Action
– Final Report. Department of Health Service Provision,
Evidence and Information for Policy. December 2002.
Available at:
www.who.int/hrh/documents/en/nhs_shaping_agen
da.pdf
2. World Health Professions Alliance (WHPA) Press
Release. Health Professionals Call for Priority on Patient
Safety. Available at:
www.whpa.org/pr07_02.htm

Global Pharmacy Workforce and Migration Report | 9
The FIP Global Pharmacy Workforce and Migration Study
sought to collect global data on the following:
• The distribution of pharmacists according to country,
gender and practice area
• Pharmacist shortages and country imbalances in pharma-
cist workforce distribution
• Continuing Professional Development (CPD) and Conti-
nuing Education (CE) programmes for pharmacists
• Regulation, training and certification of pharmacy technicians
• Migration of pharmacists worldwide and registration
processes for foreign pharmacists
Surveys and follow up reminders were sent to FIP Member Or-
ganisations comprising of pharmacy professional and regulatory
bodies. The FIP surveys were developed with the advice of the
Human Resources for Health Department of WHO.
Three surveys were developed to focus on:
• Pharmacy workforce
• CPD/CE
• Migration of pharmacists
Literature searches were conducted through PubMed and the
internet to find papers and reports on pharmacy workforce studies,
CPD/CE systems, and the migration of health professionals.
Population data was taken from the Population Reference
Bureau 2005 population statistics (www.prb.org). Country
economic classifications were sourced from the World Bank.
Data from the online surveys were downloaded into Excel.
Other data responses were entered into Excel spreadsheet
and analysed. All data was checked to ensure accuracy of data
input and where necessary, clarified with the data source.
Although very few articles have been published related to
pharmacy, a number of country reports and background papers
from professional associations and health agencies were used.
Pharmacy Workforce Survey
A survey comprised of 32 questions was designed in consult-
ation with WHO to collect the following information from FIP
Member Organisations (see appendix 1):
1. Contact details of personnel responsible for human re-
sources for health2. Total number of pharmacists
3. Gender distribution of pharmacists
4. Practice distribution of pharmacists5. Continuous Professional Development programmes and
requirements
The survey was available in English, French, Portuguese and
Spanish and could be completed either online or in hard copy.
A total of 83 member organisations were contacted on the 22nd
of July 2005 and 34 organisations responded with data by the20th January 2006. All member organisations were actively
followed up with reminders sent by facsimile, email and telephone.
Continuing ProfessionalDevelopment (CPD) /Continuing Education Survey (CE)
This survey followed the Pharmacy Workforce Survey andwas sent to all FIP Member Organisations that responded.
The survey was sent to the respondent contact or contact
persons responsible for CPD/CE programmes. The followinginformation was collected (see appendix 2):
• Regulatory bodies organising or providing CPD and CE
programmes• Details on CPD and CE system
• Standards and accreditation of CPD and CE providers
and programmes• Incentives for completing CPD and CE programmes and
penalties for failing to undertake CPD and CE
The survey was available in English, French, Portuguese and
Spanish and could be completed either online or in hard copy.A total of 34 member organisations were contacted on the 24th
of November 2005 and 17 organisations responded with data
by the 10th of February 2006. Respondents to the pharmacyworkforce survey also answered on whether CPD was compulsory
in their country. All member organisations were actively followed
up with reminders sent by facsimile, email and telephone.

10 | Global Pharmacy Workforce and Migration Report
Migration Study
Data was collected from ten countries including Australia,Canada, Ghana, Ireland, Kenya, New Zealand, South Africa,Uganda, United Kingdom, and United States of America.
These countries were approached along with four othercountries (Nigeria, Rwanda, India, and Zimbabwe) who wereanecdotally described as having a significant inflow and
outflow of pharmacists through migration.
Over 70 pharmacy regulatory boards, professional bodies,
Ministries of Health, Pharmacy Faculties, and pharmacistsaround the world contributed to the collection of data. Asurvey was sent to professional and regulatory bodies, followed
by the Ministry of Health and faculties of pharmacy whereadditional sources for data were required (see appendix 3).Countries were actively followed up through phone, email,
fax and letters. The data was also used to examine imbalancesin pharmacist distribution within a country.
Data was collected between the 27 th of September 2005 and10th February 2006. A literature search was also used to gatherdata where responses were missing and compile relevant
findings. The number of active practicing pharmacists wasused as the total number of pharmacists where differentiationwas provided in the number of registered pharmacists.
The survey collected data on:• The total number of registered pharmacists in 2005.
• The total number of foreign registered pharmacists in 2005.• The number of pharmacists graduating per year from
the year 2000 - 2005.
• The number of pharmacists that registered from abroadeach year from the year 1995 – 2005.
• The number of pharmacists from abroad that applied for
registration from the year 1995 – 2005.• The countries from which pharmacists were originally
registered as a pharmacist prior to application for registra-
tion and the corresponding numbers for each country.• The number of pharmacists migrating to another country
each year from 1995 – 2005.
• The application procedure for pharmacists from abroadto register as a pharmacist.
Pharmacy Technicians Study
A component of the Pharmacy Workforce Study focused on
the pharmacy technician workforce.
The following information was collected from FIP Member
Organisations:
• Total number of pharmacy technicians
• Education and training programmes of pharmacy technicians
• Certification requirements of pharmacy technicians
The survey was also available in English, French, Portuguese
and Spanish and could be completed either online or in hard
copy. A total of 83 member organisations were contacted on
the 22nd of July 2005 and 34 organisations responded with
data as of the 20th January 2006. All member organisations
were actively followed up with reminders sent by facsimile,
email and telephone (see appendix 1).
Study limitations
The main limitation of this report is the lack of full details from
all countries of the number, distribution, demographics, and
migration of pharmacists. Whilst full response from countries
in this study was not achieved, a significant wealth of information
of the human resources issues in pharmacy in many countries
was collected. Many countries were not able to account for
pharmacists and describe their practice area or status. In this
instance, data may be misleading and further information
systems development is required at a country level. Numbers
may also be misleading as the distribution of pharmacists
within a country may be imbalanced between rural and urban
areas. Regional data groupings may not be fully representative
but give an indication of trends. Further data is required from
non-respondent countries on the workforce and greater study
is required to understand the extent of pharmacist migration
in non-English speaking countries.
With the constraints of time and limitations of existing coun-
try level databases, we were not able to collect data on the
age distribution of pharmacists.
Data on the total number of pharmacists was reliant on the
information provided by national pharmaceutical associations
and/or national pharmacy boards. No verification on the
practicing status of the pharmacists was done.
The study did not look at the supply and demand of the
global pharmacy workforce in all respondent countries.
Pharmacy schools should be engaged in future studies on
the pharmacy workforce in order to develop a greater under-
standing of the human resources situation.

Global Pharmacy Workforce and Migration Report | 11
Pharmacists represent the third largest healthcare professionalgroup in the world. The majority of pharmacists practice in
community pharmacies, hospitals and other medical facilities.Smaller numbers of pharmacists are employed in the pharma-ceutical industry.
Although various national initiatives studying the pharmacyworkforce have been developed, such as the recent 2005pharmacy workforce project of the Royal Pharmaceutical Society
of Great Britain, little or no published international data exists1.
The size of the labour force depends on a number of issues,including the number in the labour market of working age,the participation rate of those who are working, and theavailability of those no longer working but who may returnto pharmacy employment2. It is also important to look at thehealth and retirement age of pharmacists. Other priorities
may include identifying the levels, causes and implicationsof turnover among different cohorts of pharmacists; researchinto the adequacy and suitability of undergraduate training;examining the job satisfaction levels and motivations ofpharmacists; and ensuring ethical recruitment3 .
This part describes what is known about the current pharmacy
workforce in 34 countries. It also looks at the total numberof pharmacists in each country, pharmacist to populationratios, gender distribution, and distribution according topractice area. Further examination of country imbalancesare also explored in three countries.
Table 1. Respondent countries according to WHO Regions:
The 34 respondent countries are spread over the six WHOregions with the highest number of countries from the Euro-
pean region.
1.1 Global Overview: Pharmacists density
The data collected revealed that the pharmacist to population
ratios vary widely from less than 5 pharmacists per 100,000
population to as high as over 200 the pharmacists per 100,000
population in some countries.
The average ratio in the Western Pacific countries is about
25 times more than that of the countries in the African region
and has the highest ratios compared to other regions. The ratio
is also related to the economic status of the country as can be
seen in figure 1, with the low income countries having the low-
est ratio and high income countries having the highest ratio.
The low availability of pharmacists in many developing
countries is exacerbated by geographical distribution disparity
between the rural and urban areas (refer to 1.3: Workforce
shortages and imbalances).
Figure 1. Pharmacist densities by country income economies
(World Bank Country Classification).
Refer to appendix 4 for more detailed information on phar-
macy densities by income classification and by WHO regions.
1.2 Pharmacist gender distribution
There is a higher percentage of female pharmacists in the European
and Africa/Eastern Mediterranean region. A higher percentage
CameroonCôte d'IvoireGhanaKenyaMadagascar
IsraelIraq
IndiaIndonesiaThailand
AustriaCzech RepublicDenmarkFinlandFranceGermanyHungaryIcelandIrelandItalyMaltaNorwayPortugalSwitzerlandTurkeyUnited Kingdom
BrazilUruguayCanadaUnited Statesof America
AustraliaJapanSingaporeTaiwan
South EastAsia (3)Africa (5) Europe (16) Pan America
(4)
EasternMediterranean(2)
WesternPacific (4)
0
50
100
150
200
250
Pharma-cists per100.000populations
Low-incomeeconomies
Lower-middleincome economies
Upper-middleincome economies
High-incomeeconomies
6.98 34.10 63.15 117.2075 th Percentile
1.46 6.76 32.17 28.77Lowest
45.31 49.19 77.14 206.67Highest
4.05 18.61 32.89 67.7125 th Percentile

of male pharmacists appear in the Western Pacific/ South East
Asia region, although this is largely due to the high number of
male pharmacists in India (300,000 males which accounts for
70% of India’s pharmacist workforce). A higher percentage of
male pharmacists is also seen in the Pan American region.
Figure 2. Pharmacist gender distribution by percentage
according to region.
1.3 Regional observations
Distinctly, we observe that the majority of pharmacists in
the 34 countries practice in the community and hospital
setting, about 73% in total. Europe has the highest percentage
of pharmacists in the community pharmacy setting, about
71%. There is also a much higher percentage of pharmacists
in the Western Pacific and South East Asia countries working
in the hospital sector than pharmacists in other regions.
(21% compared to an average of 9% in all other regions).
Across the regions, we also see that the percentage of pharma-
cists in the Western Pacific and South East Asia countries,
working in the Sales and Marketing sector is significantly
higher (6% compared to less than 1% in all other regions).
About 13 % of pharmacists are not accounted for by the natio-
nal pharmaceutical boards and pharmacy councils in the
African and Eastern Mediterranean countries and almost
19% of the pharmacy workforce in the South American
region is practicing in other areas of pharmacy. These missing
numbers indicate that data reporting protocols need to be
reinforced and more in depth information has to be collected
in order to better understand the work patterns of the
profession as part of a global workforce strategy.
12 | Part 1: Workforce description
Figure 3. Pharmacist distribution across pharmacy practice
fields as percentage of total workforce according
to region.
South East Asia Region
Figure 4. Pharmacist distribution across pharmacy practice
fields as percentage of total workforce in the South
East Asia region.
0
10
20
30
40
50
60
70
46 44
41 59
63 37
47 53
45 55
Female Male
Africa/Eastern Mediterranean
Pan America
Europe
Western Pacific/SouthEast Asia
Overal l
* - Data not available from Brazil and Kenya.
0
10
20
30
40
50
60
70
80
Sales/Market-
in g
Regula-tory
Others In dustrial HospitalCom-
munity
Aca-demic/
Research
Not ac-counted
figure 3 excludes the United States due to lack of complete data
Overall 5.72 3.78 0.84 8.20 7.09 15.53 57.01 1.84
Western Pacific/SouthEast Asia
1.11 5.71 1.19 8.35 9.11 20.52 51.67 2.33
Europe 9.51 0.59 0.34 6.25 4.15 7.46 70.82 0.88
Pan America 1.41 0.11 0.11 19.03 5.67 5.60 66.28 1.80
Africa/EasternMeditteranean
16.49 0.70 0.70 1.67 2.87 6.64 66.23 4.45
0
10
20
30
40
50
60
3.46 4.77 0.41 8.46 7.70 19.87 53.20 2.14
2.00 5.00
0.25
9.00 8.00 20.00 55.00 2.00
37.33 1.00
1.67
0.00 2.67 10.00 43.33 4.00
48.29 1 .59 3.71 0.95 3.71 24.17 13.31 4.28
Sales/Marketing
Regula -tory
Ot hers Industria l HospitalCom-
munit yAcademic/Res earch
Notacc oun ted
Total
India
Indonesia
Thailand
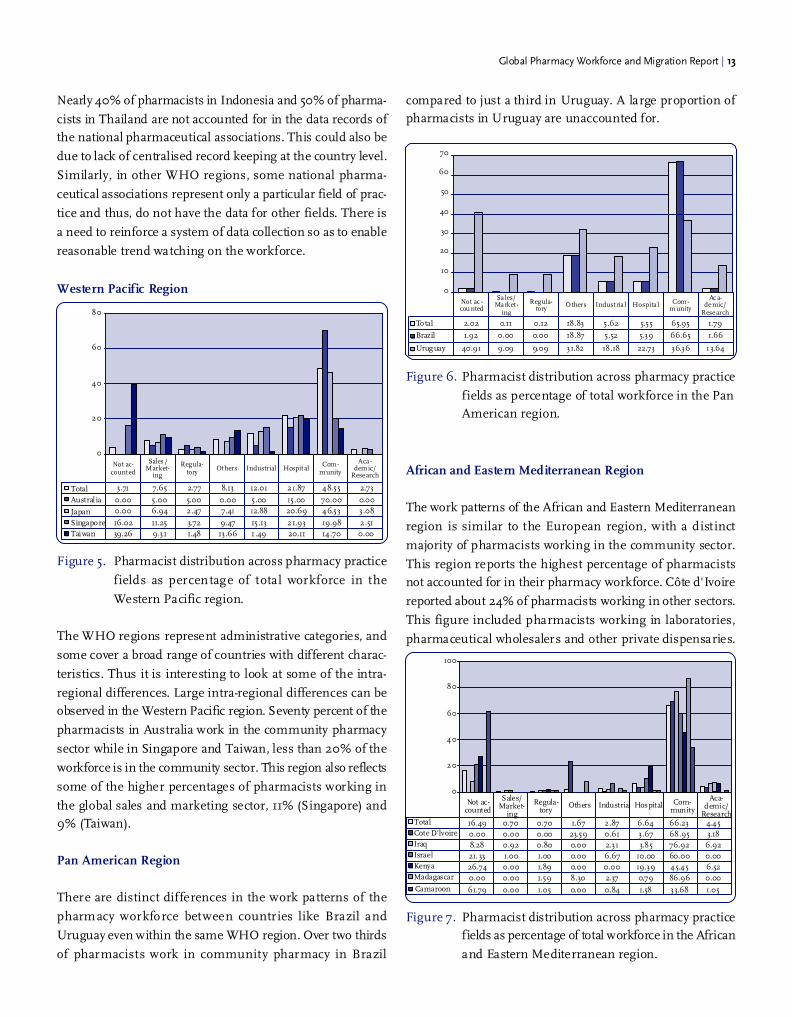
Nearly 40% of pharmacists in Indonesia and 50% of pharma-
cists in Thailand are not accounted for in the data records of
the national pharmaceutical associations. This could also be
due to lack of centralised record keeping at the country level.
Similarly, in other WHO regions, some national pharma-
ceutical associations represent only a particular field of prac-
tice and thus, do not have the data for other fields. There is
a need to reinforce a system of data collection so as to enable
reasonable trend watching on the workforce.
Western Pacific Region
Figure 5. Pharmacist distribution across pharmacy practice
fields as percentage of total workforce in the
Western Pacific region.
The WHO regions represent administrative categories, and
some cover a broad range of countries with different charac-
teristics. Thus it is interesting to look at some of the intra-
regional differences. Large intra-regional differences can be
observed in the Western Pacific region. Seventy percent of the
pharmacists in Australia work in the community pharmacy
sector while in Singapore and Taiwan, less than 20% of the
workforce is in the community sector. This region also reflects
some of the higher percentages of pharmacists working in
the global sales and marketing sector, 11% (Singapore) and
9% (Taiwan).
Pan American Region
There are distinct differences in the work patterns of the
pharmacy workforce between countries like Brazil and
Uruguay even within the same WHO region. Over two thirds
of pharmacists work in community pharmacy in Brazil
0
20
40
60
80
3.71 7.65 2.77 8.13 12.01 21.87 48.55 2.73
0.00 5.00 5.00 0.00 5.00 15.00 70.00 0.00
0.00 6.94 2.47 7.41 12.88 20.69 46.53 3.08
16.02 11.25 3.72 9.47 15.13 21.93 19.98 2.51
39.26 9.31 1.48 13.66 1 .49 20.11 14.70 0.00
Total
Austral ia
Japan
Singapore
Taiwan
Sales /Market-
ing
Regula-tory
Ot hers Industrial Hospit alCom-
munity
Aca -demic/
Research
Not ac-count ed
Global Pharmacy Workforce and Migration Report | 13
compared to just a third in Uruguay. A large proportion of
pharmacists in Uruguay are unaccounted for.
Figure 6. Pharmacist distribution across pharmacy practice
fields as percentage of total workforce in the Pan
American region.
African and Eastern Mediterranean Region
The work patterns of the African and Eastern Mediterranean
region is similar to the European region, with a distinct
majority of pharmacists working in the community sector.
This region reports the highest percentage of pharmacists
not accounted for in their pharmacy workforce. Côte d'Ivoire
reported about 24% of pharmacists working in other sectors.
This figure included pharmacists working in laboratories,
pharmaceutical wholesalers and other private dispensaries.
Figure 7. Pharmacist distribution across pharmacy practice
fields as percentage of total workforce in the African
and Eastern Mediterranean region.
Total 2.02 0.11 0.12 18.83 5.62 5.55 65.95 1.79
Brazil 1.92 0.00 0.00 18.87 5.52 5.39 66.65 1.66
Uruguay 40.91 9.09 9.09 31.82 18.18 22.73 36.36 13.64
Sales/Market -
ing
Regula-tory
Others Indust ria l Hospita l Com-munity
Ac a-demic/
Research
Not ac -cou nted
10
20
30
40
50
60
70
0
0
20
40
60
80
100
Sales/Market-
ing
Regula-tory
Others Industrial Hospital Com-munity
Aca-demic/
Research
Not ac-counted
Total
Cote D'lvoire
Iraq
Israel
Kenya
Madagascar
Camaroon
16.49 0.70 0.70 1.67 2.87 6.64 66.23 4.45
0.00 0.00 0.00 23.59 0.61 3.67 68.95 3.18
61.79 0.00 1.05 0.00 0.84 1.58 33.68 1.05
8.28 0.92 0.80 0.00 2.31 3.85 76.92 6.92
21. 33 1.00 1.00 0.00 6.67 10.00 60.00 0.00
26.74 0.00 1.89 0.00 0.00 19.39 45.45 6.52
0.00 0.00 1.59 8.30 2.37 0.79 86.96 0.00

14 | Part 1: Workforce description
European Region
Figure 8. Pharmacist distribution across pharmacy practice
fields as percentage of total workforce in the Euro-pean region.
Within the European region, we observe that some countries
(Denmark, Norway and Iceland) have a notably higher average
of the pharmacists in the industry. Although community
pharmacists represent about 70% of the European workforce,
only 35% and 58% of the workforce are in community
pharmacy in Iceland and Portugal respectively.
1.4 Workforce shortages andimbalances
The number of pharmacy graduates per year is escalating in
many countries worldwide in an effort to provide enough
pharmacists to meet demands and fill vacancies. The number of
pharmacy schools worldwide currently stands at 9145. The shortage
of pharmacists has been attributed to increases in the volume of
prescriptions; growth the population over the age of 65; greater
administrative requirements for handling third-party payments;
the changing role of pharmacists; and the growing proportion of
women in the profession who are less likely to work full time6,7,8,9.
A shortfall of over 150,000 pharmacists by 2020 in the USAwas projected in a study in 20028. Similarly, in Australia the
demand for pharmacists is projected to increase between the
years 2000 to 2010 from 13,000 to 17,200; thus leading to
a shortfall of about 3,000 pharmacists by 20106. However,it was noted that a large pool of about 5,000 pharmacists are
currently on the register in Australia but not working in
pharmacy. In Zimbabwe, only 20% of the approved public
sector positions for pharmacists were filled in 1999 with themajority of the 524 registered pharmacists opting to work in
the private sector10. Shortages in the profession affect all
areas of pharmacy practice with some areas such as the public
sector finding it more difficult to recruit, especially wherethere are differences in remuneration and working conditions.
There is no internationally established minimum recom-
mended pharmacist to population ratio. Many countries havedeveloped their own recommendations based on demand
for pharmaceutical services. In France, the l'Ordre National
des Pharmaciens submits annual workforce statistics such
as the number of practicing pharmacists, foreign pharmacists,and pharmacy students; attrition rate; regional distribution;
and demographics to the Ministry of Health. These statistics
are then used to determine the number of pharmacy students
that may progress onwards from the first year of studies andadditional foreign pharmacists that may practice in France
each year. The demand for pharmacists and the required
ratio to the population is specific to the local needs. These
are determined by a range of factors including the populationdemographics; disease burden; economic status; market
forces; pharmacist roles and competencies; legislation relating
to medicines dispensing and prescribing; roles of other health
workers; health systems and technology.
Workforce shortages are further compounded by imbalances
in the distribution of existing pharmacists within countries.
Current survey results show that the majority of the USA
population live in areas that report at least a moderately
high difficulty in filling vacant pharmacy positions11.
About 10% of pharmacy positions in Canada were vacant inthe year 20007. It was also noted that although the expansion
Portugal 8.45 0.00 0.00 12.03 6.90 7.91 58.83 5.89
Hungary 0.00 7.53 0.57 6.90 10.23 6.83 65.62 2.33
Sales/Market-
ing
Regula-tory Others Industrial Hospital Com-
munity
Aca-demic/
Research
Not ac-counted
0 20 40 60 80 100
Austria 5,29 0,00 0,00 0,00 0,00 5,29 89,42 0,00
Total 9,51 0,59 0,34 6,25 4,15 7,46 70,82 0,88
Turkey 4.17 2.47 0.00 0.00 2.40 6.21 84.75 0.00
Switzerland 17.23 0.00 0.43 0.00 3.09 1.30 77.94 0.00
Malta 0.00 0.00 0.00 0.00 0.00 0.00 0.00 0.00
Norway 26.38 0.00 4.79 0.00 14.46 18.30 80.45 8.38
Italy 0.00 0.00 0.00 0.00 0.00 0.00 0.00 0.00
Ireland 0.00 0.00 1.00 11.00 5.00 10.00 68.00 5.00
Iceland 11.08 25.95 3.51 9.73 25.95 6.22 35.41 4.32
United Kingdom 29.53 0.30 0.00 7.03 3.25 14.95 44.00 0.95
Germany 11.18 0.00 0.00 0.00 0.00 3.37 85.45 0.00
France 0.47 0.00 0.00 11.40 4.95 6.68 76.50 0.00
Finland 0.00 0.00 2.41 21.08 9.04 6.02 59.04 2.41
Denmark 15.13 0.00 9.21 0.00 44.74 7.24 17.76 5.92
Czech Republic 0.03 0.59 1.42 5.02 1.09 5.36 82.87 3.68
Sales/Market-
ing
Regula-tory
Others
Ind ustr ial
Hospital
Com-munity
Aca-demic/
Research
Not ac-counted

Global Pharmacy Workforce and Migration Report | 15
of the roles of pharmacists has increased demand, shortages
appear to place limitations on the counselling servicesprovided by pharmacists. Long hours and increasing prescrip-
tion numbers results in less time being spent counselling
patients, a part of the pharmacists’ responsibilities that bring
the greatest job satisfaction. Reduced staff morale, increased
stress and risk of errors have been widely cited as conse-
quences of pharmacist shortages. There are concerns that
the excess demand for pharmacists is undermining the
slow progress and development of clinical pharmacy.
Australia and Canada do not appear to have regional workforcedistribution imbalances, compared to Ghana and Uganda,
with the proportion of pharmacists in each region matching
the proportion of the population. However, workforce imbal-
ances have been reported within regions in workforce reports
between urban and rural areas. Rural areas in Canada, Aus-
tralia and New Zealand find it difficult to recruit younger
pharmacists and are served by pharmacists who are looking
to retire in the next ten years6,7,8. Migrant workers are recruited
in locations that are not easily filled by local workers, especiallyrural areas. Some countries have programmes in place to
encourage pharmacists to work in rural settings and increase
exposure to rural pharmacy practice, such as the Pharmacy
Guild of Australia’s Rural and Remote Pharmacy Workforce
Development Program (RRPWDP).
Ghana
In 2005 the total number of pharmacists registered by the
Pharmacy Council in Ghana was 2162. Of these, 1579 were
recorded to work as either private or public sector pharmacists.
The country of 21 million people is served by a ratio of 10
pharmacists per 100,000 population12.
Although 15% of practicing pharmacists work in the public
sector in hospital pharmacy, they are disproportionately
distributed in the more urban areas of Ashanti and the
Greater Accra regions in Ghana. Likewise, 67% of pharmacists
working in the private sector are based in the Greater Accra
region12. Imbalances in regional distribution leave regions
other than the Greater Accra and Ashanti with around 2
pharmacists per 100,000. Delegating certain functions in
pharmacy assistants has assisted to relieve pharmacists of
excess workload.
Figure 9. Distribution of pharmacists working in private
and public sector vs. population across each region
in Ghana in 2005 (June).Source: Pharmacy Council of Ghana (2005), Ghana Census Study (2000).
Note: Data for Northern, Upper East and Upper West for private sector
pharmacists was only available as pooled data and is given as an average value.
The Ghanaian pharmacist workforce has seen an increase
of 79% in the number of public sector pharmacists and 56%
for the number of private sector pharmacists between 2001
and 2005. The percentage increase is mostly seen to the
number of pharmacists working in the Greater Accra region
and less so in other regions. This trend may not continue
unless the migratory flow of pharmacists from Ghana is
reduced. Since 2001, Ghana has trained 700 pharmacists
through its only pharmacy school although it is believed that
a large proportion of these graduates have migrated abroad
(refer to Part 3: Migration of Pharmacists).
Kenya
Kenya has a population of almost 34 million that is served
by 1342 pharmacists registered with the Pharmacy and
Poisons Board of Kenya in 2005. The number of graduates
each year from the pharmacy school has doubled from 25 in
2000 to 53 in 2005. The Kenyan Pharmacy and Poisons
Board estimates that over 190 pharmacists have migrated
abroad in the last ten years, a loss that is equivalent to the
total number of pharmacists that were trained since 2000.
0
10
20
30
40
50
60
70
Ashanti Eastern BrongAhafo
Western GreaterAccra
Vol ta Northern UpperEast
UpperWest
Central
% of population
% public sector
% private sector

16 | Part 1: Workforce description
In 2003, a WHO “3 by 5” emergency mission found that 160
pharmacists or pharmacy technicians were unemployed in
Kenya; a readily available workforce that could be utilised to
scale up HIV/AIDS medicines access13.
Uganda
Uganda, with a population of almost 27 million, struggles
to effectively deploy their limited human resources of 249
pharmacists. There is a ratio of just 1 pharmacist per 100,000
population however nearly 90% of these pharmacists practice
in the Central region leaving the other three regions greatly
underserved. Up to 25 pharmacists graduate each year, a
number that is grossly inadequate to meet needs. Pharmacist
availability was estimated to be about 30% of the required
number by the Ministry of Health14.
Figure 10.Distribution of pharmacists in Uganda across each
region in 2006.Sources: Pharmaceutical Society of Uganda (2006), Uganda Population
and Housing Census (2002)
References
1. K. Hassel, M. Eden. Workforce update - Joiners, leavers,
and practising and non-practising pharmacists on the
2005 register. The Pharmaceutical Journal 2006; 276:
40-42
2. K. Hassel, P. Shann and R.Fisher. The pharmacy labour
market 1991 to 2001. International Journal of Pharmacy
Practice 2002; 10:R27
3. K. Hassel and L. Seston. Developing an R & D agenda
for pharmacy workforce research. International Journal
of Pharmacy Practice 2001; 19:R54
4. K. Hassel and L. Seston. Developing an R & D agenda
for pharmacy workforce research. International Journal
of Pharmacy Practice 2001; 19:R54
5. World Health Organization. World Health Report –
Human Resources for Health, 2006.
6. Health Care Intelligence Pty Ltd, Australia. A Study of the
Demand and Supply of Pharmacists, 2000 – 2010. 2003.
7. Human Resources Development Canada. A Situational
Analysis of Human Resource Issues in the Pharmacy
Profession in Canada. Based on a Proposal by the Can
adian Pharmacists Association, July 2001.
8. Knapp DA. Professionally determined need for pharmacy
services 2020. American Journal of Pharmacy Education.
2002;66:421-429.
9. Pharmacy Council of New Zealand Workforce
Demographics, June 2005.
10. A. Chikanda, Skilled Health Professionals’ Migration and
its Impact on Health Delivery in Zimbabwe. Centre on
Migration, Policy and Society (COMPAS)Working Paper
No. 4, University of Oxford, 2004.
11. Aggregate Demand Index. Available at:
www.pharmacymanpower.com. Accessed 16 February
2006.
12. D. Dolvo, Using Mid-Level Cadres as Substitutes for
Internationally Mobile Health Professions in Africa. A
Desk Review. Human Resources for Health, 2004; 2:7
Available at:
www.human-resources-health.com/content/2/1/7
Accessed 8 February 2006.
13. Jong-wook Lee, Global Health Improvements and WHO:
shaping the future. Lancet 2003 362: 2083-88. Available
at www.who.int/whr/2003/media_centre/lee_article/en
/index4.html. Accessed 8 February 2006.
14. C. W. Matsiko, J. Kiwanuka, A Review of Human Re-
source for Health in Uganda. Health Policy and
Development; UMU Press, 2003 1(1):15-20
0
10
20
30
40
50
60
70
80
90
100
Northern Eastern South-Western Central
% Pharmacists
% Population

It must be an ongoing and cyclical process of continuous
quality improvement by which pharmacists seek to maintain
and enhance their competence in both current duties and
anticipated future service developments.
It is important to differentiate CPD and Continuing Education
(CE). The latter can be defined as structured learning experi-
ences and activities in which pharmacists can engage after
they have completed their academic education so as to improve
knowledge, skills and competencies. Comparatively, CPD
requires pharmacists to take personal responsibility for the
identification of their learning and development needs and,
importantly, for subsequent evaluation of their success in
meeting those needs.
In CPD, CE is just one component of the learning experiences
in which pharmacists are being encouraged to engage.
FIP strongly recommends national pharmaceutical organisa-
tions to take action to ensure that pharmaceutical education,
both pre-university and post-university qualification, is de-
signed to equip pharmacists for the roles they have to under-
take in community and hospital practice5.
2.1 CPD and CE Survey Respondents
Seventeen countries responded to the CPD/CE survey fol-
lowing up from the Pharmacy Workforce survey. These
countries represent all six of the WHO regions. Only three
countries specifically identified their systems as being CPD
systems (Japan, Portugal and the United Kingdom).
Table 2. Respondent countries according to WHO regions:
Global Pharmacy Workforce and Migration Report | 17
As pharmacists assume the increased responsibilities demanded
in new roles, they must also make a corresponding commitment
to improve their professional competence1. Indeed the past
four or five decades have seen an explosion of new knowledge
relevant to the practice of pharmacy. In addition, particularly
in the past decade, there have been a vast changes in the practice
of pharmacy. Keeping knowledge and skills up to date and
addressing new concepts in the delivery of pharmaceutical
services have been major challenges for pharmacists.
Healthcare professionals are expected to meet patients’ re-
quirements for better and more accessible services, optimising
the benefit they gain from their medicines, and reducing
drug-related problems, while making the best use of pharma-
cists’ skills and knowledge within a multidisciplinary team.
Competence is the first and most fundamental responsibility
of all health care providers and must be reinforced throughout
the years of practice. After the degree is conferred, continuing
professional education is the only real guarantee of the opti-
mal quality of healthcare providers1. Maintaining competence
throughout a career during which new and challenging pro-
fessional responsibilities will be encountered, is an ethical
requirement for all health professionals 2. FIP has recognised
this responsibility in its Code of Ethics for pharmacists “to
ensure competency in each pharmaceutical service provided
by continually updating knowledge and skills”3.
The pharmacy degree is not an end point but the attainment
of a standard. In the FIP Statement on Good Pharmacy Educa-
tion, it is stated that continuing professional development must
be a lifelong commitment for every practicing pharmacist 4.
The concept of Continuing Professional Development (CPD)
was proposed as a culture of lifelong learning in which learn-
ing programmes are used to identify and meet the learning
needs of individual health professionals. CPD can be defined
as “the responsibility of individual pharmacists for systematic
maintenance, development and broadening of knowledge,
skills and attitudes, to ensure continuing competence as a
professional, throughout their careers.” 2.
KenyaZambia
CyprusIraqIsrael
NepalFinlandFranceMaltaPortugalUnited Kingdom
BrazilCanadaUnited Statesof America
JapanSingaporeTaiwan
South EastAsia (1)Africa (2) Europe (5) Americas (3)
EasternMediterranean(3)
WesternPacific (3)

18 | Part 2: Continuous Professional Development and Continuing Education
2.2 Mandatory CPD and CE
A total of 37 countries, from both the Pharmacy Workforce
Survey and the CPD/CE survey, responded to the question
on whether CPD and/or CE is mandatory for pharmacists.
Results showed that CPD and/or CE is mandatory in 9
countries and not mandatory in about 28 countries.
From the responses of the survey, we observe that many
countries are in various developmental stages of CPD and
CE implementation. The scenario can be unique in certain
countries.For example, in Denmark there is no obligation
for CPD or CE to renew or maintain pharmacist registration,
however, Pharmakon(www.pharmakon.dk) is the central
institution for providing CE programmes for pharmacists.
Also the Danish University of Pharmaceutical Sciences
(www.dfuni.dk) also offers a range of learning activities.
Embracing CPD will put pharmacists in a learning mode on
a day-to-day basis; they will no longer separate learning from
practice. Informal learning must be integrated into structured
learning to meet identified specific learning and development
needs in the CPD cycle2.
There are questions that need to be asked to ensure effective
mandatory CPD:
• Does it adequately address the learning needs of pharma-
cists?
• How can pharmacists access learning?
• Are we promoting learning or gathering hours?
• Are all required competencies for pharmacists addressed?
• How do we show evidence of practice change?
• How can we minimise fraudulent reporting?6
Governments (national and sub-national pharmacy boards)
were responsible for regulating CPD and CE for pharmacists
in 7 of the respondent countries. In countries that had more
than one pharmacy regulatory board, respondents were asked
to explain the relationships between them. Information col-
lected on the regulatory boards and CPD and CE systems
can be referred in appendix 5.
Responses also showed that 7 of the CPD and CE systems
were credits-based.
There is a wide variety of CPD and CE providers and most
commonly, learning programmes are provided by national
pharmaceutical associations, pharmacy boards, universities,
teaching hospitals and pharmaceutical companies. In some
countries like Finland, there are specialised pharmaceutical
learning centres for training pharmacists like The Palmenia
Centre for Continuing Education
(www.helsinki.fi/palmenia/english/).
The establishment of CPD and CE standards and accreditation
of providers vary from country to country and here we note
some of the unique situations in these countries.
• In Canada, the provincial regulatory authority and/or the
Canadian Council for Continuing Education in Pharmacy
accredits CE programmes for pharmacists. The former
is responsible for provincial programmes while the latter
is responsible for national programmes.
• In Finland, each of the CE providers has set their own
standards. For example, the Pharmaceutical Learning
Centre and the universities provide most of the CE pro-
grammes for pharmacists and they follow their own
standards.
• In Zambia, a standard for CE providers has yet to be es-
tablished.
• In Portugal, each CPD activity is subject to a standars-
based evaluation of its quality standards by the Portuguese
Pharmaceutical Society. These encompass the definition
of learning objectives, programme content and educators,
applicability and relevance to practice, among others.
The data also indicated that only three countries have
mandatory accreditation of their CPD and CE providers.
2.3 Incentives
The most common incentive for pharmacists to undergo
CPD or CE is the renewal of a license to practice as a pharma-
cist in the country. In some provinces of Canada, pharmacists
require proof of completion of a minimum number of hours
of CE to renew their license. In some other provinces, during
a quality assurance process, pharmacists may be required to
have their learning portfolio reviewed.
In Finland, there are long-term professional development pro-
grammes for community pharmacists and these programmes
aim to upgrade practicing pharmacists in management, busi-

Global Pharmacy Workforce and Migration Report | 19
ness and professional skills. In Finland, a license from the
National Agency for Medicines is needed in order to own a
retail pharmacy and if there are several applicants for a phar-
macy ownership license, it shall be granted to the applicant
who may be considered the best qualified to operate the phar-
macy. When a pharmacist has received a certificate for under-
taking professional development programmes, he/she usually
has a better chance in owning a pharmacy.
In the United Kingdom, CPD is linked to registration and
practising status. Pharmacists must sign a declaration to do
CPD annually if they register as practicing pharmacists.
In Israel, certificates are issued. Negotiations are underway
for the Managed Care Organisations (MCO) to better remu-
nerate pharmacists who have completed CE courses.
2.4 Penalties
In most countries with mandatory CPD and/or CE, a failure
to complete the requirements for CPD or CE often results
in the inability to renew a pharmacy practice license or risk
being struck off the pharmacy register.
In Kenya, in the event that a pharmacist does not comply
with the CPD requirements, the Pharmacy and Poisons Board
(PPB) may impose any or more of the following:
• Requiring the pharmacist to follow a remedial CPD
programme.
• Requiring the pharmacist to write an examination.
• Registering the pharmacist in a category that requires
supervision.
• De-registering the pharmacist.
Pharmacists who find difficulties in performing CPD may be
supported in the United Kingdom with remedial programmes.
In Portugal, pharmacists may have to undertake an extensive
examination to maintain a license to practice or undergo a
disciplinary action and be suspended from practice.
2.5 CPD and CE LearningPortfolios
Only four countries have specialised CPD/CE toolkits or
portfolios for pharmacists undergoing CPD.
We recognise three important features of CPD7:
• CPD is practitioner-centred and self-directed
• CPD is practice related
• CPD is outcomes orientated
In our literature search we found little evidence relating to
the use of portfolios in self-directed learning outside a formal
scheme of study. There was a study done in the University
of Wales on piloting a toolkit to aid portfolio building. This
project was based on qualitative methods using focus groups
to explore the experience of 14 pharmacists using a “portfolio
development toolkit”; a pack designed to help them start a
CPD portfolio. The pack promotes a number of specific ap-
proaches to key aspects of the CPD process8.
For more detailed information on each country’s CPD and
CE system, see appendix 5.
References
1. American Society of Hospital Pharmacists (ASHP)
statement on continuing education. American Journal of
Hospital Pharmacy. 1990; 47:1855.
2. International Pharmaceutical Federation. FIP statement
of professional standards on continuing professional de-
velopment. 2002 Sept. Available at:
www.fip.org/pdf/CPDstatement.pdf
3. International Pharmaceutical Federation. FIP Statement
of professional standards: Code of Ethics Pharmacists,
New Orleans, 2004. Available at: www.fip.org
4. International Pharmaceutical Federation. FIP Statement
on Good Pharmacy Education, Vienna 2000. Available
at: www.fip.org
5. International Pharmaceutical Federation. FIP Statement
on Standards for Quality of Pharmaceutical Services -
Good Pharmacy Practice in Community and Hospital
Settings. Tokyo 1993, 1997. Available at: www.fip.org
6. The Accreditation Council for Pharmacy Education (ACPE).
Available at: www.acpe-accredit.org

20 | Part 2: Continuous Professional Development and Continuing Education
7. M. Rouse, Continuing professional development in phar-
macy. American Journal of Health-System Pharmacists.
2004; 61: 2069-76
8. G. Thompson, Supporting continuing professional
development for pharmacists: Piloting a toolkit to aid
portfolio building. 2001. Available at:
www.cf.ac.uk/phrmy/WCPPE/articles/CPD/CPD.html
Accessed 14 February 2006.

Global Pharmacy Workforce and Migration Report | 21
The WHO’s Mejia study published in 1978 was the first step
of the organisation’s response to a mandate calling for a
study of health workforce migration1. This study provided a
statistical report on the stock and flow of physicians and
nurses in 137 countries and an analysis of the characteristics
of migrants, directions, possible determinants and conse-quences, and actions to regulate migration.
In 2002, the World Health Assembly asked the secretariat
to “accelerate development of an action plan to address the
ethical recruitment and distribution of skilled health care
personnel, and the need for sound national policies and strat-
egies for the training and management of human resources
for health”. In the same year, FIP participated in the WHOHuman Resources and National Health Systems - Shaping theAgenda for Action Workshop. This workshop involved a range
of stakeholders including ministries of health and professional
organisations to identify priorities for action and partnership
in addressing human resources for health issues.
WHO resolutions passed in May 2004 urged Member States
among others to develop and establish mechanisms to mitigate
the adverse impact on developing countries of the loss of health
personnel through migration, including means for recipientcountries to support the strengthening of health systems, in
particular human resources development. It also requested the
Director General of WHO among others to establish and
maintain in collaboration with relevant countries/institutions/
organisations, information systems which will enable the
appropriate international bodies to monitor independently the
movement of human resources for health, as well as conducting
research on the international migration of health workers.
Little has been published or is known about the extent of the
international migration of pharmacists. Though the migration
of pharmacists has been recognised as an issue in reports
of the WHO and some papers, concrete data for the most
part has been unavailable2,3,4,5. There is no data on the migra-
tory flow and itinerary of pharmacists and this was not studied
in this report. Such data would be useful to determine pat-
terns in migration, as statistics on the migration of pharma-
cists from one country to another do not provide the com-plete picture. Pharmacists may migrate to certain countries
as a ‘stepping stone’ to facilitate onwards migration to other
countries.The FIP Global Pharmacy and Migration study
targeted selected countries that had been anecdotally described
as receiving (recipient countries) and losing (source countries)
large volumes of pharmacists.
3.1 The extent ofpharmacist migration
The number of overseas pharmacists registering in recipient
countries is the most reliable data however this does not fully
capture the extent of migration. Those who have been unsuc-cessful in registering as pharmacists and/or working as phar-
macy technicians after migrating to other countries are often
not detected. In many countries, a letter of good standing or
confirmation of registration is required from overseas pharma-
cists to complete their registration application. Source countries
are able to track this with some limitation the number migrating
abroad. What is detectable may just scratch the surface of the
issue. What is also unknown is the pattern of migration of
pharmacists. In figure 11 it appears that the majority of for-
eign pharmacist registrations are from high income countries
(World Bank Country Classification). Although the proportionof lower-middle and low income countries may appear to be less,
this still represents a significant effect on the source countries.
Figure 11.Foreign pharmacists registering in Ireland, New
Zealand and United Kingdom according to origin
economic country classification.Source: Irish Pharmaceutical Society (foreign pharmacists registered with
known origin country in 2005), Pharmacy Council of New Zealand (total
foreign pharmacists registered in 2005), Royal Pharmaceutical Society of
Great Britain (foreign pharmacists registering between 2001-2005). World
Bank Country Classification.
The limitations of registration numbers demonstrating the
extent of migration can be seen in the case of South Africa,
0%
10%
20%
30%
40%
50%
60%
70%
80%
90%
100%
Ireland New Zealand United Kingdom
Low
Low er-middle
Upper-middle
High

22 | Part 3: Migration of pharmacists
where only 18 foreign pharmacists have registered with the
Pharmacy Council since 2003. Overseas pharmacists seeking
to register as a pharmacist must first apply to join the South
African Ministry of Health’s Foreign Workforce Management
Programme. Contrary the few that have registered, 184 pharma-
cists have applied to the Ministry’s Programme since 2003.
The staff coordinating the Programme at the Ministry of
Health stated that they were becoming increasingly overloaded
with the growing number of inquiries from foreign health
professionals, indicating an increasing trend for receiving
health professionals from other countries. Many pharmacists
migrating to South Africa do not successfully complete the
registration requirements which includes one year of manda-
tory community public service. In 2001 about 1000 pharmacy
students graduated from South Africa; in the same year 600
pharmacists emigrated abroad6.
Many regulatory and professional bodies were not able to give
accurate figures for the number of pharmacists migrating
abroad or registering from abroad each year. This data is not
routinely collected from pharmacists and difficulties exist in
tracking this information. In large countries such as India,
Canada, Australia and the USA, sub-national boards of pharmacy
regulate the profession and individually collect information for
each state/province, hence the level of detail of data collected
is often inconsistent. Separate bodies may also be responsible
for training or examining foreign pharmacists at a national or
sub-national level. Lack of coordination and systematic reporting
at a national level leads to difficulties in collating and interpreting
detailed information about the workforce.Only 16 of 52 state
boards of pharmacy responded in the USA, with just 5 states
keeping records on the number of foreign trained pharmacists
registered in their state. Data for the USA on foreign pharma-
cists is largely incomplete and requires further study before
being reported. Foreign pharmacists employed in academia,
industry and administration positions are not required to be
registered so registration numbers may underestimate true
figures.
The extent of data and information management is inconsis-
tent in large countries with many sub-national unable to
provide the required data relating to the number of foreign
pharmacists, registrations per year, migrating pharmacists
and pharmacy graduates. Figure 12 demonstrates the propor-
tion of registered pharmacists that are foreign, however this
is likely to be an underestimate as data is incomplete for
large parts of Canada and Australia.
Figure 12.Proportion of registered pharmacists
that are foreign (2005).Source: Pharmaceutical Society of Ireland, Royal Pharmaceutical Society
of Great Britain, Australian State Boards of Pharmacy, Pharmacy Council
of New Zealand, Canadian Provincial Boards of Pharmacy (2005).
Data can also be variable between reports from the same
sources and difficult to validate. Although the migration of
pharmacists is not touted by the Pharmaceutical Society of
Uganda to be an issue with just one pharmacist migrating
abroad on average per year to their knowledge, Matowe et al
published in 2004 that a third of registered pharmacists
were working and residing outside of Uganda7.
The factors encouraging pharmacists to leave their country
(push factors) or move to a country (pull factors) have not been
studied. Studies examining reasons for migration in phys-
icians and nurses have found factors such as income, job
satisfaction, career opportunity, working conditions, manage-
ment and governance and social and family5. Individuals may
also choose to train in health as a means to facilitate migration.
Despite these limitations, the data collected in the FIP Global
Pharmacy Workforce and Migration Study has identified a grow-
ing trend of international migration of pharmacists, an issue that
not only affects developing countries but also developed countries.
3.2 Australia
Since 1995, over 1100 foreign pharmacists have registered
in Australia in five of the eight states where data was available.
The supply of pharmacists from overseas has increased since
the mid 1980’s8. The Department Immigration and Multicul-
tural Affairs found an increase of over 40% in the number
of individuals with pharmacy qualifications permanently
migrating to Australia between 1993-1994 and 1997-1998.
Foreign pharmacists account for over a quarter of registered
pharmacists in Western Australia with most pharmacists
0%10%20%
30%40%50%60%
70%80%90%
100%
Ireland UK Austral ia NewZealand
Canada
Foreign

Global Pharmacy Workforce and Migration Report | 23
originating from the United Kingdom and South Africa.
Only two state boards kept data on the country of origin of
foreign pharmacists and three on the total number of foreign
pharmacists currently registered. The proportion of pharma-
cists that are foreign is under 10% though it may be higher
given that no data is available for five state boards.
Table 3. Total number of pharmacists registered in each state
of Australia (2005).
Source: State boards of pharmacy
The number of foreign pharmacists registering in Australia
appears to have steadily increased since 1995 with the vast
majority of foreign pharmacists registering in New South
Wales. Statistics relating to Australian pharmacists migrating
abroad was only tracked by the Pharmacy Board of Tasmania.
Australian pharmacy graduates
Figure 13. Number of foreign pharmacists registering in
Australia in each state from 1995 - 2005.Source: Pharmacy Boards of Northern Territories, Tasmania, South Australia,
New South Wales, and Western Australia (2005). Note that data prior to
2003 and 1999 was not available for Tasmania and the Northern Territories.
Data was also unavailable from Victoria, Queensland and ACT.
Figure 14.Number of graduates in Australia per state from
2000 - 2004.Source: State boards of pharmacy, Charles Sturt University, University of
Sydney, University of Canberra
The number of pharmacy graduates per year has been steadily
increasing since 1985 to meet demand8. One thousand phar-
macy students graduated in Australia in the year 2004 with
more expected in the near future. Two new schools of phar-
macy have opened in the state of New South Wales with their
graduates expected in 2006. The University of Sydney gradu-
ated its first students through the Master of Pharmacy pro-
gramme in 2004 in addition to graduates of the standard
programme. The Master of Pharmacy programme is a gradu-
ate entry course that can be completed in two years by appli-
cants with a Bachelor degree.
3.3 Canada
Foreign pharmacists registered in Canada originated, in des-
cending order, from Egypt, USA, India, Pakistan, Philippines,
Pakistan, United Kingdom, South Africa, Yugoslavia, and
Korea. Information relating to the number of Canadian
pharmacists migrating abroad was not collected by any
provincial board of pharmacy. The number of registrations
of foreign pharmacists has steadily increased over the last
ten years as seen in figure 15 with the majority of registrations
in Ontario. Due to lack of data from Quebec prior to 2005
and three other provinces it is difficult to interpret the rate
of increase.
Western Australia 1930 516
Victoria 5301 Not availableNew South Wales 7668 1016
South Australia 1399 28
Queensland 3980 Not availableACT 401 Not available
Tasmania 550 Not available
Northern Territories 205 Not availableTotal 21,434 1, 560
State Total ForeignRegistered Pharmacists
Total RegisteredPharmacists
0
20
40
60
80
100
120
140
160
0
0
1
47
0
1995
0
0
1
38
2
1996
0
0
1
47
5
1997
0
0
1
57
10
1998
0
0
1
82
11
1999
4
0
2
108
9
2000
2
0
3
116
6
2001
7
0
2
108
10
2002
6
1
9
97
8
2003
13
1
1
122
14
2004
15
0
5
116
14
2005
Northern Territories
Tasmania
South Australia
New South Wales (30th sept)
Western Australia
0
200
400
600
800
1000
1200
2000 2001 2002 2003 2004
Tasmania
South Australia
Queensland
New South Wales
Victoria
Western Australia

24 | Part 3: Migration of pharmacists
Figure 15. Foreign Pharmacist registrations in Canada in
each province from 1995 - 2005.Source: Pharmacy Boards of Newfoundland and Labrador, Quebec, New
Brunswick, Saskatchewan, Ontario, British Colombia, Alberta (2005). Data
unavailable for Quebec prior to 2005 and three Boards of Pharmacy for the
entire period.
3.4 Ghana
With an existing workforce of 10 pharmacists per 10,000
population, the migration of nearly two thirds of its 140
graduates in 2003 and continued upward trend has significant
effects.
Figure 16. Number of letters of good standing requested in
Ghana by Pharmacists.Source: Pharmacy Council and Ministry of Health, Ghana (2005).
3.5 Ireland
The number of foreign pharmacists registering in Ireland has
almost doubled since 2001. Foreign pharmacists constitute
almost half of the number of registered pharmacists in the
country. A new pharmacy school was opened in 2006 to supply
more trained pharmacists. Pharmacists from the United
Kingdom (276) made up half of the foreign pharmacists whose
country of origin was recorded by the Society. Pharmacists
trained in Spain, Australia and New Zealand were the other
most common. Ireland loses a significant proportion of its
workforce to migration each year. Between 2001 and October
2005, 113 Irish pharmacists registered in the United Kingdom
alone, over a third of the number graduating in the same period
(source: Royal Pharmaceutical Society of Great Britain, 2005).
Figure 17. Number of pharmacists entering the workforce
in Ireland from 2001 - 2004.Source: Pharmaceutical Society of Ireland (2005).
3.6 Kenya
The Kenyan Pharmacy and Poisons Board estimates that over
190 pharmacists have migrated abroad in the last ten years,
a loss that is equivalent to the total number of pharmacists
that were trained since 2000. Kenya receives around 30
applications from foreign pharmacists to register a year, half
of these are successful. This can equate to half the number of
pharmacists graduating. Most of the foreign pharmacists are
from India or Kenyan pharmacists who have trained in India.
3.7 New Zealand
The number of pharmacists migrating abroad from New
0
50
100
150
200
250
2001 2002 2003 2004
Foreign Pharmacists
Graduates
0
50
100
150
200
250
300
350
0 1 1 1 1 1 1 1 1 1 1
0 0 0 0 0 0 0 0 0 0 101
0 0 0 0 0 1 1 1 1 1 1
3 1 7 7 2 3 4 0 3 2 1
140 99 136 169 164 182 230 163 170 194 170
10 20 17 11 11 20 29 42 33 54 52
0 12 5 6 1 4 8 26 28 17
9 8 7 4 4 1 31 40 27 25 6
1995 1996 1997 1998 1999 2000 2001 2002 2003 2004 2005
Newfoundlandand Labrador
Quebec
New Brunswick
Saskatchewan
Ontario
British Colombia
Alberta
Manitoba
0
10
20
30
40
50
60
70
80
90
100
2000 2001 2002 2003

Global Pharmacy Workforce and Migration Report | 25
Zealand between 2000 and 2004 has been consistently
greater than the number graduating. The migration abroad
may be mostly temporary but it is not clear and the consequent
impact on the pharmacy workforce in New Zealand is difficult
to ascertain.
Figure 18. Number of pharmacists graduating vs. migrating
abroad from New Zealand.Source: Pharmacy Council of New Zealand (2005).
Eight pharmacists were registered from Africa, Middle East
or Asia between 1980 and 1989 7. This has increased to 113
between 1990 and 1999. Most of the foreign pharmacists
that currently practise in New Zealand are from the United
Kingdom, followed by South Africa and Australia. There are
as many foreign pharmacists registered in New Zealand as
there are registered pharmacists listing overseas addresses.
Figure 19.Country of origin of registered foreign pharmacists
in New Zealand.Source: Pharmacy Council of New Zealand (2005)
3.8 United Kingdom
The number of pharmacists migrating to the United Kingdom
has increased since 2000. Although foreign pharmacists
account for less than 10% of the pharmacist workforce, this is
still a large number of pharmacists compared to other countries,
especially source countries. Pharmacists who listed an address
outside of the United Kingdom represented just over 10% of
pharmacists on the register in 20029. Over three quarters of
these are pharmacists who graduated from the UK. The United
States of America was the most common destination country
with 14% of overseas pharmacists, half of which are working
in industry or academia where registration is not required. The
number of pharmacists registering in the United Kingdom
from Zimbabwe and New Zealand accounts for the majority
of the number of pharmacists produced in those countries over
2001-2004 (figure 20). What is unknown is whether the migra-
tion is temporary or permanent. For most pharmacists register-
ing in the United Kingdom from New Zealand and Australia,
it is suspected to be temporary. The effect on these source
countries may not be as great compared with countries where
migration is more likely to be permanent, such as Zimbabwe.
Figure 20. Number of pharmacists registering in the United
Kingdom vs. graduating from source countries
between 2001 - 2004.Source: Royal Pharmaceutical Society of Great Britain, Pharmacy Council
of New Zealand, Pharmaceutical Society of Great Britain
Figure 21. Pharmacists entering the workforce per year in
the United Kingdom (2001-2004).Source: Royal Pharmaceutical Society of Great Britain
0
50
100
150
200
Graduated 98 96 88 100 158
Migrated 106 109 115 102 172
2000 2001 2002 2003 2004
0
50
100
150
200
250
300
350
400
450
500
Zimbabwe New Zealand Ireland
Graduated
Registered in UK
0
500
1000
1500
2000
Foreign Pharmacists 554 741 777 655
Graduates 1302 1643 1671 1722
2001 2002 2003 2004
Other
United Kingdom
South Africa
Australia

26 | Part 3: Migration of pharmacists
The numbers of pharmacy schools in the United Kingdom
has increased to 20 schools with more graduates each year.
Four new schools of pharmacy have yet to produce any
graduates.
Figure 22. Number of pharmacists registering each year in
the United Kingdom according to Source countries
(2001-2005 Oct).
Figure 22 demonstrates the trend over 2001-2005 of the total
number of pharmacists registering in the United Kingdom
from selected countries. Data for 2005 is incomplete for the
calendar year. Most notably pharmacists from Spain and Aus-
tralia are registering in the United Kingdom in great numbers.
3.9 Registration of foreign pharmacists
The registration requirements of foreign pharmacists varies
greatly between countries though common elements exist.
Pharmacists from countries that have reciprocal arrangements
or special recognition of their own nationals who have trained
abroad have less requirements for registration. Greater move-
ment from pharmacists of these countries can be seen where
such arrangements are present. Many countries require
foreign pharmacists to undertake pre-registration practice
training in a pharmacy setting and successful completion of
examinations and language requirements. Refer to appendix
6 for full information.
References
1. A. Meija, Migration of Physicians and Nurses: a World
Wide Picture. International Journal of Epidemiology. Vol
1978; 7(3): 207 - 215.
2. Physicians for Human Rights. An Action Plan to Prevent
Brain Drain: Building Equitable Health Systems in Africa.
June 2004. Available at:
www.phrusa.org/campaigns/aids/pdf/braindrain.pdf.
3. T. Martineau, K. Deker, P. Bundred, Briefing Note on
International Migration of Health Professionals: Levelling
the Playing Field for Developing Country Health Systems.
2002. Available at:
www.liv.ac.uk/lstm/research/documents/International
MigrationBriefNote.pdf.
4. Joint Learning Initiative. Human Resources for Health,
Overcoming the Crisis. 2004. Available at:
www.globalhealthtrust.org/Report.html.
Accessed 23 September 2005.
5. World Health Organization. The Migration of Health
Workers: An Overview. 19 May 2005 Draft.
6. D. R. Katerere, L. Matowe, Effect of Pharmacist Emigra-
tion on Pharmaceutical Services in Southern Africa.
American Journal of Health-System Pharmacists. 2003;
60: 1169-70.
7. L. Matowe, M. Duwiejua, P. Norris, Is there a solution to
the pharmacist brain drain from poor to rich countries?
The Pharmaceutical Journal. 2004; 272(7283):98-99.
Available at:
www.pjonline.com/Editorial/20040124/articles/braind
rain.html. Accessed 23 September 2005.
8. Health Care Intelligence Pty Ltd, Australia. A Study of
the Demand and Supply of Pharmacists, 2000 - 2010.
2003.
9. K. Hassell, L. Nichols, The National Workforce Census:
(4) Overseas Pharmacists - Does the 'Globalisation' of
Pharmacy Affect Workforce Supply? The Pharmaceutical
Journal 2003; (Vol 271) 183-185.
0
50
100
150
200
250
300
350
20012002200320042005-Oct
216121219
Ghana
31310
Kenya
1848302236
Nigeria
63543177
SouthAfrica
4622445
Zimbabwe
12759102211119
Austra lia
5955508230
NZ
2013221716
Irelan d
15929132315876
Spain
1930362714
Germany

Global Pharmacy Workforce and Migration Report | 27
Pharmacy technicians are defined as individuals working in
a pharmacy, who under the supervision of a licensed pharma-
cist, assist in pharmacy activities not requiring the professional
judgment of a pharmacist1. In a United States paper on phar-
macy technicians in 2002, it is stated that although pharmacy
technicians are employed in all pharmacy practice settings,
their qualifications, knowledge and responsibilities are mark-
edly diverse2. There are many issues regarding the develop-
ment of the potential of pharmacy technicians in playing a
role in health-care delivery. These issues may include the
education and training of skilled dispensing support staff,
accreditation of training institutes and certification.
There is a legal requirement for the certification of pharmacy
technicians in 13 respondent countries and most of the
countries do have some form of structured training and
curricula in place. These learning programmes usually consist
of a period of vocational training with some aspects of cont-
inuing educa-tion in a higher institution like a training
college/hospital or university. Formal technician training
programmes differ in many aspects, especially in duration.
In Europe, we observe that there are 11 countries (out of 16)
that have formal education for pharmacy technicians. In the
Western Pacific and Southeast Asia region, education is often
informal and competency requirements are based on training.
Training involves learning through specialised instruction,
repetition and practice of a series of tasks until proficiency
is achieved. Education, on the other hand, involves a deeper
understanding of a subject, based on explanation and reason-
ing, through systematic instruction and training. A distinction
between modes of training and learning needs to be made
to best prepare for the future development of pharmacy
technicians2.
Without a formal education and professional regulatory
systems in place, it is challenging to define the size of the
workforce.
FIP is proactive in recognising the need to understand the
status and development of the pharmacy technician workforce
today. A new survey has been initiated to investigate the
certification requirements and numbers of pharmacy tech-
nicians to further explore the issues highlighted in this report.
A summary of findings is provided in appendix 7.
References
1. Washington DC: Pharmacy Technician Certification
Board 1995:15
2. White paper on pharmacy technicians 2002, American
Journal of Health-System Pharmacists, Jan 2003; 60.

28 | International Pharmaceutical Federation (FIP)

Global Pharmacy Workforce and Migration Report | 29
Pharmacists play a vital role in health care systems and des-
pite variances in practices worldwide, common workforce
issues have been reported. These common workforce issues
fall under four broad themes:
1. Workforce regulation and description
2. Workforce shortage
3. Distribution imbalance
4. CPD and practice development
FIP recognises that there is a need for global concerted action
to evaluate, regulate, document and develop the pharmacy
workforce. In order to meet this need, knowledge gaps about
pharmacists, pharmacy technicians and other support staff
must be identified and filled. Without an accurate picture
and adequate monitoring or documentation systems, it is
difficult to prepare the workforce for future developments
and implement policies to correct imbalances and shortages.
Figure 23. Actions and directions: strengthening the pharmacy
workforce.
Action is required at all levels and stakeholders must collabor-
ate with a range of partners including policy makers and
training institutes to strengthen the workforce.
This is the first report to provide an international snapshot
of the pharmacy workforce to indicate trends and issues.
With this report, FIP calls for further discussion, research,
and action at a national, regional and international level on
human resources in pharmacy.
5.1 Workforce regulation and description
The pharmacy workforce should be regularly documented
at a sub-national and national level and reported to stake-
holders and policy makers. Pharmacy professional and regu-
latory bodies have an important role to play to monitor the
pharmacy workforce and develop strategies to address issues
such as shortages, skill mix and imbalances. The practice
area, practice status (practicing or non-practicing) and demo-
graphics of pharmacists should also be recorded. Many sub-
national regulatory boards did not track data on foreign
pharmacists such as the number registering per year or the
country from which they originated. This data is useful to
monitor trends in migration and understand the extent of
it. The same is also the case for pharmacists migrating abroad,
although this is more difficult to track. Data collected on
registered pharmacists by regulatory bodies should have
basic consistencies and be collated at a national level on a
regular basis if there is more than one in a country. This
information is crucial to identify issues, project future trends
and prepare the workforce at a national level, especially if
there is considerable movement between regions in a country.
The WHO Global Atlas of the Health Workforce serves as
a useful tool to examine the distribution of health profession-
als1. As of October 2004, data on the number of pharmacists
was not available from 54 countries on the Global Atlas, with
half of the missing figures from countries in the Pan Ameri-
can Region. Many reports have also cited that data was not
presented or discussed on the pharmacy workforce due to
• Collaborative action to monitor and report oninternational trends and workforce issues
• Uphold standards of practice and competencies of
health workers• Develop global workforce strategies and policy
statements
• Advocate for action at country level and providedata, tools and technical advice
• Provide a networking platform for sharing
of practices
• Institute accountable, transparent,
and enforceable regulation systems
• Consistent, regular, and systematic informa-tion gathering and reporting of workforce
numbers, demographics, distribution,
practice status, practice area• Monitor workforce generation: graduate num-
bers, number of training institutions, number
of foreign pharmacists, quality of education• Monitor workforce attrition: retirement age,
migration abroad
• Ensure systems support for CPD• Coordinate and communicate at sub-nation-
al and national levels with all stakeholders
• Identify workforce issues and undertakeresearch to better understand the situation:
rural/urban distribution imbalance, shortages
• Develop and monitor the effectiveness o fworkforce strategies
• Provide accurate and up to date infor-mation to regulatory bodies and notify
of any changes in status - migrating
abroad, career change, non-practicing• Give feedback on education, CPD, and
practice systems, policies, and pro-
grammes• Gain feedback from the public on
health services and systems
• Raise issues affecting the workforceand practice with employers and
professional associations
Internationaland regional
organisations: FIP,
WHO, ILO,IOM
Nationaland sub-national:
professional associations,regulatory bodies, ministry
o f health, 3rd party health
agencies, academicinstitutions
Pharmacyworkforce:
pharmacists, pharmacy
technicians, pharmacyassistants

30 | Part 5: Actions and Directions
lack of information. Despite the data that has been collected
from Ministries of Health in 2004, the comparison to the
number of pharmacists collected by FIP in the Global Phar-
macy Workforce and Migration Study shows an average
variance of 30% between figures leaving the accuracy of the
information available in question. Sub-national and national
regulatory bodies are in a unique position to inform their
Ministry of Health of workforce statistics. This has the down-
stream effect of inclusion in international workforce strategy
and planning reports. Documentation and recognition of the
whole pharmacy workforce is required, including technicians
and assistants.
5.2 Workforce shortage
The shortage of pharmacists is said to be due to an aging
population and increased disease burden, as well as pharmacy
specific issues such as role diversification, increasing propor-
tion of female pharmacists that are likely to work less hours
and greater time requirements of administrative work related
to managing third party payments. In many countries around
the world the number of pharmacists graduating from training
institutes are not enough to meet the rising vacancies. The
number of pharmacy schools and graduates has increased
steadily in recent years and with further schools opening,
the number of pharmacists entering the workforce will grow.
For some countries, especially those affected by high rates
of migration abroad, the loss of health professionals cannot
be abated by increasing the number of graduates due to
resource and capacity limitations. Training institutions are
also facing shortages in academic staff and are limited in
their capacity to train the required number of pharmacists
but maintain an adequate quality of education. In some
countries it has been shown that a considerable section of
the workforce is not working in pharmacy. Root causes to
attrition must be identified and trends analysed. Without
workforce retention the investment in workforce generation
is lost.
5.3 Distribution imbalance
Should trends in the imbalanced distribution and shortage
of pharmacists within countries continue; patient safety may
be compromised through the increased risk of unsafe and
stretched practices; job satisfaction reduced due to an exacer-
bation of difficult working conditions; and increases in
attrition rate may be seen due to pharmacists leaving the
country workforce through migration abroad and career
changes. Although the workforce is growing in urban areas
to meet demand within countries, this is not necessarily
matched by increases in the rural areas. Regional and rural
imbalances require greater investigation to better understand
what needs to be addressed to encourage pharmacists to
work in such areas.
5.4 CPD and practice development
Pharmacy practice in all sectors and settings should be based
on competencies and maintained through CPD. CPD systems
should be flexibile and focused on needs based learning to
ensure practicability and valid incentives. Such systems
should be designed to facilitate career development and are
also important to sustain and retain pharmacists, and increase
job satisfaction and specialisation in areas of need. It is also
important to distinguish between CPD and CE. Support for
CPD such as learning portfolios and toolkits may be useful
to manage and direct learning.
References:
1. World Health Organization. Global Atlas of the Health
Workforce. Available at:
www.who.int/globalatlas/default.asp.
Accessed 21 February 2006.

Global Pharmacy Workforce and Migration Report | 31
Appendix 1: Global Pharmacy Workforce Survey
Appendix 2: Continuing Professional Development (CPD) /Continuing Education (CE) Survey
Appendix 3: Migration Study Survey
Appendix 4a: Pharmacist densities per 100,000 population by income classification
Appendix 4b: Pharmacist densities per 100,000 population by WHO regions
Appendix 5: Summary of CPD and CE systems by country
Appendix 6: Registration of foreign pharmacists
Appendix 7: Summary of data on pharmacy technicians
Appendix 8: Acknowledgements

32 | International Pharmaceutical Federation (FIP)

Global Pharmacy Workforce and Migration Report | 33
Introduction
In preparation for the WHO World Health Report 2006, FIP intends to collect data from all its Member Organisations for a
global description of pharmacists. This questionnaire serves to find out the international distribution of pharmacists by country,
gender and skills. FIP also aims to explore the various models of continuing professional development (CPD) for pharmacists.
Human resources for health are becoming important assets for governments around the world. Recognising this, FIP
wishes to establish a global network of contact persons who are responsible for human resources issues for pharmacists
in the national associations of our member countries. Please provide information of the personnel responsible for human
resources for health in your national organisation.
For these reasons, FIP requests you to give as much information as you can and feel free to send the survey to others who
are able to provide more information.
If you prefer, you may print this survey and send it via postal service to the FIP secretariat. Please mail the completed survey to:
International Pharmaceutical Federation,
FIP World Pharmacists Count Survey,
Andries Bickerweg 5,
Postbus 84200, 2508 AE
The Hague, The Netherlands
If you experience technical problems with submitting the survey, please contact Xuanhao Chan via email: [email protected]
or via telephone: +31703021988.
Section 1: Country Information
1) Name of Country . ........................................................................................................................................................................
2) Name of your organisation .........................................................................................................................................................
3) Name of personnel responsible for human resources for health . ...........................................................................................
4) Email address . .............................................................................................................................................................................
5) Telephone number(s) ..................................................................................................................................................................

34 | Appendix 1
Section 2: Pharmacists
A pharmacist is a person licensed to practice pharmacy in your country.
Questions 7 to 9 require you to provide data on pharmacists in 2004 by total numbers and numbers by gender.
FIP requires data from 2004. If you do not have data from 2004, please state the year in which your data was from.
6) Year of data ..................................................................................................................................................................................
7) In 2004, how many pharmacists were there in your country? ................................................................................................
8) Out of the total number of pharmacists, how many of them were FEMALE? .......................................................................
9) Out of the total number of pharmacists, how many of them were MALE? ............................................................................
10) Addition comments
. ..........................................................................................................................................................................................................
...........................................................................................................................................................................................................
...........................................................................................................................................................................................................
Section 3: Pharmacy Technicians
Pharmacy technicians assist and support licensed pharmacists in the delivery of pharmaceutical care and medications to
patients.
They may work in various settings such as the hospital, community, or long-term care facilities.
FIP requires data from 2004. If you do not have data from 2004, please state the year in which your data is from.
11) Year of data ..........................
12) Is there a legal requirement for pharmacy technicians to be certified in your country?
Yes ...................... No......................
13) What is the training programme/ certification necessary to be a certified pharmacy technician in your country?
...........................................................................................................................................................................................................
14) In 2004, how many pharmacy technicians were certified in your country? .........................................................................
15) Additional comments
. ..........................................................................................................................................................................................................
...........................................................................................................................................................................................................
...........................................................................................................................................................................................................
...........................................................................................................................................................................................................

Global Pharmacy Workforce and Migration Report | 35
Section 4: Pharmacy Practice Distribution
Questions 17 to 23 require you to fill in the number of pharmacists in various pharmacy practice settings, where applicable.
FIP requires data from 2004. If you do not have data from 2004, please state the year in which your data was from
16) Year of data .................................................................................................................................................................................
17) Academic and Research
18) Community.................................................................................................................................................................................
19) Hospital ......................................................................................................................................................................................
20) Industrial....................................................................................................................................................................................
21) Regulatory ...................................................................................................................................................................................
22) Pharmaceutical Sales and Marketing .......................................................................................................................................
23) Others..........................................................................................................................................................................................
24) Additional comments
...........................................................................................................................................................................................................
...........................................................................................................................................................................................................
...........................................................................................................................................................................................................
Section 5: Continuing Professional Development (CPD)
The concept of Continuing Professional Development (CPD) can be defined as “the responsibility of individual pharmacists
for systematic maintenance, development and broadening of knowledge, skills and attitudes, to ensure continuing competence
as a professional, throughout their careers.”
25) Does your country have Continuing Professional Development (CPD) programmes for pharmacists?
Yes ...................... No......................
26) If you have answered YES in question 25, are these CPD programmes mandatory for a pharmacist licensure?
Yes ...................... No......................
If you have answered YES in question 25. FIP would like to find out more about the CPD model( s) in your country. Please
provide us with details of the person(s) whom FIP should contact for more information. (Questions 29 and 30)
A pharmacy regulatory body is the organisation responsible for the registration/ licensing of pharmacists whereby the
pharmacists are entitled to practice their profession, and for the oversight of the pharmacists' professional conduct. The
pharmacy regulatory body could be public, non- governmental or a mix of both.

36 | Appendix 1
27) Name of the national pharmacy regulatory body in your country..........................................................................................
28) If there are more than one pharmacy regulatory bodies in your country, could you please describe the relationships
between these regulatory bodies?....................................................................................................................................................
29) Name of person to contact for more information on the CPD model( s) in your country ...................................................
30) Email address .............................................................................................................................................................................
31) Additional comments .................................................................................................................................................................
...........................................................................................................................................................................................................
...........................................................................................................................................................................................................
Section 6: General Comments
32) We welcome you to provide any additional information or feedback to this survey.
...........................................................................................................................................................................................................
...........................................................................................................................................................................................................
...........................................................................................................................................................................................................
Global Pharmacy Workforce and Migration Report | 37
This survey is focused on collecting information about the various Continuing Professional Development (CPD) / Continuing
Education (CE) programmes for pharmacists in different countries.
Section 1: Respondent Information
1. Respondent Name: .......................................................................................................................................................................
2. Respondent Title and Occupation:..............................................................................................................................................
3. Email address................................................................................................................................................................................
4. Telephone/Fax..............................................................................................................................................................................
5. Name of pharmacy body (Ministry, National Institution, Professional Association, etc) .......................................................
...........................................................................................................................................................................................................
Section 2: Pharmacy Regulatory Body Description
1. How many pharmacy regulatory bodies for pharmacists (at both the national and sub-national level) exist in your country?
a. National ...................................................................................................................................................................................
b. Sub-National ...........................................................................................................................................................................
2. Please provide details of your regulatory body...........................................................................................................................
a. Full postal address ..................................................................................................................................................................
b. Phone number........................................................................................................................................................................
c. Email address ..........................................................................................................................................................................
d. URL of website (if any)...........................................................................................................................................................
e. Date when established............................................................................................................................................................
Additional information and comments (Optional)
...........................................................................................................................................................................................................
...........................................................................................................................................................................................................
...........................................................................................................................................................................................................

38 | Appendix 2
Section 3: Continuing Professional Development (CPD) /Continuing Education (CE)
The concept of Continuing Professional Development (CPD) can be defined as "the responsibility of individual pharmacists
for systematic maintenance, development and broadening of knowledge, skills and attitudes, to ensure continuing competence
as a professional, throughout their careers." In some countries, this is also referred as Continuing Education (CE).
1. Is CPD/CE mandatory for pharmacists to maintain their pharmacy license to practice?
a. Yes................................
b. No................................
2. What is/are the responsible organisation(s) for regulating CPD/CE for pharmacists? Please select as applicable.
a. Pharmacy profession (National/Sub-National pharmaceutical association)................................
b. Government (National/Sub-National Pharmacy board)................................
c. Others................................
If there are more than one pharmacy regulatory bodies in your country, please describe the relationships between these
regulatory bodies.
...........................................................................................................................................................................................................
...........................................................................................................................................................................................................
...........................................................................................................................................................................................................
Additional information and comments (Optional)
3. Is the model of CPD/CE system credits-based?
(For example, a pharmacist is required to accumulate a minimum number of credits per year)
a. Yes................................
b. No................................
4. Please describe the CPD/CE system.
(For example, in terms of the minimum requirements for CPD/CE, the value of 1 credit, the process of CPD/CE - if self-
evaluation and recording is necessary and any other useful information.)
...........................................................................................................................................................................................................
...........................................................................................................................................................................................................
...........................................................................................................................................................................................................

Global Pharmacy Workforce and Migration Report | 39
5. Who are the providers of CPD/CE programme?
...........................................................................................................................................................................................................
...........................................................................................................................................................................................................
6. Is an accreditation of the CPD providers mandatory?
a. Yes................................
b. No................................
7. Is the accreditation of the CPD providers based on established standards for pharmacy education?
a. Yes................................
b. No................................
8. If YES, which standards are followed?........................................................................................................................................
...........................................................................................................................................................................................................
9. Describe the incentives for pharmacists to undergo CPD/CE?(For example, pharmacists who complete the CPD programme will receive a certificate or a license to practice in the country)
...........................................................................................................................................................................................................
...........................................................................................................................................................................................................
10. Describe the penalties for pharmacists who do not undergo CPD/CE?(For example, the right to practice removed)
...........................................................................................................................................................................................................
...........................................................................................................................................................................................................
11. Does your association have a toolkit/package for pharmacists who undergo the CPD/CE programme?
a. Yes................................
b. No................................
If Yes, FIP would like to request you to send a CPD toolkit/package to the below address by the 9 January 2006:
To: FIP Global Pharmacy Workforce and Migration Study
International Pharmaceutical Federation (FIP)
Andries Bickerweg 5
2517 JP The Hague
The Netherlands

40 | Appendix 2
Section 4: General comments
We welcome you to provide any additional information or feedback to this questionnaire.
...........................................................................................................................................................................................................
...........................................................................................................................................................................................................
...........................................................................................................................................................................................................
...........................................................................................................................................................................................................
...........................................................................................................................................................................................................
...........................................................................................................................................................................................................
...........................................................................................................................................................................................................
...........................................................................................................................................................................................................

Global Pharmacy Workforce and Migration Report | 41
To Whom It May Concern:
The International Pharmaceutical Federation (FIP) is currently collecting data on the migration of pharmacists worldwide
with the intention to publish an international report. It is anticipated that this data will be included in the 2006 WHO
World Health Report focusing on the theme of Human Resources for Health alongside data relating to the global description,
professional development, and training of pharmacists.
The issue surrounding the migration of highly skilled professionals in the health care fields has been widely discussed in
the literature and international forums. Available data on this phenomenon has focused mainly on physicians and nurses
with little published or brought to the international agenda on the migration trends of pharmacists. Your assistance to
provide data is greatly appreciated and will contribute significantly to this research as well as to highlight the migration of
pharmacists as an important issue on an international level.
Specifically FIP is seeking data on the following:
1. The total number of registered pharmacists in your country in 2005.
2. The total number of migrant registered pharmacists in your country in 2005.
3. The number of pharmacists with an overseas forwarding address on your register.
4. The number of pharmacists graduating per year from your country from the year 2000 - 2005.
5. The number of pharmacists that registered from abroad each year in your country from the year 1995 – 2005.
6. The number of pharmacists from abroad that applied for registration from the year 1995 – 2005.
7. The countries from which pharmacists were originally registered as a pharmacist prior to application for registration
and the corresponding numbers for each country.
8. The number of pharmacists migrating from your country to another country each year from 1995 – 2005.
9. The application procedure for pharmacists from abroad to register as a pharmacist in your country.
If you have any statistics, background papers, reports or contacts that may be useful, I would be most pleased to receive them.
Please let me know by the 3rd of October if you are able to contribute data to the research. All sources will be acknowledged
in the final report. Data will be required by the 17th of October.
Thank you kindly for your assistance and consideration.
International Pharmaceutical Federation (FIP)
PO Box 84200
2508AE Den Haag
The Netherlands

42 | Appendix 4a

Global Pharmacy Workforce and Migration Report | 43
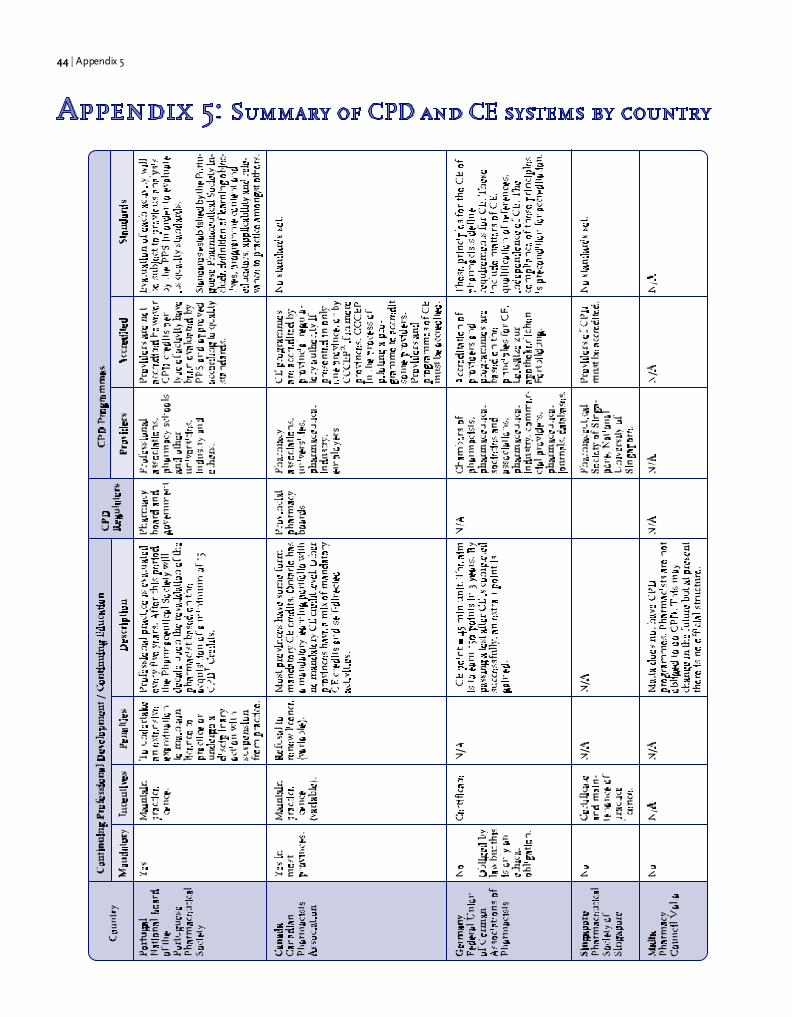
44 | Appendix 5

Global Pharmacy Workforce and Migration Report | 45

46 | Appendix 5

Global Pharmacy Workforce and Migration Report | 47

48 | Appendix 6
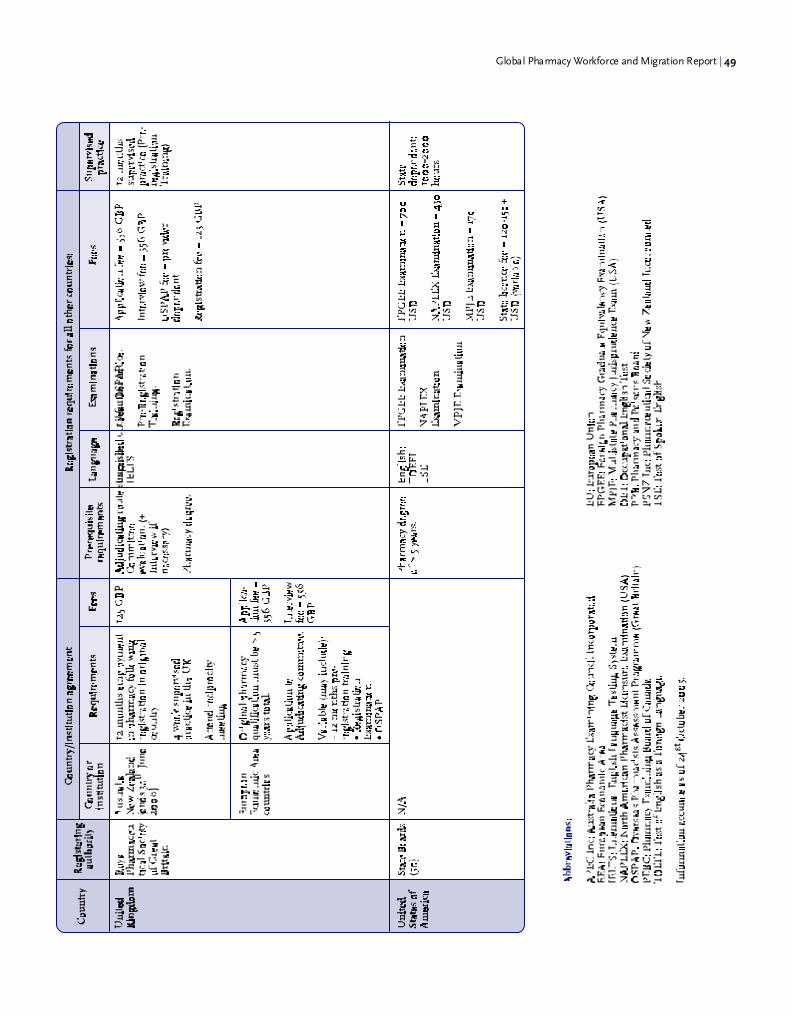
Global Pharmacy Workforce and Migration Report | 49

50 | Appendix 7

Global Pharmacy Workforce and Migration Report | 51

52 | Appendix 8
AustraliaKym Ayscough, Registrar; Pharmacy Board of New South Wales
Simon Bell, PhD Candidate; University of Sydney
Jenny Bergin, Pharmacy Guild of Australia
Bob Brennan, Registrar; Pharmaceutical Council of Western Australia
Kathryn Brims, Administration Officer; Queensland Pharmacist Board
Julie Burrows, Registration Manager; Northern Territory Pharmacy Board
Mona Hanna, Administration Officer; Jayne Wilson, Registrar; South Australia Pharmacy Board
Ross Kennedy, Pharmacy Course Coordinator, Senior Lecturer; Charles Sturt University
Dr Guy Kretschmer, Executive Officer; Council of Pharmacy Registering Authorities
Stephen Marty, Registrar; Pharmacy Board of Victoria
Frank Payne; Michele Kingi, Manager; Australia Pharmacy Examining Council
Alan Skelton, Registrar; Australian Capital Territory Pharmacy Board
Jayne Wilson, Registrar; Pharmacy Board of Tasmania
Faculty of Pharmacy, University of Sydney
Pharmacy, School of Health Sciences, University of Canberra
AustriaAndreas Kössler; Franz Biba; Austrian Chamber of Pharmacists
BrazilJaldo de Souza Santos, Conselho Federal de Farmacia
CameroonDr Bahiol Gaetan, Conceil National de L’Ordre Des Pharmciens du Cameroun
CanadaNeila Auld, Registrar; Prince Edward Island Pharmacy Board
Neetika Bains, Administrative Assistant; British Colombia College of Pharmacists
Dr David Collins, Dean; Faculty of Pharmacy, University of Manitoba
Janet Cooper; Barry Power, Director of Practice Development; Canadian Pharmacists Association
Jacqueline Cormier, Director of Licensing and member services; New Brunswick Pharmaceutical Society
France Desormeaux, Secrétaire au service de l'inscription; Ordre Des Pharmaciens du Québec
Darcie Gignac, Licensing Officer, Yukon Territory
Linda Hagen, Registry Leader; Alberta Pharmacy Board
Jeannette Hall, Registrar; North Western Territories Board of Pharmacy
Cheryl Klein, Administrative Assistant; Saskatchewan College of Pharmacists
Ushma Rajdev, Council and Executive Liaison; Jacquei Fletcher, Client services coordinator; Deanna Williams; Ontario
College of Pharmacists
Bev Robinson; Judy Higham, Executive Assistant; Manitoba Pharmacy Board
Donald Rowe, Secretary-Registrar; New Foundland and Labrador Pharmacy Board,
Susan Wedlake, Nova Scotia College of Pharmacists

Global Pharmacy Workforce and Migration Report | 53
Côte d'IvoireLoukou Dia; Dr. Assi Gbenon Rosalie; Conseil National de l'Ordre des Pharmaciens
CyprusDr Christos Hadjimichael, Head of the Medical Representatives Course; Tertiary Education Institute, Kes College
Czech Republic
Dr M. Emmerova, The Czech Pharmaceutical Society
Denmark
Jacob Bjerg Larsen, The Association of Danish Pharmacists
Bente Frokjaer, FIP Vice-President
FinlandHarri Ovaskainen, Director for Pharmaceutical Affairs; Finnish Pharmacists' Association
France
Luc Besançon; Florence Guillier-Petit, Directors of the Professional Affairs Department; Ordre national des Pharmaciens
Germany
Dr Stephanie Kern; Dr. Berit Eyrich; ABDA - Federal Union of German Association of Pharmacists
Ghana
Brenda Dzisam, Pharmacy Council
Naana Afrakoma Frempong, Programme Officer; Ghana National Drugs Programme, Drug Policy Development Unit,
Ministry of Health
Oscar Bruce, FIP Vice-President
HungaryÉva Abay; Nemes Konrádné; Hungarian Society for Pharmaceutical Sciences
Iceland
Larus Gudmundsson, The Pharmaceutical Society of Iceland
India
Manjiri Gharat, Indian Pharmaceutical Association
Indonesia
Ahaditomo, Ikatan Sarjana Farmasi Indonesia
Iraq
Dr Ahmed Ali Ibrahim, President; Syndicate of Iraqi Pharmacists
IrelandEmma Pierce, Registration Administrator; John Byan; Pharmaceutical Society of Ireland
Orla Sheehan, Director; Irish Centre for Continuing Pharmaceutical Education
54 | Appendix 8
IsraelDani Ngugh; Batia Harao; Howard Rice, Past chairman; Pharmaceutical Association of Israel
ItalyGiuseppe Impellizzeri, Director; , Federfarma
JapanJapan Pharmaceutical Association
KenyaDr Larry Kimani, Pharmaceutical Society of Kenya
Dr Ahmed Ibrahim Mohamed, Pharmacy and Poisons Board
Tom Mwangi, Hospital Pharmacist
Kuwait
Dr Douglas Ball, Associate Professor; Faculty of Pharmacy, Kuwait University
Madagascar
Mamy Rarison; Andrianandrasana Ramiaramanana; Order National Des Pharmaciens
Malta
Joseph Busuttil, Registrar; Pharmacy Council
Nepal
Dr Panna Thapa, Associate Professor, Kathmandu University
New Zealand
Dr Pauline Norris, Senior Lecturer; University of Otago
Claire Paget-Hay, Administration Manager; Pharmacy Council
NorwayEllen Finstad, Norwegian Pharmacy Association
PortugalHumberto Martins; Ivana Silva, Professional Secretary; Ordem dos Farmacêuticos
SingaporeStella Tan, Assistant Admin Manager; Ms Ang Hui Gek, Chief Pharmacist; Pharmaceutical Society of Singapore
South AfricaDr.Fourie, Registrar; Marie Japp; Rhodes University
Isobel Lemmer, Secretary, Pharmacy faculty, Nelson Mandela Metropolitan University, Port Elizabeth
Thereisa Mathai, Secretary, Pharmacy School, Tshwane University of Technology
S Smith; Aboobakhar Mohamed Alli; Department of Health
Nadien Tromp; Trisha Maharaj; Debbie Scott; Dorcas Magagula; South African Pharmacy Council

Global Pharmacy Workforce and Migration Report | 55
SwitzerlandMarcel Mesnil, Société Suisse des Pharmaciens
China TaiwanWen-Shyong Liou, President; Taiwan Society of Health-System Pharmacists
ThailandProfessor Sodsai Asravilai, The Pharmaceutical Association of Thailand Under, Royal Patronage
TurkeySanem Asli Yurur, Turkish Pharmacists' Association
UgandaJoseph John Paul Serutoke, Pharmacist; WHO Country Office
James William Tamale, Secretary; Pharmaceutial Society of Uganda
United Kingdom
Ann Lewis, Secretary and Registrar; Dr Peter Wilson, Head of Post-registration Division; Richard Anderson, Registration
Assistant; Royal Pharmaceutical Society of Great Britain
Uruguay
Eduardo Savio, Asociación de Química y Farmacia del Uruguay
United State of America
Michael Burleson, Executive Director; Kentucky Board of Pharmacy
David Dryden, Executive Secretary; Delaware Board of Pharmacy
Michael Roy Hunt, Licensing Representative; Oregon Board of Pharmacy
Chandra Loyd, Programme manager; Foreign Pharmacy Graduate Examination Committee
Daisy King, Regulatory Supervisor; Florida state pharmacy board
Lucinda Maine, Executive Vice President; American Association of Colleges of Pharmacy
Diane Miller, Commissioners Office; Pennsylvania Board of Pharmacy
Ellen Mitchell, Licensing Coordinator; Idaho State Board of Pharmacy
Lawrence Mokhiber, Executive Secretary; New York State Board of Pharmacy
Michael Rouse, Assistant Executive Director; Accreditation Council for Pharmacy Education
Elizabeth (Scotti) Russel, Virginia State Pharmacy Board
April Shaughnessy; Gwen Norheim, Knowledge management specialist; American Pharmacists Association
Cathy Stella, Director of Administrative Services; Texas Board of Pharmacy
Laura Sturick, Administrative Assistant; Georgia Board of Pharmacy/Nursing
Lee Ann Teshima, Executive Officer; Board of Pharmacy, State of Hawaii
Mary Ann Terral, Oklahoma Pharmacy Board
Johnnie Teutschman, Arizona Board of Pharmacy
Susan Warren, Colorado Board of Pharmacy
Albert Wertheimer, President; FIP Administrative Pharmacy Section
Therese Witkowski, Executive Officer; Iowa Board of Pharmacy Examiners
David R Work, Executive Director; North Carolina Pharmacy Board
Charles Young, Executive Director; Massachusetts Board of Pharmacy
56 | Appendix 8
ZambiaOliver Hazemba, President; Pharmaceutical Society of Zambia
International Organization for MigrationDr Danielle Grondin, Director; Dr Anita Davies, Public Health Consultant; Simi Arora; Migration Health Department
International Pharmaceutical Students’ FederationZhining Goh, Moving On II Research Chair
World Health OrganizationDr Mario Dal Poz, Coordinator; Hugo Mercer, Scientist; Department of Human Resources for Health, Evidence and
Information for Policy


FIPFédération Internationale PharmaceutiqueInternational Pharmaceutical Federation
Street Address:Andries Bickerweg 52517 JP The HagueThe Netherlands
Mailing address:P.O. Box 84200
2508 AE The HagueThe Netherlands
Tel.: +31-70-3021970 · Fax: +31-70-3021999E-mail: [email protected] · Website: www.fip.org