global rebalancing - results directaapa.files.cms-plus.com/seminarpresentations/2013seminars... ·...
TRANSCRIPT

www.moffattnichol.com
1
Global Rebalancing
AAPA Congresso Latinoamericano Bogota, Colombia, June 26, 2013
Dr. Walter Kemmsies, Chief Economist Moffatt & Nichol
THE WORLD ECONOMY AND ITS IMPACT ON INTERNATIONAL PORT BUSINESS
ACTIVITIES: TENDENCIES AND PERSPECTIVES
www.moffattnichol.com 2
Summary The world economy is in the process of stabilizing after a long period of runaway growth in Emerging Markets and as developed economies adjust to aging populations and changing economic bases. In the near term the US is best positioned to lead the world economic recovery.
It has been hard to adapt to a rapidly growing and changing world economy Commodity prices have become very volatile Sourcing of manufactured goods has become globally flexible
Current weak growth reflects the delicate process of global balancing Developed economies are struggling with debt and aging populations Asian economies are very dependent on exports of manufactured consumer goods Latin American exports are too concentrated in raw materials
Long term outlook is a tough call as policymakers have to deal with multiple structural problems US, Japan, Europe and Latin America need transportation infrastructure investments Private sector interest in infrastructure investment is frustrated Currency market intervention creates instability and uncertainty

www.moffattnichol.com 3
2012: the US stepped up despite fiscal obstructions Japan’s contribution is overstated because it reflects a rebound from the terrible earthquake and tsunami of 2011. Excluding Japan’s contribution, the US has singlehandedly supported global economic growth and continues to do so.
Contributions to the Change In Global Real GDP Growth in 2012
-0.30%
-0.25%
-0.20%
-0.15%
-0.10%
-0.05%
0.00%
0.05%
0.10%
0.15%
0.20%
Un
ite
d S
tate
s
Ch
ina
Jap
an
Ind
ia
Ge
rman
y
Ru
ssia
Bra
zil
Un
ite
d K
ingd
om
Fran
ce
Ital
y
Me
xico
Ko
rea
Spai
n
Can
ada
Ind
on
esi
a
RO
W
United States China Japan India
Germany Russia Brazil United Kingdom
France Italy Mexico Korea
Spain Canada Indonesia ROW
Pulling global growth up
Pulling global growth down

www.moffattnichol.com 4
The Fed set interest rates at historically low levels and monetized government debt The Fed has relatively direct control over short term interest rates. Lowering short term interest rates was not enough so it started buying Treasury bonds which pushed prices up and yields (interest rates) down. Mortgage rates and corporate borrowing rates also declined which instigated purchases of long term assets. The Fed is about to reverse these policies.
Federal Reserve’s Federal Funds Policy Interest Rate Target
0%
2%
4%
6%
8%
10%
12%
14%
16%
18%
1953
1956
1959
1962
1965
1968
1971
1974
1977
1980
1983
1986
1989
1992
1995
1998
2001
2004
2007
2010
2013
Discount Rate Fed Funds Target 10yr Treasury Yield

www.moffattnichol.com 5
US consumer spending is past the worst point Spending on major consumer goods categories is recovering as is employment. These two trends are self-reinforcing. As employment increases, consumer spending rises and companies employ more people.
US Retail, Autos and Home Sales
0
50
100
150
200
250
19
92
19
93
19
94
19
95
19
96
19
97
19
98
19
99
20
00
20
01
20
02
20
03
20
04
20
05
20
06
20
07
20
08
20
09
20
10
20
11
20
12
20
13
Real Retail
Autos
New Homes
First Time Buyer Tax Credit
Cash for Clunkers

www.moffattnichol.com 6
Europe should benefit from US trends and become less of a burden German consumer sentiment has been rising which suggests Europe’s recession may be improving. Rising US consumer spending should result in more imports from Europe, assuming the euro does not appreciate against the dollar. As Europe recovers that will also help Asia and Latin America since it should see higher import growth
Eurozone Real GDP and Export Volume Growth
-15%
-10%
-5%
0%
5%
10%
15%
19
92
19
93
19
94
19
95
19
96
19
97
19
98
19
99
20
00
20
01
20
02
20
03
20
04
20
05
20
06
20
07
20
08
20
09
20
10
20
11
20
12
Real GDP Export Volume

www.moffattnichol.com 7
Unsustainable trade deficit clouds the medium to long term outlook Even excluding the oil trade deficit, the Goods deficit is 2x the Services surplus. This has contributed to the decline in the value of the dollar.
US Trade Balance Components: 1992 -2012
-$80
-$60
-$40
-$20
$0
$20
19
92
19
93
19
94
19
95
19
96
19
97
19
98
19
99
20
00
20
01
20
02
20
03
20
04
20
05
20
06
20
07
20
08
20
09
20
10
20
11
20
12
20
13
Goods Balance Services Balance Oil Balance
Billions
38% of the trade deficit is due to oil

www.moffattnichol.com 8
Longest post-recession recovery period since 1950 Employment recoveries have been lengthening as capital and foreign labor (offshoring) reduce manufacturing employment. US workers need to seek opportunities in export-oriented industries.
0
20
40
60
80
100
120
140
160
1970
1972
1974
1976
1978
1980
1982
1984
1986
1988
1990
1992
1994
1996
1998
2000
2002
2004
2006
2008
2010
2012
2014
2016
Recession Employment (millions) Trend Forecast
18 Mos15 Mos
10 Mos
26 Mos
30 Mos
77 Mos Jun 2014?
46 Mos
US Non-farm Payrolls 1970 – 2015 And Recovery Periods

www.moffattnichol.com 9
Developed economy labor costs are not competitive It is unlikely that manufactured goods which are labor intensive will be manufactured in the US.
Manufacturing Wage Comparisons in US$ in 2008 and 2012E
$0
$5,000
$10,000
$15,000
$20,000
$25,000
$30,000
$35,000
$40,000
$45,000
$50,000
$55,000

www.moffattnichol.com 10
The Grey Tsunamis Major developed economies, have an increasing share of their populations that are of retirement age. This impacts labor markets and future public sector finances. China also has a looming problem.
Share of Population Over 55 Years Old
0%
10%
20%
30%
40%
50%
60%
1990 2000 2010 2020 2030 2040 2050
Japan
Europe
China
Canada
US
Brazil
Mexico
India
2006

www.moffattnichol.com 11
China is changing its focus from exports to domestic demand China will continue to invest in infrastructure as its capital-per-worker ratio is low, but the focus has shifted to developing domestic demand so as to be less dependent on exports. It is likely that industrial metals prices will not benefit from this trend. Energy demand will continue to grow strongly.
Investment Spending Share of GDP
Source: IMF
0%
10%
20%
30%
40%
50%
60%
2000
2001
2002
2003
2004
2005
2006
2007
2008
2009
2010
2011
2012
2013
2014
2015
2016
2017
China
Mexico
United States

www.moffattnichol.com 12
China has been losing share of US imports but does not seem to care Factories have been moving from China to India and Vietnam. Mexico has been investing in infrastructure and with its low cost base can competitively export to North and South America.
Index of US Imports From Mexico and Asian Trade Lanes (Jan 2009 = 100)
Source: IMF
20
40
60
80
100
120
140
160
180
200
1999
2000
2001
2002
2003
2004
2005
2006
2007
2008
2009
2010
2011
2012
2013
Mexico
N Asia
S Asia

www.moffattnichol.com 13
Emerging markets are the growth opportunity for mature developed economies Growing emerging market middle class consumers want the same things that their developed economy counterparts have
Real GDP Growth: 1980 -2018E
-6%
-4%
-2%
0%
2%
4%
6%
8%
10%
12%
14%
19
80
19
82
19
84
19
86
19
88
19
90
19
92
19
94
19
96
19
98
20
00
20
02
20
04
20
06
20
08
20
10
20
12
20
14
20
16
20
18
World Advanced economies Developing Asia
Source: IMF

www.moffattnichol.com 14
Developed markets can grow exports of industrial goods that are not labor-intensive Capital-labor substitution and shifts towards higher-end capital (industrial) goods underlie growing manufacturing output. North America, Europe and Japan can grow these exports with more automation.
US Manufacturing Production and Employment Indexes (1950 = 100)
0
100
200
300
400
500
600
700
800
1950
1952
1954
1956
1958
1960
1962
1964
1966
1968
1970
1972
1974
1976
1978
1980
1982
1984
1986
1988
1990
1992
1994
1996
1998
2000
2002
2004
2006
2008
2010
2012
Industrial Production Manufacturing Employment

www.moffattnichol.com 15
Commodity demand is growing faster than supply Consumption demand from Emerging Markets needs accommodation. Commodity production is capital-intensive which means they are good candidates for US exports.
Major Commodity Price Indexes (2000 = 100)
0
100
200
300
400
500
600
700
20
00
20
01
20
02
20
03
20
04
20
05
20
06
20
07
20
08
20
09
20
10
20
11
20
12
20
13
20
14
Steel scrap
Copper
Soybean Oil
Crude Oil
Meat
Natural Gas

www.moffattnichol.com 16
The Americas are a natural source of agricultural supply to Asia Agricultural productivity is rising in the Americas but weakening in Asia. The US could benefit from this but its competitors are getting ahead.
Soy Yields (Hectogram Per Hectare)
0
5,000
10,000
15,000
20,000
25,000
30,000
35,000
19
82
19
83
19
84
19
85
19
86
19
87
19
88
19
89
19
90
19
91
19
92
19
93
19
94
19
95
19
96
19
97
19
98
19
99
20
00
20
01
20
02
20
03
20
04
20
05
20
06
20
07
20
08
20
09
USA
Brazil
Argentina
Canada
World
China
Indonesia
India
Source: UN-FAO; Moffatt & Nichol

www.moffattnichol.com
Colombia’s Trade is Diversifying… Moving Downstream Imports of consumer and construction related goods have grown, but exports of mining, agriculture and industrial products remain large, staple trade volumes
0
10
20
30
40
50
60
19
99
20
01
20
03
20
05
20
07
20
09
20
11
$ B
illio
n Consumer Goods
Capital goods and construction materials
Raw materials and intermediate products
0
10
20
30
40
50
60
70
19
99
20
01
20
03
20
05
20
07
20
09
20
11
$ B
illio
n
Agriculture
Industrial Goods
Mining
Colombia’s Exports
Colombia’s Imports
Emerging Economies:
• Industrial production for local consumption • Low consumer related import demand • Limited international trade except for naturally endowed commodities
Developing Economies:
• Investment in freight movement infrastructure • Industrial production for local consumption & international export • Demand for import consumer related products increases • International trade growth mixed with export volumes of manufactured
and naturally endowed goods, as well as growing import volumes of construction and consumer related goods
Development Curve
Source: Dane, UN ComTrade

www.moffattnichol.com
Brazil Has Major Infrastructure Problems President Dilma Rouseff is trying to change a 200 year old state of insufficient infrastructure
Congestion of Principal Roadways
Source: ANTT
• Inland river system does not support Brazil’s economic needs
• Most ports do no have sufficient depth • Even after PAC programs, Brazil’s highway
system remains inadequate • Railways are inadequate for containerized
cargo
• Policies announced in 2012 could change this
www.moffattnichol.com 19
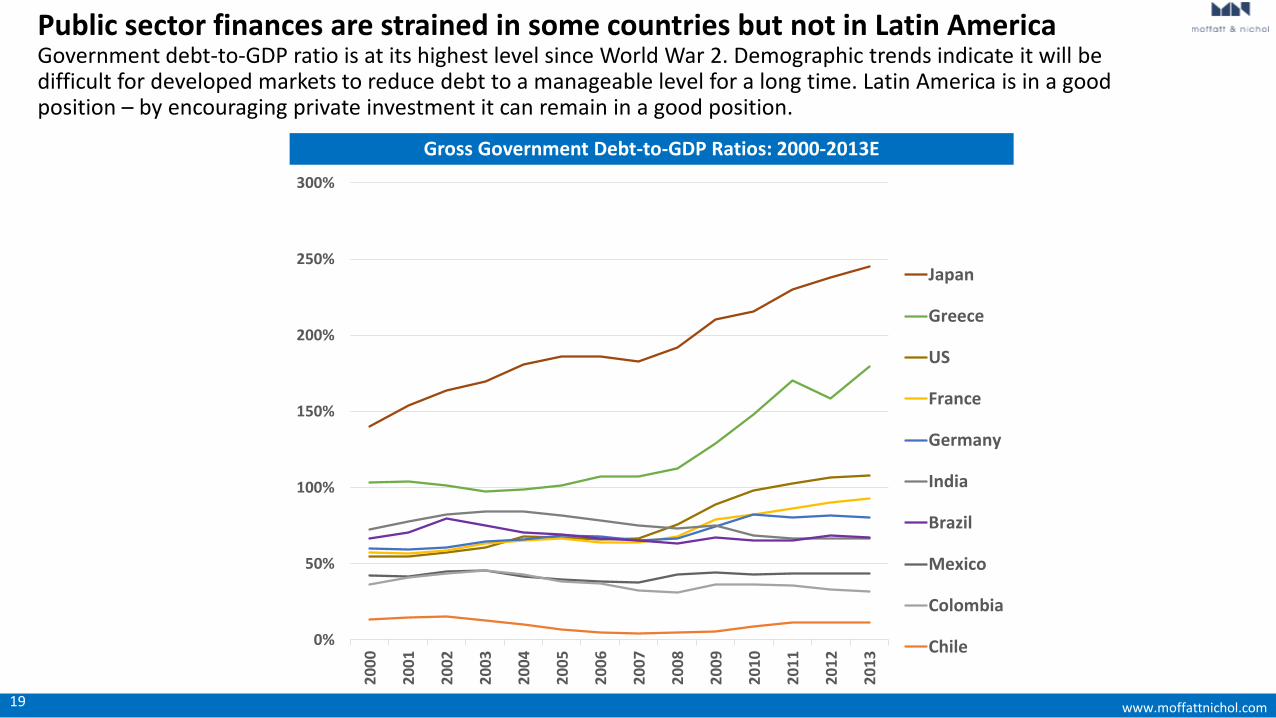
Public sector finances are strained in some countries but not in Latin America Government debt-to-GDP ratio is at its highest level since World War 2. Demographic trends indicate it will be difficult for developed markets to reduce debt to a manageable level for a long time. Latin America is in a good position – by encouraging private investment it can remain in a good position.
Gross Government Debt-to-GDP Ratios: 2000-2013E
0%
50%
100%
150%
200%
250%
300%
20
00
20
01
20
02
20
03
20
04
20
05
20
06
20
07
20
08
20
09
20
10
20
11
20
12
20
13
Japan
Greece
US
France
Germany
India
Brazil
Mexico
Colombia
Chile

www.moffattnichol.com 20
Developed economies have financial resources for infrastructure investment needs For example, US wealth is a large multiple of the amount needed to return all US infrastructure to a state of good repair as well as upgrade it to improve export competitiveness. Japan, Germany and other developed markets are in the same position.
US Total Household Net Wealth
0
10
20
30
40
50
60
70
2000 2001 2002 2003 2004 2005 2006 2007 2008 2009 2010 2011 2012
US$
Tri
llio
ns
Source: Credit Suisse Global Wealth Databook 2012; http://www.infrastructurereportcard.org/

www.moffattnichol.com 21
The public sector needs to be a good partner to the private sector Given the state of government finances, demographic trends, the stock of wealth and the substantial infrastructure investment bill, the consensus view is that Public-Private-Partnerships are the most viable solution. But the public sector has to hold up its end of any partnership. That means helping projects move quickly through the initial phases.
Risk-Responsibility Allocation Matrix
Type of Risk Permitting Planning & Geological & Construction Operational Financial Force
Responsibility Development Environmental & Completion Majeure
Government XXX XXX XX XX
General Contractor XXX XXX XXX XXX
Operator X X XXX
Investors XX XX XX XX XXX XXX
Lenders X X X XXX
Insurers X X X X XX

www.moffattnichol.com 22
Summary The world economy is in the process of stabilizing after a long period of runaway growth in Emerging Markets and as developed economies adjust to aging populations and changing economic bases. In the near term the US is best positioned to lead the world economic recovery.
It has been hard to adapt to a rapidly growing and changing world economy Commodity prices have become very volatile Sourcing of manufactured goods has become globally flexible
Current weak growth reflects the delicate process of global balancing Developed economies are struggling with debt and aging populations Asian economies are very dependent on exports of manufactured consumer goods Latin American exports are too concentrated in raw materials
Long term outlook is a tough call as policymakers have to deal with multiple structural problems US, Japan, Europe and Latin America need transportation infrastructure investments Private sector interest in infrastructure investment is frustrated Currency market intervention creates instability and uncertainty

Moffatt & Nichol was founded in 1945 to provide engineering and consultancy services to the world’s maritime industry.
Today, Moffatt & Nichol supports port and maritime projects, transportation infrastructure, coastal and environmental restorations, and waterfront developments worldwide.
Our capabilities allow us to take a project from conception, through the critical study and analysis process and on to design, engineering and program management. Clients can expect thoroughly integrated projects, completed under exacting quality control standards, with the innovation and creativity for which our firm is known worldwide.
Ports
Container Terminals
Bulk Terminals
Marinas
Ferry & Roll-On/Roll-Off Terminals
Waterfronts & Leisure Facilities
Quays & Jetties
Cruise Ship Facilities
Oil & Gas Terminals
Harbors
Rivers, Canals & Inland Waterways
Naval & Coast Guard Bases
Wind Power Development Projects
Economic & Market Studies
Inspection & Rehabilitation Projects
Dr. Walter Kemmsies, Chief Economist Moffatt & Nichol, New York 104 West 40th Street 14th Floor New York NY 10018 T 212.768.7454
www.moffattnichol.com