global renewable energy market trends and projections - international energy … · global...
TRANSCRIPT

© OECD/IEA 2014
Global Renewable Energy Market Trends and Projections
Heymi Bahar - Analyst

© OECD/IEA 20134
MTRMR 2014 scoping
Key messages to address:
What is the outlook for total renewables in the global energy mix over 2013-19 and how does this compare to other benchmarks (e.g. SE4ALL)?
What is the outlook for renewables in each sector (RES E, T & H) and their share?
How will costs of renewable technologies develop?
What are the investment needs for RES-E over 2013-19?
Similar structure to MTRMR 2013
RES-E market and technology analysis – more regional discussion; case studies only for new focus countries
RES-T market and technology analysis
RES-H market and technology analysis
Investment in renewables (largely RES-E focused)
Key dates
External review: end-June (2 weeks)
Launch: August 28, REN21 10th Anniversary event, Bonn, Germany

© OECD/IEA 20134
Renewable Electricity Capacity Forecast - Methodology
Opportunities &
Challenges
GDP & Power Demand
Power Sector Structure
Targets & Policy Environment
Economics & Financing
Grid Integration

© OECD/IEA 20134
Renewable Electricity Capacity Forecast
Capacity Database (MW)
1990-2009 2010 2011 2012 2013 2014 2015 2016 2017 2018
Historical Capacity
Recent Trends
New Additions
Forecast
Policy Targets
Project Pipeline
Capacity Ret. Rep.
Opportunities & Challenges

© OECD/IEA 20134
Renewable Electricity Generation Forecast
World (143)
Inputs
Bottom Up Calculation
Dynamic Parameters Capacity (MW) Forecast Gross Annual Additions (GAA)
• retirements& rep. • tech. lifetime
Capacity Factors applied to GAA – innovation assumptions Commissioning Time - dynamic
OECD (34) Focus (6)
Top Down Calculation
Stable Parameters Capacity (MW) Forecast Net Annual Additions (NAA) Capacity Factors applied to NAA Commissioning Time
Non-OECD (103)
Capacity Database (MW)
1990-2009 2010 2011 2012 2013 2014 2015 2016 2017 2018
Generation (MWh)
1990-2009 2010 2011 2012 2013 2014 2015 2016 2017 2018

© OECD/IEA 20134
Renewable electricity projected to scale up by 40% from 2012 to 2018
Positive outlook for renewable electricity
0%
5%
10%
15%
20%
25%
30%
0
1 000
2 000
3 000
4 000
5 000
6 000
7 000
8 000
2006 2008 2010 2012 2014 2016 2018 2020
TWh
Hydropower Bioenergy Onshore windOffshore wind Solar PV CSPGeothermal Ocean % Total generation
IEA 2° C
Scenario
Global renewable electricity production, by technology (TWh)
Gas-fired
generation 2016
Nuclear
generation 2016

© OECD/IEA 20134
MTRMR 2013: Deployment likely to grow fastest in new markets and emerging regions
This map is without prejudice to the status of or sovereignty over any territory, to the delimitation of international frontiers and boundaries and to the name of any territory, city or area.
Source: MTRMR 2013
Annual capacity additions and projection, all renewable power (GW)
© OECD/IEA 20134
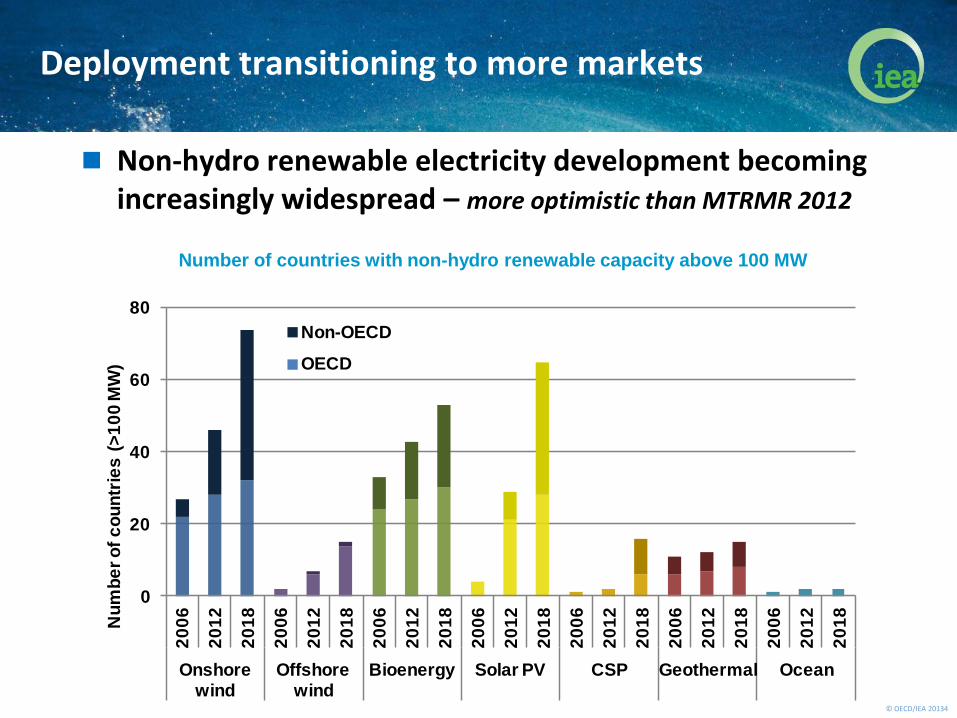
Deployment transitioning to more markets
Non-hydro renewable electricity development becoming increasingly widespread – more optimistic than MTRMR 2012
Number of countries with non-hydro renewable capacity above 100 MW
0
20
40
60
80
20
06
20
12
20
18
20
06
20
12
20
18
20
06
20
12
20
18
20
06
20
12
20
18
20
06
20
12
20
18
20
06
20
12
20
18
20
06
20
12
20
18
Onshore wind
Offshore wind
Bioenergy Solar PV CSP Geothermal Ocean
Nu
mb
er
of
co
un
trie
s (
>1
00
MW
)
Non-OECD
OECD

© OECD/IEA 20134
Some technologies are doing better than others (1/2)
Source: IEA, Tracking Clean Energy Progress 2014, forthcoming

© OECD/IEA 20134
Some technologies are doing better than others (2/2)
Source: IEA, Tracking Clean Energy Progress 2014, forthcoming
© OECD/IEA 20134
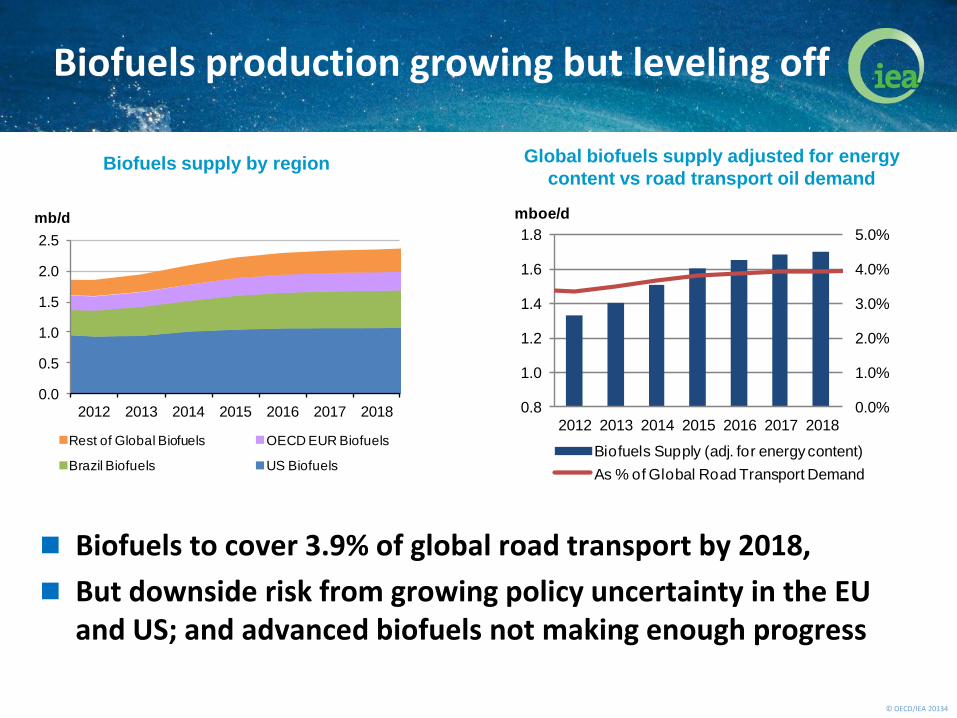
Biofuels production growing but leveling off
Biofuels to cover 3.9% of global road transport by 2018,
But downside risk from growing policy uncertainty in the EU and US; and advanced biofuels not making enough progress
0.0
0.5
1.0
1.5
2.0
2.5
2012 2013 2014 2015 2016 2017 2018
mb/d
Rest of Global Biofuels OECD EUR Biofuels
Brazil Biofuels US Biofuels
Biofuels supply by region Global biofuels supply adjusted for energy
content vs road transport oil demand
0.0%
1.0%
2.0%
3.0%
4.0%
5.0%
0.8
1.0
1.2
1.4
1.6
1.8
2012 2013 2014 2015 2016 2017 2018
mboe/d
Biofuels Supply (adj. for energy content)
As % of Global Road Transport Demand

© OECD/IEA 20134
Final energy use of renewables for heat rises by 24% As % of final energy consumption for heat, renewables rise to almost 10% in
2018, up from just over 8% in 2012 and 8% in 2006
China accounts for 39% of global growth
OECD Europe drives 22% of growth, with EU 2020 targets and rising bioenergy (direct use and commercial heat) and solar thermal use
Final energy use of renewable sources for heat (including commercial heat) by region
Note: excludes traditional biomass
1 2 3 4 5 6 7 8 9 10 11 12 13
0%
2%
4%
6%
8%
10%
12%
0
2
4
6
8
10
12
14
16
18
20
2006 2007 2008 2009 2010 2011 2012 2013 2014 2015 2016 2017 2018
% RES-HEJ
OECD Americas OECD Asia Oceania
OECD Europe China
Brazil India
Rest of non-OECD % total heat, World (right axis)

© OECD/IEA 20134
Two different worlds for RES-E markets: Stable vs Dynamic
Stable Power Systems
• Little general investment need short term
Dynamic Power Systems
• Large general investment need short term
Slow demand growth* Dynamic demand growth*
* Compound annual average growth rate 2012-20 , slow <2%, dynamic ≥2%; region average used where country data unavailable This map is without prejudice to the status of or sovereignty over any territory, to the delimitation of international frontiers and boundaries and to the name of any territory, city or area.

© OECD/IEA 20134
RE largest contributor to total electricity increase in OECD
Renewables expected to grow almost like fossil fuels in OECD Americas, and more than total demand in Europe
- 100
100
300
500
700
900
1 100
Total OECD OECD Americas OECD Asia Oceania OECD Europe
TWh
Renewables Nuclear Fossil fuels Others
Changes in power generation by source and region, OECD, 2012-18
© OECD/IEA 20134
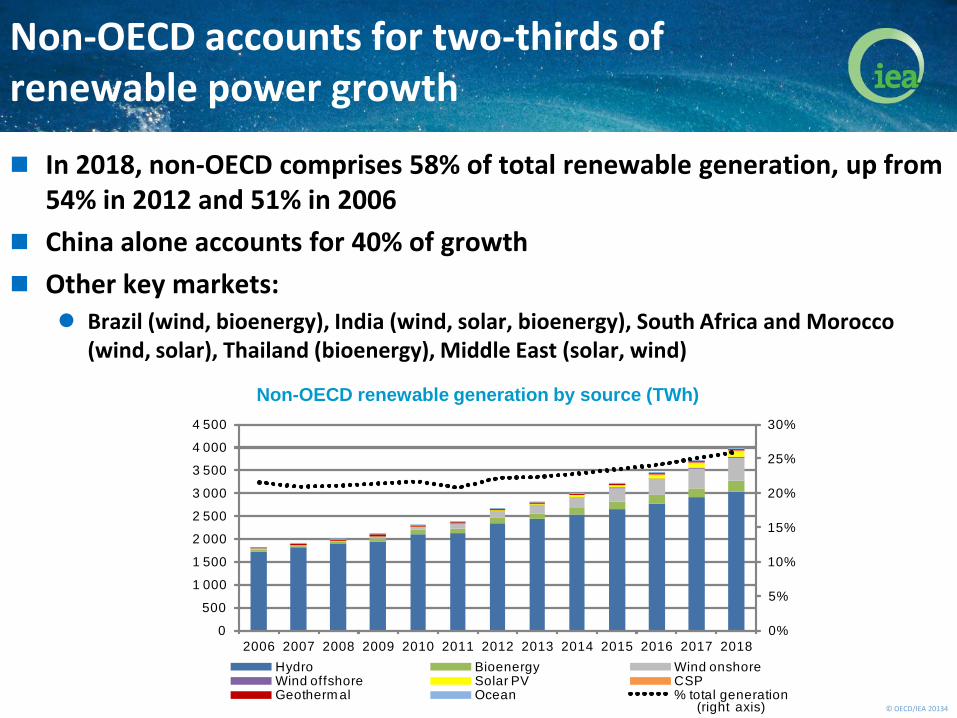
Non-OECD accounts for two-thirds of renewable power growth
In 2018, non-OECD comprises 58% of total renewable generation, up from 54% in 2012 and 51% in 2006
China alone accounts for 40% of growth
Other key markets: Brazil (wind, bioenergy), India (wind, solar, bioenergy), South Africa and Morocco
(wind, solar), Thailand (bioenergy), Middle East (solar, wind)
Non-OECD renewable generation by source (TWh)
0%
5%
10%
15%
20%
25%
30%
0
500
1 000
1 500
2 000
2 500
3 000
3 500
4 000
4 500
2006 2007 2008 2009 2010 2011 2012 2013 2014 2015 2016 2017 2018
Hydro Bioenergy Wind onshoreWind offshore Solar PV CSPGeotherm al Ocean % total generation
(right axis)

© OECD/IEA 20134
Hydropower still dominates generation BUT growth of other renewable power accelerating
Hydropower remains the largest increasing single renewable technology in electricity generation
But for the first time additional generation expected from all non-hydro sources exceeds that from hydropower; and additional capacity led by wind
Historical cumulative additions (TWh) Forecast cumulative additions (TWh)
0
500
1000
1500
2000
2500
2006 2007 2008 2009 2010 2011 2012
Geothermal Solar Bioenergy Wind Hydro
0
500
1000
1500
2000
2500
2012 2013 2014 2015 2016 2017 2018
Geothermal Solar Bioenergy Wind Hydro

© OECD/IEA 20134
Total wind installations slowed in 2013
Total wind deployment in 2013, 35.5 GW, is lower than MTRMR projection of 39 GW
Dramatic slowdown in US (1 GW vs 13 GW in 2012) due to stop-and-go policies
Installations stronger than expected in Germany, while UK, India, China were in line with expectations; China targeting 18 GW for 2014
Offshore wind development in Europe slower than expectations
Total wind (onshore + offshore) capacity projection versus current estimate, 2013
0
5
10
15
20
25
30
35
40
45
50
2012 2013 2013 Forecasted 2013 Enhanced
GW
ROW India United Kingdom Germany United States China

© OECD/IEA 20134
Onshore outlook more optimistic than in MRMR 2012
Policy uncertainties make additions volatile in some areas
Offshore wind outlook more pessimistic than MRMR 2012, with financing and integration challenges
Total wind (onshore + offshore) annual capacity additions by region (GW)
Global RE capacity additions led by wind
0
5
10
15
20
25
2007 2008 2009 2010 2011 2012 2013 2014 2015 2016 2017 2018
OECD Americas OECD Asia Oceania OECD Europe
China Rest of Non-OECD

© OECD/IEA 20134
0
5
10
15
20
25
30
35
40
45
2012 2013 2013 Forecasted 2013 Enhanced
GW
ROW Italy Germany USA Japan China
Solar PV installations for 2013 faster than MTRMR projections Estimated solar PV deployment in 2013, 37-38 GW (grid connected), is higher than
MTRMR expectation of 30 GW, but lower than enhanced case
China, Japan, and the US exceeded expectations while Germany slightly slower than expected
China installed 11.3 GW, but new builds may have been 12-14 GW, with some capacity being grid connected in 2014. China targeting 14 GW/yr for 2014
Solar PV capacity projection versus current estimate, 2013

© OECD/IEA 20134
0
1
2
2012 2015 2018
PV Annual Capacity Additions (GW)
Strong growth seen in China, Africa, Middle East, and Latin America
0
5
10
15
20
2012 2015 2018
0
1
2
3
2012 2015 2018
0
1
2
3
4
5
2012 2015 2018
0
2
4
6
8
10
2012 2015 2018
0
1
2
3
4
5
2012 2015 2018
0
2
4
6
8
10
2012 2015 2018
0
1
2
3
2012 2015 2018
0
5
10
15
20
2012 2015 2018
Solar PV growing out of Europe

© OECD/IEA 20134
But other technologies lagging behind
Potential of offshore power remains high, but technical, financial and grid connection issues pose challenges
Storage adds value to CSP, but deployment hampered by relatively high costs
0
10
20
30
40
50
60
70
80
90
2006 2007 2008 2009 2010 2011 2012 2013 2014 2015 2016 2017 2018
TWh
OECD Americas OECD Asia Oceania OECD Europe
Africa Asia China
Non-OECD Europe Non-OECD Americas Middle East
MTRMR 2012
Wind offshore generation projection Concentrating solar power generation projection
0
5
10
15
20
25
30
35
40
2006 2007 2008 2009 2010 2011 2012 2013 2014 2015 2016 2017 2018
TWh
OECD Americas OECD Asia Oceania OECD Europe
Africa Asia China
Non-OECD Europe Non-OECD Americas Middle East
MTRMR 2012

© OECD/IEA 20134
Improving competitiveness for renewable power Most dynamic technologies – onshore wind and solar PV – increasingly
competitive in a number of markets
But market framework matters
Deployment with little support occurring in some areas with rising energy needs, good resources, and predictable long-term revenues
Global levelised costs of power generation ranges (USD per MWh)
Note: costs reflect differences in resource, local conditions, and the choice of sub-technology.
MTRMR 2012
0
100
200
300
400
500
Small scaleUtility scale
© OECD/IEA 20134
0
1000
2000
3000
4000
5000
6000
7000
8000
9000
10000
11000
12000
13000
14000
2008 2009 2010 2011 2012 2013 2014 2015 2016 2017 2018 2019 2020
USD 2013/kW
GERMANY CHINA
USA JAPAN
Implied WORLD
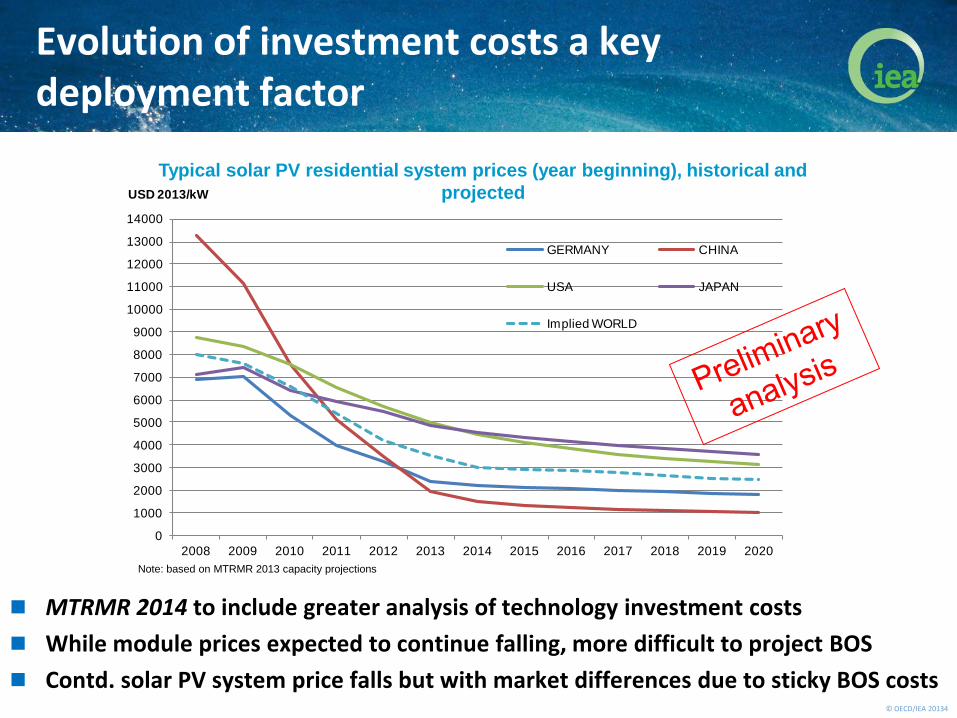
Evolution of investment costs a key deployment factor
Typical solar PV residential system prices (year beginning), historical and
projected
MTRMR 2014 to include greater analysis of technology investment costs
While module prices expected to continue falling, more difficult to project BOS
Contd. solar PV system price falls but with market differences due to sticky BOS costs
Note: based on MTRMR 2013 capacity projections

© OECD/IEA 20134
Policy uncertainty is the number one risk
0
2
4
6
8
10
12
14
1998 2000 2002 2004 2006 2008 2010 2012 2014 2016 2018
Annual additions Projected additions
Expiration of
federal PTC
Assumed expiration
of PTC at end-2013
Uncertainty over PTC
renewal at end-2012
US onshore wind annual additions (GW)
0
0.5
1
1.5
2
2.5
3
3.5
2006 2007 2008 2009 2010 2011 2012 2013 2014 2015 2016 2017 2018Annual additions Projected additions
Assumed moratorium on new projects under
Special Regime from Jan 2012 onwards
Deep financial
incentive cuts
and cap for solar
PV
Spain solar PV + CSP annual additions (GW)
Abrupt,
retroactive
policy
changes
Stop & go
policies

© OECD/IEA 20134
0%
2%
4%
6%
8%
10%
12%
14%
16%
18%
20%
Cost of Equity
Cost of Debt
WACC Cost of Equity
Cost of Debt
WACC
Germany South Africa
Cost of capital another key to reducing generation costs
Indicative nominal financing rates for new
onshore wind projects
MTRMR 2014 to include greater analysis of renewable generation costs
Further analysis needed on developments in financing risks, sources and structures and their impacts on cost of capital (CoC)….still, real CoC data points very limited!
Source: IEA estimates based on Fraunhofer (2013) and UNDP (2013)
Note: ranges are indicative; WACC is based on financing structure of
70% debt/30% equity
LCOEs for new projects vary with financing
Note: LCOEs are indicative and reflect estimated typical new plant investment
costs and full-load hours for beginning of 2014
-
20
40
60
80
100
120
140
160
180
5% 7% 9% 11% 13% 15%
USD/MWh
Weighted Average Cost of Capital
South Africa - onshore wind
Germany - onshore wind
Germany - CCGT
Germany - current
onshore wind
South Africa - current
onshore wind

© OECD/IEA 20134
Conclusions for policy-making
Many renewables no longer require high economic incentives
But they do need long-term policies that continue to provide a predictable and reliable market and regulatory framework compatible with societal goals
Consistent policy framework more important than specific RE incentive type
Competitiveness of renewables depends on market design
Fair rules for up-front capital intensive technologies and distributed generation will be key

© OECD/IEA 20134
For further insights and analysis…
The Medium-Term Renewable Energy Market Report 2013 can be purchased online at:
New report will be published – 28 August 2014
www.iea.orrg
Thank you for your attention!