global resource estimation · 2012-12-05 · 1 paper pd06 global resource estimation roy ward,...
TRANSCRIPT

1
Paper PD06
Global Resource Estimation
Roy Ward, Novartis Pharmaceuticals, Basel, Switzerland
ABSTRACT The purpose of this paper is to propose methods to control Global Resource needs. This also considers off-shored work and out-sourced work. The considers the need for a “Clinical Study/Project Management Database” where all “Study/Project” event data is stored. Discussion then turns toward the need to have trial/project life cycle stage algorithms which can produce a “First Shot Default Estimate” for trial and project level estimates. Once the “First Shot Default Estimate” is produced we consider adjusting these figures to accommodate for know deviations from the algorithms, “savings due to outsourcing” is also considered at this point. Once we have resource estimates at the Brand level we then consider the resource estimates as a TA. Given we have a statistic for the resource estimate we can then consider what our “gap” is by creating a statistic for how many resources we have on board. As a final “reality check” and to ensure the projects remain adequately resourced we consider “bottom -up” estimates and also methods to ensure resources are smoothly allocated for the forthcoming six months.
INTRODUCTION The introduction explains the purpose and scope of your paper and provides readers with any general information they need to understand your paper. The world of resource estimation is often a mysterious and bizarre combination of algorithms, guesstimates or just plain “get what you are given”. However in today’s world where “justification” is king we need to be able to prove to our seniors why we need these extra folk. No-one has the complete correct answer but we must strive to find understandable logic in order to obtain sufficient resourcing. This paper is designed to give some thought as to several method’s in how resource calculations are dealt with within the statistical and programming groups of Novartis pharmaceuticals. Additional “challenges” are considered such as factoring in “outsourcing”, “dealing with off-shoring contributions”, “modeling Japanese workload”, “non-clinical project work” and modeling the inevitable “unplanned events”.
CLINICAL STUDY/PROJECT MANAGEMENT DATABASE. It is imperative that the company as whole has a central database where relevant information is stored regarding to a project. This information is then used by the whole of the companies planning units in determining resourcing and costs for study/project conduct. Information such as Project Name, Study Name, First Patient First Visit(FPFV), Last Patent Last Visit(LPLV), Database Lock(DBL), number of patients and complexity factor(CF) should be in this database. Naturally all studies and projects have different levels of difficulties and four categories are given and these are split into the following four CF’s i) LOW, ii) MEDIUM, iii) HIGH iv) MEGA(study has +3,000 patients). For example a study allocated a LOW CF is a study which is a replica of already completed studies in which we already have programs written. MEDIUM would be a new challenging study and HIGH would be a new study which contains very complex statistical analysis or deals with lots of non-standard work.
PhUSE 2006

2
A MEGA trial is a study which has over 3,000 patients, usually lasts over a great length of time, contains many variables and naturally spawns many analysis and sub-populations etc…. This database then is highly important in driving how many resources we allocate and also how much budget is required to run the study/project. As we all know the analysis produced from data is only as good as the accuracy of the data in the database so it is vital that this information is kept up to date(otherwise you may not get any resources or money!). The responsibility of this accuracy of the database is left to the Clinical Trial Team (CTT) or more importantly the Clinical Trial Leader(CTL) Note:: Responsibility does not mean physically doing but the person who should ensure the task is completed.
FIRST SHOT DEFAULT ESTIMATES. So far we have only discussed the storage of relevant clinical trial/project management data. Now we need to introduce a “first shot default estimate”. These can be estimated based on a set of algorithms and assumptions. The algorithms are described below in the following sections. When information is downloaded from this database the algorithms are executed. One must note that these algorithms work on the basis of a start and end date of a period in the life cycle of the trial/project. This figure is then adjusted for the year in question. Generally speaking this is fine since most life cycle stages are less than a year – however we must remember this assumption when considering project level life cycle stages which do span more than a year or when we are dealing with mega-trials or Oncology trials which can span 10 years or more. Trial/Study Level. Table 1
In-house work time unit SR_BU
Study type ECD CRD
B&SR Complexity Factor Low or Ph 1 Medium High Mega Multiplication factor
0.75 1 1.5 4
Planning wd A1 A2 A3 A4
if ASD wd
Execution wd B1 B2 B3 B4 if n IAs (n>=1),
not SAD wd C1 C2 C3 C4
if ASD wd n.a. n.a.
Reporting wd D1 D2 D3 D4
if ASD wd “First Shot Default Estimates” are obtained from the table above. The top columns(second row) define the CF as discussed in the “Clinical Study Database Management Database” section. The rows determine the stage in the life cycle of a study. In Novartis we split the life cycle up into four parts.
PhUSE 2006
3
Planning – This includes events in the time period from “protocol summary” to FPFV. Naturally this is more resource intensive for our statistical colleagues as this mostly includes the setting up of the study. Statistical Programmers are involved however in tasks such as i) input to Database Quality checks to be performed by Data Management colleagues ii) matching the CRF to the protocol. Execution – This is a big chunk of statistical reporting resources. This is the time period from FPFV to DBL. In this time time period the statistical programmer is highly involved with the team in i) finalizing the report specifications, ii) Creating analysis datasets. iii) Creating output deliverables as specified in the report specifications. iv) Validating analysis datasets and output deliverables. v) dry runs vi) implement approved changes to outputs. vii) transfer data from the database to our statistical reporting system. Reporting –This also requires a big chunk of statistical reporting resources and covers the time from DBL to Clinical Trial Report in Report Depository. The Statistical Programmer is involved in the following tasks. i) Final Data Transfer. ii) Deliver all outputs to CTT. iii) Re-perform validaton. iv) Create CRT’s v) Ensure we are “audit ready”. vi) Implement approved ad-hoc requests. For sensitivity reasons the true numbers in the table have been replaced by characters. However I am sure one can gather that x3 would be greater than x1 where x= A,B,C,D. These algorithms are then coded into a system which refers to the Clinical Study Project Management Database. Using this system the algorithms are executed for each study and a resource “First Shot Default Estimate” is given. Project Level. As with trial level we can also create resource guesstimates for the project level. Given “project level needs” are much more subject to variation these are more trickier to predict with a set of rigid equations. However we must attempt to model these resource needs.
PhUSE 2006

4
Table 2 In-house work Load
Distribution time unit SR_B
U
B&SR Complexity Factor
Very Low
Low Medium High Very High
Multiplication factor f 0.25 0.5 1 2 3
Early Development (from 50 weeks prior to start of phase I to FDP)
linear wd/year A1 A2 A3 A4 A5
Full Development (from FDP to DRA submission)
48-26-26 wd/year B1 B2 B3 B4 B5
Clinical Submission (1 year prior to DRA submission)
linear wd C1 C2 C3 C4 C5
if Population PK wd
Clinical post-submission activities (DRA submission to 1 year after DRA submission)
linear wd D1 D2 D3 D4 D5
Phase IV (from DRA submission to 5 years post launch, i.e. lag time of 1 year)
67-33 wd/year E1 E2 E3 E4 E5
For the project level we consider a 5 level CF. Very low being for example a new indication of an already registered drug with minimal extra work at the project level whereas “very high” could be in-liciencing a large project which does not follow our standards and the need to merge existing data with standard data. We consider projects to have a 5 stage life cycle. Early Development - when the project is in phase I and therefore contains very little project level work for the statistical programmer. Full Development - the stage where the project enters phase II work right up to DRA submission. Naturally this takes a reasonable level of statistical programming resources for the project level. Clinical Submission - one year before DRA submission right up to submission time. This is counted as additional resourcing to the Full Development. This is arguably the most resource intensive period of the project life cycle as I am anyone who has experienced would agree. This stage contains the Summary of Clinical Safety(SCS) the Summary of Clinical Efficacy(SCE), ad submission related activities such as Health Authority visits and Briefing Book preparation. Hence this is a major time for pooling activities which naturally become challenging if standards have not been used throughout the project. Clinical Post-Submission – also require a large amount of resources and are very intense periods of work. This involves Health Authority and FDA questions. If the project has “challenges” this again can inflate the requests. Phase IV – one year after DRA submission up to five years post launch. One would hope that Health Authourity questions would have receded by this point. However publication work should be in full swing at this time point
PhUSE 2006

5
and also support Key Opinion Leader (KOL) questions comes play. Phase IV study level work should be considered at the trial level and not at this level. So now from our Clinical Study Project Management Database and associated algorithms we have achieved a “First Shot Default Estimate”. ADJUSTING FIRST SHOT DEFAULT ESTIMATE ADDING THE “FUDGE FACTOR” AND GETTING A GOOD ESTIMATE FOR THE ENTIRE PROJECT Although it would be wonderful to assume our “First Shot Default Estimates” are 100% accurate no-one is foolish enough to believe this is true (or are they?). So these estimates need to adjusted or as sometimes I call it “add the fudge factor”. To do this one has to have good first hand knowledge of the trials or projects or know someone who has this knowledge. From my experience, the “trial level” estimates are very accurate and very rarely need changing. The project level estimates are less reliable and they carry more weight/resources so generally speaking this is the area where we need to pay more attention when considering the good old “fudge factor”. Working very closely with Statistical colleagues changes are made. Table 3
The above EXCEL table is resource table shared between Statistics and Statistical programming. This is where adjustments are made. Naturally “Brand”, “Study No.” and “Description” have been changed to protect sensitive information (and protect the guilty!). FPFV, DBL and “First Shot Default Estimate” are transferred directly from our download performed earlier. “Japan” indicates if this study is conducted in Japan hence 1303 is a Japanese study. Hence study 1303 is a Japanese study with FPFV “6 March 2006” DBLock “9 Jan 2007” and has a linear resource estimate for 2007 of “0.13”. On discussion with relevant parties we have no reason to doubt this figure so we do not adjust the figure and transfer to the next column “SR GH adjusted”. However we have chosen to outsource this study so the Outsourced flag is set to Y. This results in a “savings” of resources for Statistical Programming of
PhUSE 2006

6
0.07.(figure obtained by multiplying the resource estimate by the savings estimate. Relevant information is then added to the “B&SR comment” page which may help understand the trial or decisions about the trial at a quick glance. This process is then repeated for all studies within the project. The sum of resource needs at the trial level for a project is then calculated automatically and can be seen here as 1.08. Hence for Project A the sum of resources needed fo r 2007 at the trial level is 1.08.
PhUSE 2006

7
Table 4
Within the same EXCEL spreadsheet we have a second TAB. This TAB deals with Project level resourcing. With reference to table 4 and project B we see that our “First Shot Default Estimate” gives us no resources for “Clinical Submission” However we know we have a Japanese submission in 2007 and therefore we adjust this estimate to an estimate consistent with our algorithm. Hence our underlying Clinical Trial/Project Management Database is NOT sensitive enough to pick this information up. Hence our decision to “review” is justified. So our total resource estimates for project B at the project level is 0.69. The TAB is table 4 is dynamically linked to the TAB in table 3 hence if we look into table 3 at project B we and look at the project level resources we find our 0.69 estimate. A simple addition then finds that for Project B Total resources required for 2007 “Linearly” are Trial + Project total = 1.08+0.69=1.77 OBTAINING AN ESTIMATE OF RESOUCING REQUIRED FOR THE WHOLE TA So now we have the information for all the individual projects within the TA. A simple summation should do the trick to give us the TA total – but we still have work to do…
PhUSE 2006

8
Table 5
Table 5 is the summation of all the project totals(again numbers have been changed to protect the guilty. So we see here that our “First Shot Default Estimates” are 100 resources but following our adjustment we believe 99 are required. Now Full Time Employees(FTE) assume that a person is constantly working on this initiative which naturally is not true. Employees take holidays and work on Non-Clinical Projects amongst other things so this figure is inflated by 33%. Hence the number of employees required for our TA’s work for 2007 is 132. We have some other calculations which now come into play. Recall our adjustments for outsourcing? This figure is also summed too and in this example is a figure of 1.33. Hence we “save” 1.33 internal headcount resources for 2007 due to outsourcing activities. Wait we are still not finished! Recall our Japanese studies? We also sum these to find that we need 1.27 headcount in Japan for our Japanese work. So this figure gives us a very good estimate for how many global resources we need. CALCULATING THE GAP . So now we know how many people we need – but how many have we got? We need a method to consider all of our global resources including off-shoring. Off-shoring resources do contribute to our resource pool and we cannot consider these resources to be unitary equal to the resources we have in the central unit. So a ratio is applied to adjust for this.
PhUSE 2006

9
Table 6
Table 6 shows the front TAB of second EXCEL spreadsheet which will help us identify our gap. If we continue we our example of Project B we can identify figures we have seen earlier.. Study Level Estimates = 1.08 Project Level Estimates = 0.69 FTE = 1.77 From table 3 we can also confirm our “resource savings due to outsourcing” for this project is 0.41. The adjusted FTE figure to give us true Headcount is 2.36. So the true Headcount I need for this project is the Headcount figure minus my outsourcing savings which is (1.77-.41)*1.33=1.81 So the true number of physical headcount I need for this project is 1.81 people. Hence this confirms our earlier calculations and is a good cross-check/validation that our figures are correct.
PhUSE 2006

10
Table 7
Now we need to consider the number of people we have on board. This figure can be found in the “Allocated SR” column in Table 6. This figure is the direct summation of several TABS for that particular project. Looking at table 7 we again find Project B. If we look across the row we find the Person B is 100% allocated to Project B. No other resource on the TAB contributes to Project B. Other TABS exist in exactly the same format. Additionally the “off-shoring” TAB exists and in here we can adjust the weighting of the resources related to the productivity of that resource. As you see in Table 7 all resources sum to a value of 1. Non-clinical project work is adjusted for so we can the estimate of the true resource contribution to the project. Returning back to Table 7 and Project B we find that our global resources for this project is 1 person. By simple mathematics then we can deuce that our gap for this project is Headcount after Outsourcing – Allocated SR = 1.81-1 = 0.81 Now if we sum these figures for all projects we find that we have a gap of 3.04 people. Final Cross-Check and Resource Balancing. This theory appears to put us in good stead for resource estimates. As mentioned at the beginning we need some form of logic to come up with a resource need. However this logic does have flaws within it. We have already mentioned the variability surrounding the project level estimates and also the assumption that resources are linearly spread across a calendar year for a life cycle stage. So we need another reality check. A good cross check is ask the Program Programmer to give resource estimates – this will highlight any major discrepancies and gives a good “bottom -up” approach to counter-balance the top down approach. Additionally to ensure resource’s are evenly balanced it is useful to plot individuals resource estimates.
PhUSE 2006
11
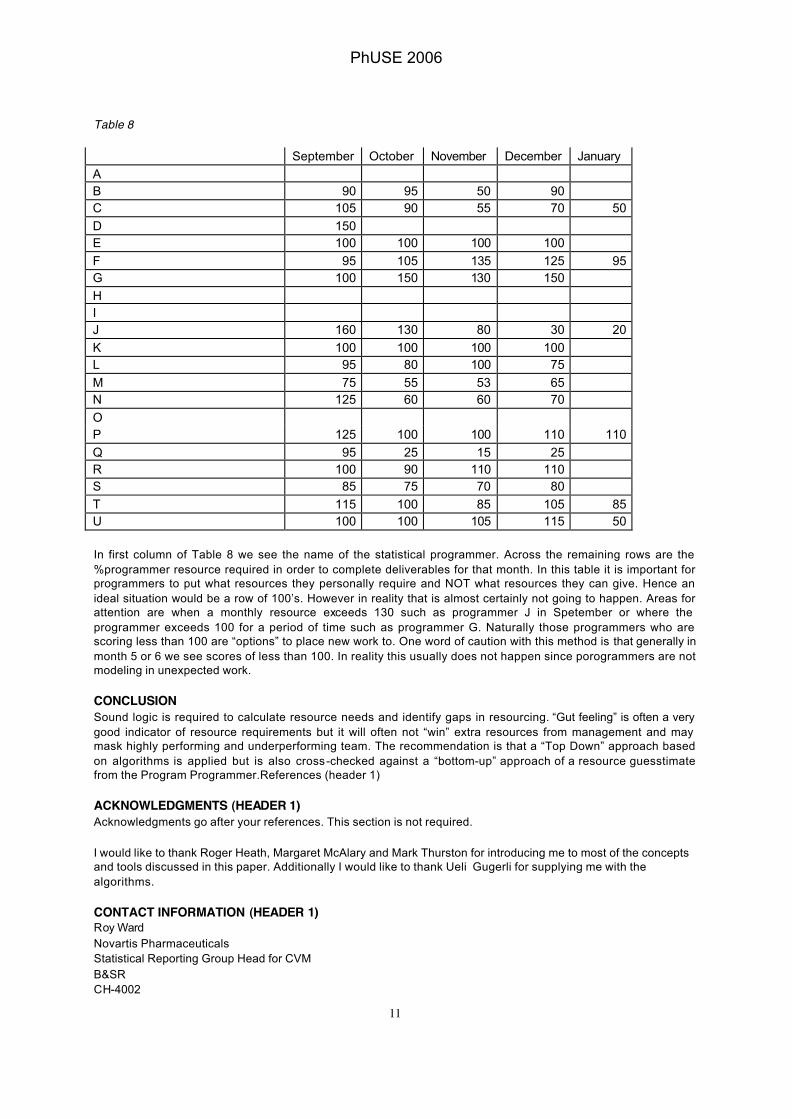
Table 8 September October November December January A B 90 95 50 90 C 105 90 55 70 50 D 150 E 100 100 100 100 F 95 105 135 125 95 G 100 150 130 150 H I J 160 130 80 30 20 K 100 100 100 100 L 95 80 100 75 M 75 55 53 65 N 125 60 60 70 O P 125 100 100 110 110 Q 95 25 15 25 R 100 90 110 110 S 85 75 70 80 T 115 100 85 105 85 U 100 100 105 115 50 In first column of Table 8 we see the name of the statistical programmer. Across the remaining rows are the %programmer resource required in order to complete deliverables for that month. In this table it is important for programmers to put what resources they personally require and NOT what resources they can give. Hence an ideal situation would be a row of 100’s. However in reality that is almost certainly not going to happen. Areas for attention are when a monthly resource exceeds 130 such as programmer J in Spetember or where the programmer exceeds 100 for a period of time such as programmer G. Naturally those programmers who are scoring less than 100 are “options” to place new work to. One word of caution with this method is that generally in month 5 or 6 we see scores of less than 100. In reality this usually does not happen since porogrammers are not modeling in unexpected work.
CONCLUSION Sound logic is required to calculate resource needs and identify gaps in resourcing. “Gut feeling” is often a very good indicator of resource requirements but it will often not “win” extra resources from management and may mask highly performing and underperforming team. The recommendation is that a “Top Down” approach based on algorithms is applied but is also cross-checked against a “bottom-up” approach of a resource guesstimate from the Program Programmer.References (header 1)
ACKNOWLEDGMENTS (HEADER 1) Acknowledgments go after your references. This section is not required. I would like to thank Roger Heath, Margaret McAlary and Mark Thurston for introducing me to most of the concepts and tools discussed in this paper. Additionally I would like to thank Ueli Gugerli for supplying me with the algorithms.
CONTACT INFORMATION (HEADER 1) Roy Ward Novartis Pharmaceuticals Statistical Reporting Group Head for CVM B&SR CH-4002
PhUSE 2006

12
Basel Switzerland [email protected] SAS and all other SAS Institute Inc. product or service names are registered trademarks or trademarks of SAS Institute Inc. in the USA and other countries. ® indicates USA registration. Other brand and product names are trademarks of their respective companies. Other brand and product names are trademarks of their respective companies.
PhUSE 2006