global rights, wrongs & returns -...
TRANSCRIPT

Please refer to page 49 for important disclosures and analyst certification, or on our website
www.macquarie.com/research/disclosures.
GLOBAL
Inside
Key Recommendations & Portfolios 2
Twilight between Ignorance & Confusion 3
FX – ‘Canary in a coalmine’ 9
What do flat yield curves tell us? 14
Five key Macro Agonies 17
The world of no earnings & high
multiples 32
Investment Strategy: Quality Growth
and Thematics 37
Appendices 45
MQ – Asia ex Quality Sustainable Growth Portfolio
Source: Bloomberg; Macquarie Research, July 2016. Refer Figure 107
Analyst(s) Viktor Shvets +852 3922 3883 [email protected] Chetan Seth, CFA +852 3922 4769 [email protected]
15 July 2016 Macquarie Capital Limited
Rights, Wrongs & Returns 2H16 – Investment Twilight zone 1H16 has thus far lived up to our expectations (Year of Living Dangerously and
sequel) that this might be a watershed year that would redefine investment styles
and reinforce our view that neither conventional mean-reversion, macro nor
momentum investment strategies are likely to work. We believe that investors
are residing in a ‘twilight’ zone between dying free market signals and the
coming era of state-driven credit, capital investment and consumption.
In our view, investors’ predicament is driven by interaction of two powerful forces
that preclude return to conventional business and capital market cycles.
First, there is a high global leverage. We describe it as a superstructure resting
on top of the underlying economy, constantly interacting with it. Global economy
has a debt burden of ~3x GDP and up to five times as much on a gross basis.
This superstructure therefore has high and unpredictable in-built volatilities,
interacting with the real economy and asset classes. Given our view that no
major economy can any longer de-leverage, volatility is unwelcome as it
undermines confidence without which further leveraging is not possible. Hence
CBs heightened sensitivity to any significant bout of volatility that might ‘infect’
cross-asset classes. As a live ‘volcano’, Debt Mountain rumbles, pouring
streams of lava that CBs work to isolate and contain. However, the need for
leveraging works against CBs by raising both frequency and strength of tremors.
Second, we do not view the current lack of productivity, as a temporary
phenomenon. Instead it is an inevitable outcome of LT secular shifts (Third
Industrial Revolution), compounded by overleveraging and the unintended
consequences of monetary policies to match stagnant demand with excess
capacity. We maintain that lack of productivity will be a consistent theme for
years to come. This will likely force CBs to maintain current monetary policies,
as the only way to avoid demand contraction and ensure that asset values are
rising to facilitate further leveraging. It is a classic ‘Catch 22’, as without
productivity, leveraging is the only way to grow but it increases volatility, flattens
yield curves, and undermines credit and in turn erodes growth rates.
We maintain that the only socially acceptable answer is what we call
‘nationalization of capital’, which in our definition implies state control over
capital allocation and spending. It is premised on the replacement of a private
sector that refuses to multiply money. Hence it will be perceived as the public
sector’s responsibility to support aggregate demand. However, as in Gresham’s
Law (‘bad money drives out good money’), an aggressive public sector lowers
the visibility of the private sector, and unless it is perceived to be temporary, the
impact is not just on visibility of demand but also on the economy’s single most
important price (cost of money). It is another ‘Catch 22’ that ultimately leads to
further capital misallocation, lower ROEs and either deflation/stagflation or
hyperinflation. Alas, there is no alternative and public stimulation of consumption,
infrastructure, R&D and bail out of the financial superstructure (all via direct CB
financing) will have a strong impact. It also creates its own investment signals.
How does one invest? We maintain that conventional mean reversion
strategies cannot work in the world of no conventional business/capital market
cycles and, given cross-currents, macro calls are also no longer possible. We
continue to highlight investment strategies based on ‘Quality Sustainable
Growth’ and pure ‘Thematics’. Our Asia ex ‘Quality’ portfolio is up ~4% YTD and
28% since inception (’13) whilst our Global ‘Quality’ portfolio is up by ~1% since
re-balancing in April and Global ‘Thematics’ is up by ~2% since launch (Jun’16).
95
100
105
110
115
120
125
130
135
Mar
-13
May
-13
Jul-
13
Sep
-13
No
v-1
3
Jan
-14
Mar
-14
May
-14
Jul-
14
Sep
-14
No
v-1
4
Jan
-15
Mar
-15
May
-15
Jul-
15
Sep
-15
No
v-1
5
Jan
-16
Mar
-16
May
-16
Jul-
16
ASXJ "Quality and Stability" portfolio (rel to MSCI ASXJ, $ TR basis)

Macquarie Research Rights, Wrongs & Returns
15 July 2016 2
Key Recommendations & Portfolios
Fig 1 MQ ASXJ ‘Quality’ Portfolio (July 16) Fig 2 MQ Global ‘Quality’ Portfolio (July 16)
Source: Macquarie Research, July 2016 Source: Macquarie Research, July 2016
Fig 3 MQ ASXJ ‘Thematics’ Portfolio (April 16) Fig 4 MQ Global ‘Thematics’ Portfolio (April 16)
Source: Macquarie Research, July 2016 Source: Macquarie Research, July 2016
Fig 5 MQ Asia ex JP – Country Allocation (%)
Source : Macquarie Research, July 2016
Code Company Name Reco. Analyst Name Country
700 HK Tencent O/P Wendy Huang HONG KONG
2330 TT TSMC O/P Patrick Liao TAIWAN
ST SP SingTel O/P Prem Jearajasingam SINGAPORE
ITC IN ITC O/P Amit Mishra INDIA
INFO IN Infosys Limited N/R Not Rated INDIA
000333 CH Midea Group (A-Share) O/P Terence Chang CHINA
035420 KS NAVER RESTRICTED RESTRICTED SOUTH KOREA
090430 KS Amorepacific O/P Kwang Cho SOUTH KOREA
MSIL IN Maruti Suzuki India O/P Amit Mishra INDIA
288 HK WH Group Ltd. (HK) N/R Not Rated HONG KONG
1044 HK Hengan O/P Linda Huang HONG KONG
GCPL IN Godrej Consumer Products O/P Amit Mishra INDIA
EIM IN Eicher Motors Ltd. O/P Amit Mishra INDIA
669 HK Techtronic Industries N/R Not Rated HONG KONG
2313 HK Shenzhou International O/P Terence Chang HONG KONG
600066 CH Zhengzhou Yutong Bus (A) O/P Zhixuan Lin CHINA
1193 HK China Resources Gas O/P Candice Chen HONG KONG
1999 HK Man Wah O/P Timothy Lam HONG KONG
5347 TT Vanguard Neutral Patrick Liao TAIWAN
HTHT US China Lodging Group O/P Timothy Lam CHINA
Code Company Name Reco. Analyst Name Country
GOOGL US Alphabet O/P Ben Schachter UNITED STATES
MSFT US Microsoft Neutral Sarah Hindlian UNITED STATES
JNJ US Johnson & Johnson N/R Not Rated UNITED STATES
FB US Facebook O/P Ben Schachter UNITED STATES
700 HK Tencent O/P Wendy Huang HONG KONG
ORCL US Oracle O/P Sarah Hindlian UNITED STATES
DIS US The Walt Disney Company Neutral Tim Nollen UNITED STATES
V US Visa Inc. Class A N/R Not Rated UNITED STATES
2330 TT TSMC O/P Patrick Liao TAIWAN
AMGN US Amgen Inc. N/R Not Rated UNITED STATES
NOVOB DC Novo Nordisk A/S Class B N/R Not Rated DENMARK
OR FP L'Oréal Neutral Toby McCullagh FRANCE
MA US MasterCard Class A N/R Not Rated UNITED STATES
BAYN GR Bayer AG N/R Not Rated GERMANY
MC FP LVMH O/P Daniele Gianera FRANCE
NKE US NIKE O/P Laurent Vasilescu UNITED STATES
ST SP SingTel O/P Prem Jearajasingam SINGAPORE
ADP US Automatic Data Processing N/R Not Rated UNITED STATES
AIR FP Airbus Group SE N/R Not Rated NETHERLANDS
FDX US FedEx O/P Kelly Dougherty UNITED STATES
INFO IN Infosys Limited N/R Not Rated INDIA
CON GR Continental AG N/R Not Rated GERMANY
4503 JP Astellas Pharma Inc. N/R Not Rated JAPAN
ADS GR adidas O/P Andreas Inderst GERMANY
4452 JP Kao Corp. N/R Not Rated JAPAN
WPP LN WPP O/P Tim Nollen UNITED KINGDOM
NVDA US NVIDIA O/P Deepon Nag UNITED STATES
6981 JP Murata Mfg O/P George Chang JAPAN
EA US Electronic Arts O/P Ben Schachter UNITED STATES
ILMN US Illumina, Inc. N/R Not Rated UNITED STATES
MSIL IN Maruti Suzuki India O/P Amit Mishra INDIA
HO FP Thales SA N/R Not Rated FRANCE
COLOB DC Coloplast A/S Class B N/R Not Rated DENMARK
CAP FP Cap Gemini SA N/R Not Rated FRANCE
7741 JP HOYA O/P Damian Thong JAPAN
8035 JP Tokyo Electron O/P Damian Thong JAPAN
IPG US Interpublic Group O/P Tim Nollen UNITED STATES
EIM IN Eicher Motors Ltd. O/P Amit Mishra INDIA
669 HK Techtronic Industries Co., Ltd. N/R Not Rated HONG KONG
2313 HK Shenzhou International O/P Terence Chang HONG KONG
Ticker Name Country Ticker Name Country
Security, Prisons and Bullets Robots, Industrial, Automation and Technology
2357 HK AviChina China 300124 CH Shenzhen Inovance China
002415 CH Hikvision China HOLI US HollySys Automation Tech. China
2634 TT Aerospace Industrial Development Taiwan 002241 CH GoerTek China
047810 KS Korea Aerospace Industries Korea 2049 TT Hiwin Technologies Taiwan
079550 KS LIG NEX1 Korea 2308 TT Delta Electronics Taiwan
STE SP ST Engineering Singapore 1590 TT AirTAC Taiwan
Educational & Training services Shifts in manufacturing migration/competitiveness
EDU US New Oriental Education & Tech. China 2333 HK Great Wall Motor Company China
XRS US TAL Education Group China 600066 CH Zhengzhou Yutong Bus (A-Share) China
NORD US Nord Anglia Education China 600031 CH Sany Heavy Industry China
Environmental Constraint 425 HK Minth Group China
2208 HK Xinjiang Goldwind China 2382 HK Sunny Optical China
2688 HK ENN Energy China 1766 HK CRRC Corp Ltd China
3800 HK GCL-Poly Energy China 2313 HK Shenzhou International China
257 HK China Everbright International China 1476 TT Eclat Textile Taiwan
1193 HK China Resources Gas China 600741 CH Huayu Automative China
958 HK Huaneng Renewables China 3606 HK Fuyao Glass China
SIIC SP SIIC Environment Singapore Demographics
EDC PM Energy Development Philippines 2628 HK China Life Insurance China
MWC PM Manila Water Philippines 300015 CH Aier Eye Hospital Group Co. Ltd. China
Entertainment Services GE SP Great Eastern Holdings Ltd Singapore
1970 HK IMAX China China RFMD SP Raffles Medical Group Singapore
002739 CH Wanda Cinema China BDMS TB Bangkok Dusit Medical Services Thailand
700 HK Tencent China BH TB Bumrungrad Hospital Thailand
NTES US Netease.com China IHH MK IHH Healthcare Bhd Malaysia
GENM MK Genting Malaysia Malaysia KPJ MK KPJ Healthcare Malaysia
079160 KS CJ CGV Korea FORH IN Fortis Healthcare India
Ticker Name Country Ticker Name Country
Theme 1: "Replacing Humans": Robots, Industrial Automation & AI Theme 4: "Bullets and Prisons": Defense, Security, Prisons/Correction Centres
ABBN VX ABB Ltd. Switzerland 047810 KS Korea Aerospace Industries, Ltd. South Korea
300024 CH SIASUN Robot & Automation A China 002415 CH Hangzhou Hikvision Digital A China
6506 JP Yaskawa Electric Corp. Japan LMT US Lockheed Martin Corporation United States
ISRG US Intuitive Surgical, Inc. United States RTN US Raytheon Company United States
SIE GR Siemens AG Germany NOC US Northrop Grumman Corporation United States
HON US Honeywell International United States HO FP Thales SA France
6503 JP Mitsubishi Electric Corp. Japan ESLT IT Elbit Systems Ltd Israel
6645 JP OMRON Corporation Japan CXW US Corrections Corporation of America United States
300124 CH Shenzhen Inovance Tech. A China GEO US GEO Group Inc United States
1590 TT AirTAC Taiwan Theme 5: "Education & Skilling"
NVDA US NVIDIA Corporation United States PSON LN Pearson PLC United Kingdom
MLNX US Mellanox Technologies, Ltd. Israel JW/A US John Wiley & Sons, Inc. Class A United States
Theme 2: "Augmenting Humans": Genome/Biotechnology/DNA sequencing EDU US New Oriental Education & Tech. Sp ADR China
AMGN US Amgen Inc. United States XRS US TAL Education Unspons. ADR Class A China
BIIB US Biogen Inc. United States NORD US Nord Anglia Education, Inc. Hong Kong
ABBV US AbbVie, Inc. United States WKL NA Wolters Kluwer NV Netherlands
ILMN US Illumina, Inc. United States Theme 6: "Demographics": Funeral Parlours and Psychiatric Centres
Theme 3: "Opium of the people": Games, Casinos/Virtual Reality 1448 HK Fu Shou Yuan International Group Ltd. China
700 HK Tencent Holdings Ltd. China SCI US Service Corporation International United States
ATVI US Activision Blizzard, Inc. United States UHS US Universal Health Services, Inc. Class B United States
EA US Electronic Arts Inc. United States ACHC US Acadia Healthcare Company, Inc. United States
NTES US NetEase, Inc. Sponsored ADR China Theme 7: "Disruptors & Facilitators"
7974 JP Nintendo Co., Ltd. Japan AMZN US Amazon.com, Inc. United States
LVS US Las Vegas Sands Corp. United States TSLA US Tesla Motors, Inc. United States
1928 HK Sands China Ltd. Macau FB US Facebook, Inc. Class A United States
002241 CH GoerTek Inc. Class A China CRM US salesforce.com, inc. United States
NFLX US Netflix, Inc. United States
GOOGL US Alphabet Inc. Class A United States
-2 -1 0 1 2 3
India
Philippines
Taiwan
China
Korea
Malaysia
Singapore
Thailand
Hong Kong
Indonesia

Macquarie Research Rights, Wrongs & Returns
15 July 2016 3
Twilight between Ignorance & Confusion “In the middle of the journey of our life I found myself within a dark woods where the
straight-way was lost” Dante Alighieri;
“There is a fifth dimension beyond which is known to man...is the middle ground
between the pit of man’s fears and the summit of his knowledge”, Twilight Zone
The last several weeks were exceptionally interesting. Following Brexit, virtual implosion of
the Italian and Portuguese banking sectors and poor May payrolls, investors witnessed a
jump in June payrolls as well as full panic mode by the central banks and public authorities,
including: (a) expected BoE easing; (b) potential Japanese “helicopter money”; (c) growing
calls for public/taxpayer re-capitalization of the Eurozone banking sector; (d) expectations of
further easing in a plethora of countries including Korea and Singapore; India and Australia;
and (e) acceptance that the Fed cannot tighten.
The result was that correlation between asset classes jumped, with both risk-on and risk-
off assets delivering strong returns:
1. Equities recaptured pre-Brexit highs, driven by the perception that central banks and public
instrumentalities would panic sufficiently not to worry about asset bubbles, and hence so
long as corporates can squeeze-out even tiny EPS growth rates, the stage is set for a
further equity rally;
2. Global Bonds delivered some of the strongest gains ever, as yields collapsed across the
entire term structure for both DM and most EMs. Given that over US$12 trillion of sovereign
bonds are now trading at negative yields, the chase for yields has been exerting massive
gravitational pull. At the same time, term premium has collapsed (in the case of the US into
deeply negative territory) as investors accepted that risks of CBs tightening is virtually non-
existent whilst at the same time investors do not currently see any signs of inflationary
surprises (refer discussion below);
3. Gold has also delivered strong returns, driven by investor understanding that the current
policies would ultimately result in either deflation or stagflation or hyperinflation (all good
outcomes for gold).
Can one make any sense of these erratic changes? Our answer is no.
“You are travelling into another dimension...Your next stop is the twilight zone” – quote from The Twilight Zone
As in the ‘Twilight Zone’ TV series or in Dante’s description of the after-life above, we believe
that investors find themselves in a no man’s land, residing in the twilight zone between
relatively free market capitalist economies (with its own set of investment signals, such as
spreads, mean reversion, risk-return trade-off) and the environment which is completely
dominated by the state (with its own distinct set of signals)
Although most free market signals have been weakening for a decade, we maintain that over
the next one or two years, free market signals would finally perish (never to be resurrected
again or at least not in our life time). As we have discussed over the last 12 months, we
believe that the global economy is shifting in the direction of “nationalization of capital and
credit”. In other words, the pendulum is rapidly shifting in favour of the state, as it did after
1933-34 FRD’s New Deal and that particular period of state dominance lasted until 1979/80.
As the state becomes more dominant, it will increasingly evolve into a key source of
multiplication of money and aggregate demand. In other words, as the private sector refuses
to multiply money, the public sector would start undertaking this function.
As discussed in our prior notes, we believe that it would take the form of breaking nexus
between borrowing and spending by getting Central Banks to directly fund state investment (via
cash deposits or issuance of never to be redeemed and non-transferrable bonds) in four key
areas:
1. Stimulation of consumption (through minimum income guarantees and spending vouchers);
2. Financing of fixed asset investment and infrastructure spending;
3. Financing R&D and skilling investment; and finally
4. Rescuing and nationalizing the entire ‘bankrupt’ financial super structure, ranging from
banks to insurance and life companies to pension funds.
Last month
witnessed a jump in
cross-asset price
correlations
As in the Twilight
Zone, investors
inhabit an
intermediate stage
between degrading
market signals and
the future of direct
state control of
capital & credit

Macquarie Research Rights, Wrongs & Returns
15 July 2016 4
This would be a completely different world (far more distorted than 1930s or 1960s-70s) and
investment signals would change radically. The key questions guiding investment decisions
would not be relationship between spreads and credit risk or between volatilities and values
but rather “what does the state want to achieve and where is the state likely to direct
investment and spending flows?” Whilst there are already clear signs of these occurring
(witness the ongoing power of Central Bankers), the pendulum is likely to swing even further
in this direction. Ultimately, we believe that the entire financial superstructure would need to
be nationalized (i.e. bankers and financial players would increasingly emerge as de-facto
public servants or largely co-opted by the public sector) to ensure the availability of insurance,
life and pension products whilst controlling volatilities that can have a devastating impact on
real economies. In other words, finance would likely be perceived as far too dangerous and
important to be left to “individuals behind the screens”.
As discussed in the past (here and here) some of this government (state) hyperactivity is
inevitable, as the global economy is progressing through the final stages of what we call
“Third Industrial Revolution”, with probably a more apt description being Declining Returns
on Humans that we incorporate into our Global Thematics portfolio. As the value and the
need for human input changes and generally declines, there would be a need to address
related issues of welfare policies, state involvement in demand multiplication etc. Hence,
as productivity rates and incomes stagnate and as labour that is currently effectively
‘warehoused’ in low productivity occupations is displaced, there would be growing demand for
changes in welfare and other income support policies to support aggregate demand.
However, in other areas, such as infrastructure investment, governments are likely to
continue to embrace this method of money multiplication not because there are significant
productivity gains to be derived from (say) faster trains, but because this represents the
largest ‘bang for the buck’. One area where we believe it would make a great deal of sense to
become far more involved is R&D spending and skilling. We maintain that in most countries,
the government over the past three decades has withdrawn too much from sponsoring R&D
and ensuring skilling, but unfortunately, this type of spending tends to have long-term pay
back periods.
Thus we believe that the ultimate destination for most investors will be an increasingly more
aggressive state involvement in multiplication of aggregate demand and ensuring that
financial sector volatilities do not flow through into various cross-asset prices and do not have
a significant negative real economy impact.
However, are we there yet?
We have discussed nationalization of credit for more than a year and the latest news of
Japan’s fiscal stimulus seem to be linked in the investors’ mind with the elusive concept of
“helicopter money” and the tectonic shift towards the state. In our view, investors have not
yet reached this inflection point. It seems more likely that over the next 12-18 months,
governments will continue tinkering on the edges with “start and go” type projects (similar to
Japan’s one-off supplemental budgets). As discussed below, we also do not believe that the
Eurozone is ready to fully embrace loose fiscal policy and the outright rescue of financial and
banking sectors. China is likely to continue fine-tuning its growth, debt and liquidity whilst the
US is likely to remain torn between desire to normalize and inability to do so.
What do we need to finally enter the above described Communist or Fascist (depending on
political preferences) paradise of state controlled and directed investment and spending?
Previously we have outlined four key door-steps conditions for such a dramatic public sector
shift, with very high volatilities being the key (with other preconditions being full acceptance
by investors and principals that conventional monetary and QE policies have come to an end;
acceptance that there is no escape velocity and the need for an intellectual case to be made
for an alternative policy). It is unquestionable that commentators from both the academic and
the popular end of the spectrum (from Woodford and Turner to Larry Summers and Martin
Wolf and Krugman) have already embraced this vision of a far more powerful mix of fiscal and
monetary policies. However we are still not convinced that either investors or principals fully
accept impotence of monetary policies or their inability to generate productivity.
However, as described above, our most important reservation is that principals (and
investors) need a significant “jolt” of extreme volatilities (far more than that experienced in
Dec’15-Jan’16) to force coalescence around far more aggressive policies.
We maintain that the
pendulum is
aggressively
moving towards
state activism in...
...support of income
& consumption;
fixed asset
investment and
ultimately rescuing
the entire financial
super structure
Japan might be the
first country to
integrate, fiscal,
income support and
monetary policies
However, before
that happens, we
need to experience
much stronger
bouts of volatility

Macquarie Research Rights, Wrongs & Returns
15 July 2016 5
Whilst we don’t think that we are there yet, tremors (a la Brexit) would continue and at some
stage over the next 12 months or so, the shift is likely to occur. At that stage, a new set of
investment signals is likely to emerge. We maintain that Japan is bound to be the first country
to wholeheartedly embrace this powerful mix of fiscal, income support and monetary policies,
however, everyone eventually will likely follow the same path. It is just a matter of time (here).
Today’s close linkages between state, economy and the markets in China and to a
large extent Japan is likely to be the future for the global economy and investment.
However before arriving in a state sponsored ‘paradise’, confusion will continue to reign
In the meantime, confusion will continue to reign, as investors desperately try to find some
consistency in market signals that no longer make much sense.
Whilst understandable (finding patterns is hard wired into human and animal psyche as a key
survival strategy), it is not very useful in the world that is rapidly losing its market signals and
hence for every good bet, one usually finds two bad ones. This explains both overcrowding
and volatility spikes as investors en masse suddenly decide to reposition themselves, on the
basis of relatively small delta (news flow, economic variables or simply positioning).
For example, is recent massive flattening of yield curves signal that there would be no growth
(as it would impair the credit cycle)? The answer normally would be yes, but what if we no
longer need conventional banking and credit cycles, as governments decide and drive
investment and spending directly, largely by-passing banking and credit markets? The same
largely applies to negative interest rates. Is it a recipe for accelerated investment and
consumption or is it a mechanism that would destroy credit cycles, severely damage
insurance, life and pension industries whilst turning working capital on its head and
encourage considerable investment of energy in devising artificial means of avoidance
(such as prepayment of taxes or establishment of cash warehouses)? (refer to: What caught
my eye? v.54 - Negative rates and the war on savers 2 March 2016)
One market that we continue to believe remains relatively free is the currency market and
exchange rates would be the ‘canary in the coalmine’ (until of course this market would be
also eventually impaired through various forms of capital control, and China is already ahead
of the curve!). Therefore, the key challenge in the shorter-term is how will Central Banks
avoid severe macro cross-currents and contain currency volatilities? For example, an
aggressive push by Japan and Eurozone and any hint of Fed tightening (perhaps after
another strong payroll report) could be sufficient to accelerate US$ appreciation, whilst
potentially massively devaluing Yen and Euro. This in turn could easily display Rmb, with
7+ becoming the new 6, causing a potentially massive global deflationary wave.
Investment strategies – focus on fundamentals; or be contrarian
How does one invest in this climate? The simple answer is that one cannot invest
conventionally or at least until the new rules of the game and new investment signals
become clearer. At the same time, most other conventional strategies predicated on mean-
reversion (sector rotation; value vs growth; GARP etc) are unlikely to work. In the world that
no longer has identifiable business and capital market cycles and with most market signals
degrading, neither micro nor macro calls can be made, with any degree of certainty or
confidence.
We maintain that whilst there are severe reservations whether either macro economics or
standard finance theory reflects current reality, there is no doubt that microeconomics and
accountancy are a real science and would never go out of fashion (i.e. fundamentals never
die, although there are times when they do not work well in the investment market place).
In periods of severe dislocation (like now, as well as 1930s; 1960s-70s or Japan since 1990),
mean reversion and other conventional strategies stumble, as there is no longer any reliable
mean to revert to. Also during these dislocations, both business and capital cycles tend to be
distorted, implying severely limited ability to make sectoral calls.
We believe that the current dislocation is far more disruptive than previous episodes, simply
because, investors are encountering an unusual combination of:
1. Structural shifts (technology and declining return on humans);
In the meantime,
confusion would
reign with...
...lack of
conventional
business and capital
market cycles,
implying non-mean
reversion and
inability to make
macro calls

Macquarie Research Rights, Wrongs & Returns
15 July 2016 6
2. Over-leveraging and over-capacity, across almost every sector of service and
merchandizing economies, as well as public, finance and private sectors; and
3. Aggressive public policies designed to avoid and minimize business and capital
market cycle volatilities and dislocations.
Our long held view was that in such non-mean reversionary times with a high degree of
uncertainty, the type of investment that tends to work is the one that highlights traditional
quality and sustainable growth characteristics. At the end of the day, the only reason to have
corporates is to reduce transaction costs and deliver ROE above the cost of capital. The non-
mean reversionary times have traditionally tended to favour this type of investment (whether
American ‘Nifty Fifties’ of late 1960s-late 1970s or Japan over the last 25 years).
This has been the essence of our ‘Quality & Stability’ or ‘Quality Sustainable growth’
portfolios that we have run since early 2013.
One problem that investors usually raise with us is that investing in quality has been a
consensus idea for at least five years and hence these types of strategies are expensive and
overcrowded. We disagree. Investors seem to have various definitions of what is meant by
Quality, which in most cases strikes us as not quality at all. For example some investors
highlight lack of volatility and defensiveness. Others highlight valuations, GARP or the need
to be in every sector (selecting what these investors believe to be the best choices within
sectors) or cash flow. We do not view any of these criteria (in isolation) as being Quality.
Our definition of quality focuses purely on ROEs (not defensiveness, stability, lack of
volatility or value) and ROEs that are supported primarily by margins (not revenues) and we
try to avoid excessive and rising leverage. The only sector we dislike and ignore are financials
(as discussed above, we believe that this sector is severely impaired) but we have no
problem with any other sector, if they qualify. Do we pay attention to valuations? Not really. In
a non-mean reversionary world, valuations lose their elasticity (thus there is no difference
between say 10x and 15x), as there is no longer a reliable mean against which existing
multiples can be measured. However, we do look at valuations at extremes, and in the last
three years, whenever we overruled fundamentals because of multiples, it has almost always
ended up to be a wrong call. If our view is correct that conventional business and capital
market cycles are unlikely to return for years (and possibly decades), then there is no need
to be concerned about potential end of non-mean reversionary strategies.
As can be seen from sections below (refer discussion on stocks and methodology), this
Portfolio has survived the strongest ‘trash rally’ since 2009 (low quality outperformed high
quality in most markets by over 10% between Feb and May 2016) and it is currently returning
~400bps relative to MSCI Asia ex Japan YTD and is up 28%-29% since our launch in early
2013. Our Global version of the same portfolio was launched in late January 2016, and is
broadly Neutral YTD (and is up 100bps-200bps since our latest rebalancing in Apr’16).
The key question for us whether this portfolio would also survive eventual (and inevitable, in
our view) transition to complete dominance by public sector. Whilst there are no Western
parallels of the extent to which we think public sector would come to dominate the macro
economy and finance, we suspect that our definition of Quality might survive even state
control. The reason for this is that we are not aiming to be defensive or cheap. We are simply
looking for sustainable ROEs and hence our portfolio tends to be populated by a plethora of
IT, software, biotech/pharma, industrial and consumer discretionary stocks that have their
own volatility and growth (staples almost never make it due to declining margins and
leverage).
Another type of investment that we think investors are likely to increasingly embrace is pure
Thematics. We have been discussing Thematics for at least three years but it is only in the
last six months that investors have started to pay attention, for three reasons:
1. There is a growing realization slow productivity growth rates is not just a temporary
anomaly but rather it is the inevitable and long-term outcome of significant structural
shifts that are likely to continue dominating the economic landscape for years and
decades to come. Hence, there is a growing interest from investors to try to identify
the right Themes and participate in these long-term structural shifts.
We continue to
recommend mostly
uncorrelated
strategies of...
...’quality,
sustainable growth’
and ‘thematics’
whilst...

Macquarie Research Rights, Wrongs & Returns
15 July 2016 7
2. Given the above described volatility of macroeconomic and state-induced outcomes,
investors are exceptionally keen to adopt strategies that are independent of vagaries
of central bank cycles. Thematics, being long-term structural in nature, are some of
the least dependent on macro policy settings;
3. Thematics is also one of the most uncorrelated strategies relative to other equity
strategies.
However, as in the case of Quality, we believe that it is important to identify the ‘right’
Thematics. As discussed in our prior reviews, most of the past Thematics (such as
demographics, consumption etc) have largely outlived their usefulness. The new macro and
investment landscape is one of the constraints not opportunities.
Our preference is to invest in the Theme of ‘Declining Returns on Humans’, which include
either complete ‘replacement of humans’ (i.e. robotics, automation and AI); ‘augmentation of
humans’ (biotech, primarily genome); ‘opium of the people’ (i.e. games, consoles, artificial
reality, entertainment, gambling); ‘education and skilling’; ‘bullets and prisons’ (social and
geopolitical dislocation); ‘morbid demographics’ (funeral parlours, hospitals and psychiatric
institutions) and ‘disrupters and facilitators’.
We have been running a version of this portfolio in Asia ex Japan for almost two years
(although due to sector and stock limitations, we have also introduced a number of other
themes, such as environment and manufacturing shifts). Despite the fact that the Thematic
portfolios have no quality or any other screen and that it is inevitably tilted towards China (as
there are very few themes in ASEAN), it has performed broadly in line with the market, since
inception in Sep 2014. In June 2016, we have launched a much more focused Global
Thematics Portfolio. Thus far it is up ~2% against its benchmark (MSCI World).
One of the issues that is usually raised by clients is that both ‘Quality’ and ‘Thematics’
portfolios are viewed as long-term in nature and investors are constantly worried about
missing out on some short-term changes in direction. Our view is that long-term is now short-
term, as the current climate favour investors and penalizes traders. Hence, less is more.
However, one portfolio or strategy that could become important as we progress towards
increasing state control is the one that targets government spending and priorities. We have
experimented in the past with what we call ‘Anti Quality’ strategy (i.e. low margins, high
leverage and negative free cash flows). Indeed, by early May 2016, that screen was up by
more than 10% YTD (although it has given up some of the gains recently). It is currently
mostly populated by materials and infrastructure stocks. However, in due course this screen
could be converted into ‘Follow the Government Portfolio’, when it becomes clearer where
state priorities are likely to reside (for example split between infrastructure, income support
and other state priorities). We are reluctant to support these types of portfolios (whilst
recognizing that over time it could become a more important strategy) as it leaves investors at
the mercy of sudden and rapid shifts in state priorities.
Apart from Quality and Thematics, are there any other strategies that investors could deploy?
One of the strategies that might work is to take extreme contrarian positions. For example
should investors buy volatility, if (say) VIX approaches 12? The answer is more than likely in
the affirmative. Given that the private sector has no visibility, neither do investors and hence
there is a considerable degree of ‘overcrowding’. These contrarian positions are designed to
benefit not so much from mean reversion but rather from ‘stampedes’.
Country Allocations – we continue to like India, Philippines and to a lesser extent Taiwan & China
We continue to maintain our largest positive positions in India and the Philippines, for
several interrelated reasons:
1. As discussed below, we believe that Japan and Eurozone are likely to adopt more
aggressive monetary (and fiscal) stance. At the same time, we believe that China
would attempt to gradually bring down the Rmb without causing excessive global or
regional dislocation. This should push up the US$ (but not at a strongly accelerating
rate, as the Fed is likely to try to avoid widening the degree of monetary divergence).
In that scenario, commodity prices are likely to remain relatively range-bound and
create a Goldilocks environment for both countries (particularly India).
Preparing for
“Follow the
Government” and
“deglobalization”
strategies

Macquarie Research Rights, Wrongs & Returns
15 July 2016 8
2. In the world of no productivity growth rates, India and the Philippines are some of the
very few countries globally that are still delivering productivity gains. To some extent
this is due to the fact that both countries are some of the least developed in the
region (generally we estimate that countries with some remaining productivity gains
represent not much more than 10% of global demand). At the same time, economic
outcomes are usually an ‘afterglow’ of past structural and tactical reforms, which
unless maintained tend to peter-out within two to three years. Although we have
significant reservations regarding sustainability of structural reform agenda in either
country, it is likely that over the next two years, both would deliver strong (5%-6%,
if one ignores overstating of India’s deflators) GDP growth rates, with relatively
contained inflation.
3. Whilst both markets remain expensive and EPS estimates seem excessive (particularly
in the case of India), the degree of investor enthusiasm and expectations have declined
significantly and neither market is now significantly over bought, unlike 18 to 24 months
ago when both markets were severely over bought.
We also maintain an O/W position in China, even though we have come to conclusion over
the last 12 months that despite much cleaner ‘line of sight’ in terms of both defining and
implementing structural reforms, there is very low probability of domestic non-capital
market structural reform. As discussed below, this implies that there is no escape for China
and assuming no global recovery, it would become a question of not just the degree of slow
down but also chances of social dislocation and financial crisis.
Nevertheless, as we have highlighted in the past, large and externally competitive economies
with high saving rates do not go down easily, and in most circumstances avoid an outright
external and credit crisis but instead experience sharp and permanent slow down. We
maintain that whilst there are a number of areas where China is far worse off than Japan of
1990s (refer What caught my eye? v.60 - Parallel lives: Japan vs. China 23 June 2016), it
does have a much higher degree of monetary and currency flexibility, whilst most of China’s
corporate debt already effectively resides on state’s books.
In the world where we expect US$ to drift up and Yen down and Rmb depreciate in a
relatively orderly manner, China liquidity position is likely to be contained. At the same time,
we continue to believe that China’s interest rates would ultimately drop to zero, as capital cost
must be matched with excess capacity. In terms of market internals, neither China’s earnings
estimates nor multiples strike us as excessive (at least as far as 2016 is concerned).
On the other side, we remain reluctant to embrace Indonesia. In the three most likely currency
outcomes over the next six to twelve months, Indonesia looses in two (either temperate or
accelerated US$ appreciation and Yen depreciation). Only weakness of US$ and strength of
Yen, pushing commodity prices higher would lead to a much better outcome for Indonesian
equities. At the same time, neither EPS estimates nor valuations look attractive.
We also remain Underweight Thailand and domestic Hong Kong and Singapore and
remain broadly neutrally positioned in Malaysia and Korea.
As described in section below, at the end of the day, the key driver of our country selection is
direction and strength of currency movements. If indeed US$ appreciates gradually (rather
than sharply) and Yen as well as Rmb depreciate gradually, EM equities should perform
broadly in line with DMs. If one assumes a sharp appreciation of US$, leading to a strong
deflationary wave and contraction of global demand, then clearly EMs (particularly terms of
trade EMs) would significantly underperform DMs. We remain in the camp of either Neutral or
relative Underperformance by EM equities. Only weakness in US$ and strengthening Yen
would propel EM strongly forward, in our view.
In terms of DMs, we continue to like Japan, as we maintain that it would be the first major
country to embrace integration of fiscal, income support and monetary policies (directly
funded by BoJ, without incurring incremental debt). This should lead to significant downside
to Yen exchange rate and although other countries would follow, Japan should have the first
mover advantage. The benefit of stimulus and lower currency should in turn flow into
Japanese equities. On the other hand, we remain concerned that US equities are vulnerable
to a potentially significant pull back.
Our country and
region allocation
largely depends on
currency
assumption, and in
particular direction
and strength of US$,
Yen and Rmb
We remain
overweight India
and the Philippines
and to some extent
China
We continue to like
Japan but are
concerned that US
equities could pull
back

Macquarie Research Rights, Wrongs & Returns
15 July 2016 9
FX – ‘Canary in a coalmine’ As we highlighted in our preview of 2016 (here), US$ is the single most important price in the
world and its direction (both strength and duration) largely determines performance of
most asset classes.
Indeed, it cannot be any other way as the global economy continues to reside on the US$
standard, with US$ responsible for ~80% of trade and around 75% of global finance. Hence,
the price of US$ is one of the key determinants of ebbs and flows of global liquidity as well as
direction and strength of commodity prices and inflationary outcomes. It is also the key driver
of global demand and value of global trade. Rapidly rising US$ essentially deflates global
demand, erodes global trade and liquidity. Whilst the global economy can tolerate a gradual
appreciation, an economic and investment shock is inevitable when there is a rapid US$
acceleration.
There are three key variables that determine both direction and strength of changes in US$
exchange rates, namely:
1. Supply of US$ - remains weak.
Since our previous review in April 2016, there has been no significant change in
the pace of supply of US$. Essentially, supply remains exceptionally low, whether
we examine broad or narrow definition. It appears that supply of US$ into global
economy continues to be constrained by inability of the US economy to accelerate
at a pace that is sufficiently robust to significantly lift its current account deficit
whilst at the same time, QE3 ended in October 2014 and hence there is limited
expansion of the US monetary base. We maintain that current supply of US$ is
remaining broadly flat (hugging zero). In other words, there is simply not enough
US$ to support global growth and inflation.
Fig 6 Global US$ (Broad Definition) (% YoY) Fig 7 Global US$ (Narrow Definition) (% YoY)
Source: Bloomberg; Macquarie Research, July 2016 Source: Bloomberg; Macquarie Research, July 2016
2. Demand for US$ - remains strong.
We tend to judge the likely demand for US$ by examining basis swaps that banks
(and indirectly corporates) are prepared to pay to guarantee supply of US$.
We also tend to look at real bond spreads, as an indication of potential for
accelerated flow of funds into the US market.
As can be seen below, banks/corporates are currently paying ~45-50bps to swap
Euro into US$, whilst in the case of ¥, the swap rates are closer to 80-90bps.
In both cases, this is close to the maximum level of 50bps-75bps which is the
Fed’s pricing for swap lines with other Central Banks (and hence the price of
theoretically unlimited amount of US$ on request).
At the same time, the real bond yield spreads (10Y) between US Treasuries on the
one side and German Bunds and JGB’s remains at one of the highest levels ever
(around 120bps in the case of Bunds and ~90bps in the case of JGB), despite
recent significant erosion in the US 10Y bond yields. Given that over US$10 trillion
of government bonds are now trading at negative rates, US Treasury yields are
being massively pulled down (further discussion below) but still yield a much
higher relative return.
-10.0%
-5.0%
0.0%
5.0%
10.0%
15.0%
20.0%
25.0%
30.0%
Ja
n-0
4
Au
g-0
4
Ma
r-0
5
Oc
t-0
5
Ma
y-0
6
De
c-0
6
Ju
l-0
7
Fe
b-0
8
Se
p-0
8
Ap
r-0
9
No
v-0
9
Ju
n-1
0
Ja
n-1
1
Au
g-1
1
Ma
r-1
2
Oc
t-1
2
Ma
y-1
3
De
c-1
3
Ju
l-1
4
Fe
b-1
5
Se
p-1
5
Ap
r-1
6
US Monetary Base + Global FX Reserves
-5.0%
0.0%
5.0%
10.0%
15.0%
20.0%
25.0%
Ja
n-1
0
Ma
y-1
0
Se
p-1
0
Ja
n-1
1
Ma
y-1
1
Se
p-1
1
Ja
n-1
2
Ma
y-1
2
Se
p-1
2
Ja
n-1
3
Ma
y-1
3
Se
p-1
3
Ja
n-1
4
Ma
y-1
4
Se
p-1
4
Ja
n-1
5
Ma
y-1
5
Se
p-1
5
Ja
n-1
6
Ma
y-1
6
World US$ (US M0+US Treasuries owned by Foreigners)
FX remains the
‘canary in a
coalmine’ and driver
of the world’s most
important price,
i.e. US$
Supply of US$
remains low and
is unlikely to
increase and...
...demand remains
strong

Macquarie Research Rights, Wrongs & Returns
15 July 2016 10
Fig 8 Euro Basis swaps (bps) Fig 9 Yen Basis swaps (bps)
Source: Bloomberg; Macquarie Research, July 2016 Source: Bloomberg; Macquarie Research, July 2016
Fig 10 Real Bond Spreads (10Y) (%) (using 12 MMA CPI)
Fig 11 US Treasuries vs. German Bunds (real using TIPS)
Source: Bloomberg; Macquarie Research, July 2016 Source: Bloomberg; Macquarie Research, July 2016
3. The degree of policy divergence is critical.
We maintain therefore that there is a ‘firm’ quote for the US$, which makes it
hard to depreciate the currency (i.e. limited supply and strong demand ensures
ongoing support).
However, the degree of appreciation and its steepness depends critically on the
perception of divergence of monetary policies. As we discussed on numerous
occasions in the past, we do not believe that the Fed can tighten and we were
surprised when the Fed has actually made a decision to tighten in Dec 2015.
The principal reason for our stance was our long-standing view that combination of
structural and leverage headwinds is sufficiently strong to preclude any meaningful
acceleration of growth rates and whilst there could be short periods of stagflation,
generally inflationary pressures would remain subdued. To put it another way, we
maintain that structural and leverage/overcapacity constraints would result in a
continuing fall in velocity, as private sector refuses to multiply money. As can be
seen below, the US velocity of money has dropped in 1Q2016 to the historically
lowest ever level of 1.44x (vs. long-term average of closer to 1.6x-1.7x and the
high of more than 2x in the lead-up to dot.com in late 1990s). The same applies to
most other jurisdictions (with the exception of some of the least developed
economies, such as India or the Philippines).
In a world where the private sector lost confidence and refuses to multiply money,
the only way for grow aggregate demand is to either inject hard cash (i.e. QE
equivalents) or make public sector multiply aggregate demand (i.e. aggressive
fiscal policies, preferably funded directly by Central Banks or what is now
commonly referred to as ‘helicopter money’).
-80
-70
-60
-50
-40
-30
-20
-10
0
10
Ma
y-0
2
Fe
b-0
3
No
v-0
3
Au
g-0
4
Ma
y-0
5
Fe
b-0
6
No
v-0
6
Au
g-0
7
Ma
y-0
8
Fe
b-0
9
No
v-0
9
Au
g-1
0
Ma
y-1
1
Fe
b-1
2
No
v-1
2
Au
g-1
3
Ma
y-1
4
Fe
b-1
5
No
v-1
5
EUBS5 EUBS10
-100
-80
-60
-40
-20
0
20
40
Ma
y-0
2
Fe
b-0
3
No
v-0
3
Au
g-0
4
Ma
y-0
5
Fe
b-0
6
No
v-0
6
Au
g-0
7
Ma
y-0
8
Fe
b-0
9
No
v-0
9
Au
g-1
0
Ma
y-1
1
Fe
b-1
2
No
v-1
2
Au
g-1
3
Ma
y-1
4
Fe
b-1
5
No
v-1
5
JYBS10 JYBS5
-3.0
-2.0
-1.0
0.0
1.0
2.0
3.0
De
c-9
2S
ep-9
3Ju
n-9
4M
ar-
95
De
c-9
5S
ep-9
6Ju
n-9
7M
ar-
98
De
c-9
8S
ep-9
9Ju
n-0
0M
ar-
01
De
c-0
1S
ep-0
2Ju
n-0
3M
ar-
04
De
c-0
4S
ep-0
5Ju
n-0
6M
ar-
07
De
c-0
7S
ep-0
8Ju
n-0
9M
ar-
10
De
c-1
0S
ep-1
1Ju
n-1
2M
ar-
13
De
c-1
3S
ep-1
4Ju
n-1
5M
ar-
16
Real Bond Yield Spread vs Bunds Real Bond Yield Spead vs JGB
-1.0
-0.5
0.0
0.5
1.0
1.5
Ju
n-0
9
Oct-
09
Fe
b-1
0
Ju
n-1
0
Oct-
10
Fe
b-1
1
Ju
n-1
1
Oct-
11
Fe
b-1
2
Ju
n-1
2
Oct-
12
Fe
b-1
3
Ju
n-1
3
Oct-
13
Fe
b-1
4
Ju
n-1
4
Oct-
14
Fe
b-1
5
Ju
n-1
5
Oct-
15
Fe
b-1
6
Ju
n-1
6
Real Spreads vs Bunds (using TIPS Break-even)
It is a good
environment for US$
but the pace and
degree of change
depends on...

Macquarie Research Rights, Wrongs & Returns
15 July 2016 11
Fig 12 US – Velocity of Money (GDP/M2) (x) Fig 13 Japan – Velocity of Money (GDP/M2) (x)
Source: Bloomberg; Macquarie Research, July 2016 Source: Bloomberg; Macquarie Research, July 2016
Fig 14 Eurozone – Velocity of Money (GDP/M2) (x) Fig 15 China – Velocity of Money (GDP/M2) (x)
Source: Bloomberg; Macquarie Research, July 2016 Source: Bloomberg; Macquarie Research, July 2016
Fig 16 Brazil, Russia & India – Velocity of Money (GDP/M2) (x)
Fig 17 Malaysia, Thailand & Korea – Velocity of Money (GDP/M2) (x)
Source: Bloomberg; Macquarie Research, July 2016 Source: Bloomberg; Macquarie Research, July 2016
In this environment of limited capacity to accelerate growth by means of
conventional business and capital market cycles, it becomes a ‘race to the bottom’
as a growing number of countries stimulate and embark on increasingly more
aggressive monetary experiments. However as described (here), the more non-
Fed Central Banks (whether it is BoJ, ECB, PBoC or BoE) do, the worse it gets,
as it tends to accentuate monetary policy divergence between the Fed and the
rest. This, in turn, tends to accelerate US$ appreciation, causing contraction in
US$ denominated demand (GDP), erosion of liquidity and trade.
Indeed, the situation becomes even more problematic if the Fed instead of
remaining a neutral party decides that its domestic mandate requires that interest
rates must be raised. Any tightening by the Fed further increases monetary
divergence, causing even faster US$ appreciation.
1.30
1.40
1.50
1.60
1.70
1.80
1.90
2.00
2.10
2.20
De
c-5
9
Ma
y-6
2
Oc
t-6
4
Ma
r-6
7
Au
g-6
9
Ja
n-7
2
Ju
n-7
4
No
v-7
6
Ap
r-7
9
Se
p-8
1
Fe
b-8
4
Ju
l-8
6
De
c-8
8
Ma
y-9
1
Oc
t-9
3
Ma
r-9
6
Au
g-9
8
Ja
n-0
1
Ju
n-0
3
No
v-0
5
Ap
r-0
8
Se
p-1
0
Fe
b-1
3
Ju
l-1
5
Velocity Average (1990-2013)
Average (1960-1990)
0.25
0.50
0.75
1.00
1.25
1.50
1.75
2.00
2.25
Ma
r-5
7
Se
p-5
9
Ma
r-6
2
Se
p-6
4
Ma
r-6
7
Se
p-6
9
Ma
r-7
2
Se
p-7
4
Ma
r-7
7
Se
p-7
9
Ma
r-8
2
Se
p-8
4
Ma
r-8
7
Se
p-8
9
Ma
r-9
2
Se
p-9
4
Ma
r-9
7
Se
p-9
9
Ma
r-0
2
Se
p-0
4
Ma
r-0
7
Se
p-0
9
Ma
r-1
2
Se
p-1
4
Velocity Average (1957-1987) Average (1988-2014)
0.80
0.90
1.00
1.10
1.20
1.30
1.40
1.50
1.60
1.70
1.80
Ma
r-9
5
Ju
n-9
6
Se
p-9
7
De
c-9
8
Ma
r-0
0
Ju
n-0
1
Se
p-0
2
De
c-0
3
Ma
r-0
5
Ju
n-0
6
Se
p-0
7
De
c-0
8
Ma
r-1
0
Ju
n-1
1
Se
p-1
2
De
c-1
3
Ma
r-1
5
Velocity Average (1995-2013)
0.40
0.50
0.60
0.70
0.80
0.90
1.00
1.10
1995
1996
1997
1998
1999
2000
2001
2002
2003
2004
2005
2006
2007
2008
2009
2010
2011
2012
2013
2014
2015
China Velocity
0.0
1.0
2.0
3.0
4.0
5.0
6.0
7.0
1.0
2.0
3.0
4.0
5.0
6.0
7.0
De
c-9
6
Oct-
97
Au
g-9
8
Ju
n-9
9
Ap
r-00
Fe
b-0
1
De
c-0
1
Oct-
02
Au
g-0
3
Ju
n-0
4
Ap
r-05
Fe
b-0
6
De
c-0
6
Oct-
07
Au
g-0
8
Ju
n-0
9
Ap
r-10
Fe
b-1
1
De
c-1
1
Oct-
12
Au
g-1
3
Ju
n-1
4
Ap
r-15
Brazil Russia India, rhs
0.60
0.80
1.00
1.20
De
c-9
6
Oct-
97
Au
g-9
8
Ju
n-9
9
Apr-
00
Fe
b-0
1
De
c-0
1
Oct-
02
Au
g-0
3
Ju
n-0
4
Apr-
05
Fe
b-0
6
De
c-0
6
Oct-
07
Au
g-0
8
Ju
n-0
9
Apr-
10
Fe
b-1
1
De
c-1
1
Oct-
12
Au
g-1
3
Ju
n-1
4
Apr-
15
Malaysia Thailand Korea
...divergence of
monetary policies

Macquarie Research Rights, Wrongs & Returns
15 July 2016 12
Given our view that Japan, Eurozone and China (as well as increasingly the UK
and a plethora of smaller economies, such as Korea, Singapore, India etc) have
no choice but to increase the degree of monetary accommodation, the Fed
cannot tighten. Otherwise, there is likely to be significant dislocation that would
ultimately flow back into the US domestic economy.
A number of investors asked us as to how and why Chair Yellen would be hawkish
in Nov’15; dovish in Feb/Mar’16; hawkish in May’16 and confused in Jun’16, the
answer is that the Fed, as with most other Central Banks, is gradually learning how
to ‘ride’ the debt wave. As discussed in our prior reviews, most key global
economies can no longer deleverage, and hence as accepted recently by IMF, both
CBs and investors need to learn how to ‘live with excessive debt burden’. Hence,
the role of CBs’ communication is absolutely paramount and even the smallest delta
(either news flow or economic) could result in unpredictable and uncontrolled
volatilities. In the world of excessive and ongoing leveraging, volatilities are not just
unwelcome but outright dangerous, as they undermine confidence (the foundation
stone of leveraging process). In this world, consistency and survival do not
coincide. One needs to choose either one or the other.
As can be seen below, the combination of below-expectation May payrolls (partly
offset by stronger June) and Brexit prompted a massive collapse in tightening
probabilities all the way into 2017 (current expectations are not much more than
35% even by May 2017). In fact, probability expectations do not envisage any
significant tightening until 2018. Indeed, we would argue that even that late date
might be too optimistic. As discussed below, we believe that merger of fiscal and
monetary policies are the most obvious longer-term answer for Japan and
Eurozone (and it is already an answer for China). Easing of monetary and fiscal
stance by non-Fed actors could cause an even greater than otherwise spike in
US$ and hence severely limiting Fed’s room for tightening.
Fig 18 Federal Reserve Tightening Probabilities (as at Jul 12 2016)
Source: Bloomberg; Macquarie Research, June 2016
As discussed below, we believe that the Fed is determined to try to normalize
monetary policy settings. There are several reasons for this however the primary
motivation is that the Fed finally recognizes that low rates do not stimulate either
consumption or investment. The Fed would like to raise and steepen rates to
stimulate credit growth and ‘animal spirits’. The Fed also would like to have
‘dry powder’ to offset any sudden economic setbacks.
0%
10%
20%
30%
40%
50%
60%
70%
80%
90%
7/1
2/2
01
6
7/5
/2016
6/2
8/2
01
6
6/2
1/2
01
6
6/1
4/2
01
6
6/7
/201
6
5/3
1/2
016
5/2
4/2
01
6
5/1
7/2
01
6
5/1
0/2
01
6
5/3
/201
6
4/2
6/2
016
4/1
9/2
01
6
4/1
2/2
01
6
4/5
/201
6
3/2
9/2
01
6
3/2
2/2
016
3/1
5/2
016
3/8
/201
6
3/1
/201
6
2/2
3/2
01
6
2/1
6/2
016
2/9
/2016
2/2
/201
6
1/2
6/2
01
6
1/1
9/2
01
6
1/1
2/2
016
Jul'16 Sep'16 Nov'16 Dec'16
The greater
divergence, the
faster US$ is likely
to appreciate...
...hence we do not
believe that the Fed
can tighten
Macquarie Research Rights, Wrongs & Returns
15 July 2016 13
However, any hint of tightening would inevitably widen the degree of monetary
divergence, forcing faster-than-desirable appreciation of the US$. It seems like a
‘checkmate’ but it does not rule out mistakes.
We maintain that one of the key challenges would be if the US is already in a
mild stagflation (i.e. low and generally volatile GDP growth rates and rising
inflationary pressures). In other words, whilst it is unlikely that the US would
encounter an equivalent of late 1960s stagflation (global deflationary pressures are
just too strong for that), it is quite possible that whilst nominal GDP growth rates
are unlikely to accelerate beyond 3%-3.5%, most of it could end up as inflation
(primarily service markets). This could force the Fed to act irrespective of either
domestic or global consequences.
Thus, on balance, we maintain that the macro cross-currents remain far too strong to make
any systematic judgement as to the likely medium-term direction (beyond short-term
considerations, such as the latest US payrolls and immediate repricing of odds). Our view
remains that so long as the global economy is stuck in low equilibrium, supply of US$ remains
low and Japan, Eurozone and China need to consider much more robust monetary and fiscal
response, the timing and quantum of FX shifts are largely unpredictable and could be
potentially violent.
Our base case remains that over the next 12 months, US$ is likely to be higher whilst
¥ and Rmb lower and Euro direction would critically depend on the extent of Eurozone’s
response to strong gravitational pressures that threaten to destroy political, monetary and
economic union. As discussed in our prior notes, we do not believe that maintenance of the
commonly believed Feb’16 Plaza Accord (with Central Banks reputedly agreeing to maintain
currency stability, depreciate US$ and stabilize Rmb) is sustainable. The interests of the key
counterparts are just diametrically opposed (i.e. BoJ wants lower ¥; ECB wants lower €; Fed
does not want significant acceleration of US$ whilst PBoC wants stability to allow China to
gradually and slowly depreciate Rmb).
The forthcoming Japanese stimulus and the degree of change in BoJ’s monetary stance could
be the first move in unravelling whatever stability agreement was reached in February 2016.
Macro calls are
difficult as cross-
currents are too
strong but...
...we are still in
camp of higher US$,
lower Yen and
lower Rmb

Macquarie Research Rights, Wrongs & Returns
15 July 2016 14
What do flat yield curves tell us? One of the challenges that we traditionally encounter with the US economists is their
predisposition to look at the Fed and the US economy in almost complete isolation. Whilst
domestic considerations are important, investors and governments are residing in globalized
and integrated economy and markets.
Given that Central Banks are increasingly confronting an empty chest of monetary instruments,
negative interest rates are becoming the last gasp of monetary activism. Whilst we do not
believe that negative rates would achieve their desired objectives (even currency depreciation
is far from guaranteed), nevertheless, it is clear that BoJ and ECB are likely to continue easing
into negative territory whilst BoE is likely to further ease. The same largely applies to PBoC and
a plethora of other central Banks.
As interest rates approach zero (or go negative), the conventional economics change
drastically. In the past we have described it as effectively going from traditional physics and
quantum mechanics (i.e. laws of small objects are different to laws of large objects, such as
planets). As described in our recent reviews (refer, What caught my eye? v.54 - Negative
rates and the war on savers 2 March 2016), zero or negative rates change the nature of
working capital management, value of cash and precious metals and encourage a
‘Prohibition-style’ avoidance. It also massively flattens yield curves; threatens to interrupt
credit cycles and further disconnects savers from investors whilst damaging insurance, life
and pension industries. It encourages desperate search for yield, creating significant
anomalies in the bond, equity and real estate markets.
As can be seen below, developed market bond yields have collapsed over the last three
years and this applies whether one looks at shorter or longer-term duration and it also applies
whether we include or exclude the US.
Fig 19 Developed Markets Sovereign Bond Yields – Total and Excluding US (%)
Fig 20 Developed Markets Sovereign Bond Yields – Short and Longer-term End (%)
Source: Bloomberg; Macquarie Research, July 2016 Source: Bloomberg; Macquarie Research, July 2016
Fig 21 Developed Markets Sovereign Bond Yield Curve (%)
Fig 22 US Yield Curve (%)
Source: Bloomberg; Macquarie Research, July 2016 Source: Bloomberg; Macquarie Research, July 2016
0
0.2
0.4
0.6
0.8
1
1.2
1.4
1.6
1.8
Ju
n-1
3
Au
g-1
3
Oct-
13
De
c-1
3
Fe
b-1
4
Apr-
14
Ju
n-1
4
Au
g-1
4
Oct-
14
De
c-1
4
Fe
b-1
5
Apr-
15
Ju
n-1
5
Au
g-1
5
Oct-
15
De
c-1
5
Fe
b-1
6
Apr-
16
Ju
n-1
6
BGSV BGSX
0.0
0.1
0.2
0.3
0.4
0.5
0.6
0.7
0.8
0.9
1.0
0.0
0.5
1.0
1.5
2.0
2.5
Ju
n-1
3
Au
g-1
3
Oct-
13
De
c-1
3
Fe
b-1
4
Apr-
14
Ju
n-1
4
Au
g-1
4
Oct-
14
De
c-1
4
Fe
b-1
5
Apr-
15
Ju
n-1
5
Au
g-1
5
Oct-
15
De
c-1
5
Fe
b-1
6
Apr-
16
Ju
n-1
6
BGSV5-10 BGSV 1-5 years, rhs
0.0
0.2
0.4
0.6
0.8
1.0
1.2
1.4
Ju
n-1
3
Au
g-1
3
Oct-
13
De
c-1
3
Fe
b-1
4
Apr-
14
Ju
n-1
4
Au
g-1
4
Oct-
14
De
c-1
4
Fe
b-1
5
Apr-
15
Ju
n-1
5
Au
g-1
5
Oct-
15
De
c-1
5
Fe
b-1
6
Apr-
16
Ju
n-1
6
5-10 less 1-5
1.0
1.5
2.0
2.5
3.0
3.5
4.0
4.5
0.6
1.1
1.6
2.1
2.6
3.1
Ju
l-11
Oct-
11
Ja
n-1
2
Apr-
12
Ju
l-12
Oct-
12
Ja
n-1
3
Apr-
13
Ju
l-13
Oct-
13
Ja
n-1
4
Apr-
14
Ju
l-14
Oct-
14
Ja
n-1
5
Apr-
15
Ju
l-15
Oct-
15
Ja
n-1
6
Apr-
16
Ju
l-16
Yield Curve (10Y-2Y) Yield Curve (30Y-2y), rhs
Massive flattening
of yield curves
places question
mark over....

Macquarie Research Rights, Wrongs & Returns
15 July 2016 15
Given that almost US$12 trillion of sovereign bonds are now trading in a negative territory and
that blended average across developed market universe (ex US) is not much more than 10-
15bps, there is a growing gravitational pressure on the US treasury market, with yield curve
collapsing across the entire range. For example (10Y-2Y) is now trading at ~80bps vs.
historic average of ~160bps whilst (30Y-2Y) is at ~150bps vs historic average of ~250bps.
Across DM universe, the yield curve is down to only around 20-30bps. The same process is
now compressing EM average sovereign bond yields (US$), with an average yield across EM
universe sovereign base is now down to ~4.3% vs. 5.4% in Jan’16. Even the longest
durations (i.e. 10 years plus) are now yielding 5% vs. 6.5%-7.0% earlier in the year.
The collapse of term premium as calculated by the New York Fed has been unprecedented. It
has turned negative several months ago and is currently estimated (as term premium cannot
be observed but instead needs to be derived) at negative 70bps. Indeed one needs to go
back to the Kennedy administration in 1962 to witness a premium as low as current levels.
Fig 23 US Term Premium (%)
Source: NY Fed; Macquarie Research, June 2016
Essentially term premium reflects the risk of holding long-dated (say ten-year bonds) vs.
rolling short-term (say one or two year) bonds. Over the last ten years, term premium
emerged from the confines of fixed income and academic circles to become one of the key
investment topics. Given that term premiums should be normally positive, why are we seeing
such a massive compression of term premiums demanded by investors?
Whilst there are many explanations offered by Central Banks and academics, none are fully
satisfactory. It is argued that demand for perceived safety is driving all global yields down,
including term premiums and as Central Banks increasingly ‘vacuum’ more and more bonds
(around 20% of global bonds are already on CBs’ balance sheets), the scramble for
remaining bonds drives the premium down. It has also been suggested that low premiums
reflect, effectively, a lack of risk perceived by the investors, as Central Banks focus on
reducing volatilities and there is strong market consensus that inflation is unlikely to be a
problem (unlike say uncertainties that were pervasive in 1970s).
Whilst all of these explanations are reasonable, we believe that the key to declining term premiums
is investors’ acceptance of secular stagnation (which we define as the outcome of structural and
over leverage forces, compounded by active monetary policies). In other words, so long as structural
forces pin down productivity gains and so long as Central Banks fight to maintain aggregate demand
by taxing savers and subsidizing borrowers, term premium would remain low. However, as countries
gradually accept the need to ‘nationalize credit’ and finally embark on far more robust version of QE
(via CBs direct funding of fiscal, infrastructure and income support policies), there would be time,
when shock of the degree of expansion of monetary policy could easily prompt a massive term
rerating, creating a significant headache for CBs.
-1
0
1
2
3
4
5
Ju
n-6
1
Ju
n-6
4
Ju
n-6
7
Ju
n-7
0
Ju
n-7
3
Ju
n-7
6
Ju
n-7
9
Ju
n-8
2
Ju
n-8
5
Ju
n-8
8
Ju
n-9
1
Ju
n-9
4
Ju
n-9
7
Ju
n-0
0
Ju
n-0
3
Ju
n-0
6
Ju
n-0
9
Ju
n-1
2
Ju
n-1
5
ACMTP10 Average (1961-2015)
...medium- and
longer-term growth
and inflation

Macquarie Research Rights, Wrongs & Returns
15 July 2016 16
In the meantime, Greenspan’s conundrum of 2005-06 (when the Fed was raising rates only
to see long end yields coming down) could be easily replayed again, as the yield curve
continues to flatten, despite the Fed’s best attempts to convince investors that the short end
is going to go up. This could be true even in an environment of higher inflation rates.
As yield curves flatten, credit cycles gradually run out of steam and pension and life industries
suffer. In other words, the essence of contemporary debt-driven economy becomes untenable.
This re-enforces our view that as private sector increasingly refuses to multiply money, it
would be argued that it is the responsibility of the public sector to support demand. In our
previous notes we have identified four key doorstep conditions that need to be satisfied
before the private sector is prepared to embark on such a radical plan, with much higher-
than-currently-prevailing volatility being the single most important condition.
In a world where the public sector is multiplying money and generates credit, does steepness
of the yield curve matter? Also in a world where 35% of JGBs and over 20% of the US
Treasuries and close to 15% of Bunds are already owned by respective Central Banks and in
the case of both JGB and Bunds, the ratio is rising rapidly and policy rates are either close to
zero or testing deeply negative levels, what does steepness or flatness of the yield curve tell
investors, regarding the longer-term outlook?
We don’t believe that there are any definitive answers, other than to argue that Central Banks
do not engage in such a massive manipulation of the markets, unless the consequences of a
debilitating deflationary bust were not just unbearable but also real, with a meaningful
probability of occurrence.
However in a
heavily distorted
market, it is hard to
be definitive

Macquarie Research Rights, Wrongs & Returns
15 July 2016 17
Five key Macro Agonies We believe that investors are facing five key macro dangers over the next six to 12 months:
1. ‘The agony of Japan’. Is it ready to jump?
As discussed in our prior notes, the more Abenomics fails the higher ¥ goes and
the higher ¥ goes, the more Abenomics fails and to infinity. Unless the current
course is changed, ¥ might test the 90-95 level and by that stage ROEs of
Japanese companies would return back towards 5%-6%; profits would be negative
and there would be neither cash flow nor investment and indeed no inflation.
We maintain that neither slightly altering the amount of purchases nor going further
into negative interest rate territory would do much (if anything) to alter the current
self-destructive trajectory. What is needed is a radical re-think. Whilst we do not
agree with most of Paul Krugman’s views, his suggestion last year that fiscal and
monetary policies must be combined into a single ‘jolt’ might be Japan’s last
chance. The only difference between us and ‘flow based’ economists is that we
appreciate that at a certain level of debt, a country (or a business) goes bankrupt,
irrespective of the cost of money. The reason for that is that at some stage, the
private sector completely loses confidence (something that is not part of
conventional economic theory). We therefore believe that a far more rational policy
is to merge income support, fiscal and monetary tools via mechanism of BoJ
directly funding public spending and multiplication of aggregate demand.
We maintain that it is highly likely that Japan would be the first major economy to
experiment and deploy what we have in the past described as ‘nationalization of
credit’, with the state effectively taking control over credit and aggregate demand
multiplication. In the case of Japan, the most rational areas of stimulation include
minimum income guarantees, spending vouchers and rescue/nationalization of
national pension and banking sectors. Whilst most governments love the ‘quick
returns’ of infrastructure investments and indeed the Japanese government is
likely to do some of that, we do not believe that in the case of Japan it is needed.
As soon as Japan ‘jumps’, investors would immediately recognize that this new
policy has no limitation (as it breaks the link between spending and borrowing);
hence it is likely to result in sharp ¥ depreciation, resuscitating Abenomics,
propelling Japanese corporate ROEs into double digits and stoking some inflation.
The impact on currency would clearly depend on the ‘boldness’ and timing, but it
wouldn’t be unreasonable to believe that if the proposal is sufficiently robust ¥
would drop to below 120 level. Whilst the impact would be eventually replicated
by other countries, there is always a bonus for the first country that embraces what
essentially can be described as a far more potent version of QE.
Otherwise, Abenomics would completely unwind and there would be no growth; no
inflation and the country would be worse off than it was in 2012.
Fig 24 Japan – CPI (%) - ...declining trend whether one includes or excludes food & energy
Fig 25 Japan – PPI (%) - ...the same for PPI
Source: CEIC; Macquarie Research, July 2016 Source: CEIC; Macquarie Research, July 2016
-3
-2
-1
0
1
2
3
4
Ja
n-0
0
Se
p-0
0
Ma
y-0
1
Ja
n-0
2
Se
p-0
2
Ma
y-0
3
Ja
n-0
4
Se
p-0
4
Ma
y-0
5
Ja
n-0
6
Se
p-0
6
Ma
y-0
7
Ja
n-0
8
Se
p-0
8
Ma
y-0
9
Ja
n-1
0
Se
p-1
0
Ma
y-1
1
Ja
n-1
2
Se
p-1
2
Ma
y-1
3
Ja
n-1
4
Se
p-1
4
Ma
y-1
5
Ja
n-1
6
CPI CPI ex Tax CPI - ex Food & Energy & Tax
-10
-8
-6
-4
-2
0
2
4
6
8
10
Ja
n-0
0
Se
p-0
0
Ma
y-0
1
Ja
n-0
2
Se
p-0
2
Ma
y-0
3
Ja
n-0
4
Se
p-0
4
Ma
y-0
5
Ja
n-0
6
Se
p-0
6
Ma
y-0
7
Ja
n-0
8
Se
p-0
8
Ma
y-0
9
Ja
n-1
0
Se
p-1
0
Ma
y-1
1
Ja
n-1
2
Se
p-1
2
Ma
y-1
3
Ja
n-1
4
Se
p-1
4
Ma
y-1
5
Ja
n-1
6
PPI PPI ex Tax
Five key macro
agonies...
Would Japan
embrace integration
of fiscal, income
support and
monetary policies?
When and How?

Macquarie Research Rights, Wrongs & Returns
15 July 2016 18
Fig 26 Japan – Nominal GDP (%) - ...receding Fig 27 Japan – Real GDP Growth & Deflator
Source: CEIC; Macquarie Research, July 2016 Source: CEIC; Macquarie Research, July 2016
Fig 28 Japan – Wages – Nominal & Real (%) Fig 29 Japan – Machinery Orders (%)
Source: CEIC; Macquarie Research, July 2016 Source: CEIC; Macquarie Research, July 2016
Fig 30 Japan – Non-Financial Corporates – continuing to deleverage – Net Debt/EBITDA (x)
Fig 31 Japan – Consumer Expectation of Inflation – coming off
Source: CEIC; Macquarie Research, July 2016 Source: CEIC; Macquarie Research, July 2016
Fig 32 Japan – Sectoral Balances (% GDP) – private sector is saving....
Fig 33 Japan – Sectoral Balances (% GDP) - ....continuing its long standing trend
Source: CEIC; Macquarie Research, July 2016 Source: CEIC; Macquarie Research, July 2016
-10.0%
-8.0%
-6.0%
-4.0%
-2.0%
0.0%
2.0%
4.0%
6.0%
8.0%
10.0%
Mar-
81
Se
p-8
2
Mar-
84
Se
p-8
5
Mar-
87
Se
p-8
8
Ma
r-9
0
Se
p-9
1
Ma
r-9
3
Se
p-9
4
Mar-
96
Se
p-9
7
Mar-
99
Se
p-0
0
Mar-
02
Se
p-0
3
Mar-
05
Se
p-0
6
Mar-
08
Se
p-0
9
Ma
r-1
1
Se
p-1
2
Mar-
14
Se
p-1
5
Nominal GDP (% YoY)
(3.0)
(2.0)
(1.0)
-
1.0
2.0
3.0
4.0
5.0
6.0
-15.0
-10.0
-5.0
0.0
5.0
10.0
Ma
r-8
1
De
c-8
2
Se
p-8
4
Ju
n-8
6
Ma
r-8
8
De
c-8
9
Se
p-9
1
Ju
n-9
3
Ma
r-9
5
De
c-9
6
Se
p-9
8
Ju
n-0
0
Ma
r-0
2
De
c-0
3
Se
p-0
5
Ju
n-0
7
Ma
r-0
9
De
c-1
0
Se
p-1
2
Ju
n-1
4
Ma
r-1
6
Real GDP Growth (%) GDP Deflator (%), rhs
-5
-4
-3
-2
-1
0
1
2
3
Ma
r-10
Ju
l-1
0
No
v-1
0
Ma
r-11
Ju
l-1
1
No
v-1
1
Ma
r-12
Ju
l-1
2
No
v-1
2
Ma
r-13
Ju
l-1
3
No
v-1
3
Ma
r-14
Ju
l-1
4
No
v-1
4
Ma
r-15
Ju
l-1
5
No
v-1
5
Ma
r-16
Real Average Wage Earnings
Nominal Average Wage Earnings
-40
-30
-20
-10
0
10
20
30
40
Ju
n-9
9
Ma
r-0
0
De
c-0
0
Se
p-0
1
Ju
n-0
2
Ma
r-0
3
De
c-0
3
Se
p-0
4
Ju
n-0
5
Ma
r-0
6
De
c-0
6
Se
p-0
7
Ju
n-0
8
Ma
r-0
9
De
c-0
9
Se
p-1
0
Ju
n-1
1
Ma
r-1
2
De
c-1
2
Se
p-1
3
Ju
n-1
4
Ma
r-1
5
De
c-1
5
Machinery Orders 3MMA
0.0
1.0
2.0
3.0
4.0
5.0
6.0
7.0
Ma
r-7
1
Mar-
73
Mar-
75
Mar-
77
Mar-
79
Mar-
81
Ma
r-8
3
Ma
r-8
5
Mar-
87
Mar-
89
Mar-
91
Mar-
93
Mar-
95
Ma
r-9
7
Ma
r-9
9
Mar-
01
Mar-
03
Mar-
05
Mar-
07
Mar-
09
Ma
r-1
1
Ma
r-1
3
Mar-
15
Net Debt/EBITDA (x) Average (1970-2013)
0.0
10.0
20.0
30.0
40.0
50.0
60.0
70.0
80.0
Apr-
04
No
v-0
4
Ju
n-0
5
Ja
n-0
6
Au
g-0
6
Mar-
07
Oct-
07
May-0
8
Dec-0
8
Jul-
09
Feb-1
0
Se
p-1
0
Apr-
11
Nov-1
1
Jun
-12
Jan
-13
Au
g-1
3
Mar-
14
Oct-
14
May-1
5
Dec-1
5
HH expecting prices to go up less than 2%
HH expecting prices to go up more than 2%
-10.0%
-8.0%
-6.0%
-4.0%
-2.0%
0.0%
2.0%
4.0%
6.0%
8.0%
10.0%
12.0%
14.0%
Dec-9
8
Se
p-9
9
Jun-0
0
Mar-
01
Dec-0
1
Se
p-0
2
Jun-0
3
Ma
r-0
4
De
c-0
4
Se
p-0
5
Jun-0
6
Mar-
07
Dec-0
7
Se
p-0
8
Ju
n-0
9
Mar-
10
Dec-1
0
Se
p-1
1
Jun-1
2
Ma
r-1
3
De
c-1
3
Se
p-1
4
Jun-1
5
ROW Private Sector Public Sector
Saving
Spending
-10.0%
-8.0%
-6.0%
-4.0%
-2.0%
0.0%
2.0%
4.0%
6.0%
8.0%
10.0%
12.0%
19
80
19
82
19
84
19
86
19
88
19
90
19
92
19
94
19
96
19
98
20
00
20
02
20
04
20
06
20
08
20
10
20
12
20
14
Private Sector Government ROW
Saving
Spending

Macquarie Research Rights, Wrongs & Returns
15 July 2016 19
2. ‘The agony of the Eurozone’ – would it disintegrate?
We have always maintained that political capital invested in the concept of Europe
has been so enormous and the degree of its emotional appeal is so strong that
neither the EU nor the Eurozone would ever be allowed to disintegrate. Indeed, if
the EU was allowed some space (perhaps one or two more generations), it is quite
conceivable that the project of creating and solidifying a distinct European identity
might have succeeded. Alas, it was not to be and the growing economic tensions
(not just within EU but globally) are gradually fracturing the Union on the lines of
traditional ethnic and national lines.
At the same time, the incompleteness of the Union (i.e. it is neither a pure trading
block nor a unified country) and bureaucratic incompetence, when combined with
institutional settings that are massively different across the EU (i.e. some countries
like Spain, Greece or Italy have institutional settings far closer to emerging
markets than to Germany or Netherlands), creates lack of trust, without which it is
almost impossible to find solutions. Indeed, ECB has been arguably the only entity
with some degree of coherence.
Hence, a break-up or at least significant structural change is becoming
increasingly likely. How can the Union (both monetary and political) survive?
We maintain our view that either the EU needs to devolve back towards essentially
a trading block (essentially demand of Brexit followers) and the common currency
experiment would need to be terminated or the EU (and the Eurozone in particular)
would need to embark on much closer integration of monetary and fiscal policies,
with implicit (or explicit) transfers between states and common responsibility for
the banking sector. In our view there is no other alternative. We therefore, expect
that the Eurozone could be the second most prominent candidate for
‘nationalization of credit’ after Japan.
Indeed under normal circumstances we would have placed the Eurozone as the
next logical target for this policy. However, the Eurozone is as far from ‘normal’ as
one would ever likely to get. Hence, the question is whether the Eurozone would
continue to procrastinate until some other major emergencies were to force
resolution. If there is one sentence in a highly ‘stilted’ Eurozone bureaucratic
vocabulary that exemplifies for us how the Eurozone operates is ‘a period of deep
reflection is required and individual states are embarking on this process’. There
were several occasions over the last decade when these periods of ‘reflection’
continued until one stroke to midnight. There is no reason to believe that this time
it would be different, despite the obvious shock of Brexit.
The key vulnerability that has never been addressed is the Eurozone’s banking
sector and failure to achieve two key objectives: (a) disconnect banks from a
sovereign ‘doom machine’; and (b) re-capitalize the banking sector and recognize
and clear non-performing loans.
Given that the Eurozone is far more reliant on the banking transmission
mechanism (than say, the US or UK, as its debt and equity markets are under-
developed), making sure that banks are capable of transmitting funds into a real
economy is critical. Unlike, the US, where forced-fed equity injections were not
allowed to be repaid until the Fed (through series of credible tests) was convinced
that banking institutions were able to do so, ECBs sponsored LTRO programme in
2012, allowed the banks to repay most of the funds within 12 months and none of
its tests had any credibility.
As can be seen below, whereas the US quickly resolved most of the outstanding
NPL issues in 2009-13, the Eurozone continued to pile up doubtful debts. ECB
estimates that on its own narrow definition of non-performing loans, around 5.6%
of Eurozone loans are classified in that category. EBA is more conservative and its
estimates are closer to 6% of gross loans. This compares with the US NPL’s which
are generally (depending on definitions) closer to 1.5%-2.0%, down from
recessionary levels of ~4% in 2008-09.
Would the Eurozone
disintegrate?
Banking sector
remains the key
area of
vulnerability...

Macquarie Research Rights, Wrongs & Returns
15 July 2016 20
Whilst the cases of Greece or Cyprus are well known, the situation currently is
particularly dire in Italy and Portugal, where NPL levels continue to rise, with ratios
approaching 16%-19%, with no evident resolution (unlike Spain). The reason for
so much public attention paid to Italy is that its NPLs are now approaching €400bn
(including €200bn of bad loans and another €200bn in various stages of
impairment). In other words, in excess of 40% of the Eurozone’s entire burden of
NPLs is currently located in Italy.
Fig 34 Global NPL Levels (% Gross Loans) Fig 35 Eurozone estimated NPL Levels (€ bn)
Source: ECB; EBA; World Bank; Macquarie Research, July 2016 Source: ECB; EBA; Macquarie Research, July 2016
Such a high share of non-performing loans clearly weighs on the banks’ ability to
lend to real economy through three interrelated channels: (a) lower earnings
power; (b) higher capital requirements; and (c) higher funding costs (although this
could be mitigated by ECB).
Another issue facing the Eurozone is that not only its banks have an excessive
level of NPLs but also ECB’s bond buying spree is providing banks with an
opportunity to front-run its Central Bank, and hence, proceeds are re-invested
back into either lending to governments or acquisition of sovereign debt (mostly
national). If we combine lending to various governments as well as bond holding,
we estimate that Eurozone Banks are currently have almost €3 trillion invested in
such instruments (up from about €2 trillion in early 2007). Once again, Italian
Banks have the single largest commitment (~€734bn as at May 2016),
representing ~20% of total assets of the Italian Banking system (vs. 9% for
Eurozone as a whole and 14% for Spain and 12% for Portugal and 6% for France).
Thus, the combination of high stored NPLs and a significant commitment in supporting
its sovereigns (explaining sensitivity of ECB to sovereign ratings and trading, as it
could easily set-up a ‘doomsday machine’ of rising sovereign yields, feeding through
into banking balance sheets and vice versa), implies limited ability to lend to the real
economy. The pace of recovery in lending remains far below the ECB’s monetary
stimulus (although at least across the Eurozone as a whole there are some first
tentative signs of small improvement). However, it does not apply to countries with the
highest levels of NPL and largest sovereign exposure (such as Italy).
Fig 36 Sovereign Exposure (% of assets)
Fig 37 Eurozone – Lending to Household and Non-Financial Corporate Sector (Dec’12=100)
Source: ECB; Macquarie Research, July 2016 Source: ECB; Macquarie Research, July 2016
ECB EBA
2008 2011 2013 2015 2015
Greece 3.1 10.7 24.6 37.9 43.5
Italy 5.1 9.7 13.2 16.3 16.9
Portugal 1.8 6.2 8.8 15.2 18.5
Spain 2.5 5.3 7.9 5.3 6.8
France 3.2 4.7 4.7 3.6 4.2
Germany 1.8 1.6 1.8 2.0 3.2
Eurozone 2.5 4.5 5.9 5.6 6.0
US 3.0 3.8 2.5 1.5
Global 3.0 3.9 4.1 4.3
EBA
2008 2011 2013 2015 % 2015
Italy 127 241 316 397 41% 410
France 125 209 205 160 17% 188
Germany 85 76 80 91 9% 144
Spain 59 119 145 90 9% 115
Greece 8 33 61 85 9% 97
Portugal 6 20 25 39 4% 47
Eurozone 459 834 1,010 964 100% 1,035
0.0%
2.0%
4.0%
6.0%
8.0%
10.0%
12.0%
14.0%
16.0%
18.0%
20.0%
2008
-10
2009
-02
2009
-06
2009
-10
2010
-02
2010
-06
2010
-10
2011
-02
2011
-06
2011
-10
2012
-02
2012
-06
2012
-10
2013
-02
2013
-06
2013
-10
2014
-02
2014
-06
2014
-10
2015
-02
2015
-06
2015
-10
2016
-02
Italy Spain Portugal Eurozone
65.0
70.0
75.0
80.0
85.0
90.0
95.0
100.0
105.0
110.0
2012
-12
2013
-02
2013
-04
2013
-06
2013
-08
2013
-10
2013
-12
2014
-02
2014
-04
2014
-06
2014
-08
2014
-10
2014
-12
2015
-02
2015
-04
2015
-06
2015
-08
2015
-10
2015
-12
2016
-02
2016
-04
Italy Spain Portugal
France Germany
...particularly in
Italy, Portugal
and Greece
The potentially
highly disruptive
“embrace” between
banks and
sovereigns has not
been broken

Macquarie Research Rights, Wrongs & Returns
15 July 2016 21
As highlighted in our previous reviews, the ability to accelerate lending and
transmit ECB’s largesse into real economic outcomes is further constrained by
tepid demand for money. In essence, it is a version of Japan’s liquidity trap.
As ECB surveys highlight, there has been recently some recovery in demand for
money (primarily by household consumer credit sector), it remains quite weak.
Fig 38 ECB – Net Enterprise demand for Borrowing
Fig 39 ECB – Net Enterprise Easing of Borrowing Conditions
Source: ECB; Macquarie Research, July 2016 Source: ECB; Macquarie Research, July 2016
Fig 40 ECB – Net HH Mortgage Demand Fig 41 ECB – Net HH Consumer Credit Demand
Source: ECB; Macquarie Research, July 2016 Source: ECB; Macquarie Research, July 2016
Tepid demand and supply of credit translate into highly uneven low-equilibrium
and high volatility of economic outcomes. It particularly applies to inflation. Whilst
the base effect should bring inflation rates up, most indicators continue to signal
strong deflationary pressures (as economists argue whether there is a real
difference between minus 0.2% or plus 0.2% inflation). This applies to CPI, PPI
as well as core (ex energy and food) CPI and PPI. Also, the EC survey of
consumers continues to highlight that ~45% of consumers expect prices to be
either flat or down in the next 12 months.
Fig 42 Eurozone – CPI (% YoY) Fig 43 Eurozone – Core CPI (% YoY)
Source: CEIC; Macquarie Research, July 2016 Source: CEIC; Macquarie Research, July 2016
-50.0
-40.0
-30.0
-20.0
-10.0
0.0
10.0
20.0
30.0
40.0
Ja
n-0
5
Ju
l-05
Ja
n-0
6
Ju
l-06
Ja
n-0
7
Ju
l-07
Ja
n-0
8
Ju
l-08
Ja
n-0
9
Ju
l-09
Ja
n-1
0
Ju
l-10
Ja
n-1
1
Ju
l-11
Ja
n-1
2
Ju
l-12
Ja
n-1
3
Ju
l-13
Ja
n-1
4
Ju
l-14
Ja
n-1
5
Ju
l-15
Ja
n-1
6
Net Enterprise Demand Increase
-70.0
-60.0
-50.0
-40.0
-30.0
-20.0
-10.0
0.0
10.0
20.0
Ja
n-0
5
Ju
l-05
Ja
n-0
6
Ju
l-06
Ja
n-0
7
Ju
l-07
Ja
n-0
8
Ju
l-08
Ja
n-0
9
Ju
l-09
Ja
n-1
0
Ju
l-10
Ja
n-1
1
Ju
l-11
Ja
n-1
2
Ju
l-12
Ja
n-1
3
Ju
l-13
Ja
n-1
4
Ju
l-14
Ja
n-1
5
Ju
l-15
Ja
n-1
6
Net Enterprise Easing
-80.0
-60.0
-40.0
-20.0
0.0
20.0
40.0
60.0
Ja
n-0
5
Ju
l-05
Ja
n-0
6
Ju
l-06
Ja
n-0
7
Ju
l-07
Ja
n-0
8
Ju
l-08
Ja
n-0
9
Ju
l-09
Ja
n-1
0
Ju
l-10
Ja
n-1
1
Ju
l-11
Ja
n-1
2
Ju
l-12
Ja
n-1
3
Ju
l-13
Ja
n-1
4
Ju
l-14
Ja
n-1
5
Ju
l-15
Ja
n-1
6
Net HH Mortgage Demand Increase
-60.0
-50.0
-40.0
-30.0
-20.0
-10.0
0.0
10.0
20.0
30.0
40.0
50.0
Ja
n-0
5
Ju
l-05
Ja
n-0
6
Ju
l-06
Ja
n-0
7
Ju
l-07
Ja
n-0
8
Ju
l-08
Ja
n-0
9
Ju
l-09
Ja
n-1
0
Ju
l-10
Ja
n-1
1
Ju
l-11
Ja
n-1
2
Ju
l-12
Ja
n-1
3
Ju
l-13
Ja
n-1
4
Ju
l-14
Ja
n-1
5
Ju
l-15
Ja
n-1
6
Net CC Demand Increase
-1.0
0.0
1.0
2.0
3.0
4.0
5.0
Ja
n-0
8
Ju
n-0
8
No
v-0
8
Ap
r-09
Se
p-0
9
Fe
b-1
0
Ju
l-10
De
c-1
0
Ma
y-1
1
Oct-
11
Ma
r-12
Au
g-1
2
Ja
n-1
3
Ju
n-1
3
No
v-1
3
Ap
r-14
Se
p-1
4
Fe
b-1
5
Ju
l-15
De
c-1
5
Ma
y-1
6
CPI (%)
0.0
0.2
0.4
0.6
0.8
1.0
1.2
1.4
1.6
1.8
2.0
Ja
n-0
8
Ju
n-0
8
No
v-0
8
Ap
r-0
9
Se
p-0
9
Fe
b-1
0
Ju
l-1
0
De
c-1
0
Ma
y-1
1
Oc
t-1
1
Ma
r-1
2
Au
g-1
2
Ja
n-1
3
Ju
n-1
3
No
v-1
3
Ap
r-1
4
Se
p-1
4
Fe
b-1
5
Ju
l-1
5
De
c-1
5
Ma
y-1
6

Macquarie Research Rights, Wrongs & Returns
15 July 2016 22
Fig 44 Eurozone – PPI (% YoY) Fig 45 Eurozone – Core PPI (% YoY)
Source: CEIC; Macquarie Research, July 2016 Source: CEIC; Macquarie Research, July 2016
Fig 46 Eurozone – Inflation break-even rates (%) Fig 47 Eurozone – Inflation break-even Rate (5Y/5Y)
Source: CEIC; Macquarie Research, July 2016 Source: CEIC; Macquarie Research, July 2016
Fig 48 Eurozone – Consumers expecting Flat/Lower Prices in the next 12 months (%)
Fig 49 Eurozone – Consumer Inflation Expectation (Index)
Source: EC; Macquarie Research, July 2016 Source: EC; Macquarie Research, July 2016
Whilst backward looking, the same message of a lack of any significant change in
private sector behaviour is apparent when we examine sectoral balances, either
across the Eurozone or for individual economies. As can be seen below, private
sector savings remain exceptionally high (~5%-6% of GDP) across the entire
region. The same applies to the key vulnerable economies (such as Italy, France
and Spain). As current account surpluses rise, the block sends a strong signal that
it is unable to utilize its private sector savings and needs to export it to other
destinations.
-6
-4
-2
0
2
4
6
8
Fe
b-1
1
Ma
y-1
1
Au
g-1
1
No
v-1
1
Fe
b-1
2
Ma
y-1
2
Au
g-1
2
No
v-1
2
Fe
b-1
3
Ma
y-1
3
Au
g-1
3
No
v-1
3
Fe
b-1
4
Ma
y-1
4
Au
g-1
4
No
v-1
4
Fe
b-1
5
Ma
y-1
5
Au
g-1
5
No
v-1
5
Fe
b-1
6
Ma
y-1
6
Eurozone PPI
-2
-1
0
1
2
3
4
5
Fe
b-1
1
Ma
y-1
1
Au
g-1
1
No
v-1
1
Fe
b-1
2
Ma
y-1
2
Au
g-1
2
No
v-1
2
Fe
b-1
3
Ma
y-1
3
Au
g-1
3
No
v-1
3
Fe
b-1
4
Ma
y-1
4
Au
g-1
4
No
v-1
4
Fe
b-1
5
Ma
y-1
5
Au
g-1
5
No
v-1
5
Fe
b-1
6
Ma
y-1
6
Eurozone PPI ex Construction & Energy
0.0
0.5
1.0
1.5
2.0
2.5
3.0
Ma
r-10
Ju
l-1
0
No
v-1
0
Ma
r-11
Ju
l-1
1
No
v-1
1
Ma
r-12
Ju
l-1
2
No
v-1
2
Ma
r-13
Ju
l-1
3
No
v-1
3
Ma
r-14
Ju
l-1
4
No
v-1
4
Ma
r-15
Ju
l-1
5
No
v-1
5
Ma
r-16
Ju
l-1
6
EUSWIT5 EUSWIT3
0.5
0.7
0.9
1.1
1.3
1.5
1.7
1.9
2.1
2.3
2.5
Ja
n-1
2
Ap
r-1
2
Ju
l-1
2
Oc
t-1
2
Ja
n-1
3
Ap
r-1
3
Ju
l-1
3
Oc
t-1
3
Ja
n-1
4
Ap
r-1
4
Ju
l-1
4
Oc
t-1
4
Ja
n-1
5
Ap
r-1
5
Ju
l-1
5
Oc
t-1
5
Ja
n-1
6
Ap
r-1
6
Ju
l-1
6
FWISEU55
1.25%
18.0
22.0
26.0
30.0
34.0
38.0
42.0
46.0
Mar-
11
Jun
-11
Se
p-1
1
Dec-1
1
Ma
r-1
2
Jun
-12
Se
p-1
2
De
c-1
2
Mar-
13
Ju
n-1
3
Se
p-1
3
De
c-1
3
Mar-
14
Ju
n-1
4
Se
p-1
4
De
c-1
4
Mar-
15
Ju
n-1
5
Se
p-1
5
Dec-1
5
Ma
r-1
6
-5.0
0.0
5.0
10.0
15.0
20.0
25.0
30.0
35.0
Jan-11 Jan-12 Jan-13 Jan-14 Jan-15 Jan-16
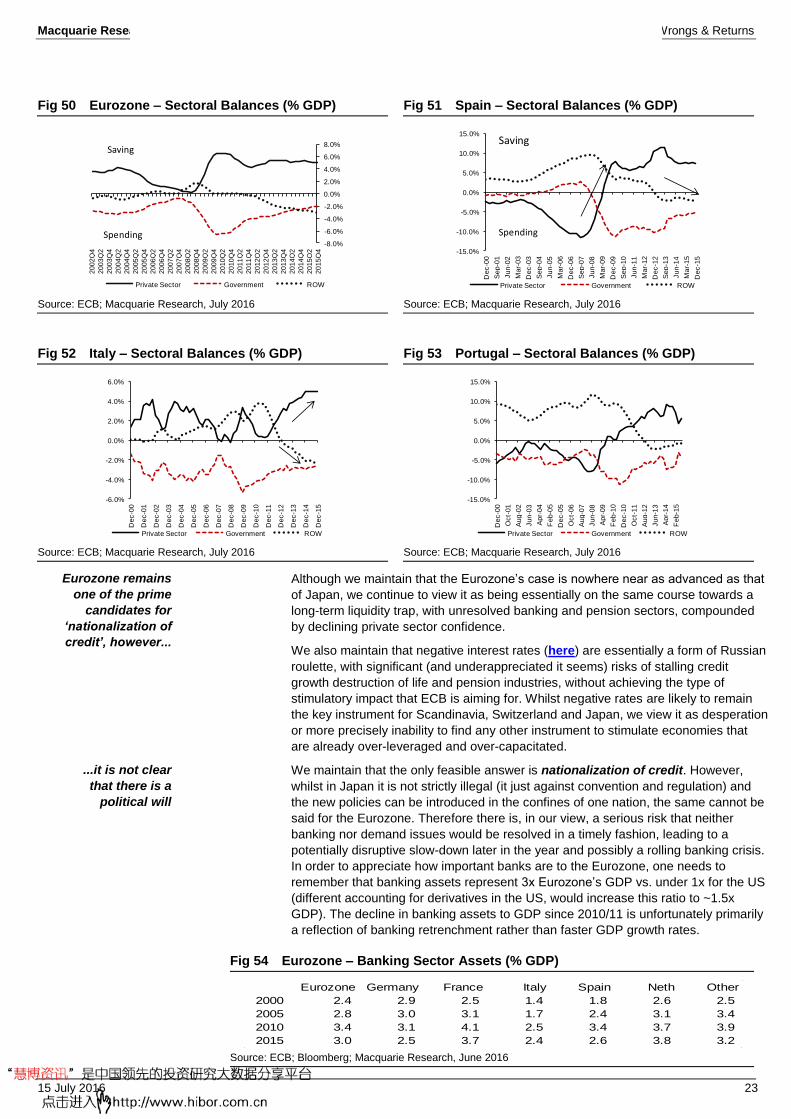
Macquarie Research Rights, Wrongs & Returns
15 July 2016 23
Fig 50 Eurozone – Sectoral Balances (% GDP) Fig 51 Spain – Sectoral Balances (% GDP)
Source: ECB; Macquarie Research, July 2016 Source: ECB; Macquarie Research, July 2016
Fig 52 Italy – Sectoral Balances (% GDP) Fig 53 Portugal – Sectoral Balances (% GDP)
Source: ECB; Macquarie Research, July 2016 Source: ECB; Macquarie Research, July 2016
Although we maintain that the Eurozone’s case is nowhere near as advanced as that
of Japan, we continue to view it as being essentially on the same course towards a
long-term liquidity trap, with unresolved banking and pension sectors, compounded
by declining private sector confidence.
We also maintain that negative interest rates (here) are essentially a form of Russian
roulette, with significant (and underappreciated it seems) risks of stalling credit
growth destruction of life and pension industries, without achieving the type of
stimulatory impact that ECB is aiming for. Whilst negative rates are likely to remain
the key instrument for Scandinavia, Switzerland and Japan, we view it as desperation
or more precisely inability to find any other instrument to stimulate economies that
are already over-leveraged and over-capacitated.
We maintain that the only feasible answer is nationalization of credit. However,
whilst in Japan it is not strictly illegal (it just against convention and regulation) and
the new policies can be introduced in the confines of one nation, the same cannot be
said for the Eurozone. Therefore there is, in our view, a serious risk that neither
banking nor demand issues would be resolved in a timely fashion, leading to a
potentially disruptive slow-down later in the year and possibly a rolling banking crisis.
In order to appreciate how important banks are to the Eurozone, one needs to
remember that banking assets represent 3x Eurozone’s GDP vs. under 1x for the US
(different accounting for derivatives in the US, would increase this ratio to ~1.5x
GDP). The decline in banking assets to GDP since 2010/11 is unfortunately primarily
a reflection of banking retrenchment rather than faster GDP growth rates.
Fig 54 Eurozone – Banking Sector Assets (% GDP)
Source: ECB; Bloomberg; Macquarie Research, June 2016
-8.0%
-6.0%
-4.0%
-2.0%
0.0%
2.0%
4.0%
6.0%
8.0%
20
15
Q4
20
15
Q2
20
14
Q4
20
14
Q2
20
13
Q4
20
13
Q2
20
12
Q4
20
12
Q2
20
11
Q4
20
11
Q2
20
10
Q4
20
10
Q2
20
09
Q4
20
09
Q2
20
08
Q4
20
08
Q2
20
07
Q4
20
07
Q2
20
06
Q4
20
06
Q2
20
05
Q4
20
05
Q2
20
04
Q4
20
04
Q2
20
03
Q4
20
03
Q2
20
02
Q4
Private Sector Government ROW
Saving
Spending
-15.0%
-10.0%
-5.0%
0.0%
5.0%
10.0%
15.0%
Dec-0
0
Se
p-0
1
Jun
-02
Mar-
03
Dec-0
3
Se
p-0
4
Jun
-05
Mar-
06
De
c-0
6
Se
p-0
7
Jun
-08
Ma
r-09
Dec-0
9
Se
p-1
0
Jun
-11
Ma
r-12
Dec-1
2
Se
p-1
3
Ju
n-1
4
Mar-
15
Dec-1
5
Private Sector Government ROW
Saving
Spending
-6.0%
-4.0%
-2.0%
0.0%
2.0%
4.0%
6.0%
Dec-0
0
Dec-0
1
Dec-0
2
Dec-0
3
De
c-0
4
Dec-0
5
Dec-0
6
Dec-0
7
Dec-0
8
De
c-0
9
Dec-1
0
Dec-1
1
Dec-1
2
Dec-1
3
Dec-1
4
Dec-1
5
Private Sector Government ROW
-15.0%
-10.0%
-5.0%
0.0%
5.0%
10.0%
15.0%
Dec-0
0
Oct-
01
Au
g-0
2
Jun
-03
Apr-
04
Feb-0
5
Dec-0
5
Oct-
06
Au
g-0
7
Jun
-08
Apr-
09
Feb-1
0
Dec-1
0
Oct-
11
Au
g-1
2
Jun
-13
Apr-
14
Feb-1
5
Private Sector Government ROW
Eurozone Germany France Italy Spain Neth Other
2000 2.4 2.9 2.5 1.4 1.8 2.6 2.5
2005 2.8 3.0 3.1 1.7 2.4 3.1 3.4
2010 3.4 3.1 4.1 2.5 3.4 3.7 3.9
2015 3.0 2.5 3.7 2.4 2.6 3.8 3.2
Eurozone remains
one of the prime
candidates for
‘nationalization of
credit’, however...
...it is not clear
that there is a
political will

Macquarie Research Rights, Wrongs & Returns
15 July 2016 24
3. ‘The agony of China’ – currency vs. debt vs. structural reform
As we have discussed extensively in the past (here, here, here and here), China
is facing a highly complex set of challenges that over the next 12 months could
either result in more sustainable growth or cause global deflationary wave.
The challenge facing China is that it is paying an increasingly heavy price for past
over investment. Depending on estimates that one prefers to use, China’s TFP
growth rates are either close to zero (according to official growth numbers) or
indeed have already turned steeply negative if one utilizes alternative measures
(such as Wu-Maddison estimates). In the absence of productivity growth rates, the
economy can only grow via leveraging, unless of course the leadership accept a
sharply lower growth rates (potentially close to zero).
However, as discussed (here), the challenge facing China (which was not the case
with Japan in 1990s) is that unlike Japan, China has very high levels of income
and wealth inequality, and hence, sharp slowdown could result in much more
robust social dislocation and given lack of strong institutions of state capable of
delivering impersonal services, it could also lead to an accelerated capital flight
(something that was not the case in Japan).
Fig 55 China – TFP Growth Rates (%) – productivity growth might have already gone negative...
Fig 56 China – GDP Growth Rates (%) – nominal GDP is down significantly
Source: TED; Macquarie Research, July 2016 Source: CEIC; Macquarie Research, July 2016
Fig 57 China – Saving & Investment Rate (% GDP) – saving rates remain high, which need to be invested
Fig 58 China – ICOR Rates (x) ...leading to rising incremental-output ratios and...
Source: World Bank; Macquarie Research, July 2016 Source: World Bank; Macquarie Research, July 2016
-4.0
-2.0
0.0
2.0
4.0
6.0
8.0
20
00
20
01
20
02
20
03
20
04
20
05
20
06
20
07
20
08
20
09
20
10
20
11
20
12
20
13
20
14
Official Wu-Maddison
4.0%
6.0%
8.0%
10.0%
12.0%
14.0%
16.0%
18.0%
20.0%
22.0%
4.0%
5.0%
6.0%
7.0%
8.0%
9.0%
10.0%
11.0%
12.0%
13.0%
Mar-
10
Jul-1
0
No
v-1
0
Mar-
11
Jul-1
1
Nov-1
1
Ma
r-1
2
Jul-1
2
Nov-1
2
Mar-
13
Ju
l-1
3
Nov-1
3
Mar-
14
Jul-1
4
No
v-1
4
Mar-
15
Jul-1
5
Nov-1
5
Ma
r-1
6
Real GDP Nominal GDP, rhs
20%
25%
30%
35%
40%
45%
50%
55%
19
80
19
82
19
84
19
86
19
88
19
90
19
92
19
94
19
96
19
98
20
00
20
02
20
04
20
06
20
08
20
10
20
12
20
14
Saving Rate Gross Capital Formation
-
1.00
2.00
3.00
4.00
5.00
6.00
7.00
19
91
19
92
19
93
19
94
19
95
19
96
19
97
19
98
19
99
20
00
20
01
20
02
20
03
20
04
20
05
20
06
20
07
20
08
20
09
20
10
20
11
20
12
20
13
20
14
20
15
20
16
China - ICOR Average 1991-2007
China’s agony of
currency, debt,
investment &
structural reform

Macquarie Research Rights, Wrongs & Returns
15 July 2016 25
Fig 59 China – National debt to GDP (%) - ...rising debt levels and its declining efficiency with...
Fig 60 China – Financing Requirement to generate GDP (x) ...$3-4 of debt required for every $ of GDP
Source: World Bank; Macquarie Research, July 2016 Source: CEIC; Macquarie Research, July 2016
Whilst the economy is slowly re-balancing, the pace is glacial and in the absence
of more robust policy changes, it would take decades to complete. There is limited
difference between real retail sales (as a consumption proxy) and real fixed asset
investment; at the same time, whilst services contribution is increasing, the areas
of the greatest growth are the least productive segments (finance and real estate).
Fig 61 China – Household & government Consumption (% GDP) – very slow re-balancing
Fig 62 China – Services are growing but mostly in financial and real estate sub-sectors
Source: CEIC; Macquarie Research, July 2016 Source: CEIC; Macquarie Research, July 2016
As we highlighted recently (refer What caught my eye? v.56 - Capital – Time for
a vegetarian diet? 11 May 2016), China needs to reconsider how and where it
invests its savings. Instead of compounding current over-capacity challenges,
China needs to invest much more in ‘softer areas’ (such as social, education, R&D,
skilling, welfare, medical care, intellectual property rights etc). However, this would
require a major mental shift from regarding government departments as project
managers to becoming stewards of public funds and from mega projects to
multitude of small and less glamorous investments that has capacity to improve
longer-term labour productivity. It seems unlikely that this mental shift would occur
until circumstances change. In other words, it might need to get much worse.
We maintain that ‘canary in the coalmine’ would be corporate profitability and
corporate ROEs (as indeed it was the case in Japan of 1980s-early 1990s).
As highlighted in our previous notes, there are already strong signs of eroding ROEs.
What can be done to alter the current self-destructive course?
We continue to believe that the key lies in the ability of China to undertake deep
domestic (non-capital markets) structural reforms. Whilst China is exceptionally
competitive internationally, it is not very productive domestically. We estimate that
China’s agricultural productivity is less than 10% of the US levels; the productivity of
its utilities sector is not much more than 20% of the US and construction is around
40%. Domestic reforms should aim to lift agricultural productivity, increase mobility of
labour and confront domestic SOE monopolies. Whilst there are a number of
tentative moves at the local level, there has been no evidence over the last three
years, that China is prepared and willing to confront vested interests in the areas of
greatest monopolistic profit (but also areas of the greatest labour hoarding).
0%
50%
100%
150%
200%
250%
300%
350%
2000 2007 2008 2009 2010 2011 2012 2013 2014 2015
Public Sector Non-Financial Corporates Household Financial
-
0.5
1.0
1.5
2.0
2.5
3.0
3.5
4.0
4.5
5.0
20
01
20
02
20
03
20
04
20
05
20
06
20
07
20
08
20
09
20
10
20
11
20
12
20
13
20
14
20
15
Financing needed for Rmb of GDP Growth
0.0%
2.0%
4.0%
6.0%
8.0%
10.0%
12.0%
14.0%
16.0%
18.0%
25.0%
35.0%
45.0%
55.0%
65.0%
75.0%
1952
1956
1960
1964
1968
1972
1976
1980
1984
1988
1992
1996
2000
2004
2008
2012
HH Consumption Government Consumption, rhs
-10.0
-5.0
0.0
5.0
10.0
15.0
20.0M
ar-
08
Au
g-0
8
Jan
-09
Jun
-09
Nov-0
9
Apr-
10
Se
p-1
0
Feb-1
1
Jul-
11
Dec-1
1
May-1
2
Oct-
12
Mar-
13
Au
g-1
3
Jan
-14
Ju
n-1
4
No
v-1
4
Apr-
15
Se
p-1
5
Fe
b-1
6
Wholesale & reatail Accomodation & Catering
Financial Intermediation Other Services
Real Estate
The pace of re-
balancing is
“glacial” whilst...
...domestic
structural reforms
are not progressing

Macquarie Research Rights, Wrongs & Returns
15 July 2016 26
In the absence of any meaningful domestic reforms, the only other alternative
available to China (in order to raise productivity) is to become even more efficient
and competitive externally. However, the challenge is that China is already
approaching a ‘technology frontier’ and hence it becomes harder to continue
climbing the value chain at the same pace as it used to in the previous decade. Also,
unlike Japan in the 1990s, China is unlikely to benefit from accelerating global trade
and growth. Hence it is facing a far more difficult task of attempting to raise share of
a static market. However, this can be only achieved by lower unit labour costs,
either through lower wages or lower currency. Given the choices, we continue to
believe that China is far more likely to depreciate currency, although the pace of
depreciation would critically depend on the domestic liquidity environment and on
the policy options and decisions of other Central Banks (principally the Fed, BoJ and
ECB).
As can be seen below, despite some mild recent depreciation, the Rmb remains in
overvalued territory. If indeed, the BoJ embarks on a much more aggressive course
(i.e. the BoJ funded government and consumption spending) and the Eurozone
decides on a more aggressive course and the Fed tightens, it is almost guaranteed
that the Rmb would fall significantly below 7 (against the US$). As described below,
this would unleash a potentially significant global deflationary wave.
Fig 63 Real Effective Exchange Rates (REER)
Source: BIS; Bloomberg; Macquarie Research, June 2016
China would prefer that all other Central Banks remain stationary and allow China
freedom to slowly and gently depreciate Rmb without causing any significant
domestic or global dislocation whilst providing the country with pressure outlet to
ensure some degree of support. Unfortunately, we do not believe that this is likely
to occur, as both Japan and Eurozone need to embark on a much more
aggressive course whilst the Fed might commit an error of premature tightening.
4. ‘The agony of the Fed’ – will they or won’t they? Can they?
We continue to believe that although the Fed would like to return back to some
form of normality of monetary and economic policies it would be unable to do so.
Hence, although the sell-side continues to insist on expected several tightening
cycles, the buy-side is not buying it. The Fed needs to maintain the narrative of
normalization (otherwise investors would be questioning the ability of corporates to
deliver EPS growth rates), but it is doubtful that it would be able to tighten. Indeed,
even if it does tighten, it is likely that Greenspan’s conundrum would strike again,
with the yield curve continuing to flatten.
60
70
80
90
100
110
120
130
140
150
Jan
-95
Feb
-96
Mar
-97
Ap
r-9
8
May
-99
Jun
-00
Jul-
01
Au
g-0
2
Sep
-03
Oct
-04
No
v-0
5
De
c-0
6
Jan
-08
Feb
-09
Mar
-10
Ap
r-1
1
May
-12
Jun
-13
Jul-
14
Au
g-1
5China Japan Korea Eurozone US
Rmb OvervaluedRmb undervalued
This leaves
currency to do most
of the lifting

Macquarie Research Rights, Wrongs & Returns
15 July 2016 27
In our view, there are three challenges facing the Fed:
The dynamics of the US labour market – deformed
As discussed in our previous notes (here) whether one defines the US
labour market as ‘fissured’ or ‘gig’ economy or attaches some other
description, it is clear that labour market has deformed to an extent that it
is impossible to estimate labour market slack or indeed, the extent to
which labour costs are likely to accelerate, particularly as productivity
rates remain low (whether measured by output per hour or TFP).
As can be seen below, despite an extended recovery (it has been 85
months since the end of recession vs. an historical average since 1947 of
58 months), neither labour participation rates nor proportion of
employment in full time jobs nor wage growth outcomes seem to fit nicely
into the narrative of rapidly diminishing slack, leading to an accelerating
flow into wage outcomes. The same applies to conventional demographic
arguments, with participation rates amongst Baby Boomers and older
rising whilst prime cohorts are stagnating and/or declining.
Fig 64 US – Labour Force Participation (%) Fig 65 US – Labour Participation – Prime Cohort
Source: CEIC; Macquarie Research, July 2016 Source: CEIC; Macquarie Research, July 2016
Fig 66 US – Part-Time Employment/Total (%) Fig 67 US – Low vs High End Jobs (%)
Source: CEIC; Macquarie Research, July 2016 Source: CEIC; Macquarie Research, July 2016
Fig 68 US – Average Hourly Earnings (% YoY) Fig 69 US – Employment Cost Index (% YoY)
Source: CEIC; Macquarie Research, July 2016 Source: CEIC; Macquarie Research, July 2016
54.0
56.0
58.0
60.0
62.0
64.0
66.0
68.0
Jan-4
8
De
c-5
0
Nov-5
3
Oc
t-5
6
Se
p-5
9
Au
g-6
2
Jul-6
5
Jun-6
8
May
-71
Ap
r-7
4
Ma
r-7
7
Feb-8
0
Jan-8
3
Dec-8
5
No
v-8
8
Oc
t-9
1
Se
p-9
4
Au
g-9
7
Jul-0
0
Ju
n-0
3
May
-06
Ap
r-0
9
Mar-
12
Fe
b-1
5
Labour Force Participation rate
86.0
87.0
88.0
89.0
90.0
91.0
92.0
93.0
94.0
95.0
96.0
Ma
r-8
2
Se
p-8
3
Ma
r-8
5
Se
p-8
6
Ma
r-8
8
Se
p-8
9
Ma
r-9
1
Se
p-9
2
Ma
r-9
4
Se
p-9
5
Ma
r-9
7
Se
p-9
8
Ma
r-0
0
Se
p-0
1
Ma
r-0
3
Se
p-0
4
Ma
r-0
6
Se
p-0
7
Ma
r-0
9
Se
p-1
0
Ma
r-1
2
Se
p-1
3
Ma
r-1
5
25-34Y 35-44Y
Males
12.0%
13.0%
14.0%
15.0%
16.0%
17.0%
18.0%
19.0%
20.0%
Ja
n-6
8
Fe
b-7
0
Ma
r-7
2
Ap
r-7
4
May
-76
Ju
n-7
8
Ju
l-8
0
Au
g-8
2
Se
p-8
4
Oc
t-8
6
No
v-8
8
De
c-9
0
Ja
n-9
3
Fe
b-9
5
Ma
r-9
7
Ap
r-9
9
May
-01
Ju
n-0
3
Ju
l-0
5
Au
g-0
7
Se
p-0
9
Oc
t-1
1
No
v-1
3
De
c-1
5
Part-Time/Total Employment
Expansionary phases
43.0%
43.5%
44.0%
44.5%
45.0%
45.5%
36.0%
37.0%
38.0%
39.0%
40.0%
41.0%
42.0%
43.0%
Ja
n-9
0
Ma
y-9
1
Se
p-9
2
Ja
n-9
4
Ma
y-9
5
Se
p-9
6
Ja
n-9
8
Ma
y-9
9
Se
p-0
0
Ja
n-0
2
May
-03
Se
p-0
4
Ja
n-0
6
Ma
y-0
7
Se
p-0
8
Ja
n-1
0
Ma
y-1
1
Se
p-1
2
Ja
n-1
4
Ma
y-1
5
Lowest Paid Occupations (% of Private)
Highest Paid Occupations (% of Private), rhs
0.0%
0.5%
1.0%
1.5%
2.0%
2.5%
3.0%
3.5%
4.0%
4.5%
5.0%
Jan-0
0
Oct-
00
Jul-
01
Apr-
02
Jan-0
3
Oct-
03
Ju
l-04
Apr-
05
Ja
n-0
6
Oct-
06
Jul-
07
Apr-
08
Jan-0
9
Oct-
09
Jul-
10
Apr-
11
Ja
n-1
2
Oct-
12
Ju
l-13
Apr-
14
Jan-1
5
Oct-
15
Private Sector
0.0%
0.5%
1.0%
1.5%
2.0%
2.5%
3.0%
3.5%
4.0%
4.5%
Mar-
02
De
c-0
2
Se
p-0
3
Jun-0
4
Ma
r-0
5
Dec-0
5
Se
p-0
6
Ju
n-0
7
Mar-
08
Dec-0
8
Se
p-0
9
Jun-1
0
Mar-
11
De
c-1
1
Se
p-1
2
Jun-1
3
Ma
r-1
4
Dec-1
4
Se
p-1
5
Private Cost Private Wages
Fed’s agony is
centred on
deformed labour
markets...

Macquarie Research Rights, Wrongs & Returns
15 July 2016 28
Fig 70 US – Productivity per Hour (%) Fig 71 US – TFP Growth rates (%)
Source: CEIC; Macquarie Research, July 2016 Source: SF Fed; Macquarie Research, July 2016
It seems to us that a structural shift in labour market towards lower
productivity occupations and increasing fracturing of professions and
occupations (an integral part of our ‘declining returns on humans’
thesis) implies that labour inputs are neither as valuable nor as required
as in previous decades. At the same time, given a higher than average
degree of uncertainty (imbedded in a ‘gig’ or ‘fissured’ economy), it is far
from clear to us that personal saving rates would decline. A lower return
on money (as a consequence of overcapacity and monetary activism)
implies the need for much higher rather than lower savings.
Inflationary climate remains benign – on almost any measure
Whether one examines CPI, core CPI, PPI or core PPI or the broadest
measures of inflation (deflators) or indeed inflation break-even rates
(TIPS), there is no evidence of any significant build-up of inflationary
pressures. Indeed, the same applies even if we examine 5Y/5Y (i.e.
inflation expectation in five years’ time).
Fig 72 US – GDP deflator (%) Fig 73 US – PCE (%)
Source: CEIC; Macquarie Research, July 2016 Source: CEIC; Macquarie Research, July 2016
Fig 74 US – CPI (% YoY) Fig 75 US – Core CPI (% YoY)
Source: CEIC; Macquarie Research, July 2016 Source: CEIC; Macquarie Research, July 2016
0.0%
0.5%
1.0%
1.5%
2.0%
2.5%
3.0%
3.5%
1901
-10
1911
-20
1921
-30
1931
-40
1941
-49
1950
-54
1955
-59
1960
-64
1965
-69
1970
-74
1975
-79
1980
-84
1985
-89
1990
-94
1995
-99
2000
-04
2005
-09
2010
-15
Productivity Average (1970-2015) Average (1901-70)
Illusion?
-0.5
0.0
0.5
1.0
1.5
2.0
2.5
1950
-1955
1956
-1960
1961
-1965
1966
-1970
1971
-1975
1976
-1980
1981
-1985
1986
-1990
1991
-1995
1996
-2000
2001
-2005
2006
-2010
2011
-2015
TFP Growth Rates (%) Average 1950-1980
Average (1980-2015)
0.0
0.5
1.0
1.5
2.0
2.5
3.0
3.5
4.0
Mar-
00
Dec-0
0
Sep-0
1
Jun-0
2
Mar-
03
Dec-0
3
Sep-0
4
Jun-0
5
Mar-
06
Dec-0
6
Sep-0
7
Jun-0
8
Mar-
09
Dec-0
9
Sep-1
0
Jun-1
1
Mar-
12
Dec-1
2
Sep-1
3
Jun-1
4
Mar-
15
Dec-1
5
GDP Deflator Average (1950-2014)
Average (1990-2014)
1.2%
-2.0
-1.0
0.0
1.0
2.0
3.0
4.0
5.0
Ma
r-00
Dec
-00
Se
p-0
1
Ju
n-0
2
Mar-
03
Dec
-03
Se
p-0
4
Jun
-05
Ma
r-06
Dec
-06
Se
p-0
7
Jun
-08
Mar-
09
De
c-0
9
Se
p-1
0
Jun
-11
Mar-
12
Dec
-12
Se
p-1
3
Jun
-14
Mar-
15
De
c-1
5
PCE (YoY %) Average (1950-2014)
Average (1990-2014)
1.0%
-3.0
-2.0
-1.0
0.0
1.0
2.0
3.0
4.0
5.0
6.0
Ja
n-0
0
Oct-
00
Jul-0
1
Apr-
02
Jan-0
3
Oct-
03
Jul-0
4
Apr-
05
Jan-0
6
Oct-
06
Ju
l-0
7
Apr-
08
Jan-0
9
Oct-
09
Jul-1
0
Apr-
11
Jan-1
2
Oct-
12
Ju
l-1
3
Apr-
14
Jan-1
5
Oct-
15
CPI (YoY %) Average (1960-2015)
Average (1990-2015)
0.0
0.5
1.0
1.5
2.0
2.5
3.0
3.5
4.0
4.5
Ja
n-0
0
Oc
t-0
0
Jul-0
1
Ap
r-0
2
Jan-0
3
Oc
t-0
3
Ju
l-0
4
Ap
r-0
5
Jan-0
6
Oc
t-0
6
Jul-0
7
Ap
r-0
8
Ja
n-0
9
Oc
t-0
9
Jul-1
0
Ap
r-1
1
Jan-1
2
Oc
t-1
2
Jul-1
3
Ap
r-1
4
Jan-1
5
Oc
t-1
5
Core CPI (YoY %) Average (1960-2015)
Average (1990-2015)
...lack of inflationary
pressures and...

Macquarie Research Rights, Wrongs & Returns
15 July 2016 29
Fig 76 US – PPI & Core PPI (%) Fig 77 US – Inflation Break-Even Rates (5Y & 3Y)
Source: CEIC; Macquarie Research, July 2016 Source: CEIC; Macquarie Research, July 2016
Nominal GDP has de-rated with limited capability for re-acceleration
The US economy has undergone over the last decade a significant de-
acceleration, with nominal GDP growth rates slowing from the run rate of
~5%-6% per annum towards 3%-3.5%.
Whilst it is by far the best performance amongst major economies (due to
a lower pre-existing debt burden as well as a much more aggressive
combination of fiscal and monetary response post GFC), it nevertheless is
not sufficiently robust to widen US current account deficit and inject
sufficient demand and US$ into global economy. There does not appear
anything right now that would suggest probability of sustained
acceleration of growth rates, with excessive debt burden and limited (if
any) productivity gains, leaving the US economy range bound.
We would also argue that it is highly unlikely that non-residential fixed
asset investment is likely to increase due to: (a) significant structural shifts
that are altering the importance of both infrastructure and human inputs;
and (b) an aggressive public sector stance which reduces private sector
visibility, both in terms of demand and supply but perhaps more
importantly price of money. We maintain that it is far more rational to
engage in financial engineering (such as dividends and share buy-backs)
and/or support margins through the creation of monopolies and
oligopolies (i.e. M&A) rather than committing resources to uncertain fixed
asset projects.
Fig 78 US – Nominal GDP (% YoY) Fig 79 US – Real Final Sales (4QMMA %)
Source: CEIC; Macquarie Research, July 2016 Source: CEIC; Macquarie Research, July 2016
0.0
0.5
1.0
1.5
2.0
2.5
3.0
3.5
-2.0
-1.0
0.0
1.0
2.0
3.0
4.0
5.0
Apr-
11
Ju
l-11
Oct-
11
Ja
n-1
2
Apr-
12
Ju
l-12
Oct-
12
Jan-1
3
Apr-
13
Jul-
13
Oct-
13
Jan-1
4
Apr-
14
Jul-
14
Oct-
14
Jan-1
5
Apr-
15
Jul-
15
Oct-
15
Jan-1
6
Apr-
16
PPI Final Demand PPI Final Demand ex Food & Energy, rhs
0.5
0.7
0.9
1.1
1.3
1.5
1.7
1.9
2.1
2.3
2.5
Ja
n-1
3
Mar-
13
Ma
y-1
3
Jul-
13
Se
p-1
3
Nov
-13
Jan-1
4
Mar-
14
May-1
4
Jul-
14
Se
p-1
4
Nov
-14
Jan-1
5
Mar-
15
May-1
5
Jul-
15
Se
p-1
5
No
v-1
5
Jan-1
6
Mar-
16
May-1
6
Ju
l-16
USGGBE05 USGGBE03
-4.0
-2.0
0.0
2.0
4.0
6.0
8.0
10.0
Mar-
85
Jul-8
6
Nov-8
7
Mar-
89
Jul-9
0
Nov-9
1
Mar-
93
Jul-9
4
Nov-9
5
Mar-
97
Jul-9
8
No
v-9
9
Mar-
01
Jul-0
2
No
v-0
3
Mar-
05
Jul-0
6
No
v-0
7
Mar-
09
Jul-1
0
No
v-1
1
Mar-
13
Jul-1
4
No
v-1
5
Nominal GDP (% YoY) Average (1980-2014)
-4.0
-2.0
0.0
2.0
4.0
6.0
8.0
10.0
Mar-
60
Au
g-6
2
Jan-6
5
Jun-6
7
Nov-6
9
Ap
r-7
2
Se
p-7
4
Feb-7
7
Jul-7
9
Dec-8
1
May
-84
Oc
t-8
6
Mar-
89
Au
g-9
1
Jan-9
4
Jun-9
6
Nov-9
8
Ap
r-0
1
Se
p-0
3
Feb-0
6
Jul-0
8
De
c-1
0
Ma
y-1
3
Oc
t-1
5
Real Final sales 4QMMA Average (1960-2013)
...low productivity
and constrained
nominal GDP and
inability to stimulate
investment or...

Macquarie Research Rights, Wrongs & Returns
15 July 2016 30
Fig 80 US – Real Household Income (Median) Fig 81 US – Gini Income Inequality Index
Source: CEIC; Macquarie Research, July 2016 Source: CEIC; Macquarie Research, July 2016
Fig 82 US – Residential vs. Non-residential Investment(Real % YoY)
Fig 83 US – Gross capital Formation (% GDP)
Source: CEIC; Macquarie Research, July 2016 Source: BEA; Macquarie Research, July 2016
Fig 84 US – NF Corporates Dividends & Share buy backs (US$ bn)
Fig 85 US – Current Account (US$ bn)
Source: Fed; Macquarie Research, July 2016 Source: CEIC; Macquarie Research, July 2016
On balance, it is not clear to us that there is a strong case to be made for tightening
in the domestic context, other than arguing that keeping rates artificially low for an
extended period invites anomalies that could jeopardize domestic financial and
asset markets. However, that argument has been the case for at least a decade
(if indeed arguably since 1990s). Neither politics nor society seems to be prepared
to accept sharply slower growth rates commensurate with low productivity.
If the Fed tightens, it is likely that apart from the negative impact via equities and
earnings expectations (and it needs to be remembered that equity and equity-
linked securities are the second largest HH asset class and there is a strong
correlation between net assets to disposal income on the one hand and personal
savings on the other), rising US$ could also prompt more robust depreciation of
Rmb and hence increase the pace of the US wholesale price deflation.
-3.0%
-2.0%
-1.0%
0.0%
1.0%
2.0%
3.0%
4.0%
5.0%
35,000
40,000
45,000
50,000
55,000
60,000
69 72 75 78 81 84 87 90 93 96 99 02 05 08 11 14
Median Household Income (Real) 3Y MMA
0.340
0.360
0.380
0.400
0.420
0.440
0.460
0.480
0.500
19
67
19
69
19
71
19
73
19
75
19
77
19
79
19
81
19
83
19
85
19
87
19
89
19
91
19
93
19
95
19
97
19
99
20
01
20
03
20
05
20
07
20
09
20
11
20
13
-30
-25
-20
-15
-10
-5
0
5
10
15
20
Mar-
00
Dec-0
0
Se
p-0
1
Jun-0
2
Mar-
03
Dec-0
3
Se
p-0
4
Jun-0
5
Mar-
06
Dec-0
6
Se
p-0
7
Jun-0
8
Mar-
09
De
c-0
9
Se
p-1
0
Jun-1
1
Mar-
12
De
c-1
2
Se
p-1
3
Jun-1
4
Mar-
15
De
c-1
5
Non-Residential Residential
15.0%
17.5%
20.0%
22.5%
25.0%
27.5%
19
50
19
53
19
56
19
59
19
62
19
65
19
68
19
71
19
74
19
77
19
80
19
83
19
86
19
89
19
92
19
95
19
98
20
01
20
04
20
07
20
10
20
13
20
16
National Gross Capital Formation/GDP
Average (1950-1990)
Average (1990-2013)
0
200
400
600
800
1,000
1,200
19
52
Q1
19
54
Q2
19
56
Q3
19
58
Q4
19
61
Q1
19
63
Q2
19
65
Q3
19
67
Q4
19
70
Q1
19
72
Q2
19
74
Q3
19
76
Q4
19
79
Q1
19
81
Q2
19
83
Q3
19
85
Q4
19
88
Q1
19
90
Q2
19
92
Q3
19
94
Q4
19
97
Q1
19
99
Q2
20
01
Q3
20
03
Q4
20
06
Q1
20
08
Q2
20
10
Q3
20
12
Q4
20
15
Q1
Net dividends & Share Buy backs
-6.0
-5.0
-4.0
-3.0
-2.0
-1.0
0.0
1.0
2.0
-900.0
-800.0
-700.0
-600.0
-500.0
-400.0
-300.0
-200.0
-100.0
0.0
100.0
1971
1974
1977
1980
1983
1986
1989
1992
1995
1998
2001
2004
2007
2010
2013
CA (US$ bn) % GDP, rhs
...sufficient demand
and US$ into global
economy

Macquarie Research Rights, Wrongs & Returns
15 July 2016 31
Fig 86 US – HH Net Assets/Disposable Income vs. Personal Saving Rates
Fig 87 US – China Import Prices (%)
Source: Fed; Macquarie Research, July 2016 Source: CEIC; Macquarie Research, July 2016
5. ‘De-globalization & Populism agony’ – brand new world is dawning
As discussed in our prior notes (refer What caught my eye? v.44 - Barbarians at
the gate, 5 August 2015), we believe that investors are increasingly residing in a
world characterized by de-globalization (reversal of the key trend over the previous
three decades).
The key drivers of this reversal are a combination of:
Declining global productivity trends, due in part to the impact of ‘Third
Industrial Revolution’ and also by unintended consequences of the public
sector fight against strong deflationary pressures and avoidance of
closure of excess capacity. As cost of capital has been kept artificially low,
it discourages rationalization of excess capacity whilst encouraging
unproductive malinvestment.
Rising global, regional and local income and wealth inequalities.
The trend has been decades in the making and in our view was driven by
a similar toxic mix of declining productivity and aggressive public sector
(predominantly monetary) response. One could also argue (as Marxists
do) that rising inequalities is just part and parcel of capital system
evolution that ultimately gets reset either in revolution or destruction of
military conflicts (here). Marxists’ argument works through businesses
and owners of capital capturing institutions of state (such as regulators).
Declining returns on humans, and hence the ‘agony’ of countries that
happened to have surplus of human power. In other words, the mix of the
above factors implies that demographic dividends are turning into
demographic curses, and hence, social and geopolitical tensions; waves
of immigrants and the prospect of some of the largest movements of
people in search of non-existent jobs.
The most obvious political and societal answer is not just proactive fiscal and
monetary policies (to reduce the level of pain) but also deglobalization to protect
interests of local residents and citizens. Although most of the ‘global elites’ would
attempt to stop it, it is unlikely that they would succeed, as we expect the public
would continue to cry out for help and politics would respond (as indeed it is
already occurring now from the US elections to Brexit to France, Austria etc).
Ultimately this would lead to even less growth and trade but would also change
investment styles. As referred to the above, we believe this would be the time for
‘Follow the governments’ portfolios, including investment in least efficient
and most protected domestic companies and stocks.
Whilst we believe that this trend is both inevitable and irreversible, the question
from an investors’ perspective is one of timing. Has it already arrived? Our answer
not yet but it is just a matter of time, and the next six to twelve months should be
critical in charting this course.
0
5
10
15
400
450
500
550
600
650
700
19
53
Q3
19
56
Q3
19
59
Q3
19
62
Q3
19
65
Q3
19
68
Q3
19
71
Q3
19
74
Q3
19
77
Q3
19
80
Q3
19
83
Q3
19
86
Q3
19
89
Q3
19
92
Q3
19
95
Q3
19
98
Q3
20
01
Q3
20
04
Q3
20
07
Q3
20
10
Q3
20
13
Q3
Net Worth/Disposable IncomeNet Worth/Disposable Income (average)Personal Saving rate, rhs
-4%
-3%
-2%
-1%
0%
1%
2%
3%
4%
5%
6%
-10%
-5%
0%
5%
10%
15%
Dec-0
4
Jul-05
Feb
-06
Sep
-06
Ap
r-07
No
v-0
7
Jun-0
8
Jan-0
9
Aug
-09
Mar-
10
Oct-
10
May-1
1
Dec-1
1
Jul-12
Feb
-13
Sep
-13
Ap
r-14
No
v-1
4
Jun-1
5
Jan-1
6
RMB/$ y/y chg (lhs) US Import prices f rom China y/y ($)
Fifth, agony for
investors is de-
globalization and
populism and how
to reflect it in
portfolios

Macquarie Research Rights, Wrongs & Returns
15 July 2016 32
The world of no earnings & high multiples As discussed in our latest ‘Rights, Wrongs & Returns’ quarterly review in April 2016 (here),
investors are now residing in the world of no growth, no trade, the tail end of more
conventional monetary and buy-back policies and no EPS. As investors progress into the
world completely dominated by the state (refer Pendulum is swinging towards the state)
the dynamics would change (though ultimately not for the better, as it would be public rather
than private sector multiplying demand). In the meantime, we do not believe that there will
be any meaningful EPS growth rates anywhere globally.
No EPS growth in 2015-16; but analytical bias creeps into 2017
As can be seen below, investor expectations for 2015 SPX earnings (in late 2014) were for
EPS of ~US$130/share (up 12%). At the end of the day, 2015 earnings ended up almost flat
on 2014. At the same time in late 2014, investors and analysts were expecting 2016 EPS of
~US$145/share. This dropped to US$125/share in late 2015 and now investors expect
another year of no EPS growth (even ex commodities expectation is not much more than
3%-4%). The cycle however is starting all over again for 2017. In early 2015, expectation for
SPX EPS was ~150/share. It is by now down to US$133/share (i.e. broadly the same level
that investors initially expected for 2015 reporting season). Whether one includes or excludes
commodities, this would represent a double-digit (10%-12%) gain. One also needs to
remember that the above outlined EPS estimates are already after accounting for various
accounting adjustments and the benefit of share buy-backs. According to BEA, the aggregate
corporate level of profitability has been already declining for some time.
Fig 88 SPX – Earnings Estimates (US$/Share) – no growth in 2015 or 2016
Fig 89 SPX EPS & revenue Growth Rates (%)
Source: Thomson; Macquarie Research, July 2016 Source: Thomson; Macquarie Research, July 2016
Fig 90 SPX ex Resources – EPS & revenue growth Fig 91 US – Corporate Sector Profitability (% YoY)
Source: Thomson; Macquarie Research, July 2016 Source: BEA; Macquarie Research, July 2016
Not surprisingly, a similar trend of consistent over estimation of earnings, followed by late
revisions and then once again by downward drift only to have another round of analytical
bias, with acceleration into the following year, is evident on other key regions. Whilst we
believe it would be sad if it was not funny, it does reflect the fundamental nature of equities
when compared to other key asset classes. Whereas fixed income or currency analysts are
quite happy to move either forward or backward, equities generally do not work, unless there
is growth with contained inflation. Hence, the inevitable bias towards growth.
105
110
115
120
125
130
135
140
145
150
155
Feb
-14
Ap
r-1
4
Jun
-14
Au
g-1
4
Oct
-14
De
c-1
4
Feb
-15
Ap
r-1
5
Jun
-15
Au
g-1
5
Oct
-15
De
c-1
5
Feb
-16
Ap
r-1
6
Jun
-16
2015 2016 2017
-5.0
0.0
5.0
10.0
15.0
20.0
2011 2012 2013 2014 2015P 2016E 2017E
EPS Gr Y/y Rev Gr Y/y
Hope never dies
0.0
2.0
4.0
6.0
8.0
10.0
12.0
2013 2014 2015P 2016E 2017E
EPS Gr Y/y Rev Gr Y/y
Hope never dies
-4%
-2%
0%
2%
4%
6%
8%
2014 2015 2016
Pre-Tax
The world of no
earnings...
...anywhere,
including the US

Macquarie Research Rights, Wrongs & Returns
15 July 2016 33
Fig 92 Eurozone – EPS (LC) – No growth in 2016 Fig 93 MSCI China – EPS (LC) – No growth in 2016
Source: Thomson; Macquarie Research, July 2016 Source: Thomson; Macquarie Research, July 2016
Fig 94 MSCI Asia Ex – EPS (US$) – No growth in 2016 Fig 95 Topix – EPS (LC) – still looking for G in Japan
Source: Thomson; Macquarie Research, July 2016 Source: Thomson; Macquarie Research, July 2016
If we focus on Asia ex Japan and its individual components, the picture that emerges is one of
no growth in either 2015 or 2016, whether one includes or excludes commodities and materials.
As highlighted in our recent Microstrategy review (refer MicroStrategy - Beyond Brexit,
back to Asian fundamentals; where to from here? 29 June 2016), we remain concerned
that expectations for 2016 in India and Indonesia remain on the high side, but we are
comfortable with current estimates in China, Taiwan and Korea. However, as we progress
into 2017, analytical bias once again re-asserts itself, and there is almost nowhere to hide
from excessive estimates. We view forecasts in India, Indonesia and Thailand as being
particularly suspect.
Fig 96 MSCI Asia ex Japan – Earnings Estimates (% Growth)
Source: IBES; Thomson; Macquarie Research, June 2016
However, equities clearly move as an interaction between earnings and valuation multiples.
10
11
12
13
14
15
16
17
18
19
Feb
-14
Ap
r-1
4
Jun
-14
Au
g-1
4
Oct
-14
De
c-1
4
Feb
-15
Ap
r-1
5
Jun
-15
Au
g-1
5
Oct
-15
De
c-1
5
Feb
-16
Ap
r-1
6
Jun
-16
2015 2016 2017
4.0
4.5
5.0
5.5
6.0
6.5
7.0
7.5
8.0
Oct-15 Nov-15 Dec-15 Jan-16 Feb-16 Mar-16 Apr-16 May-16 Jun-16
2015 2016 2017
35
40
45
50
55
60
65
70
Feb
-14
Ap
r-1
4
Jun
-14
Au
g-1
4
Oct
-14
De
c-1
4
Feb
-15
Ap
r-1
5
Jun
-15
Au
g-1
5
Oct
-15
De
c-1
5
Feb
-16
Ap
r-1
6
Jun
-16
2015 2016 2017
80
85
90
95
100
105
110
115
120
125
130
Jan
-15
Feb
-15
Mar
-15
Ap
r-1
5
May
-15
Jun
-15
Jul-
15
Au
g-1
5
Sep
-15
Oct
-15
No
v-1
5
De
c-1
5
Jan
-16
Feb
-16
Mar
-16
Ap
r-1
6
May
-16
Jun
-16
2015 2016 2017
Country 2015 2016E 2017E 2015 2016E 2017E
Asia ex Japan 0.2% 2.0% 11.5% 0.1% 1.2% 10.4%
China -3.2% 1.2% 14.8% 4.0% 3.2% 11.6%
India 3.7% 13.2% 18.2% 6.3% 15.3% 17.0%
Indonesia -8.2% 8.2% 13.4% -5.7% 8.4% 14.3%
Korea 16.4% 3.5% 8.7% 15.1% -2.4% 9.1%
Malaysia -1.3% -0.2% 8.4% -2.0% 0.8% 8.1%
Philippines 5.8% 7.4% 9.9% 5.9% 7.2% 9.9%
Singapore -3.8% -1.8% 4.9% -3.8% -1.9% 5.0%
Taiwan 0.0% -4.3% 10.0% -0.4% -5.1% 10.4%
Thailand -1.4% 7.5% 13.6% -5.3% 0.4% 15.3%
Headline MSCI/IBES Ex Energy and Materials

Macquarie Research Rights, Wrongs & Returns
15 July 2016 34
Valuation Multiples; extended to a breaking point in the US; better elsewhere but no bargains
Whilst we firmly believe that in the current distorted world, most valuation methodologies have
largely lost their meaning, nevertheless, sometimes an irrational view becomes reality
simply because investors feel compelled to look for patterns, rather than accept that
there are pretty much no patterns left.
If we look at the US, equities seem to be fully valued on almost any conventional valuation
measure. As frequent readers of our publications know, our favourite measures are CAPE
(Shiller inflation adjusted long-term multiples), Tobin Q (consistent measure of asset value,
akin to Price to Book) and market capitalization to GDP. As can be seen from the tables
below, all three measures signal over valuation (potentially as large as 20%-50%).
In the case of CAPE, the market is currently trading at ~27x vs historic average (1950-2106)
of ~19x and even longer average (1881-2016) of ~16x. Indeed only in 1929-30 and 2000
(Dot.Com) were CAPE multiples higher than they are today. If we examine Tobin Q, the
latest estimate (1Q2016) is currently trading at almost 1x vs. historic average of 0.7x and
academic consensus that the appropriate Tobin Q valuation is somewhere between 0.6x-0.7x.
Tobin Q is now trading at the highest level, apart from 2000 Dot.Com. The same answer is
derived when we examine another broad measure that looks at market capitalization to GDP
(currently ~160% vs. historic average of ~90%), again one of the highest levels ever.
Indeed, the only measure that signals only a moderate overvaluation is the market’s preferred
single point forward PER, which at just under 17x forward earnings is only around 1 standard
deviation above the mean.
Fig 97 US – CAPE (x) – the highest level apart from 1929 and 2000
Fig 98 Tobin Q (x) – the highest level apart from 2000
Source: Shiller; Macquarie Research, July 2016 Source: Fed; Macquarie Research, July 2016
Fig 99 US – Market Capitalization to GDP – one of the highest levels ever (%)
Fig 100 US – Forward PER (x) – almost one standard deviation above 30 year mean
Source: Fed; CEIC; Macquarie Research, July 2016 Source: Thomson; Macquarie Research, July 2016
Whilst investors are used to rolling into the next bullish forecast, if SPX cannot deliver
(at least 5%-7%) EPS growth, the market looks incredibly vulnerable. This allows us to come
to the point that we have made earlier regarding inability of the Fed to tighten, as any
interest rate dislocation and greater US$ headwind, could easily (and quickly) result in
double-digit value decline.
0.0
5.0
10.0
15.0
20.0
25.0
30.0
35.0
40.0
45.0
18
81
.01
18
85
.11
89
0.0
7
18
95
.04
19
00
.01
19
04
.1
19
09
.07
19
14
.04
19
19
.01
19
23
.11
92
8.0
7
19
33
.04
19
38
.01
19
42
.11
94
7.0
7
19
52
.04
19
57
.01
19
61
.1
19
66
.07
19
71
.04
19
76
.01
19
80
.11
98
5.0
7
19
90
.04
19
95
.01
19
99
.12
00
4.0
72
00
9.0
4
20
14
.01
Cyclicaly Adjusted PER Average (1881-2016)
Average (1950-2016)
-
0.20
0.40
0.60
0.80
1.00
1.20
1.40
1.60
1.80
19
51
Q4
19
53
Q4
19
55
Q4
19
57
Q4
19
59
Q4
19
61
Q4
19
63
Q4
19
65
Q4
19
67
Q4
19
69
Q4
19
71
Q4
19
73
Q4
19
75
Q4
19
77
Q4
19
79
Q4
19
81
Q4
19
83
Q4
19
85
Q4
19
87
Q4
19
89
Q4
19
91
Q4
19
93
Q4
19
95
Q4
19
97
Q4
19
99
Q4
20
01
Q4
20
03
Q4
20
05
Q4
20
07
Q4
20
09
Q4
20
11
Q4
20
13
Q4
20
15
Q4
Tobin Q
0%
20%
40%
60%
80%
100%
120%
140%
160%
180%
200%
19
51
Q4
19
53
Q4
19
55
Q4
19
57
Q4
19
59
Q4
19
61
Q4
19
63
Q4
19
65
Q4
19
67
Q4
19
69
Q4
19
71
Q4
19
73
Q4
19
75
Q4
19
77
Q4
19
79
Q4
19
81
Q4
19
83
Q4
19
85
Q4
19
87
Q4
19
89
Q4
19
91
Q4
19
93
Q4
19
95
Q4
19
97
Q4
19
99
Q4
20
01
Q4
20
03
Q4
20
05
Q4
20
07
Q4
20
09
Q4
20
11
Q4
20
13
Q4
20
15
Q4
Market Cap (including financials) / GDP
Market Cap to GDP (avg 1950-2016)
5.0
10.0
15.0
20.0
25.0
Jan
-85
Sep
-86
May
-88
Jan
-90
Sep
-91
May
-93
Jan
-95
Sep
-96
May
-98
Jan
-00
Sep
-01
May
-03
Jan
-05
Sep
-06
May
-08
Jan
-10
Sep
-11
May
-13
Jan
-15
US S&P500 - 12M fw PER
Mean + 1sd
Mean
Mean - 1sd
US valuation
multiples are at a
breaking point...

Macquarie Research Rights, Wrongs & Returns
15 July 2016 35
Whilst it is not possible to have the same rigorous longer-term framework for non-US markets,
nevertheless, over the shorter-term horizon we can also construct CAPE for several
developed markets. In the case of Japan, we estimate that current CAPE is ~19x vs. the
historic average (1982-2016) of ~40x. However, even if we ignore valuation extremes of late
1980s, the average is ~25x, implying that generally at the current levels, CAPE looks not
unreasonable. Eurozone’s CAPE is currently only ~12x whilst UK CAPE is ~13x, again on the
lower side.
Point in time forward PERs also ‘paint’ a very similar picture. In the case of Japan, the market
is currently trading at ~14x forward earnings (below historic averages, even if we ignore
massive past peaks) whilst Eurozone equities are trading at ~13.5x forward earnings, broadly
in line with historic norms.
Fig 101 Japan – CAPE (x) Fig 102 Eurozone - CAPE (x)
Source: Thomson; Macquarie Research, July 2016 Source: Thomson; Macquarie Research, July 2016
Fig 103 MSCI Japan – Forward PER (x) Fig 104 Eurozone – Forward PER (x)
Source: Thomson; Macquarie Research, July 2016 Source: Thomson; Macquarie Research, July 2016
What about Asia ex Japan and most importantly China?
Asia ex Japan equities are now trading at ~12x forward earnings, which is broadly in line
with historic averages. If one excludes Financials, the average valuation multiple indicates a
broadly neutral valuation. China’s equities are currently trading at ~11x forward earnings.
Whilst it is clearly much higher than depressed multiples of closer to 8x-9x earnings earlier in
the year, so long as China does not yet encounter a credit crisis and so long as Rmb
devaluation proceeds at relatively controlled pace, valuations do not signal distress, which if
combined with relatively modest earnings expectations into 2016, makes us reasonably
comfortable maintaining a small overweight position.
5
15
25
35
45
55
65
75
85
95
De
c-8
2
Au
g-8
4
Ap
r-8
6
De
c-8
7
Au
g-8
9
Ap
r-9
1
De
c-9
2
Au
g-9
4
Ap
r-9
6
De
c-9
7
Au
g-9
9
Ap
r-0
1
De
c-0
2
Au
g-0
4
Ap
r-0
6
De
c-0
7
Au
g-0
9
Ap
r-1
1
De
c-1
2
Au
g-1
4
Ap
r-1
6
Japan - CAPE
5
10
15
20
25
30
35
De
c-8
2
De
c-8
4
De
c-8
6
De
c-8
8
De
c-9
0
De
c-9
2
De
c-9
4
De
c-9
6
De
c-9
8
De
c-0
0
De
c-0
2
De
c-0
4
De
c-0
6
De
c-0
8
De
c-1
0
De
c-1
2
De
c-1
4
Eurozone - CAPE
5.0
15.0
25.0
35.0
45.0
55.0
65.0
75.0
85.0
De
c-8
7
Jul-
89
Feb
-91
Sep
-92
Ap
r-9
4
No
v-9
5
Jun
-97
Jan
-99
Au
g-0
0
Mar
-02
Oct
-03
May
-05
De
c-0
6
Jul-
08
Feb
-10
Sep
-11
Ap
r-1
3
No
v-1
4
Jun
-16
MSCI Japan - 12M fw PER
Mean + 1sd
Mean
Mean - 1sd
5.0
10.0
15.0
20.0
25.0
30.0
Jan
-87
Au
g-8
8
Mar
-90
Oct
-91
May
-93
De
c-9
4
Jul-
96
Feb
-98
Sep
-99
Ap
r-0
1
No
v-0
2
Jun
-04
Jan
-06
Au
g-0
7
Mar
-09
Oct
-10
May
-12
De
c-1
3
Jul-
15
Eurozone - 12M fw PER
Mean + 1sd
Mean
Mean - 1sd
...somewhat more
reasonable in
Japan, Eurozone
and Asia ex

Macquarie Research Rights, Wrongs & Returns
15 July 2016 36
Fig 105 MSCI Asia ex Japan – Forward PER (x) Fig 106 MSCI China – Forward PER (x)
Source: Thomson; Macquarie Research, July 2016 Source: Thomson; Macquarie Research, July 2016
In Asia ex Japan, we continue to be concerned that valuations in India (17x), Indonesia (15x)
and the Philippines (19x) could be highly vulnerable to a pullback, if investors’ trust in longer-
term earnings power of these markets is misplaced.
Whilst we are comfortable that both macro and structural environment will remain relatively
benign for India and the Philippines, we are concerned that investors underestimate risks in
Indonesia. Particularly, if there is a much more robust shift in currency exchange rates. As
described above, our base case scenario assumes a steady appreciation of US$ and steady
depreciation of Yen and Rmb. This should continue to place pressure on terms of trade
countries (such as Indonesia and Malaysia) without causing massive dislocation.
However, if policy errors are made (however inadvertently), and suddenly there is much more
robust cross-currency volatility, the impact on Indonesia could be significant.
What is our macro call on country/region selection?
As described above, we maintain that FX is one of the few markets in the world which has
large volumes and which is relatively free and suffers from much a lower degree of direct
state interference (say unlike Bond market) or sentiment (unlike say equities). Accordingly we
view FX as a ‘canary in a coalmine’. We also believe that FX markets fix the world’s most
important price (i.e. US$).
Our selection of countries and markets are therefore primarily driven by views of strength and
direction of US$ and response by other currencies. We have traditionally identified three
possible outcomes (here and here):
1. US$ depreciates and Yen appreciates. This is the ‘goldilocks’ outcome for EM
equities and in particular markets that are commodity driven and suffer from
shortage of capital (such as Brazil, South Africa, Indonesia etc). In this scenario
EM would significantly outperform DMs;
2. US appreciates but steadily and Yen appreciates but also steadily, implying slow-
burn Rmb depreciation. In that scenario EMs should perform in line with DMs but
terms of trade and commodity-driven EM markets are likely to underperform;
3. US$ appreciates rapidly, Yen collapses, forcing an accelerated Rmb depreciation.
In this outcome EM equities are likely to severely underperform DM equities and
terms of trade markets (like Indonesia) would suffer from a potentially massive
decline.
As discussed above, we are very much somewhere between scenario (2) and (3) and hence
over the next 6-12 months we expect EMs to either perform broadly in line or slightly
underperform DMs and within EMs we avoid terms of trade countries and instead focus on
markets with ample domestic liquidity and countries that are mostly consumers rather than
producers of commodities. We are also prepared to pay a premium for shorter-term economic
strength. This continues to tilt us towards India and the Philippines, and to a lesser extent
Taiwan and China.
As far as DMs are concerned, we continue to like Japan, particularly as we expect this to be
the first market to attempt a fully integrated fiscal, income support and monetary policies. As
the first mover, Japan could secure at least temporary advantage. We also similarly remain
concerned that US equities are vulnerable.
7.0
9.0
11.0
13.0
15.0
17.0
19.0
May
-01
Mar
-02
Jan
-03
No
v-0
3
Sep
-04
Jul-
05
May
-06
Mar
-07
Jan
-08
No
v-0
8
Sep
-09
Jul-
10
May
-11
Mar
-12
Jan
-13
No
v-1
3
Sep
-14
Jul-
15
May
-16
MSCI Asia x JP -12M fw PER
Mean + 1sd
Mean (since'06)
Mean - 1sd
5.0
10.0
15.0
20.0
25.0
May
-01
Mar
-02
Jan
-03
No
v-0
3
Sep
-04
Jul-
05
May
-06
Mar
-07
Jan
-08
No
v-0
8
Sep
-09
Jul-
10
May
-11
Mar
-12
Jan
-13
No
v-1
3
Sep
-14
Jul-
15
May
-16
China - 12M fw PER
Mean + 1sd
Mean (since'06)
Mean - 1sd
Our macro calls
revolve around
currencies

Macquarie Research Rights, Wrongs & Returns
15 July 2016 37
Investment Strategy: Quality Growth and Thematics As discussed above, we maintain that investors are essentially residing in a 3non-mean
reversionary world, without any conventional business or capital market cycles.
Under these circumstances, ‘Less is More’ is traditionally the best advice and emphasis on
the ability of corporates to deliver higher than average ROEs, on the back of strong market
positioning and branding, whilst avoiding an undue reliance on revenue growth rates or
leverage, is the key to sustainable (quality) growth. Also, strong secular trends of ‘declining
returns on humans’ (imbedded in the Third Industrial Revolution) provides, in our view,
powerful long-term Thematic opportunities. As highlighted above, there is a possibility that
investors would also embrace alternative strategies, focused on trying to capture changes in
government spending and longer-term trend towards de-globalization.
Portfolios – Still about Quality-Growth and Thematic investing…
In this review, we have made only minor changes to our flagship long only ‘Quality & Stability’
portfolios for Asia ex Japan as well as Global Quality portfolios. Our ‘Sustainable Dividends’,
‘Thematics’ and ‘Anti-Quality’ portfolios from Apr’16 are unchanged. We usually conduct a full
thorough rebalancing at the end of the year.
Our core selection criteria continue to follow the same broad framework in terms of key
financial metrics that we prefer our stocks to exhibit (refer below). Whilst the underlying
stocks have been identified on the basis of widely available fundamentals (reported and
consensus forecasts), we avoid the temptation of following a formulaic black-box approach.
In that sense, we continue to make some exceptions where we find companies are just ‘on
the margin’ of meeting our strict conditions but the core idea is to identify a broad list of
companies that meet all or most of our key conditions.
Summarised below are model portfolios for Asia ex Japan as well as Global investors.
1. Quality/Sustainable Growth: Our ‘Quality/Stability’ model portfolios continue to
emphasise high quality companies that have high ROEs (mostly driven by margins
instead of leverage or revenue); relatively low leverage, positive free cash flow
generation trends. We ignore financials (deflationary/stagflationary environment
should not be supportive of financials). Our core conditions to identify such
companies remain broadly the same as used previously. Key screening criteria:
a. Stocks that delivered and are expected to deliver positive revenue and profit
growth rates most of the years during 2014-2017E.
b. Stocks that are expected to deliver positive recurring profit CAGR growth of
at least 5% over the next 2 years i.e. 2015-2017E. Whilst we look for growth,
this is one of the conditions where we are much more relaxed and we made
several exceptions.
c. Stocks that have a high level of ROE (at least an average of 12% over 2014-
2017E), which we believe should in most cases be able to cover costs of capital.
At the same time, we avoid companies that have or are expected to have
declining ROEs going forward.
d. Average EBITDA margins of 5% over 2014-2017E but at the same time there
is a general trend of rising EBITDA margins during this period, as a measure
of margin sustainability and an attempt to avoid stocks in which ROE
improvements are delivered purely from rising revenues or increasing leverage.
e. We avoid companies with a Net Debt/EBITDA ratio of more than 2x and
rising overall leverage. That said, we are willing to make exceptions as long as
companies do not exhibit a rising leverage trend.
f. We continue to emphasise Free cash flow (FCF) generation and therefore
avoid companies with negative FCF.
g. We exclude Financials completely from the screen, as financials don’t tend to
perform well in either a deflationary or stagflationary climate.
We continue to
recommend non-
mean reversionary
strategies...
...particularly
“Quality Sustainable”
growth and...

Macquarie Research Rights, Wrongs & Returns
15 July 2016 38
h. In our Asia ex portfolios, we place a liquidity filter on market cap greater than
US$2bn (vs. US$5bn in our Global portfolio) to ensure sufficient liquidity basis.
i. There are no explicit valuation criteria although in some extreme cases we
have excluded companies where current PEs seemed extremely high or
extremely low.
j. Lastly, where the shortlisted stocks are also covered by Macquarie fundamental
analysts, we have excluded companies where our analysts have an
‘Underperform’ rating.
Key changes to Asia ex Japan Quality/Stability portfolio: Our current Asia ex JP
‘Quality/Stability’ portfolio continues to have 20 stocks. We have added Amorepacific (Korea)
by removing Nexteer. Macquarie Analysts rate 16 of these stocks as ‘Outperform’ and one
stock as Neutral on a 12-month view. Three stocks in our model portfolio are currently not
rated by Macquarie.
The overall Asia Quality Sustainable Growth portfolio trades at forward PE of ~20x (vs post
2010 average of ~18x and current forward PER, excluding Financials of ~16x-17x) with
simple average ROE of ~24%; 2- year earnings CAGR of ~17% and Negative Net
Debt/EBITDA (i.e net cash). Refer stock composition below.
In terms of performance, our flagship Asia ‘Quality/Stability’ portfolio continues to do well with
year to date outperformance (over MXASJ, US$, Total returns basis) of 4%. Our model
portfolio has delivered an outperformance of over 28% since inception (March-2013).
In our Global ‘Quality & Stability’ portfolio, we now have 40 stocks (vs 42 earlier). We
have added three stocks: Alphabet, NVIDIA and Illumina; whilst we have removed 5 stocks
(ITV Plc, Toyota Motor, AbbVie, Danone and Telenor).
The overall Global Quality list trades at similar (as Asia) forward PE of ~20x (vs post 2010
average of ~18.5x) with simple average ROE of ~26%; 2-year earnings CAGR of ~11% and
Negative Net Debt/EBITDA (i.e net cash). Refer stock composition below.
In terms of performance, whilst it is early days, our Global Quality portfolio is broadly flat YTD
and it is up by ~100bps since re-balancing in April 2016.
Fig 107 Macquarie –Asia ex ‘Quality’ portfolio performance relative to MSCI Asia ex (since inception March 2013 until July 2016)
Fig 108 Macquarie –Asia ex ‘Quality’ portfolio performance relative to MSCI Asia ex (since April-16 rebalancing until July 2016)
Source: Bloomberg, Macquarie Research, July 2016: Note – Equal weighted portfolio; Returns are dollar returns including dividends; Excludes transaction costs; Past performance is not a guarantee of future performance; Until close of 11-July 2016
Source: Bloomberg, Macquarie Research, July 2016: Note – Equal weighted portfolio; Returns are dollar returns including dividends; Excludes transaction costs; Past performance is not a guarantee of future performance; Until close of 11-July 2016
95
100
105
110
115
120
125
130
135
Mar
-13
May
-13
Jul-
13
Sep
-13
No
v-1
3
Jan
-14
Mar
-14
May
-14
Jul-
14
Sep
-14
No
v-1
4
Jan
-15
Mar
-15
May
-15
Jul-
15
Sep
-15
No
v-1
5
Jan
-16
Mar
-16
May
-16
Jul-
16
ASXJ "Quality and Stability" portfolio (rel to MSCI ASXJ, $ TR basis)
-8
-6
-4
-2
0
2
4
6
8
10
13
-Ap
r-1
6
20
-Ap
r-1
6
27
-Ap
r-1
6
4-M
ay-1
6
11
-May
-16
18
-May
-16
25
-May
-16
1-J
un
-16
8-J
un
-16
15
-Ju
n-1
6
22
-Ju
n-1
6
29
-Ju
n-1
6
6-J
ul-
16
Excess returns "Quality/Stability" returns MXASJ $

Ma
cq
ua
rie R
es
ea
rch
R
igh
ts, W
ron
gs &
Re
turn
s
15
Ju
ly 2
016
39
Fig 109 Macquarie –Asia ex JP ‘Quality’ stock list (July-2016 edition)
Source: FactSet, Macquarie Research, July 2016; Fundamental data based on FactSet consensus estimates including covered stocks; Priced as of close of 14-July 2016
Ticker Company Name GICS L3 Name Reco. Analyst Name CountryMarket Cap
(US$M)
Target price
(Listing crncy)
Upside /
Downside
(%)
ROE ('16E)
Net debt /
EBITDA
('16E)
EBITDA
mgns
('16E)
Earnings
CAGR '15-
17
3M, perf
(LC), %
PER-12m
fw
PER-Avg
12M fw
(since'10)
% change
in 12m fw
EPS vs 3M
ago
700 HK Tencent Internet Software & ServicesO/P Wendy Huang HONG KONG 218,305 204.00 12.6 31.1 (1.8) 30.5 29.6 13.1 31.4 27.6 5.1%
2330 TT TSMC Semiconductors & Semiconductor EquipmentO/P Patrick Liao TAIWAN 136,910 180.00 6.8 23.8 (1.2) 33.9 5.6 7.9 13.2 12.6 3.2%
ST SP SingTel Diversified Telecommunication ServicesO/P Prem Jearajasingam SINGAPORE 49,969 4.42 3.8 15.5 2.2 23.3 5.8 16.8 16.6 14.0 0.2%
ITC IN ITC Tobacco O/P Amit Mishra INDIA 44,852 385.00 56.4 31.2 (1.2) 26.9 12.8 15.3 25.6 24.9 2.7%
INFO IN Infosys Limited IT Services N/R N/R INDIA 40,174 N/R N/R 23.8 (2.7) 21.0 12.5 (0.5) 17.4 17.7 2.5%
000333 CH Midea Group (A-Share) Household Durables O/P Terence Chang CHINA 23,890 27.00 (1.3) 26.1 (2.0) 9.5 10.7 35.2 13.4 10.2 -10.7%
035420 KS NAVER Internet Software & ServicesRestrict. Restricted SOUTH KOREA 21,675 950,000.00 25.3 30.5 (2.5) 19.5 37.2 12.7 27.6 23.3 14.6%
090430 KS Amorepacific Personal Products O/P Kwang Cho SOUTH KOREA 21,489 521,000.00 22.3 20.8 (1.5) 13.0 26.0 6.1 31.6 24.4 7.1%
MSIL IN Maruti Suzuki India Automobiles O/P Amit Mishra INDIA 19,216 4,200.00 (2.5) 19.9 (2.2) 8.8 24.3 22.2 20.9 16.4 -0.3%
288 HK WH Group Ltd. (HK) Food Products N/R N/R HONG KONG 11,537 N/R N/R 14.4 2.1 4.0 8.3 6.8 12.3 10.3 6.2%
1044 HK Hengan Personal Products O/P Linda Huang HONG KONG 10,374 76.00 12.2 23.9 (0.7) 17.4 4.8 (2.3) 18.4 22.4 0.2%
GCPL IN Godrej Consumer Products Ltd. Personal Products O/P Amit Mishra INDIA 8,396 1,550.00 (1.8) 24.1 0.8 13.0 17.9 20.4 37.3 27.6 4.1%
EIM IN Eicher Motors Ltd. Machinery O/P Amit Mishra INDIA 7,906 23,360.00 19.7 39.8 (1.5) 9.7 28.5 0.7 29.8 21.4 11.6%
669 HK Techtronic Industries Co., Ltd. Household Durables N/R N/R HONG KONG 7,861 N/R N/R 18.2 0.1 7.6 15.9 11.4 16.8 13.5 4.4%
2313 HK Shenzhou International Textiles Apparel & Luxury GoodsO/P Terence Chang HONG KONG 7,168 44.80 9.1 20.3 (0.1) 19.4 17.3 2.0 16.7 10.7 0.8%
600066 CH Zhengzhou Yutong Bus (A) Machinery O/P Zhixuan Lin CHINA 6,872 28.00 29.9 28.4 (1.8) 11.3 7.7 5.7 11.7 11.2 3.5%
1193 HK China Resources Gas Gas Utilities O/P Candice Chen HONG KONG 6,594 25.00 8.0 17.3 1.5 10.6 10.5 0.4 14.4 17.9 -0.4%
1999 HK Man Wah Household Durables O/P Timothy Lam HONG KONG 3,029 12.30 5.7 29.3 (1.0) 18.3 14.7 16.5 14.6 11.0 13.9%
5347 TT Vanguard Semiconductors & Semiconductor EquipmentNeutral Patrick Liao TAIWAN 2,764 52.50 (4.7) 20.6 (3.5) 22.6 26.4 10.0 15.2 13.2 6.2%
HTHT US China Lodging Group Hotels Restaurants & LeisureO/P Timothy Lam CHINA 2,604 48.80 25.7 16.9 (3.0) 10.0 26.4 5.6 25.2 26.0 9.9%
Simple average 32,579 23.8 (1.0) 16.5 17.1 10.3 20.5 17.8

Ma
cq
ua
rie R
es
ea
rch
R
igh
ts, W
ron
gs &
Re
turn
s
15
Ju
ly 2
016
40
Fig 110 Macquarie –Global ‘Quality’ stock list (July-2016 edition)
Source: FactSet, Macquarie Research, July 2016; Fundamental data based on FactSet consensus estimates including covered stocks; Priced as of close of 14-July 2016
Ticker Company Name GICS L3 Name Reco. Analyst Name CountryMarket Cap
(US$M)
Target price
(Listing crncy)
Upside /
Downside
(%)
ROE ('16E)
Net debt /
EBITDA
('16E)
EBITDA
mgns
('16E)
Earnings
CAGR '15-
17
3M, perf
(LC), %
PER-12m
fw
PER-Avg
12M fw
(since'10)
% change
in 12m fw
EPS vs 3M
ago
GOOGL US Alphabet Internet Software & ServicesO/P Ben Schachter UNITED STATES 459,151 890.00 22.0 18.0 (2.7) 33.1 17.0 (4.2) 19.9 17.6 1.7%
MSFT US Microsoft Software Neutral Sarah Hindlian UNITED STATES 413,382 51.00 (4.7) 27.6 (2.9) 23.3 1.9 (2.6) 18.4 12.7 -3.0%
JNJ US Johnson & Johnson Pharmaceuticals N/R N/R UNITED STATES 338,137 N/R N/R 25.1 (1.1) 25.4 4.8 12.2 18.0 14.4 2.8%
FB US Facebook Internet Software & ServicesO/P Ben Schachter UNITED STATES 272,508 150.00 28.4 20.9 (2.7) 40.0 46.4 6.6 28.7 40.4 20.3%
700 HK Tencent Internet Software & ServicesO/P Wendy Huang HONG KONG 218,305 204.00 12.6 31.1 (1.8) 30.5 29.6 13.1 31.4 27.6 5.1%
ORCL US Oracle Software O/P Sarah Hindlian UNITED STATES 168,125 48.00 15.8 24.1 (1.2) 30.4 4.0 2.5 14.8 12.7 0.8%
DIS US The Walt Disney Company Media Neutral Tim Nollen UNITED STATES 162,212 95.00 (4.9) 21.3 1.7 17.1 5.6 2.9 16.4 16.2 0.5%
V US Visa Inc. Class A IT Services N/R N/R UNITED STATES 145,755 N/R N/R 22.7 (0.3) 45.9 9.1 (1.3) 24.7 20.3 3.0%
2330 TT TSMC Semiconductors & Semiconductor EquipmentO/P Patrick Liao TAIWAN 136,910 180.00 6.8 23.8 (1.2) 33.9 5.6 7.9 13.2 12.6 3.2%
AMGN US Amgen Inc. Biotechnology N/R N/R UNITED STATES 120,330 N/R N/R 28.3 1.4 37.3 5.4 2.1 13.8 12.9 4.3%
NOVOB DC Novo Nordisk A/S Class B Pharmaceuticals N/R N/R DENMARK 111,387 N/R N/R 77.2 (0.6) 33.9 10.4 2.5 22.8 21.7 2.0%
OR FP L'Oréal Personal Products Neutral Toby McCullagh FRANCE 107,652 172.00 (1.0) 14.9 (0.5) 14.1 8.2 12.3 25.8 21.5 1.6%
MA US MasterCard Class A IT Services N/R N/R UNITED STATES 95,700 N/R N/R 65.1 (0.8) 36.6 6.1 (4.1) 23.4 20.2 4.1%
BAYN GR Bayer AG Pharmaceuticals N/R N/R GERMANY 84,713 N/R N/R 23.2 2.5 12.6 8.2 (9.2) 12.2 13.3 1.9%
MC FP LVMH Textiles Apparel & Luxury GoodsO/P Daniele Gianera FRANCE 77,106 185.00 32.9 15.7 0.7 10.9 10.8 (5.8) 16.7 16.4 0.0%
NKE US NIKE Textiles Apparel & Luxury GoodsO/P Laurent Vasilescu UNITED STATES 75,667 75.00 29.3 33.1 (0.7) 11.7 10.6 (0.8) 23.8 20.9 0.9%
ST SP SingTel Diversified Telecommunication ServicesO/P Prem Jearajasingam SINGAPORE 49,969 4.42 3.8 15.5 2.2 23.3 5.8 16.8 16.6 14.0 0.2%
ADP US Automatic Data Processing IT Services N/R N/R UNITED STATES 43,340 N/R N/R 29.6 (1.6) 12.9 9.3 5.2 25.6 21.3 3.0%
AIR FP Airbus Group SE Aerospace & Defense N/R N/R NETHERLANDS 42,846 N/R N/R 37.3 (3.0) 3.7 7.9 (6.9) 14.1 15.7 0.3%
FDX US FedEx Air Freight & Logistics O/P Kelly Dougherty UNITED STATES 42,172 200.00 24.7 21.7 3.4 6.1 8.1 (3.1) 13.2 14.6 1.5%
INFO IN Infosys Limited IT Services N/R N/R INDIA 40,174 N/R N/R 23.8 (2.7) 21.0 12.5 (0.5) 17.4 17.7 2.5%
CON GR Continental AG Auto Components N/R N/R GERMANY 38,541 N/R N/R 21.6 1.0 7.4 8.3 (4.0) 11.3 10.9 1.2%
4503 JP Astellas Pharma Inc. Pharmaceuticals N/R N/R JAPAN 34,171 N/R N/R 15.5 (2.4) 14.9 4.2 15.9 17.4 17.6 -1.2%
ADS GR adidas Textiles Apparel & Luxury GoodsO/P Andreas Inderst GERMANY 30,008 140.00 6.7 15.0 0.7 4.7 18.5 27.0 27.6 17.0 11.2%
4452 JP Kao Corp. Personal Products N/R N/R JAPAN 28,968 N/R N/R 17.4 (1.4) 8.1 14.0 6.4 23.0 21.8 3.6%
WPP LN WPP Media O/P Tim Nollen UNITED KINGDOM 27,949 18.50 9.9 17.1 2.4 10.7 8.8 1.9 15.1 12.9 3.9%
NVDA US NVIDIA Semiconductors & Semiconductor EquipmentO/P Deepon Nag UNITED STATES 27,779 45.00 (14.7) 24.2 (3.5) 20.1 7.5 47.3 33.4 18.8 10.4%
6981 JP Murata Mfg Electronic Equipment Instruments & ComponentsO/P George Chang JAPAN 24,082 15,000.00 22.4 13.8 (2.2) 14.8 (1.5) (12.9) 14.4 18.9 -13.2%
EA US Electronic Arts Software O/P Ben Schachter UNITED STATES 23,860 80.00 3.1 30.9 (3.6) 23.1 12.7 26.3 21.4 19.2 4.8%
ILMN US Illumina, Inc. Life Sciences Tools & ServicesN/R N/R UNITED STATES 20,555 N/R N/R 24.2 (1.6) 20.2 9.7 (13.1) 40.3 43.2 -2.9%
MSIL IN Maruti Suzuki India Automobiles O/P Amit Mishra INDIA 19,216 4,200.00 (2.5) 19.9 (2.2) 8.8 24.3 22.2 20.9 16.4 -0.3%
HO FP Thales SA Aerospace & Defense N/R N/R FRANCE 17,950 N/R N/R 18.1 (2.3) 6.0 10.3 1.7 17.2 11.8 3.9%
COLOB DC Coloplast A/S Class B Health Care Equipment & SuppliesN/R N/R DENMARK 15,304 N/R N/R 72.3 (0.5) 25.1 13.6 6.8 27.1 22.4 1.0%
CAP FP Cap Gemini SA IT Services N/R N/R FRANCE 14,552 N/R N/R 12.5 1.3 7.0 22.5 (3.5) 14.5 14.2 1.6%
7741 JP HOYA Health Care Equipment & SuppliesO/P Damian Thong JAPAN 14,337 4,385.00 16.0 13.7 (4.1) 14.1 (4.8) (9.5) 17.8 16.7 -13.2%
8035 JP Tokyo Electron Semiconductors & Semiconductor EquipmentO/P Damian Thong JAPAN 14,120 9,700.00 11.1 14.2 (2.8) 12.1 2.3 24.8 16.3 22.7 11.2%
IPG US Interpublic Group Media O/P Tim Nollen UNITED STATES 9,662 26.00 7.6 25.8 0.8 6.8 8.0 5.7 17.2 16.0 2.9%
EIM IN Eicher Motors Ltd. Machinery O/P Amit Mishra INDIA 7,906 23,360.00 19.7 39.8 (1.5) 9.7 28.5 0.7 29.8 21.4 11.6%
669 HK Techtronic Industries Co., Ltd. Household Durables N/R N/R HONG KONG 7,861 N/R N/R 18.2 0.1 7.6 15.9 11.4 16.8 13.5 4.4%
2313 HK Shenzhou International Textiles Apparel & Luxury GoodsO/P Terence Chang HONG KONG 7,168 44.80 9.1 20.3 (0.1) 19.4 17.3 2.0 16.7 10.7 0.8%
Simple average 89,738 25.9 (0.8) 18.6 11.2 5.1 20.2 18.3 2.5%

Macquarie Research Rights, Wrongs & Returns
15 July 2016 41
2. ‘Thematics’ – We continue to recommend Thematics as a powerful investment
strategy that should be able to exploit some of the above discussed long-term
structural shifts. Whilst in the past Thematics focused on a range of topics that
emphasized longer-term convergence (such as middle class creation, emerging
markets, etc.), we believe that the new themes are far more likely to thrive on
growing economic divergence rather than convergence. It is likely to emphasize
stagnant productivity; lack of global trade recovery and shrinkage of supply and value
chains; increasing the trend towards de-globalization and emphasis on protection of
domestic markets.
Arguably, most of these new trends are driven by the above described structural
shifts associated with a complex interaction of the Third Industrial Revolution and
self-inflicted wound of over leveraging and over capacity, with an overlay of multi-
decade transfer of wealth and returns to owners of capital. For a much more detailed
discussion on Thematics as an investment strategy refer What caught my eye? v.59 -
In praise of Thematics, 7 June 2016.
Our basic investment rationale is that most positive investment themes over the last
three decades are likely to weaken considerably. Instead, themes that will come to
the fore will be far more constraints-based (or negative). The idea of this portfolio is
to maximize the power of constraints rather than opportunities.
We run a Global as well as Asia ex Japan Thematics portfolio with most of the
themes overlapping between the two. Note that these portfolios tend to be long-
term portfolios where we disregard valuations and quality criteria completely, with the
central thesis that these stocks should be driven by genuine themes as opposed to
changes in Global Central Bank policies. The list is based either on a poll of our on-
the-ground fundamental analysts, or based on our judgement of the largest and most
well known stocks that are likely to be beneficiaries of respective themes.
Our long-term Asia ex JP ‘Thematics’ portfolio has managed to outperform MSCI
Asia ex Japan US$ index by 3% since inception in Oct-2014 despite having no
quality or valuation filter. YTD thematic portfolio has underperformed ASXJ by 5%.
As far as Global Thematics portfolio is concerned, whilst it is just over a month
since launch (June 2016), the portfolio has managed to stay above MSCI AC World
Index (US$, TR basis) and is up by 150bps.
Fig 111 Macquarie – Asia ex Japan ‘Thematics’ portfolio performance relative to MSCI Asia ex JP (since inception Oct-2014 until July 2016)
Fig 112 Macquarie – Global ‘Thematics’ portfolio performance relative to MSCI AC World (June-2016 until July 2016)
Source: Bloomberg, Macquarie Research, July 2016: Note – Equal weighted portfolio; Returns are dollar returns including dividends; Excludes transaction costs; Past performance is not a guarantee of future performance; Until close of 11 July 2016
Source: Bloomberg, Macquarie Research, July 2016: Note – Equal weighted portfolio; Returns are dollar returns including dividends; Excludes transaction costs; Past performance is not a guarantee of future performance; Until close of 11 July 2016
Summarised on next page are our current Asia ex Japan and Global Thematic
portfolios (last rebalanced in April-2016) with no changes in this review.
95
97
99
101
103
105
107
109
111
113
115
Oct
-14
No
v-1
4
De
c-1
4
Jan
-15
Feb
-15
Mar
-15
Ap
r-1
5
May
-15
Jun
-15
Jul-
15
Au
g-1
5
Sep
-15
Oct
-15
No
v-1
5
De
c-1
5
Jan
-16
Feb
-16
Mar
-16
Ap
r-1
6
May
-16
Jun
-16
Asia ex "Thematics" portfolio (rel to MSCI ASXJ, $ TR basis)
-6.0
-4.5
-3.0
-1.5
0.0
1.5
-8
-6
-4
-2
0
2
7-J
un
-16
9-J
un
-16
11
-Ju
n-1
6
13
-Ju
n-1
6
15
-Ju
n-1
6
17
-Ju
n-1
6
19
-Ju
n-1
6
21
-Ju
n-1
6
23
-Ju
n-1
6
25
-Ju
n-1
6
27
-Ju
n-1
6
29
-Ju
n-1
6
1-J
ul-
16
3-J
ul-
16
5-J
ul-
16
7-J
ul-
16
9-J
ul-
16
11
-Ju
l-1
6
Excess returns (RHS) "Global Thematics" returns MXWD $
...uncorrelated
Thematics

Macquarie Research Rights, Wrongs & Returns
15 July 2016 42
Fig 113 Macquarie – Asia ex Japan ‘Thematics’ portfolio (April 2016 edition)
Source: Macquarie Research, July 2016
Fig 114 Macquarie – Global ‘Thematics’ portfolio (June 2016 edition)
Source: Macquarie Research, July 2016
Ticker Name Country Ticker Name Country
Security, Prisons and Bullets Robots, Industrial, Automation and Technology
2357 HK AviChina China 300124 CH Shenzhen Inovance China
002415 CH Hikvision China HOLI US HollySys Automation Tech. China
2634 TT Aerospace Industrial Development Taiwan 002241 CH GoerTek China
047810 KS Korea Aerospace Industries Korea 2049 TT Hiwin Technologies Taiwan
079550 KS LIG NEX1 Korea 2308 TT Delta Electronics Taiwan
STE SP ST Engineering Singapore 1590 TT AirTAC Taiwan
Educational & Training services Shifts in manufacturing migration/competitiveness
EDU US New Oriental Education & Tech. China 2333 HK Great Wall Motor Company China
XRS US TAL Education Group China 600066 CH Zhengzhou Yutong Bus (A-Share) China
NORD US Nord Anglia Education China 600031 CH Sany Heavy Industry China
Environmental Constraint 425 HK Minth Group China
2208 HK Xinjiang Goldwind China 2382 HK Sunny Optical China
2688 HK ENN Energy China 1766 HK CRRC Corp Ltd China
3800 HK GCL-Poly Energy China 2313 HK Shenzhou International China
257 HK China Everbright International China 1476 TT Eclat Textile Taiwan
1193 HK China Resources Gas China 600741 CH Huayu Automative China
958 HK Huaneng Renewables China 3606 HK Fuyao Glass China
SIIC SP SIIC Environment Singapore Demographics
EDC PM Energy Development Philippines 2628 HK China Life Insurance China
MWC PM Manila Water Philippines 300015 CH Aier Eye Hospital Group Co. Ltd. China
Entertainment Services GE SP Great Eastern Holdings Ltd Singapore
1970 HK IMAX China China RFMD SP Raffles Medical Group Singapore
002739 CH Wanda Cinema China BDMS TB Bangkok Dusit Medical Services Thailand
700 HK Tencent China BH TB Bumrungrad Hospital Thailand
NTES US Netease.com China IHH MK IHH Healthcare Bhd Malaysia
GENM MK Genting Malaysia Malaysia KPJ MK KPJ Healthcare Malaysia
079160 KS CJ CGV Korea FORH IN Fortis Healthcare India
Ticker Name Country Ticker Name Country
Theme 1: "Replacing Humans": Robots, Industrial Automation & AI Theme 4: "Bullets and Prisons": Defense, Security, Prisons/Correction Centres
ABBN VX ABB Ltd. Switzerland 047810 KS Korea Aerospace Industries, Ltd. South Korea
300024 CH SIASUN Robot & Automation A China 002415 CH Hangzhou Hikvision Digital A China
6506 JP Yaskawa Electric Corp. Japan LMT US Lockheed Martin Corporation United States
ISRG US Intuitive Surgical, Inc. United States RTN US Raytheon Company United States
SIE GR Siemens AG Germany NOC US Northrop Grumman Corporation United States
HON US Honeywell International United States HO FP Thales SA France
6503 JP Mitsubishi Electric Corp. Japan ESLT IT Elbit Systems Ltd Israel
6645 JP OMRON Corporation Japan CXW US Corrections Corporation of America United States
300124 CH Shenzhen Inovance Tech. A China GEO US GEO Group Inc United States
1590 TT AirTAC Taiwan Theme 5: "Education & Skilling"
NVDA US NVIDIA Corporation United States PSON LN Pearson PLC United Kingdom
MLNX US Mellanox Technologies, Ltd. Israel JW/A US John Wiley & Sons, Inc. Class A United States
Theme 2: "Augmenting Humans": Genome/Biotechnology/DNA sequencing EDU US New Oriental Education & Tech. Sp ADR China
AMGN US Amgen Inc. United States XRS US TAL Education Unspons. ADR Class A China
BIIB US Biogen Inc. United States NORD US Nord Anglia Education, Inc. Hong Kong
ABBV US AbbVie, Inc. United States WKL NA Wolters Kluwer NV Netherlands
ILMN US Illumina, Inc. United States Theme 6: "Demographics": Funeral Parlours and Psychiatric Centres
Theme 3: "Opium of the people": Games, Casinos/Virtual Reality 1448 HK Fu Shou Yuan International Group Ltd. China
700 HK Tencent Holdings Ltd. China SCI US Service Corporation International United States
ATVI US Activision Blizzard, Inc. United States UHS US Universal Health Services, Inc. Class B United States
EA US Electronic Arts Inc. United States ACHC US Acadia Healthcare Company, Inc. United States
NTES US NetEase, Inc. Sponsored ADR China Theme 7: "Disruptors & Facilitators"
7974 JP Nintendo Co., Ltd. Japan AMZN US Amazon.com, Inc. United States
LVS US Las Vegas Sands Corp. United States TSLA US Tesla Motors, Inc. United States
1928 HK Sands China Ltd. Macau FB US Facebook, Inc. Class A United States
002241 CH GoerTek Inc. Class A China CRM US salesforce.com, inc. United States
NFLX US Netflix, Inc. United States
GOOGL US Alphabet Inc. Class A United States

Macquarie Research Rights, Wrongs & Returns
15 July 2016 43
3. ‘Sustainable Yields’: For investors looking for Yield ideas, our ‘Sustainable
Dividends’ model portfolios for Global and Asia ex Japan are the ideal vehicles to
take exposure of ‘lower for longer’ interest rate thematic.
Our yields portfolios are designed to be true income-yielding portfolios with the
underlying assumption of ‘low for longer’ interest rates globally and therefore a
continued chase for yields. However, the key differentiation in our yield portfolios (vs
conventional quant-driven screens) is additional overlay of quality and sustainability
of dividends growth. In other words, we attempt to avoid ‘yield traps’ and identify
companies that have a history of paying dividends and the ability to sustain them
given stronger than average fundamentals.
Summarised below are April-2016 editions of our ‘Sustainable Yields’ portfolio where
we have made no changes in this review. We look to do a thorough review of
these portfolios at the end of the year.
Fig 115 Macquarie – Asia ex JP ‘Sustainable Dividends’ stocks (last stock review – April 2016)
Fig 116 Macquarie – Global ‘Sustainable Dividends’ stocks (last stock review – April 2016)
Source: Macquarie Research, July 2016; For details refer ‘Rights, Wrongs & Returns - 2016 – Year of Living dangerously - sequel’, 13 April 2016
Source: Macquarie Research, July 2016; For details refer ‘Rights, Wrongs & Returns - 2016 – Year of Living dangerously - sequel’, 13 April 2016
4. ‘Anti-Quality’ portfolio: For the brave investors who are willing to chase the low
quality rally, we also run a screen of what we call ‘Anti-Quality’ stocks in Asia ex
Japan. This is in essence a reverse of our ‘Quality Portfolios’ and highlights stocks
with high leverage, negative cash flow trends and low ROEs.
As highlighted above, a scenario where the global economy moves into ‘socialist
paradise’ with CBs and governments accelerating monetary and fiscal policies to
stimulate growth, it is quite likely that investors might gravitate towards ‘low quality’
stocks, in our view. As discussed above, we believe that the investors’ acceptance of
new macro strategies should become a general investor consensus call. For details,
including key screening criteria, refer Rights, Wrongs & Returns - Year of Living
dangerously – sequel, 13 April 2016.
As far as the ‘Anti Quality’ Portfolio is concerned, we have seen some retracement in
performance recently (in line with the return to the ‘Quality’ trade) after a brief period
when it significantly outperformed during the ‘trash rally’ of Feb-May 2016. Since
inception (Sep-2015), the portfolio is down ~2% against benchmark (see chart below).
Code Company Name Country
600104 CH SAIC Motor (A-Share) China
2333 HK Great Wall Motor Company China
5347 TT Vanguard Taiwan
600741 CH Huayu Automotive (A-Share) China
ST SP SingTel Singapore
600066 CH Zhengzhou Yutong Bus (A-Share) China
GLO PM Globe Telecom Philippines
000333 CH Midea Group (A-Share) China
2020 HK Anta Sports China
2317 TT Hon Hai Precision Taiwan
DELTA TB Delta Electronics (Thailand) Public Co.Thailand
1999 HK Man Wah China
2330 TT TSMC Taiwan
TLKM IJ PT Telkom Indonesia
T MK Telekom Malaysia Malaysia
1216 TT Uni-President Enterprises Taiwan
1044 HK Hengan China
021240 KS Coway Korea
Ticker Company Name Country Ticker Company Name Country
NXT LN Next plc UK ABBV US AbbVie, Inc. US
BKG LN Berkeley Group Holdings UK 7202 JP Isuzu Motors JP
TEL NO Telenor ASA NO MO US Altria Group, Inc. US
2333 HK Great Wall Motor HK KNEBV FH Kone Oyj FIN
TW/ LN Taylor Wimpey plc UK 2330 TT TSMC TW
DAI GR Daimler AG GE ROG VX Roche Holding Ltd Genusssch. SWZ
ST SP SingTel SP 9201 JP Japan Airlines Co. JP
BMW GR Bayerische Motoren Werke GE PAYX US Paychex, Inc. US
2020 HK ANTA Sports Products HK DRI US Darden Restaurants, Inc. US
2317 TT Hon Hai Precision TW ELUXB SS Electrolux AB Class B SWD
SKAB SS Skanska AB SWD WPP LN WPP Plc UK
7270 JP Fuji Heavy Industries JP ULVR LN Unilever PLC UK
7203 JP Toyota Motor Corp. JP GIVN VX Givaudan SA SWZ
RAND NA Randstad Holding NV NL UPS US United Parcel Service, Inc. US
SIE GR Siemens AG GE TGT US Target Corporation US
EZJ LN easyJet plc UK JNJ US Johnson & Johnson US
SAN FP Sanofi FR PUB FP Publicis Groupe SA FR
There soon could be
time for “Anti
quality” or “Follow
the Government”
portfolios

Macquarie Research Rights, Wrongs & Returns
15 July 2016 44
Fig 117 Macquarie – Asia ex ‘Anti-Quality’ strategy performance relative to MSCI Asia ex JP (since inception from Sep-15 until July 2016)
Fig 118 Macquarie – Asia ex Japan ‘Anti-Quality’ list (last stock review April-2016)
Source: Bloomberg, Macquarie Research, July 2016: Note – Equal weighted portfolios; Returns are dollar returns including dividends; Excludes transaction costs; Past performance is not a guarantee of future performance; Priced at close of 11-July 2016
Source: Macquarie Research, July 2016; For details refer ‘Rights, Wrongs & Returns - 2016 – Year of Living dangerously - sequel’, 13 April 2016
85
87
89
91
93
95
97
99
101
103
105
Sep
-15
Oct
-15
Oct
-15
No
v-1
5
De
c-1
5
De
c-1
5
Jan
-16
Feb
-16
Mar
-16
Mar
-16
Ap
r-1
6
May
-16
May
-16
Jun
-16
Jul-
16
"Anti Quality" portfolio (rel to MSCI ASXJ, $ TR basis)
Code Company Name Country
1211 HK BYD Company Class H Hong Kong
1898 HK China Coal Energy Class H Hong Kong
2039 HK China Int. Marine Containers H Hong Kong
TATA IN Tata Steel Limited India
078930 KS GS Holdings Corp. South Korea
JSTL IN JSW Steel Limited India
69 HK Shangri-La Asia Limited Hong Kong
139480 KS E-Mart, Inc. South Korea
OLAM SP Olam International Limited Singapore
363 HK Shanghai Industrial Holdings Hong Kong
RCOM IN Reliance Communications India
ADANI IN Adani Power Limited India
1833 HK Intime Retail (Group) Co. Ltd. Hong Kong
MRT SP Smrt Corporation Ltd Singapore
001740 KS SK Networks Co., Ltd. South Korea
2603 TT Evergreen Marine Corp. (Taiwan) Ltd.Taiwan
1208 HK MMG Ltd. Hong Kong
BAB MK Bumi Armada Bhd. Malaysia

Macquarie Research Rights, Wrongs & Returns
15 July 2016 45
Appendices
Fig 119 Index performance, (Local currency, unless stated otherwise), %
Note : Priced as of close of 12 July 2016 Source: MSCI, Thomson, Macquarie Research, July 2016
Fig 120 Index performance by MSCI countries and sectors (local currency) – Last three months, %
Note : Priced as of close of 12 July 2016 Source: MSCI, Thomson, Macquarie Research, July 2016
MSCI Indices - 1W - 1M - 3M - 1Y - 3Y - 5Y YTD Index
MSCI AC Asia ex JP (LC) 0.2 1.3 2.5 -7.6 3.9 -1.2 1.0 629
ASXJ Consumer Discretionary -0.1 0.6 -1.9 -5.5 -17.3 -22.7 -3.9 407
ASXJ Consumer Staples -1.0 1.5 5.7 3.5 15.3 28.1 7.5 512
ASXJ Energy -1.2 -0.8 2.0 -10.1 -22.1 -40.7 9.1 529
ASXJ Financials -0.1 0.5 2.4 -15.4 0.2 -3.5 -4.3 277
ASXJ Health Care 2.1 5.1 2.5 -1.6 44.6 82.9 -1.7 965
ASXJ Industrials -0.1 -1.0 -4.0 -19.1 -6.3 -26.9 -6.7 147
ASXJ Information Technology 1.0 3.5 6.7 3.7 30.3 47.3 7.9 342
ASXJ Materials 0.4 0.6 -1.6 -1.7 -1.6 -35.2 7.0 295
ASXJ Utilities -0.9 -1.7 -1.6 -2.8 6.0 23.8 1.1 222
ASXJ Telecom Svcs 0.4 2.6 5.5 -4.9 2.9 19.8 5.6 143
MSCI AC ASIA EX JP U$ 0.1 1.7 2.2 -9.1 -1.2 -11.0 2.2 511
MSCI CHINA U$ 0.0 1.3 0.0 -18.4 1.1 -15.0 -5.6 56
MSCI HONG KONG U$ -0.6 -0.4 0.9 -10.6 5.4 9.9 -1.2 9,334
MSCI INDIA U$ 1.4 3.5 7.7 -5.1 19.9 -6.5 3.3 475
MSCI INDONESIA U$ 2.8 8.2 6.6 8.4 -13.0 -20.8 16.9 763
MSCI KOREA U$ -0.4 1.2 2.4 0.7 -1.1 -18.1 5.1 374
MSCI MALAYSIA (EM) U$ 0.1 2.8 -6.0 -7.9 -28.5 -25.8 6.0 361
MSCI PHILIPPINES U$ -0.7 2.4 5.9 2.2 16.2 70.0 12.6 598
MSCI SINGAPORE U$ -0.3 2.5 0.7 -13.3 -18.5 -19.5 4.3 3,392
MSCI TAIWAN U$ 0.6 1.2 5.0 -5.4 4.0 -3.5 9.5 291
MSCI THAILAND U$ 0.4 2.7 7.9 -6.3 -15.3 -0.7 20.1 354
MSCI China 0.0 1.3 0.1 -18.3 1.1 -15.3 -5.5 56
MSCI Hong Kong -0.7 -0.5 1.0 -10.5 5.4 9.5 -1.1 13,040
MSCI India 1.3 4.1 8.9 0.6 34.7 41.2 4.9 1,034
MSCI Indonesia 2.5 6.7 6.4 6.7 14.3 21.8 11.1 6,060
MSCI Korea -0.5 -0.4 2.4 2.2 1.1 -11.2 2.8 542
MSCI Malaysia 0.0 0.7 -3.5 -3.1 -9.9 -1.7 -1.5 579
MSCI Philippines 0.3 5.0 8.6 7.2 26.7 87.3 13.1 1,360
MSCI Singapore 0.1 2.0 1.2 -13.4 -13.0 -11.7 -0.7 1,488
MSCI Taiwan 0.6 1.2 4.5 -1.8 12.0 7.7 7.3 328
MSCI Thailand 0.6 2.4 8.1 -3.1 -4.3 15.1 17.3 499
MSCI EMG 0.5 1.8 2.5 -5.5 4.9 -1.0 3.6 46,090
MSCI World (Dev) 1.3 1.4 3.7 -3.7 18.1 40.5 -0.2 1,275
MSCI AC World (All) 1.2 1.5 3.5 -3.9 16.6 35.0 0.1 469
MSCI Japan -0.5 -5.6 -2.0 -22.2 1.8 39.6 -19.6 753
MSCI USA 1.7 2.0 4.8 2.3 27.3 61.2 4.4 2,035
MSCI AC Asiapac x JP ($) 0.3 1.8 3.3 -7.8 -4.3 -12.8 2.5 422
MSCI AC WORLD U$ 0.9 0.9 2.7 -4.4 9.5 19.8 1.4 405
MSCI EM U$ 0.4 2.8 2.8 -9.2 -10.2 -25.9 6.6 847
MSCI WORLD U$ (Dev) 0.9 0.7 2.7 -3.9 12.0 27.5 0.8 1,676
MSCI EM ASIA U$ 0.3 1.9 2.5 -8.6 -0.8 -13.1 2.6 414
MSCI WORLD EX JP ($) 1.1 0.9 2.7 -3.6 13.5 29.4 1.5 1,693
MSCI EUROPE U$ 0.0 -1.8 -3.1 -15.6 -6.2 -4.7 -7.0 1,416
MSCI EMU U$ 0.1 -3.2 -4.9 -16.3 -3.3 -8.5 -8.8 157
MSCI AC Asia ex JP
AC
Asia
ex JP
China HK India Indo Korea Mal Phils Sing TW Thai EMG World
(Dev) Japan
AC
World
MSCI Country Index 2.5 0.1 1.0 8.9 6.4 2.4 -3.5 8.6 1.2 4.5 8.1 2.5 3.7 -2.0 3.5
Cons. Disc -1.9 -5.3 -9.7 17.0 5.8 -5.1 -8.2 8.3 -4.6 -1.7 9.3 0.9 1.1 -3.5 1.1
Staples 5.7 -2.7 4.8 11.9 4.3 7.3 -1.7 -7.6 -7.0 13.3 15.6 4.6 5.9 1.1 5.8
Energy 2.0 7.6 NA -0.0 13.4 -19.0 -13.3 0.0 0.0 -3.9 6.9 1.2 11.4 -5.7 10.2
Financials 2.4 -1.2 5.0 21.4 5.8 -4.7 -4.0 12.3 0.9 1.8 10.1 1.1 0.5 -8.0 0.6
Banks 3.7 2.9 1.1 20.1 4.6 -2.7 -4.1 7.3 1.0 4.8 9.7 3.1 0.2 -5.8 0.8
Real Estate 3.8 -3.8 6.1 NA NA NA 0.4 15.2 0.7 4.8 13.0 1.3 4.4 -7.4 4.2
Health Care 2.5 -0.4 NA 6.6 11.8 0.1 -2.0 NA 0.0 17.2 -4.0 4.1 6.3 0.1 6.2
Industrials -4.0 -6.1 -8.4 9.0 -1.9 -4.2 -3.9 6.2 -5.4 -4.3 5.5 -1.4 3.4 0.5 3.1
IT 6.7 5.5 -9.2 -2.2 NA 14.4 0.0 0.0 0.0 5.9 -20.9 6.8 0.8 -0.2 1.7
Materials -1.6 -1.9 0.0 20.8 -10.8 -11.7 -2.6 0.0 NA -0.8 8.0 1.3 7.9 -1.8 6.9
Utilities -1.6 -11.1 1.7 13.0 -10.1 2.7 -0.8 -0.6 NA NA -3.6 -0.5 6.0 -9.1 5.4
Telecom Services 5.5 0.3 7.2 -3.3 18.4 3.9 -2.0 12.6 15.7 10.7 13.3 2.1 3.9 3.9 3.6

Macquarie Research Rights, Wrongs & Returns
15 July 2016 46
Fig 121 Valuations – Asia ex JP and key comps
Note : Priced as of close of 12 July 2016 Source: MSCI, Thomson, IBES, Macquarie Research, July 2016
Avg since 2010
MSCI Indices PER P/B EPS gr ROE DY PER P/B ROE DY PER P/B PER P/B
MSCI AC Asia ex JP 12.1 1.3 6.7 10.4% 2.9% 12.0 1.6 13.1% 2.9% 11.5 1.5 5% -14%
ASXJ Consumer Discretionary 12.2 1.4 11.6 11.5% 2.3% 11.1 1.8 15.7% 2.4% 11.1 1.8 10% -21%
ASXJ Consumer Staples 21.9 3.0 13.3 13.8% 2.0% 16.2 2.7 15.3% 2.4% 18.9 2.7 16% 11%
ASXJ Energy 13.8 0.9 13.7 6.5% 2.9% 10.0 1.6 14.9% 3.2% 10.3 1.3 34% -34%
ASXJ Financials 8.9 0.9 2.7 9.8% 3.8% 11.9 1.4 11.4% 3.3% 10.3 1.2 -14% -27%
ASXJ Health Care 23.1 3.5 19.3 15.0% 0.9% 18.6 3.2 15.8% 1.1% 21.5 3.2 8% 7%
ASXJ Industrials 12.2 1.0 5.5 8.4% 2.8% 13.1 1.4 10.7% 2.5% 12.6 1.3 -3% -20%
ASXJ Information Technology 14.8 2.0 10.8 13.5% 2.1% 13.2 2.0 15.8% 2.2% 12.0 1.9 23% 6%
ASXJ Materials 13.0 1.0 21.9 7.7% 3.0% 10.3 1.4 13.0% 3.2% 11.7 1.3 11% -22%
ASXJ Utilities 10.4 1.2 -4.3 11.5% 3.6% 12.5 1.4 10.8% 3.3% 13.1 1.4 -21% -15%
ASXJ Telecommunication Services 15.5 1.8 4.5 11.7% 3.8% 13.1 2.0 15.1% 4.1% 13.7 1.9 14% -3%
MSCI China 10.6 1.2 8.1 11.6% 2.7% 11.5 1.8 15.0% 3.0% 9.9 1.5 7% -16%
MSCI Hong Kong 14.1 1.0 3.9 7.2% 3.7% 15.3 1.4 8.8% 3.3% 14.7 1.3 -4% -20%
MSCI India 17.3 2.6 17.0 15.2% 1.7% 14.5 2.6 16.6% 1.6% 15.1 2.4 14% 9%
MSCI Indonesia 15.3 2.5 10.6 16.3% 2.5% 11.4 2.8 22.0% 3.2% 13.7 2.9 11% -15%
MSCI Korea 10.0 0.9 5.9 8.9% 2.0% 9.3 1.2 12.5% 1.7% 9.3 1.1 9% -19%
MSCI Malaysia 15.5 1.6 4.6 10.1% 3.2% 14.3 1.9 13.0% 3.6% 14.7 1.9 5% -18%
MSCI Philippines 19.0 2.5 8.3 13.0% 1.7% 15.0 2.2 14.6% 2.7% 16.8 2.6 13% -4%
MSCI Singapore 11.9 1.0 1.7 8.7% 4.3% 14.0 1.5 10.9% 3.7% 13.2 1.4 -10% -25%
MSCI Taiwan 12.8 1.5 2.8 11.7% 4.3% 14.0 1.7 13.1% 3.9% 13.2 1.7 -3% -11%
MSCI Thailand 14.2 1.8 10.8 12.4% 3.2% 10.9 1.8 16.3% 3.9% 11.8 1.9 20% -6%
MSCI EMG 11.7 1.3 10.3 11.1% 2.9% 10.7 1.6 14.4% 3.3% 10.7 1.4 10% -9%
EMG Consumer Discretionary 13.7 1.7 14.0 12.2% 1.9% 11.1 1.8 15.9% 2.1% 11.6 1.8 19% -9%
EMG Consumer Staples 21.5 3.5 16.2 16.4% 2.3% 16.4 2.9 16.7% 2.6% 19.6 3.2 10% 12%
EMG Energy 9.1 0.7 4.0 7.2% 3.5% 7.7 1.2 13.6% 3.2% 7.4 0.8 23% -23%
EMG Financials 8.2 1.0 4.8 11.8% 4.0% 10.0 1.5 14.4% 3.4% 9.4 1.3 -12% -27%
EMG Health Care 22.0 3.4 19.6 15.5% 1.1% 17.8 3.1 16.3% 1.5% 19.6 3.1 12% 11%
EMG Industrials 13.3 1.2 9.7 9.1% 2.2% 12.0 1.5 12.0% 2.4% 12.9 1.4 2% -16%
EMG Information Technology 14.8 2.0 10.8 13.6% 2.1% 13.1 1.9 15.5% 2.2% 12.0 1.9 23% 5%
EMG Materials 12.7 1.0 80.7 8.1% 2.9% 10.2 1.6 14.9% 3.6% 11.3 1.3 13% -21%
EMG Utilities 9.2 1.0 -0.0 10.5% 4.1% 11.4 1.1 9.1% 3.5% 11.0 1.0 -16% -7%
EMG Telecommunication Services 14.4 1.8 9.9 12.6% 4.0% 12.3 2.2 17.5% 4.2% 12.6 2.0 14% -9%
MSCI World (Dev) 15.5 1.9 8.0 12.3% 2.8% 14.6 1.9 13.6% 2.7% 13.6 1.8 14% 8%
World(Dev) Consumer Discretionary 14.8 2.4 10.2 16.2% 2.3% 16.5 2.0 13.5% 2.0% 14.8 2.2 0% 8%
World(Dev) Consumer Staples 20.5 4.0 8.3 19.5% 2.7% 16.6 3.2 19.2% 2.8% 16.5 3.1 24% 28%
World(Dev) Energy 31.3 1.5 16.0 4.9% 3.8% 13.7 1.8 14.3% 2.8% 14.5 1.5 116% 2%
World(Dev) Financials 11.5 1.0 3.8 8.4% 3.9% 11.9 1.3 10.7% 3.4% 11.5 1.0 0% -7%
World(Dev) Health Care 15.9 3.3 8.6 20.8% 2.1% 15.9 2.9 19.7% 2.3% 14.3 2.8 11% 17%
World(Dev) Industrials 15.3 2.3 13.2 15.0% 2.7% 15.2 2.1 14.5% 2.4% 14.1 2.1 9% 12%
World(Dev) Information Technology 15.8 3.1 9.3 19.7% 1.8% 19.1 2.9 18.2% 1.2% 14.2 2.7 12% 14%
World(Dev) Materials 16.6 1.6 9.8 9.9% 2.6% 13.9 1.8 13.7% 2.4% 13.2 1.7 26% -1%
World(Dev) Utilities 16.5 1.6 -0.7 9.5% 3.8% 14.0 1.6 10.8% 4.2% 14.4 1.4 14% 16%
World(Dev) Telecommunication Services 15.1 2.1 7.7 14.0% 4.2% 19.8 1.8 12.6% 4.6% 13.5 1.8 12% 18%
MSCI AC World (All) 15.0 1.8 8.3 12.1% 2.8% 14.2 1.9 13.7% 2.9% 13.2 1.7 14% 6%
MSCI Japan 12.3 1.0 11.5 8.2% 2.6% 16.8 1.3 8.5% 1.7% 13.6 1.1 -9% -9%
MSCI USA 16.8 2.6 8.3 15.3% 2.3% 15.2 2.3 15.5% 2.1% 14.3 2.2 18% 18%
MSCI Australia 15.4 1.7 6.9 10.8% 4.8% 13.9 2.0 14.4% 4.7% 13.4 1.8 15% -6%
12 Month forward estimates LT Average (12M forward ests) Current vs post-2010 avg

Macquarie Research Rights, Wrongs & Returns
15 July 2016 47
Recent Asia Equity Strategy Research
Investment twilight - Between ignorance & confusion 12 July 2016 Ready for Battle - Macquarie earnings survivors’ guide 6 July 2016 MicroStrategy - Beyond Brexit, back to Asian fundamentals; where to from here? 29 June 2016 Brexit et al - It is all about 2nd derivatives & CBs 24 June 2016 What caught my eye? v.60 - Parallel lives: Japan vs. China 23 June 2016 What caught my eye? v.59 - In praise of Thematics 7 June 2016 What caught my eye? v.58 - Divergence, convergence & confusion 24 May 2016 What caught my eye? v.57 - Portfolios: The case of less is more 17 May 2016 What caught my eye? v.56 - Capital – Time for a vegetarian diet? 11 May 2016 What caught my eye? v.55 - Why are we staying in China & India? 29 April 2016 Ready for Battle - Macquarie earnings survivors’ guide 21 April 2016 Rights, Wrongs & Returns - Year of Living dangerously – sequel 13 April 2016 Central Banks & Markets - Mutually assured destruction 31 March 2016 Global Travel Notes - The blind leading the blind 29 March 2016 MicroStrategy - Earnings season – A letdown so far but there is a silver lining 22 March 2016 What caught my eye? v.54 - Negative rates and the war on savers 2 March 2016 What caught my eye? v.53 - Philippines shelter; CBs calling E.T 23 February 2016 Is it a policy dead-end? - Consistency in an inconsistent world 11 February 2016 What caught my eye? v.52 - Launching global portfolios 4 February 2016 Central Banks - Why insistence on failed policies? 1 February 2016 China’s hard landing - Has it already happened? 27 January 2016 What caught my eye? v.51 - Bulls, Bears and low rates 22 January 2016 What caught my eye? v.50 - The Fed and the need for redemption 11 January 2016 MicroStrategy – Growth it is - Five reasons we prefer Growth over Value 8 January 2016 China choices – narrowing - Between a rock and a hard place 7 January 2016 What caught my eye? v.49 - China’s savings dilemma 4 January 2016 Fed hikes. What now? - Implications for EM equities 17 December 2015 20 YEARS IN ASIA 14 December 2015 Is it Bear Stearns moment? - Year of living dangerously, part II 14 December 2015 Rights, Wrongs & Returns - 2016 - Year of living dangerously 25 November 2015 Policy cross-currents - What would unhinge PBoC? 12 November 2015 Bihar dreaming - On impossibility of reforms 9 November 2015 What caught my eye? v.48- EMs – downside to the upside, 3 November 2015 What caught my eye? v.47- The more they do; the worse it gets, 27 October 2015 What caught my eye? v.46-Equities – irrational exuberance?, 8 October 2015 Time for a policy U-turn? - Back to the future: British Leyland, 18 September 2015 What caught my eye? v.45 - Today is more insidious than 1997, 16 September 2015 Old Friend Deflation is Back - From traders to shareholders, 25 August 2015 EM vs DM Equities - What would the average opinion say?, 20 August 2015 Deflators of the world unite - Impact on the US & Global PPIs, 17 August 2015 China’s dilemma - Between a rock and a hard place, 13 August 2015 Return of deflationary vortex - Commodities – canary in a coalmine?, 10 August 2015 What caught my eye? v.44 - Barbarians at the gate, 5 August 2015 China’s policy response - How different is it to G4 economies?, 20 July 2015 Rights, Wrongs & Returns - 2H–Falling knives & deflating bubbles, 13 July 2015 Are dominos finally falling? - Greece, Puerto Rico, China, 6 July 2015 What caught my eye? v.43 - Why consumer & business reticence?, 29 June 2015 China drama & Greek farce - Are CBs at the end of the road?, 29 June 2015 What caught my eye? v.42 - Resisting China; Asia ex earnings, 17 June 2015 Trade & Cyclicality - Stagnation in both = lower yields, 28 May 2015 What caught my eye? v.41 - China & Global Manufacturing, 27 May 2015 What caught my eye? v.40 - CBs vs deflation: will liquidity win?, 8 May 2015 What caught my eye? v.39 - China & Indonesia: Binary outcomes, 29 April 2015 What caught my eye? v.38 - When size does not matter, 13 April 2015 Rights, Wrongs & Returns - 2Q-3Q’15 - The Hall of Mirrors, 27 March 2015 Global Liquidity Watch - Return of Greenspan’s conundrum?, 10 March 2015 What caught my eye? v.37 - India hope is still intact; travel notes, 5 March 2015 Chasing dividends - No mean reversion = desire for yield, 13 Feb 2015 What caught my eye? v.36 - Secular stagnation & four horsemen, 6 Feb 2015 Global liquidity watch - Liquidity tight but should improve, 27 Jan 2015 What caught my eye? v.35 - Focus on Thailand; CBs’ effectiveness, 26 Jan 2015 What caught my eye? v.34 - Trade & Flow watch; A vs H shares, 8 Jan 2015 Is deflation almost here? - What do DXY & bonds tell us, 6 Jan 2015

Macquarie Research Rights, Wrongs & Returns
15 July 2016 48
Global contagion risks - Commodities: canary in a coal mine?, 17 Dec 2014 China A retail exuberance - Damned if you do and damned if you don’t, 9 Dec 2014 Global Liquidity Watch - Eroded in 3Q’14 & Oct/Nov, 8 Dec 2014 Rights, Wrongs & Returns - 2015 preview: the ‘known unknowns’, 2 Dec 2014 How exposed is Korea? - Yen ‘doomsday machine’, 17 November 2014 What caught my eye? v. 33 - Currency wars & their discontents, 13 November 2014 What caught my eye? v.32 - On social upheavals, schools & robots, 30 October 2014 What caught my eye? v.31 - Is China in a liquidity trap? EM risks, 16 October 2014 What caught my eye? v.30 - EM vulnerabilities; U/W Indonesia, 9 October 2014 What caught my eye? v.29 - China’s city vs global city, 18 September 2014 What caught my eye? v.28 - Unstoppable China; EM equity rally, 9 September 2014 Global Liquidity - Most measures are looking better, 21 August 2014 ASEAN at the crossroads - Complex choices; uncertain outcomes, 18 August 2014 Phils – Fading optimism - ST concerns overshadow LT story, 31 July 2014 What caught my eye? v.27 - Importance of Trust; China’s rerating, 29 July 2014 Trade – Waiting for Godot - Small pick-up but no robust cyclicality, 18 July 2014 Rights, Wrongs & Returns - Higher rates or perhaps no rates, 15 July 2014 What caught my eye? v.26 - Oil, geopolitics & family formation, 3 July 2014 What caught my eye? v.25 - Value - many ways to skin a cat, 23 June 2014 What caught my eye? v.24 - Financial stability & catch 22, 13 June 2014 What caught my eye? v.23 - Reforms: who will & who will not, 30 May 2014 What caught my eye? v.22 - Upgrades and stagflations, 21 May 2014 Coups & Martial laws - Not necessarily a bad choice, 20 May 2014 What caught my eye? v.21 - China tourism; Portfolio update, 12 May 2014 What does FIC market tell equity investors? - All quiet on the Western front, 9 May 2014 What caught my eye? v.20 - Investments & geopolitical risks, 29 April 2014 What caught my eye? v.19 - Liquidity in its various forms, 16 April 2014 Rights, Wrongs & Returns - Policy errors, cyclicality & EM volatility, 28 March 2014 FOMC – Impact on EMs - Higher US$, rates and lower demand, 20 March 2014 Difficult case of Indonesia - Euphoria vs. terms of trade & liquidity, 17 March 2014 What caught my eye? v.18 - Is China unravelling? Not Yet, 11 March 2014 ‘Each unhappy family is unhappy in its own way’ - Ukraine, Thailand, Argentina, et al, 3 March 2014 DM vs. EM push & pull - Beware what you wish for, 26 February 2014 Bond Yields & Equities - The question of foreign demand, 24 February 2014 What caught my eye? v.17 - Is the Philippines for real?, 24 February 2014 What caught my eye? v.16 - Third industrial revolution & its impact, 12 February 2014 What caught my eye? v.15 - Investment Cycles & Funds Flows, 17 January 2014 Liquidity trap vs. Stagflation - China vs India – tough choice, 15 January 2014 What caught my eye? v.14 - Would Indian corporates invest?, 6 January 2014 Tapering is on, so is the put - What is likely to happen to volatilities?, 19 December 2013 Investment Outlook – 2014 - ‘Out with the old and in with the new’ Is it 1998 or 1999 – Buy all
or Sell all?, 11 December 2013 What caught my eye? v.13 - China's savings conundrum & Plenum, 25 November 2013 What caught my eye? V.12- Hardware vs software; China's ‘divide & conquer’ reform agenda?,
6 November 2013 What caught my eye? v.11 - Leading indicators and ‘blind alleys’, 28 October 2013 What caught my eye? v.10 - Corporate leverage – how much of a problem?, 3 October 2013 Asia Strategy - When you rely on asset bubbles, what else do you do?, 19 September 2013 What caught my eye? v.9 - Rmb: How exposed is China?, 18 September 2013 What caught my eye? v.8 - In and out of ‘shadows’, 6 September 2013 What caught my eye? v.7 - If something can not go on forever, it will stop, 22 August 2013 ASEAN 4 – risks & returns - Kaleidoscope of themes, 16 August 2013 What caught my eye? v.6 - China industrial sector – the Good, the Bad and the Ugly, 31 July 2013 Reviewing Tactical Portfolio - Tough choices: damned if you do and damned if you don't in a
slowing world, 10 July 2013 What caught my eye? v.5 - Liquidity – receding tide, 5 July 2013 What caught my eye? v.4 - Central Bank’s ‘chicken run’, 27 June 2013 What caught my eye? v.3 - QEs to eternity whether successful or not, 12 June 2013 What caught my eye? v.2 - Korea - is China or Japan a greater threat?, 29
May 2013
What caught my eye? - Inflation falling everywhere, 22 May 2013 Rights, Wrongs & Returns - Bears and the Investment Clock, 24 April 2013 DXY rises and Yen falls - The pincer movement for EM equities, 8 April 2013 APAC – Competitive Edge - Separating winners from losers, 21
March 2013
Walk on the wild side - Macro threats - what, if and when, 4 March 2013

Macquarie Research Rights, Wrongs & Returns
15 July 2016 49
Important disclosures:
Recommendation definitions
Macquarie - Australia/New Zealand Outperform – return >3% in excess of benchmark return Neutral – return within 3% of benchmark return Underperform – return >3% below benchmark return Benchmark return is determined by long term nominal GDP growth plus 12 month forward market dividend yield
Macquarie – Asia/Europe Outperform – expected return >+10% Neutral – expected return from -10% to +10% Underperform – expected return <-10%
Macquarie – South Africa Outperform – expected return >+10% Neutral – expected return from -10% to +10% Underperform – expected return <-10%
Macquarie - Canada
Outperform – return >5% in excess of benchmark return Neutral – return within 5% of benchmark return Underperform – return >5% below benchmark return
Macquarie - USA Outperform (Buy) – return >5% in excess of Russell 3000 index return Neutral (Hold) – return within 5% of Russell 3000 index return Underperform (Sell)– return >5% below Russell 3000 index return
Volatility index definition*
This is calculated from the volatility of historical price movements. Very high–highest risk – Stock should be
expected to move up or down 60–100% in a year – investors should be aware this stock is highly speculative. High – stock should be expected to move up or down at least 40–60% in a year – investors should be aware this stock could be speculative. Medium – stock should be expected to move up or down at least 30–40% in a year. Low–medium – stock should be expected to move up or down at least 25–30% in a year. Low – stock should be expected to move up or down at least 15–25% in a year. * Applicable to Asia/Australian/NZ/Canada stocks only
Recommendations – 12 months Note: Quant recommendations may differ from Fundamental Analyst recommendations
Financial definitions
All "Adjusted" data items have had the following adjustments made: Added back: goodwill amortisation, provision for catastrophe reserves, IFRS derivatives & hedging, IFRS impairments & IFRS interest expense Excluded: non recurring items, asset revals, property revals, appraisal value uplift, preference dividends & minority interests EPS = adjusted net profit / efpowa* ROA = adjusted ebit / average total assets ROA Banks/Insurance = adjusted net profit /average total assets ROE = adjusted net profit / average shareholders funds Gross cashflow = adjusted net profit + depreciation *equivalent fully paid ordinary weighted average number of shares All Reported numbers for Australian/NZ listed stocks are modelled under IFRS (International Financial Reporting Standards).
Recommendation proportions – For quarter ending 30 June 2016
AU/NZ Asia RSA USA CA EUR Outperform 45.17% 56.00% 36.36% 43.16% 63.39% 45.91% (for global coverage by Macquarie, 6.27% of stocks followed are investment banking clients)
Neutral 36.21% 28.59% 40.26% 50.38% 29.46% 36.96% (for global coverage by Macquarie, 6.33% of stocks followed are investment banking clients)
Underperform 18.62% 15.41% 23.38% 6.46% 7.14% 17.12% (for global coverage by Macquarie, 5.38% of stocks followed are investment banking clients)
Company-specific disclosures: Important disclosure information regarding the subject companies covered in this report is available at www.macquarie.com/research/disclosures.
Analyst certification: We hereby certify that all of the views expressed in this report accurately reflect our personal views about the subject company or companies and its or their securities. We also certify that no part of our compensation was, is or will be, directly or indirectly, related to the specific recommendations or views expressed in this report. The Analysts responsible for preparing this report receive compensation from Macquarie that is based upon various factors including Macquarie Group Ltd total revenues, a portion of which are generated by Macquarie Group’s Investment Banking activities. General disclaimers: Macquarie Securities (Australia) Ltd; Macquarie Capital (Europe) Ltd; Macquarie Capital Markets Canada Ltd; Macquarie Capital Markets North America Ltd; Macquarie Capital (USA) Inc; Macquarie Capital Limited and its Taiwan branch; Macquarie Capital Securities (Singapore) Pte Ltd; Macquarie Securities (NZ) Ltd; Macquarie Equities South Africa (Pty) Ltd; Macquarie Capital Securities (India) Pvt Ltd; Macquarie Capital Securities (Malaysia) Sdn Bhd; Macquarie Securities Korea Limited and Macquarie Securities (Thailand) Ltd are not authorized deposit-taking institutions for the purposes of the Banking Act 1959 (Commonwealth of Australia), and their obligations do not represent deposits or other liabilities of Macquarie Bank Limited ABN 46 008 583 542 (MBL) or MGL. MBL does not guarantee or otherwise provide assurance in respect of the obligations of any of the above mentioned entities. MGL provides a guarantee to the Monetary Authority of Singapore in respect of the obligations and liabilities of Macquarie Capital Securities (Singapore) Pte Ltd for up to SGD 35 million. This research has been prepared for the general use of the wholesale clients of the Macquarie Group and must not be copied, either in whole or in part, or distributed to any other person. If you are not the intended recipient you must not use or disclose the information in this research in any way. If you received it in error, please tell us immediately by return e-mail and delete the document. We do not guarantee the integrity of any e-mails or attached files and are not responsible for any changes made to them by any other person. MGL has established and implemented a conflicts policy at group level (which may be revised and updated from time to time) (the "Conflicts Policy") pursuant to regulatory requirements (including the FCA Rules) which sets out how we must seek to identify and manage all material conflicts of interest. Nothing in this research shall be construed as a solicitation to buy or sell any security or product, or to engage in or refrain from engaging in any transaction. In preparing this research, we did not take into account your investment objectives, financial situation or particular needs. Macquarie salespeople, traders and other professionals may provide oral or written market commentary or trading strategies to our clients that reflect opinions which are contrary to the opinions expressed in this research. Macquarie Research produces a variety of research products including, but not limited to, fundamental analysis, macro-economic analysis, quantitative analysis, and trade ideas. Recommendations contained in one type of research product may differ from recommendations contained in other types of research, whether as a result of differing time horizons, methodologies, or otherwise. Before making an investment decision on the basis of this research, you need to consider, with or without the assistance of an adviser, whether the advice is appropriate in light of your particular investment needs, objectives and financial circumstances. There are risks involved in securities trading. The price of securities can and does fluctuate, and an individual security may even become valueless. International investors are reminded of the additional risks inherent in international investments, such as currency fluctuations and international stock market or economic conditions, which may adversely affect the value of the investment. This research is based on information obtained from sources believed to be reliable but we do not make any representation or warranty that it is accurate, complete or up to date. We accept no obligation to correct or update the information or opinions in it. Opinions expressed are subject to change without notice. No member of the Macquarie Group accepts any liability whatsoever for any direct, indirect, consequential or other loss arising from any use of this research and/or further communication in relation to this research. Clients should contact analysts at, and execute transactions through, a Macquarie Group entity in their home jurisdiction unless governing law permits otherwise. The date and timestamp for above share price and market cap is the closed price of the price date. #CLOSE is the final price at which the security is traded in the relevant exchange on the date indicated. Country-specific disclaimers: Australia: In Australia, research is issued and distributed by Macquarie Securities (Australia) Ltd (AFSL No. 238947), a participating organisation of the Australian Securities Exchange. New Zealand: In New Zealand, research is issued and distributed by Macquarie Securities (NZ) Ltd, a NZX Firm. Canada: In Canada, research is prepared, approved and distributed by Macquarie Capital Markets Canada Ltd, a participating organisation of the Toronto Stock Exchange, TSX Venture Exchange & Montréal Exchange. Macquarie Capital Markets North America Ltd., which is a registered broker-dealer and member of FINRA, accepts responsibility for the contents of reports issued by Macquarie Capital Markets Canada Ltd in the United States and sent to US persons. Any US person wishing to effect transactions in the securities described in the reports issued by Macquarie Capital Markets Canada Ltd should do so with Macquarie Capital Markets North America Ltd. The Research Distribution Policy of Macquarie Capital Markets Canada Ltd is to allow all clients that are entitled to have equal access to our research. United Kingdom: In the United Kingdom, research is issued and distributed by Macquarie Capital (Europe) Ltd, which is authorised and regulated by the Financial Conduct Authority (No. 193905). Germany: In

Macquarie Research Rights, Wrongs & Returns
15 July 2016 50
Germany, this research is issued and/or distributed by Macquarie Capital (Europe) Limited, Niederlassung Deutschland, which is authorised and regulated by the UK Financial Conduct Authority (No. 193905). and in Germany by BaFin. France: In France, research is issued and distributed by Macquarie Capital (Europe) Ltd, which is authorised and regulated in the United Kingdom by the Financial Conduct Authority (No. 193905). Hong Kong & Mainland China: In Hong Kong, research is issued and distributed by Macquarie Capital Limited, which is licensed and regulated by the Securities and Futures Commission. In Mainland China, Macquarie Securities (Australia) Limited Shanghai Representative Office only engages in non-business operational activities excluding issuing and distributing research. Only non-A share research is distributed into Mainland China by Macquarie Capital Limited. Japan: In Japan, research is Issued and distributed by Macquarie Capital Securities (Japan) Limited, a member of the Tokyo Stock Exchange, Inc. and Osaka Exchange, Inc. (Financial Instruments Firm, Kanto Financial Bureau (kin-sho) No. 231, a member of Japan Securities Dealers Association). India: In India, research is issued and distributed by Macquarie Capital Securities (India) Pvt. Ltd. (CIN: U65920MH1995PTC090696), formerly known as Macquarie Capital (India) Pvt. Ltd., 92, Level 9, 2 North Avenue, Maker Maxity, Bandra Kurla Complex, Bandra (East), Mumbai – 400 051, India, which is a SEBI registered Research Analyst having registration no. INH000000545. Malaysia: In Malaysia, research is issued and distributed by Macquarie Capital Securities (Malaysia) Sdn. Bhd. (Company registration number: 463469-W) which is a Participating Organisation of Bursa Malaysia Berhad and a holder of Capital Markets Services License issued by the Securities Commission. Taiwan: In Taiwan, research is issued and distributed by Macquarie Capital Securities Ltd, Taiwan Branch, which is licensed and regulated by the Financial Supervisory Commission. No portion of the report may be reproduced or quoted by the press or any other person without authorisation from Macquarie. Nothing in this research shall be construed as a solicitation to buy or sell any security or product. Research Associate(s) in this report who are registered as Clerks only assist in the preparation of research and are not engaged in writing the research. Thailand: In Thailand, research is produced, issued and distributed by Macquarie Securities (Thailand) Ltd. Macquarie Securities (Thailand) Ltd. is a licensed securities company that is authorized by the Ministry of Finance, regulated by the Securities and Exchange Commission of Thailand and is an exchange member of the Stock Exchange of Thailand. The Thai Institute of Directors Association has disclosed the Corporate Governance Report of Thai Listed Companies made pursuant to the policy of the Securities and Exchange Commission of Thailand. Macquarie Securities (Thailand) Ltd does not endorse the result of the Corporate Governance Report of Thai Listed Companies but this Report can be accessed at: http://www.thai-iod.com/en/publications.asp?type=4. South Korea: In South Korea, unless otherwise stated, research is prepared, issued and distributed by Macquarie Securities Korea Limited, which is regulated by the Financial Supervisory Services. Information on analysts in MSKL is disclosed at http://dis.kofia.or.kr/websquare/index.jsp?w2xPath=/wq/fundMgr/DISFundMgrAnalystStut.xml&divisionId=MDIS03002001000000&serviceId=SDIS03002001000. South Africa: In South Africa, research is issued and distributed by Macquarie Equities South Africa (Pty) Ltd, a member of the JSE Limited. Singapore: In Singapore, research is issued and distributed by Macquarie Capital Securities (Singapore) Pte Ltd (Company Registration Number: 198702912C), a Capital Markets Services license holder under the Securities and Futures Act to deal in securities and provide custodial services in Singapore. Pursuant to the Financial Advisers (Amendment) Regulations 2005, Macquarie Capital Securities (Singapore) Pte Ltd is exempt from complying with sections 25, 27 and 36 of the Financial Advisers Act. All Singapore-based recipients of research produced by Macquarie Capital (Europe) Limited, Macquarie Capital Markets Canada Ltd, Macquarie Equities South Africa (Pty) Ltd and Macquarie Capital (USA) Inc. represent and warrant that they are institutional investors as defined in the Securities and Futures Act. United States: In the United States, research is issued and distributed by Macquarie Capital (USA) Inc., which is a registered broker-dealer and member of FINRA. Macquarie Capital (USA) Inc, accepts responsibility for the content of each research report prepared by one of its non-US affiliates when the research report is distributed in the United States by Macquarie Capital (USA) Inc. Macquarie Capital (USA) Inc.’s affiliate’s analysts are not registered as research analysts with FINRA, may not be associated persons of Macquarie Capital (USA) Inc., and therefore may not be subject to FINRA rule restrictions on communications with a subject company, public appearances, and trading securities held by a research analyst account. Information regarding futures is provided for reference purposes only and is not a solicitation for purchases or sales of futures. Any persons receiving this report directly from Macquarie Capital (USA) Inc. and wishing to effect a transaction in any security described herein should do so with Macquarie Capital (USA) Inc. Important disclosure information regarding the subject companies covered in this report is available at www.macquarie.com/research/disclosures, or contact your registered representative at 1-888-MAC-STOCK, or write to the Supervisory Analysts, Research Department, Macquarie Securities, 125 W.55th Street, New York, NY 10019. © Macquarie Group

Asia Research Head of Equity Research
Peter Redhead (Global – Head) (852) 3922 4836
Jake Lynch (Asia – Head) (852) 3922 3583
David Gibson (Japan – Head) (813) 3512 7880
Conrad Werner (ASEAN – Head) (65) 6601 0182
Automobiles/Auto Parts
Janet Lewis (China) (852) 3922 5417
Zhixuan Lin (China) (8621) 2412 9006
Leo Lin (China) (852) 3922 1098
Takuo Katayama (Japan) (813) 3512 7856
James Hong (Korea) (822) 3705 8661
Amit Mishra (India) (9122) 6720 4084
Lyall Taylor (Indonesia) (6221) 2598 8489
Financials
Scott Russell (Asia) (852) 3922 3567
Dexter Hsu (China, Taiwan) (8862) 2734 7530
Elaine Zhou (Hong Kong) (852) 3922 3278
Keisuke Moriyama (Japan) (813) 3512 7476
Leo Nakada (Japan) (813) 3512 6050
Chan Hwang (Korea) (822) 3705 8643
Suresh Ganapathy (India) (9122) 6720 4078
Thomas Stoegner (65) 6601 0854 (Malaysia, Singapore)
Lyall Taylor (Indonesia) (6221) 2598 8489
Gilbert Lopez (Philippines) (632) 857 0892
Passakorn Linmaneechote (Thailand) (662) 694 7728
Conglomerates
David Ng (China, Hong Kong) (852) 3922 1291
Conrad Werner (Singapore) (65) 6601 0182
Gilbert Lopez (Philippines) (632) 857 0892
Consumer and Gaming
Linda Huang (Asia, China, Hong Kong) (852) 3922 4068
Zibo Chen (China, Hong Kong) (852) 3922 1130
Terence Chang (China, Hong Kong) (852) 3922 3581
Satsuki Kawasaki (Japan) (813) 3512 7870
Kwang Cho (Korea) (822) 3705 4953
KJ Lee (Korea) (822) 3705 9935
Stella Li (Taiwan) (8862) 2734 7514
Amit Sinha (India) (9122) 6720 4085
Fransisca Widjaja (65) 6601 0847 (Indonesia, Singapore)
Hendy Soegiarto (Indonesia) (6221) 2598 8369
Karisa Magpayo (Philippines) (632) 857 0899
Chalinee Congmuang (Thailand) (662) 694 7993
Emerging Leaders
Jake Lynch (Asia) (852) 3922 3583
Aditya Suresh (Asia) (852) 3922 1265
Timothy Lam (China, Hong Kong) (852) 3922 1086
Mike Allen (Japan) (813) 3512 7859
Kwang Cho (Korea) (822) 3705 4953
Corinne Jian (Taiwan) (8862) 2734 7522
Marcus Yang (Taiwan) (8862) 2734 7532
Conrad Werner (ASEAN) (65) 6601 0182
Industrials
Janet Lewis (Asia) (852) 3922 5417
Patrick Dai (China) (8621) 2412 9082
Leo Lin (China) (852) 3922 1098
Kenjin Hotta (Japan) (813) 3512 7871
James Hong (Korea) (822) 3705 8661
Inderjeetsingh Bhatia (India) (9122) 6720 4087
Lyall Taylor (Indonesia) (6221) 2598 8489
Internet, Media and Software
Wendy Huang (Asia, China) (852) 3922 3378
David Gibson (Asia, Japan) (813) 3512 7880
Hillman Chan (China, Hong Kong) (852) 3922 3716
Nathan Ramler (Japan) (813) 3512 7875
Soyun Shin (Korea) (822) 3705 8659
Abhishek Bhandari (India) (9122) 6720 4088
Oil, Gas and Petrochemicals
Polina Diyachkina (Asia, Japan) (813) 3512 7886
Aditya Suresh (Asia, China) (852) 3922 1265
Anna Park (Korea) (822) 3705 8669
Duke Suttikulpanich (ASEAN) (65) 6601 0148
Isaac Chow (Malaysia) (603) 2059 8982
Pharmaceuticals and Healthcare
Abhishek Singhal (India) (9122) 6720 4086
Wei Li (China, Hong Kong) (852) 3922 5494
Property
Tuck Yin Soong (Asia, Singapore) (65) 6601 0838
David Ng (China, Hong Kong) (852) 3922 1291
Raymond Liu (China, Hong Kong) (852) 3922 3629
Wilson Ho (China) (852) 3922 3248
William Montgomery (Japan) (813) 3512 7864
Corinne Jian (Taiwan) (8862) 2734 7522
Abhishek Bhandari (India) (9122) 6720 4088
Aiman Mohamad (Malaysia) (603) 2059 8986
Kervin Sisayan (Philippines) (632) 857 0893
Patti Tomaitrichitr (Thailand) (662) 694 7727
Resources / Metals and Mining
Polina Diyachkina (Asia, Japan) (813) 3512 7886
Coria Chow (China) (852) 3922 1181
Anna Park (Korea) (822) 3705 8669
Stanley Liong (Indonesia) (6221) 2598 8381
Technology
Damian Thong (Asia, Japan) (813) 3512 7877
George Chang (Japan) (813) 3512 7854
Daniel Kim (Korea) (822) 3705 8641
Allen Chang (Greater China) (852) 3922 1136
Jeffrey Ohlweiler (Greater China) (8862) 2734 7512
Patrick Liao (Greater China) (8862) 2734 7515
Louis Cheng (Greater China) (8862) 2734 7526
Kaylin Tsai (Greater China) (8862) 2734 7523
Telecoms
Nathan Ramler (Asia, Japan) (813) 3512 7875
Danny Chu (Greater China) (852) 3922 4762
Soyun Shin (Korea) (822) 3705 8659
Chirag Jain (India) (9122) 6720 4352
Prem Jearajasingam (ASEAN) (603) 2059 8989
Kervin Sisayan (Philippines) (632) 857 0893
Transport & Infrastructure
Janet Lewis (Asia) (852) 3922 5417
Corinne Jian (Taiwan) (8862) 2734 7522
Azita Nazrene (ASEAN) (603) 2059 8980
Utilities & Renewables
Alan Hon (Hong Kong) (852) 3922 3589
Inderjeetsingh Bhatia (India) (9122) 6720 4087
Prem Jearajasingam (Malaysia) (603) 2059 8989
Karisa Magpayo (Philippines) (632) 857 0899
Commodities
Colin Hamilton (Global) (44 20) 3037 4061
Ian Roper (65) 6601 0698
Jim Lennon (44 20) 3037 4271
Lynn Zhao (8621) 2412 9035
Matthew Turner (44 20) 3037 4340
Economics
Peter Eadon-Clarke (Global) (813) 3512 7850
Larry Hu (China, Hong Kong) (852) 3922 3778
Tanvee Gupta Jain (India) (9122) 6720 4355
Quantitative / CPG
Gurvinder Brar (Global) (44 20) 3037 4036
Woei Chan (Asia) (852) 3922 1421
Danny Deng (Asia) (852) 3922 4646
Per Gullberg (Asia) (852) 3922 1478
Strategy/Country
Viktor Shvets (Asia, Global) (852) 3922 3883
Chetan Seth (Asia) (852) 3922 4769
David Ng (China, Hong Kong) (852) 3922 1291
Erwin Sanft (China, Hong Kong) (852) 3922 1516
Peter Eadon-Clarke (Japan) (813) 3512 7850
Chan Hwang (Korea) (822) 3705 8643
Jeffrey Ohlweiler (Taiwan) (8862) 2734 7512
Inderjeetsingh Bhatia (India) (9122) 6720 4087
Lyall Taylor (Indonesia) (6221) 2598 8489
Gilbert Lopez (Philippines) (632) 857 0892
Conrad Werner (Singapore) (65) 6601 0182
Alastair Macdonald (Thailand) (662) 694 7753
Find our research at Macquarie: www.macquarie.com.au/research Thomson: www.thomson.com/financial Reuters: www.knowledge.reuters.com Bloomberg: MAC GO Factset: http://www.factset.com/home.aspx CapitalIQ www.capitaliq.com Email [email protected] for access
Asia Sales Regional Heads of Sales
Miki Edelman (Global) (1 212) 231 6121
Jeff Evans (Boston) (1 617) 598 2508
Jeffrey Shiu (China, Hong Kong) (852) 3922 2061
Sandeep Bhatia (India) (9122) 6720 4101
Thomas Renz (Geneva) (41 22) 818 7712
Riaz Hyder (Indonesia) (6221) 2598 8486
Nick Cant (Japan) (65) 6601 0210
John Jay Lee (Korea) (822) 3705 9988
Nik Hadi (Malaysia) (603) 2059 8888
Eric Roles (New York) (1 212) 231 2559
Gino C Rojas (Philippines) (632) 857 0861
Regional Heads of Sales cont’d
Paul Colaco (San Francisco) (1 415) 762 5003
Amelia Mehta (Singapore) (65) 6601 0211
Angus Kent (Thailand) (662) 694 7601
Ben Musgrave (UK/Europe) (44 20) 3037 4882
Christina Lee (UK/Europe) (44 20) 3037 4873
Sales Trading
Adam Zaki (Asia) (852) 3922 2002
Stanley Dunda (Indonesia) (6221) 515 1555
Sales Trading cont’d
Suhaida Samsudin (Malaysia) (603) 2059 8888
Michael Santos (Philippines) (632) 857 0813
Chris Reale (New York) (1 212) 231 2555
Marc Rosa (New York) (1 212) 231 2555
Justin Morrison (Singapore) (65) 6601 0288
Daniel Clarke (Taiwan) (8862) 2734 7580
Brendan Rake (Thailand) (662) 694 7707
Mike Keen (UK/Europe) (44 20) 3037 4905
This publication was disseminated on 15 July 2016 at 04:27 UTC.