global smart water market 'unearthing the real value of water
TRANSCRIPT

Global Smart Water Market
‘Unearthing the REAL Value of Water and the Industry’
Presented at the Tekes Seminar on BioRefine and Water on 27th November 2012 at the Marina Congress Center in Helsinki
By
Fredrick Royan – Research Director, Global Environment (Water) Markets

Agenda
2
About Frost & Sullivan
Global Water Market – Key Data and Mega Trend Drivers
Key Challenges of the Global Water Industry
Smart is the New Green
Process and operational efficiency improvement drivers
Landscape of the Global Smart Water Market
Market opportunities in the Global Smart Water Market
Market Segment Hot-spots
Regional Hot-spots
Illustrate the business case of Smart Water Solutions with project
examples
Highlight the Competitive Landscape, Business Models and related
opportunities for Finnish Companies

The Frost & Sullivan Story
3
Pioneered Emerging Market & Technology Research
• Global Footprint Begins
• Country Economic Research
• Market & Technical Research
• Best Practice Career Training
• MindXChange Events
Partnership Relationship with Clients
• Growth Partnership Services
• GIL Global Events
• GIL University
• Growth Team Membership™
• Growth Consulting
Visionary Innovation
• Mega Trends Research
• CEO 360 Visionary Perspective
• GIL Think Tanks
• GIL Global Community
• Communities of Practice

Our Industry Coverage
4
Aerospace & Defense Measurement & Instrumentation
Information & Communication
Technologies
Healthcare Environment & Building Technologies
Energy & Power Systems
Chemicals, Materials & Food
Electronics & Security
Industrial Automation & Process Control
Automotive Transportation & Logistics
Consumer Technologies
Minerals & Mining

Megatrends provide a big lens when evaluating
future growth opportunity areas for Smart Water
5
$ 425 Billion
Total Global Water Market Value
Key Global Water Growth Drivers
International
Agency
Environment
Protection
Agencies
Business &
Financial
Agencies
Soci
al &
Eco
no
mic
al
Rapid
Population
Growth &
Urbanisation
Water Quality &
Public Health
Water Supply &
Sanitation
Needs of Remote
Communities Ec
olo
gic
al
Carbon
footprint
Storm/Flood
water
Management
Water
Stress/Droughts
Po
litic
al &
Fin
an
cia
l
Construction
Technical engineering & design
Operations & maintenance
Chemicals supply
Technology/equipment supply
R & D and piloting
Water management
Ke
y a
ctivitie
s
acro
ss th
e v
alu
e
ch
ain

Top 10 Challenges of the Global Water Market
6
Institutional
Capacity and
Resources
Governance and
Accountability
Water Resource
Availability &
Water-Energy Nexus
Public Health – Water
Quality, Access to
Sanitation and Safe
Disposal
Sustainability of
Water Utilities and
Cities Risk in Water Intensive
Industry and Global Trade
Top 10 Global
Water Market
Challenges
Source: Frost & Sullivan
Relatively High
Capex and Opex
Population Growth
and Urbanisation
Climate Change
and Extreme
Weather Events
VALUE of Water and Non-
revenue Water(NRW)
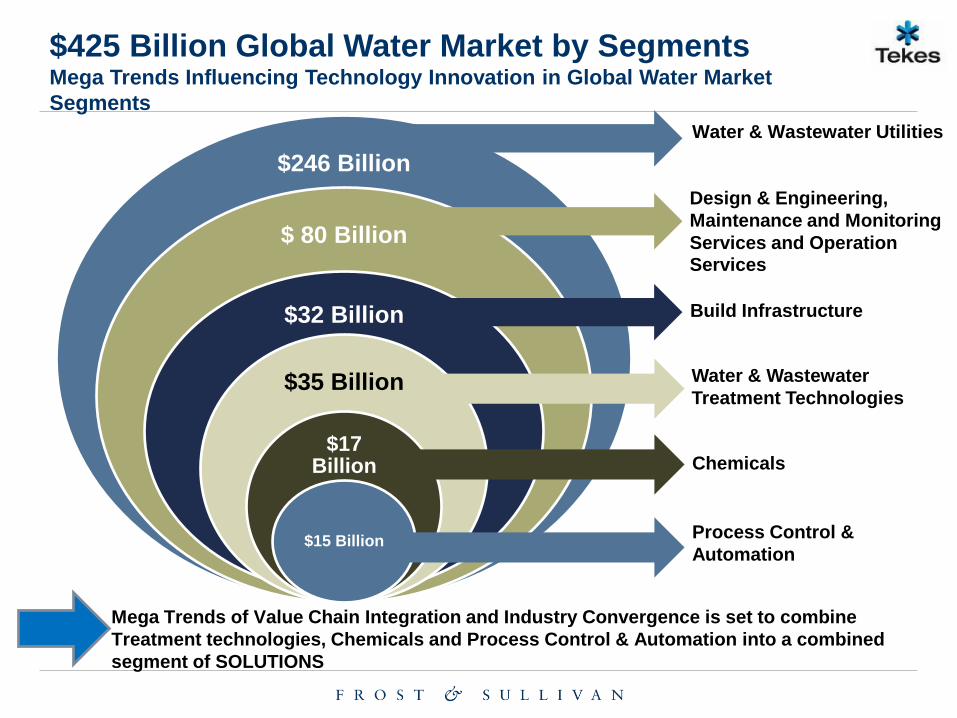
$425 Billion Global Water Market by Segments Mega Trends Influencing Technology Innovation in Global Water Market
Segments
$246 Billion
$ 80 Billion
$32 Billion
$35 Billion
$17 Billion
$15 Billion
Mega Trends of Value Chain Integration and Industry Convergence is set to combine
Treatment technologies, Chemicals and Process Control & Automation into a combined
segment of SOLUTIONS
Water & Wastewater Utilities
Design & Engineering,
Maintenance and Monitoring
Services and Operation Services
Build Infrastructure
Water & Wastewater
Treatment Technologies
Chemicals
Process Control &
Automation

New Segment of Smart Solutions is a Key Enabler in
Unearthing the VALUE of the Water Industry
8
Value Chain of the Water Industry with Representative Sample of Industry Participants
Smart Water Analytics, Meters and Software Companies
Design & Engineering Companies
Process Automation and Control
Chemicals & Materials
O&M Companies
Treatment Technology
Water Utilities
Industries

Mega Trend – Smart is the New Green
9

Smart Water Solutions are Set to Revolutionise
Management Methods Across the Water Cycle
10
‘S” Governance
‘S’ City Planning
‘S’ Water
‘S’ Business
‘S’ ICT
‘S’ Mobility
‘S’ Citizen
‘S’ Buildings
Source: Frost & Sullivan
Real time monitoring and management of Services along the Water Cycle
Data Analysis and Exchange

Future Smart Water Grid
Smart Water eters
Smart alves and ipes
Smart Water uality
Monitors
Smart P mps
Note: Image was adapted from UK Drinking Water Inspectorate. Source: Frost & Sullivan analysis.
Sewage Treatment
Factories
Sea River
Reservoir
Homes and Businesses
Water Treatment Works
Ground Water Data
Concentrator and Communications

Smart Water – Key Drivers
12
Economic -Cost of energy
-Water use inefficiencies
Technological -ICT integration
-Increased granularity
-Exposed relationships
Social -Urbanization
-Globalization
-Access to Information
and Water
Environmental -Water scarcity
-Resilience to
climate change
-Increased demand
-Carbon footprints
Political -Efficiency
-Innovation
-Accountability
-Sustainability
‘S” Governance
‘S’ City Planning
‘S’ Water
‘S’ Business
‘S’ ICT
‘S’ Mobility
‘S’ Citizen
‘S’ Buildings

Smart Water – Key Restraints
13
Political -Low government push
-Unsustainable subsidies
Organisational -Business Case
-Integration
-Risk averse
-Silos
Market -Fractured / Consolidating
-Low turnkey opportunity
Technological -Hardware v Software
-Simplification
-Integration
-Longevity
-Proprietary v Open
Social -Privacy
-Health
-Buy in
-Low incentive

Smart Water Grid Market Value to Quadruple in
Decade
14
0%
10%
20%
30%
40%
50%
60%
70%
80%
90%
100%
2010 2011 2012 2013 2014 2015 2016 2017 2018 2019 2020
Pen
etra
tio
n R
ate
Smart Water Grid Market: Smart and Conventional Water Grid Penetration (Global), 2010-2020
Conventional Water Network Smart Water Network
$5.8B Total Market
Value
$22.2B Total Market
Value
$8.7B Total Market
Value
2020 Smart Water Grid
Penetration 29%
Note: All figures are rounded. The base year is 2010. Source: Frost & Sullivan analysis.

Smart Water – Market Landscape and Key Segments
15
Combined
Analytical
Control
and
Automation
System
(expected)
Water Utilities
Design and
Engineering
Services
$0.34 billion
Automation
and Control
$1.05 billion
Smart Water
Infrastructure (including
Communications)
$3.38 billion
Analytical
Software
$1.03 billion
Hard
ware
S
oftw
are
Pumps Pipes and Valves Data Loggers
Radio Frequency
Mesh
Radio Frequency
Point-to-Point
Cellular Fibre Optic
Power Line
Communication
Broadband
Hydraulic
Modelling
Grid
Monitoring
Prediction
Analysis
Asset
Management
Queries and
Remote Upgrades
Cyb
er S
ecu
rity
Meter Data
Management
Event
Prioritisation
Bespoke
Reports
Remote Pressure Control
AMR/AMI
Meters Sensors
Remote Energy Generators
SCADA
Programmable Logic Controller
Human Machine Interface
Segment and
Market Size, 2010
Distributed Control System
Source: Frost & Sullivan analysis.

Smart Water Market – Hot-Spots by Market Segment
16
Smart Water Infrastructure, $3.38
billion
Automation and Control, $1.05 billion
ICT, Software and Analytics, $1.03 billion
Design and Engineering Services, $0.34 billion
0,00
0,50
1,00
1,50
2,00
2,50
3,00
3,50
4,00
0,0 5,0 10,0 15,0 20,0 25,0 30,0
20
10
Mar
ket
Size
($
Bill
ion
)
CAGR (%), 2010-2020
Smart Water Grid Market: Vertical Market Attractiveness by Segment (Global), 2010-2020
Note: Size of bubble indicates degree of market share. All figures are rounded. The base year is 2010. Source: Frost & Sullivan analysis. .

Smart Water Market – Hot-Spots by Regional
Segments
17
North America, $2.42 billion
Europe, $1.68 billion
APAC, $0.82 billion
LatAm, $0.33 billion
MEA, $0.54 billion
0,00
0,50
1,00
1,50
2,00
2,50
3,00
0,0 5,0 10,0 15,0 20,0 25,0
20
10
Mar
ket
Size
($
Bill
ion
)
CAGR (%), 2010-2020
Smart Water Grid Market: Regional Attractiveness by Region (Global), 2010-2020
Note: Size of bubble indicates degree of market share. All figures are rounded. The base year is 2010. Source: Frost & Sullivan analysis. .

2020 Smart Water Meter Penetration in Europe – 52%
18
0
40 000
80 000
120 000
160 000
200 000
240 000
2007 2008 2009 2010 2011 2012 2013 2014 2015 2016 2017 2018 2019 2020 2030
Un
its
('0
00
)
Smart Water Meter Market Penetration, 2007 - 2020, 2030 (Europe)
Households ('000) Water Meters ('000) Smart Water Meters ('000)
$1.2B
Total Market
Value
$2.6B
Total Market
Value
$7.8B
Total Market
Value
*Based on predicted scenario

2020 Smart Water Meter Market in Europe – Network
Management is likely to be the major contributor to
the market growth
19
Smart Water Meter Manufacturers,
$311.1 m
Meter Installers, $163.8 m
Network & Data Management, $744.0 m
0,0
5,0
10,0
15,0
20,0
25,0
30,0
35,0
40,0
0,0 10,0 20,0 30,0 40,0 50,0 60,0 70,0 80,0
Gro
wth
Ra
te, 2
01
0-2
02
0 (
%)
Market Share, 2010 (%)
Smart Water Metering Market: Market Attractiveness by Vertical Market (Europe), 2010-2020
Note: Bubble size and figures adjacent bubble name refers to market size in $ million for 2010. All figures are rounded. The base year is 2010.
Source: Frost & Sullivan analysis.

Smart Water Management to bring Paradigm Shift as
Traditional Practices Overhauled for ICT-enabled Abilities
20
Departmentalized Water Utility Structure
Integrated through new data and information communication
...From
Responsive Customer
Service Proactive
Reactionary Maintenance
and Repair Pre-emptive
Set Rates Billing
Based on Accurate Consumption Levels
Hands-on System Management
Remote fixes and prioritized call-outs
Manual Data Collection Automated
Inefficient Energy Consumption Optimized
...To
Source: Frost & Sullivan analysis.

Project Example – Global Water in the US
21
Source: Global Water

Project Example – Takadu’s Web Interface for Utilities
22
Source: Takadu

Complex Smart Water Universe – Relationships
Between Players will be Crucial to Future
Development
23
Utilities
Communications
Smart Analytics
Automation and Control
Design and Engineering Smart Hardware

Smart Water Market – Development Areas
24
Source: Google Images
Smart Irrigation and Agriculture
Smart Ultrapure Water
Smart Water Supply Management Smart Water Distribution
Management
Smart Wastewater Management
Smart Combined Sewer Overflows
Source: greatlakes.org
Source: usa.siemens.com
Source: organo.co.jp
Source: treehugger.com
Source: agreenstarlandscape.com
Source: precisionmeters.co.za

Smart Water Supply, Wastewater Management,
Recycling and Discharge Metering to Witness
Continued Revenue Growth
25
There are existing related market opportunities outside of the direct smart water grid and smart water metering markets:
Smart Water Resource Management
Smart Wastewater
Both hardware and software can drive revenue. Software with annual fees and servicing contracts, however, can ensure consistent and higher revenue.
• Drainage and runoff monitoring • Water harvesting • Reservoir monitoring • Water resource reallocation
• Water discharge metering • Water discharge quality • Water treatment, reuse and recycling
Sou
rce:
ow
fp.o
uce
.ox.
ac.u
k
Sou
rce:
vo
lcan
oes
.usg
s.go
v
Source: Frost & Sullivan analysis.

Mapping of a Few Finnish Companies in the Global
Smart Grid Market Landscape and Sample of
Competitors/Customers
26
Design and
Engineering
Services $0.34 billion
Analytical
Software $1.03
billion
Automation
and Control
$1.05 billion
Smart Water
Infrastructure
(including
Communicatio
ns)
$3.38 billion
Combined
Analytical
Control
and
Automation
System
(expected)
Programmable Logic Controller, Distributed Control System, Human Machine
Interface, SCADA
Radio Frequency Mesh, Radio Frequency Point-to-Point, Power Line
Communication, Cellular, Fibre Optic, Broadband
Sensors, Pumps, AMR/AMI Meters, Pipes and Valves, Remote Energy Generators, Data loggers, etc
Hydraullic Modelling, Grid Monitoring, Prediction Analysis, Queries and Remote
Upgrades, AMR/AMI Metering, asset management, Event Prioritisation, Bespoke
reports, etc
Hard
ware
S
oftw
are
Cyb
er S
ecu
rity
Segment and
Market Size in 2010
Source: Frost & Sullivan analysis.

High Level of Industrial Convergence and Movement
in the Smart Water Grid Market
27
Smart
Water
Meters
Engineering
and Design
Firms
Telemetry
Smart Pumps,
Pipes and
Valves
Software and
Analytic
Firms
ICT,
Automation
and Control
Smart Water
Meters Active Unlikely Active Likely Active Possible
Engineering and
Design Firms Unlikely Active Possible Unlikely Possible Possible
Telemetry Possible Unlikely Active Possible Active Possible
Smart Pumps,
Pipes and Valves Possible Unlikely Active Active Active Possible
Software and
Analytic Firms Unlikely Unlikely Unlikely Unlikely Active Active
ICT, Automation
and Control Possible Active Active Possible Active Active
Vertical Market
Integration
Source: Frost & Sullivan analysis.
Smart Water Grid Market: Future Business Models by Vertical Market (Global), 2012

Key Conclusions
28
• Water Utilities see an opportunity of Unearthing the Value of the ICT
infrastructure especially in the water supply networks
• Cost Recovery Based Water Tariffs will be key Enablers of Smart Water
especially in the high potential emerging markets
• The Global Water Industry is set to strongly benefit from the current trend of
industry convergence(Ex. Xylem acquiring YSI) to quench the technology thirst
of the Water Sector
• Smart Water solutions deliver tangible benefits and addresses key
inadequacies and inefficiencies of the Water Industry
• Global Challenge of Water Stress has transformed Smart Water from a Virtual
solution to a REAL and urgent need for the Water Industry

Questions?
29
Thank you for listening