“global supply and demand of natural rubber” - global supply and demand of natural...
TRANSCRIPT
“Global Supply and Demand of Natural
Rubber” 11th Shanghai Derivatives
Market Forum 2013 29th May 2014
Grand Tower, Shangri-La, Pudong Shanghai, China
Dato’ Dr Kamarul Baharain Basir
Secretary General, ANRPC [email protected]
11th Shanghai Derivative Forum 2014, China 29/5/2014 1
Overview of Presentation;
1. Production and Supply of NR by ANRPC MGs
2. Challenges and and Strategies in NR Production
3. Consumptions of
4. Trends in NR Prices
5. Outlooks of Future Demand of NR
6. Conclusions
29/5/2014 11th Shanghai Derivative Forum 2014, China 2
29/5/2014 11th Shanghai Derivative Forum 2014, China 3
Production and Supply of NR by ANRPC Member Countries

29/5/2014 11th Shanghai Derivative Forum 2014, China 4
Association of Natural Rubber Producing Countries (ANRPC) - www.anrpc.org
ANRPC - www.anrpc.org
Inter-governmental organizations of countries producing natural rubber.
Establish 1970, HQ - Kuala Lumpur, MALAYSIA
Currently - 11 member governments

NR Supply by Members of ANRPC in 2013
• Production – 11.157 mil ton ( Global 93%)
• Yield area - 7.833 mil ha
• Total area planted – 11.588 mil ha
• Average yield - 1,424 kg/ha/yr
• 90 % production by smallholdings
29/5/2014 5 11th Shanghai Derivative Forum 2014, China

2013: Production 11.157 mil tons
29/5/2014 11th Shanghai Derivative Forum 2014, China 6

Annual Rate of Growth in NR Supply (%)
29/5/2014 11th Shanghai Derivative Forum 2014, China 7
NR
Su
pp
ly G
row
th (
%)

Monthly Trends in Production of NR from ANRPC
Month
Production in
2011
(‘ 000 tons)
Production in
2012
(‘000 tons)
%
change
on year
Production in
2013(1)
(‘000 tons)
% change
on year
January 945 869 -8.1 936 7.7
February 775 789 1.8 685 -13.2
March 631 708 12.2 798 12.7
Q1 Total 2,351 2,366 0.6 2,419 2.2
April 599 721 20.4 735 1.9
May 762 882 15.8 779 -11.7
June 928 898 -3.2 928 3.4
Q2 Total 2,289 2,501 9.3 2,442 -2.4
July 939 952 1.3 1001 5.2
August 937 968 3.4 1019 5.2
September 895 1017 13.7 1051 3.4
Q3Total 2,771 2,937 6.0 3,071 4.6
October 922 966 4.7 1008 4.4
November 994 1005 1.2 1048 4.3
December 998 870 -12.8 998 14.6
Q4Total 2,914 2,841 -2.5 3,054 7.5
Year Total 10,280 10,653 3.8 11,157 4.7
29/5/2014 11th Shanghai Derivative Forum 2014, China 8
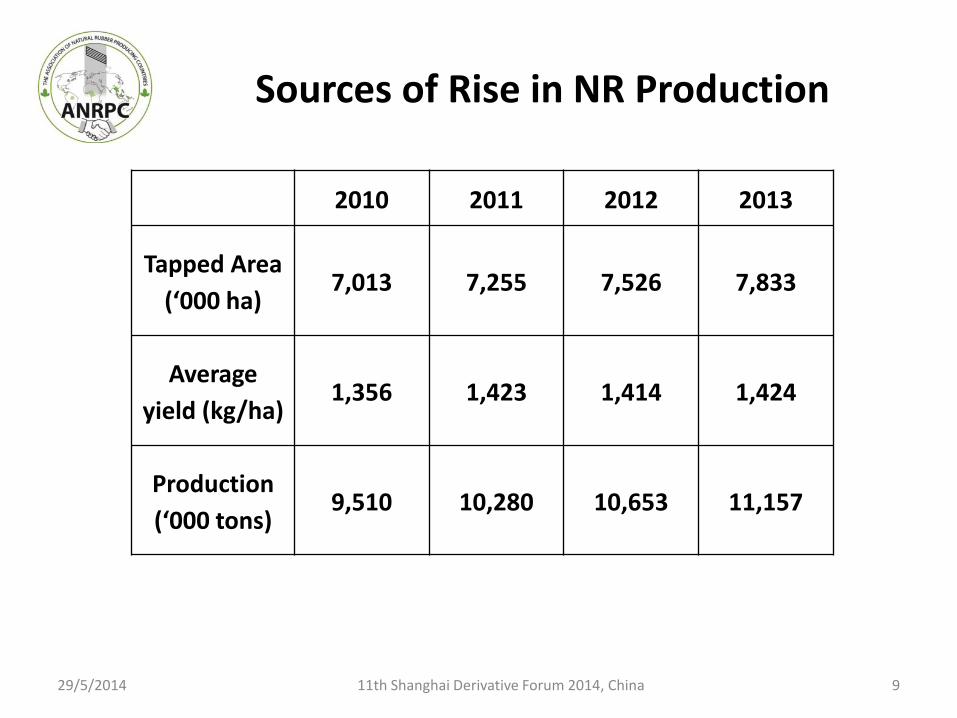
Sources of Rise in NR Production
2010 2011 2012 2013
Tapped Area
(‘000 ha) 7,013 7,255 7,526 7,833
Average
yield (kg/ha) 1,356 1,423 1,414 1,424
Production
(‘000 tons) 9,510 10,280 10,653 11,157
29/5/2014 11th Shanghai Derivative Forum 2014, China 9

29/5/2014 11th Shanghai Derivative Forum 2014, China 10
SEASONALITY IN MONTHLY NR PRODUCTION
AVERAGE MONTHLY PRODUCTION IN ANRPC MEMBER COUNTRIES (2010 – 2012)
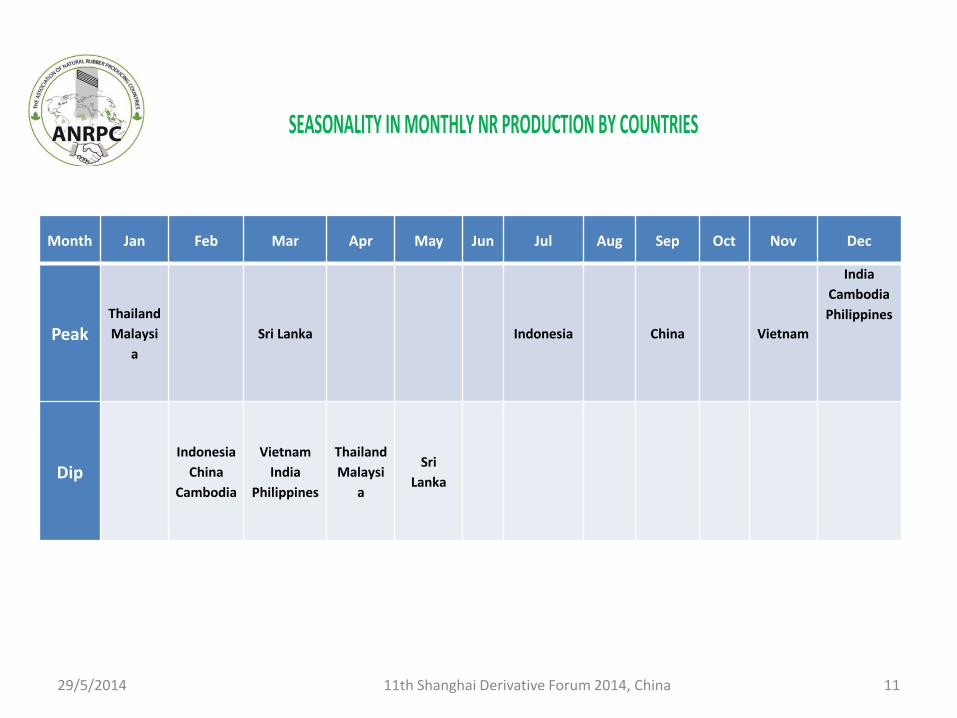
Month Jan Feb Mar Apr May Jun Jul Aug Sep Oct Nov Dec
Peak Thailand
Malaysi
a
Sri Lanka
Indonesia
China
Vietnam
India
Cambodia
Philippines
Dip
Indonesia
China
Cambodia
Vietnam
India
Philippines
Thailand
Malaysi
a
Sri
Lanka
29/5/2014 11th Shanghai Derivative Forum 2014, China 11
SEASONALITY IN MONTHLY NR PRODUCTION BY COUNTRIES
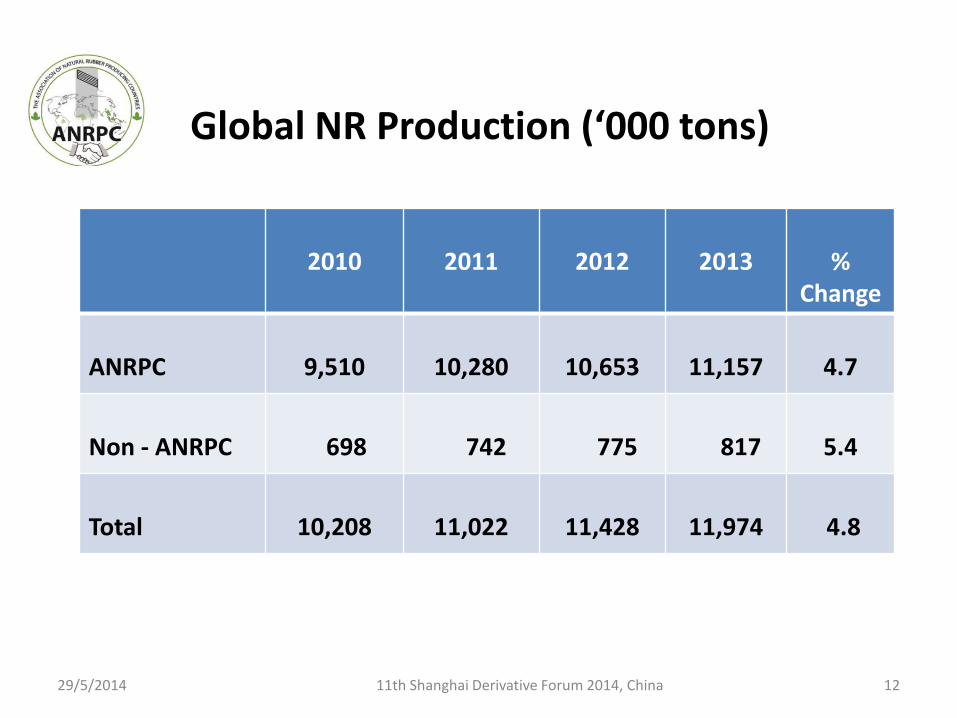
Global NR Production (‘000 tons)
2010
2011
2012
2013
%
Change
ANRPC
9,510
10,280
10,653
11,157
4.7
Non - ANRPC
698
742
775
817
5.4
Total
10,208
11,022
11,428
11,974
4.8
29/5/2014 11th Shanghai Derivative Forum 2014, China 12
29/5/2014 11th Shanghai Derivative Forum 2014, China 13
Challenges and Strategies in NR Production

29/5/2014 11th Shanghai Derivative Forum 2014, China 14
Challenges and Strategies in NR Production
5th and 6th ANRPC Annual Conferences: • 17th October 2012 in Medan Indonesia
• 9th October 2013 in Colombo, Sri Lanka
Members Countries identified:
Challenges and Constraints
Governments - Policies and Strategies

NR Supply Challenges
1. Small land size - 0.2 < 1 > 2.3 hectares 2. Selection of planting materials 3. Level of “good agriculture practices” 4. High productivity, Quality material 5. Bridging/narrowing technology gap 6. Governments incentives 7. Enticing industry into production 8. NR Prices 9. Climatic constraints 10. Sustainability 11. Other sources of NR
29/5/2014 15 11th Shanghai Derivative Forum 2014, China
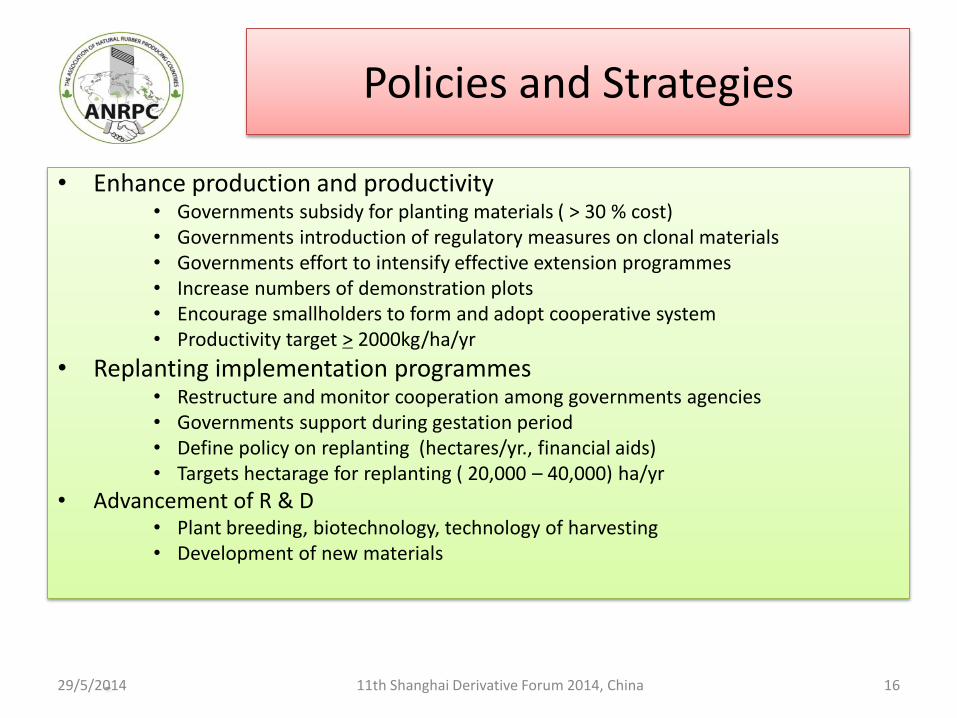
Policies and Strategies
• Enhance production and productivity • Governments subsidy for planting materials ( > 30 % cost) • Governments introduction of regulatory measures on clonal materials • Governments effort to intensify effective extension programmes • Increase numbers of demonstration plots • Encourage smallholders to form and adopt cooperative system • Productivity target > 2000kg/ha/yr
• Replanting implementation programmes • Restructure and monitor cooperation among governments agencies • Governments support during gestation period • Define policy on replanting (hectares/yr., financial aids) • Targets hectarage for replanting ( 20,000 – 40,000) ha/yr
• Advancement of R & D • Plant breeding, biotechnology, technology of harvesting • Development of new materials
–
29/5/2014 11th Shanghai Derivative Forum 2014, China 16
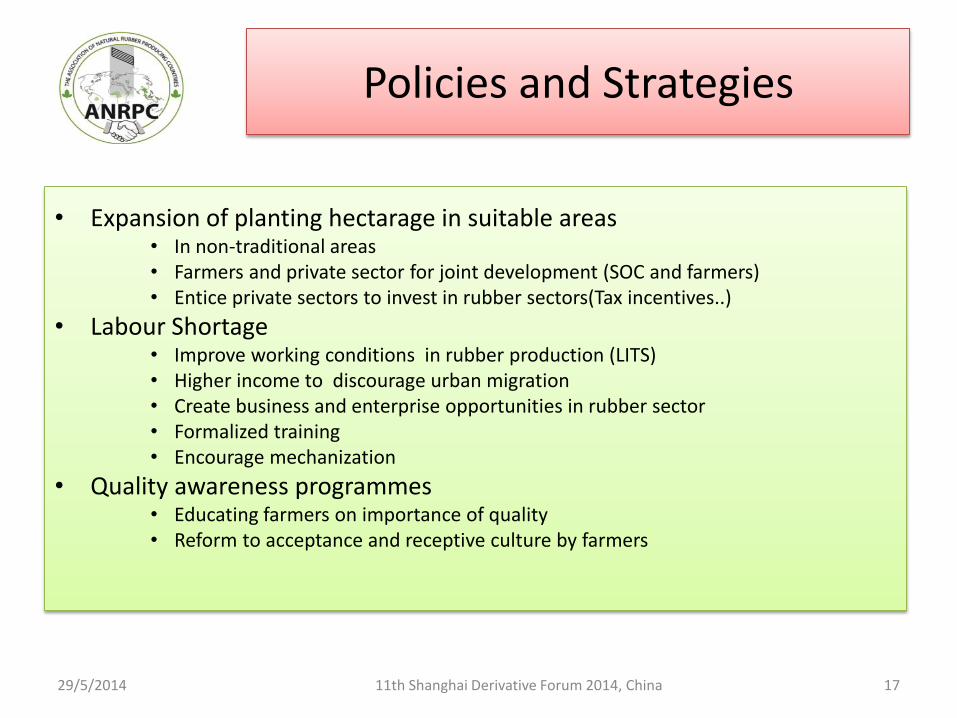
• Expansion of planting hectarage in suitable areas • In non-traditional areas • Farmers and private sector for joint development (SOC and farmers) • Entice private sectors to invest in rubber sectors(Tax incentives..)
• Labour Shortage • Improve working conditions in rubber production (LITS) • Higher income to discourage urban migration • Create business and enterprise opportunities in rubber sector • Formalized training • Encourage mechanization
• Quality awareness programmes • Educating farmers on importance of quality • Reform to acceptance and receptive culture by farmers
–
29/5/2014 11th Shanghai Derivative Forum 2014, China 17
Policies and Strategies
29/5/2014 11th Shanghai Derivative Forum 2014, China 18
Consumption of NR

29/5/2014 11th Shanghai Derivative Forum 2014, China 19
Sectorial Use of Natural Rubber
68%
12%
12% 5% 3%
TYRES
LATEX PRODUCTS
INDUSTRIALPRODUCTS
FOOTWARE
ADHESIVES

29/5/2014 11th Shanghai Derivative Forum 2014, China 20
Use of Natural Rubber in Tyres
Approx. 70 % NR global supply use for tyres
Tyres - OEM ( 30%) ,REM ( 70%)
Global Market 20% annual growth in value for 2008 - 2011 (ERJ)
Passenger Cars - Ratio of SR:NR varies
Light & Heavy Vehicles - High NR
Aviation - Higher NR

Consumption of NR in ANRPC’s Member Countries, Jan- Sept 2013
Country
Consumption
2011 2012 % Change
On year
2013 % Change
On year (‘000
tons) (‘000 tons) (‘000 tons)
China 3,602 3,834 6.4 4,180 8.2
India 958 988 3.1 959 -2.9
Indonesia 474 548 15.6 603 10.0
Thailand 487 505 3.7 521 3.0
Malaysia 419 459 9.5 447 -2.5
Vietnam 145 150 3.4 155 2.7
Sri Lanka 112 110 -1.8 107 -2.6
Philippines 64 72 12.5 70 -1.9
Cambodia 0 0 - 0 -
Total 6,261 6,666 6.5 7,021 5.3
29/5/2014 11th Shanghai Derivative Forum 2014, China 21

29/5/2014 11th Shanghai Derivative Forum 2014, China 22
Global NR Consumption in 2005 - 2011
0
2000
4000
6000
8000
10000
12000
2005 2006 2007 2008 2009 2010 2011
WORLD NR CONSMP ANRPC NR CONSMP
( ‘0
00
to
ns)
29/5/2014 11th Shanghai Derivative Forum 2014, China 23
Trends in Prices of NR

0
50
100
150
200
250
300
350
Jan
1 2
01
3
Jan
15
20
13
Jan
29
20
13
Feb
12
20
13
Feb
26
20
13
Mar
12
…
Mar
26
…
Ap
r 9
20
13
Ap
r 2
3 2
013
May
7 2
01
3
May
21
…
Jun
4 2
013
Jun
18
20
13
July
2 2
01
3
July
16
20
13
July
30
20
13
Au
g 1
3 2
013
Au
g 2
7 2
013
Sep
t 10
…
24
-Se
p-1
3
8-O
ct-1
3
22
-Oct
-13
No
v 5
20
13
No
v 1
9 2
01
3
Dec
3 2
01
3
De
c 1
7 20
13
De
c 3
1 20
13
Jan
14
20
14
Jan
28
20
14
Feb
11
20
14
Feb
25
20
14
Mar
11
…
Mar
25
…
Ap
r 8
20
14
Ap
r 2
2 2
014
May
6 2
01
4
US
$ p
er
10
0 k
g
Price Movement SMR 20 and STR 20 January 2013- May 2014
KL SMR 20
Bangkok STR 20
29/5/2014 11th Shanghai Derivative Forum 2014, China 24

0
50
100
150
200
250
300
350
400Ja
n 1
20
13
Jan
14
20
13
Jan
26
20
13
Feb
8 2
01
3
Feb
21
20
13
Mar
6 2
013
Mar
19
…
Ap
r 1
20
13
Ap
r 1
3 2
013
Ap
r 2
6 2
013
May
9 2
01
3
May
22
…
Jun
4 2
013
Jun
17
20
13
Jun
29
20
13
July
12
…
July
25
…
Au
g 7
20
13
Au
g 2
0…
Sep
t 2
20
13
Sep
t 14
…
27
-Se
p-1
3
10
-Oct
-13
23
-Oct
-13
No
v 5
20
13
No
v 1
8…
No
v 3
0…
Dec
13
…
Dec
26
…
Jan
8 2
01
4
Jan
21
20
14
Feb
32
014
Feb
15
20
14
Feb
28
20
14
Mar
13
…
Mar
26
…
Ap
r 8
20
14
Ap
r 2
1 2
014
May
3 2
01
4
May
16
…
US
$ p
er 1
00
kg
Price movement of RSS 3, RSS 4 and Latex (in bulk, 60% DRC) January 2013-May 2014
Bangkok RSS 3
Kottayam RSS 4
KL Latex 60% DRC
29/5/2014 11th Shanghai Derivative Forum 2014, China 25
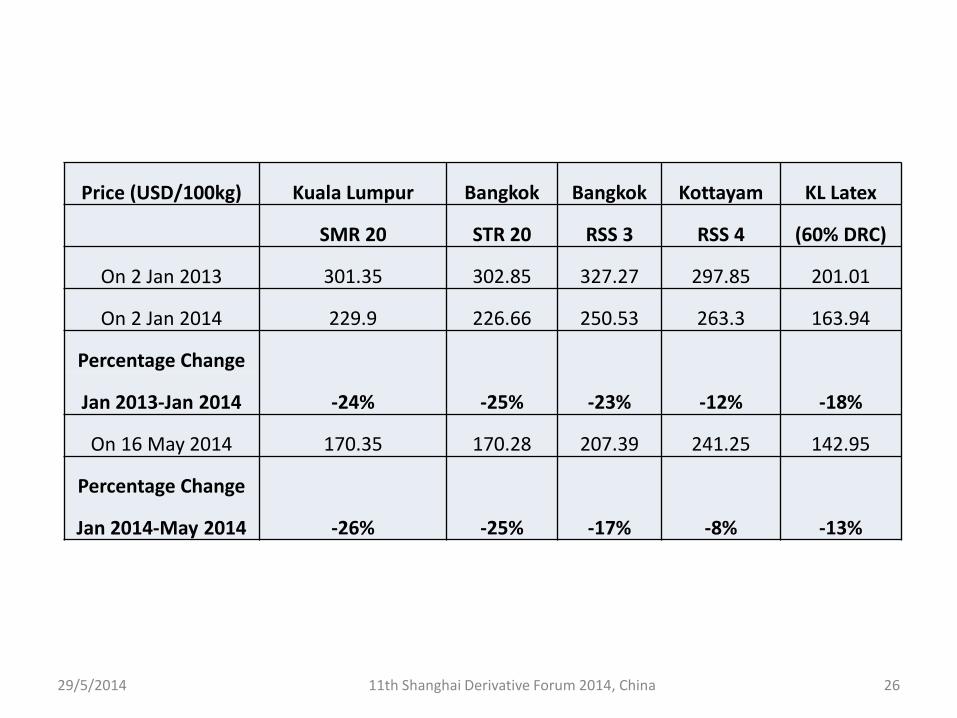
Price (USD/100kg) Kuala Lumpur Bangkok Bangkok Kottayam KL Latex
SMR 20 STR 20 RSS 3 RSS 4 (60% DRC)
On 2 Jan 2013 301.35 302.85 327.27 297.85 201.01
On 2 Jan 2014 229.9 226.66 250.53 263.3 163.94
Percentage Change
-24% -25% -23% -12% -18% Jan 2013-Jan 2014
On 16 May 2014 170.35 170.28 207.39 241.25 142.95
Percentage Change
-26% -25% -17% -8% -13% Jan 2014-May 2014
29/5/2014 11th Shanghai Derivative Forum 2014, China 26

29/5/2014 11th Shanghai Derivative Forum 2014, China 27
NR Producers - > 90% are smallholders
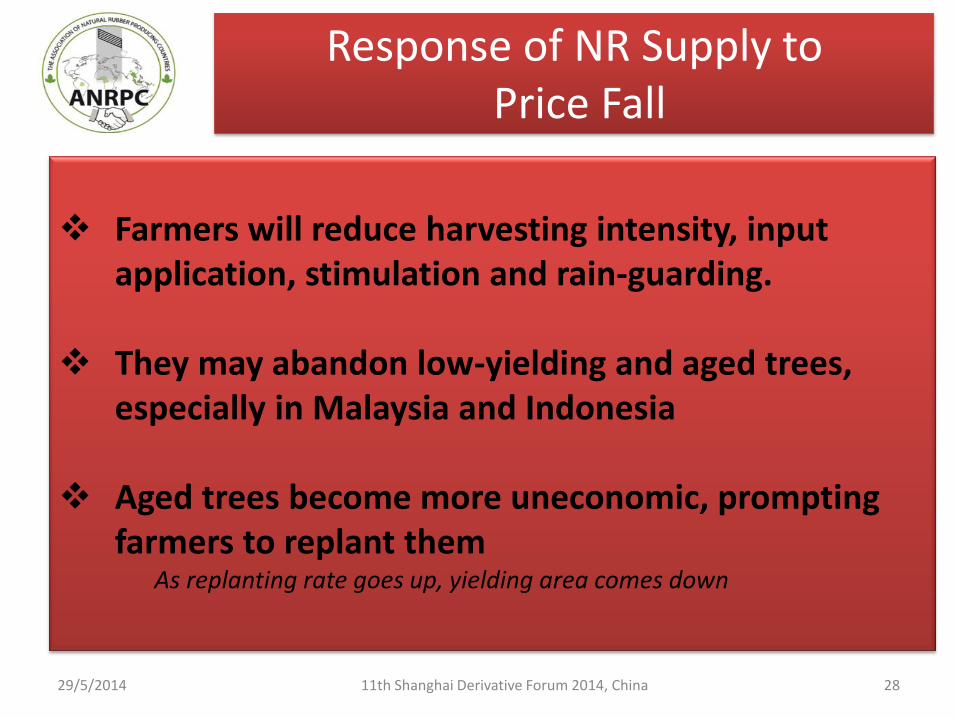
Response of NR Supply to Price Fall
29/5/2014 11th Shanghai Derivative Forum 2014, China 28
Farmers will reduce harvesting intensity, input
application, stimulation and rain-guarding.
They may abandon low-yielding and aged trees, especially in Malaysia and Indonesia
Aged trees become more uneconomic, prompting farmers to replant them
As replanting rate goes up, yielding area comes down
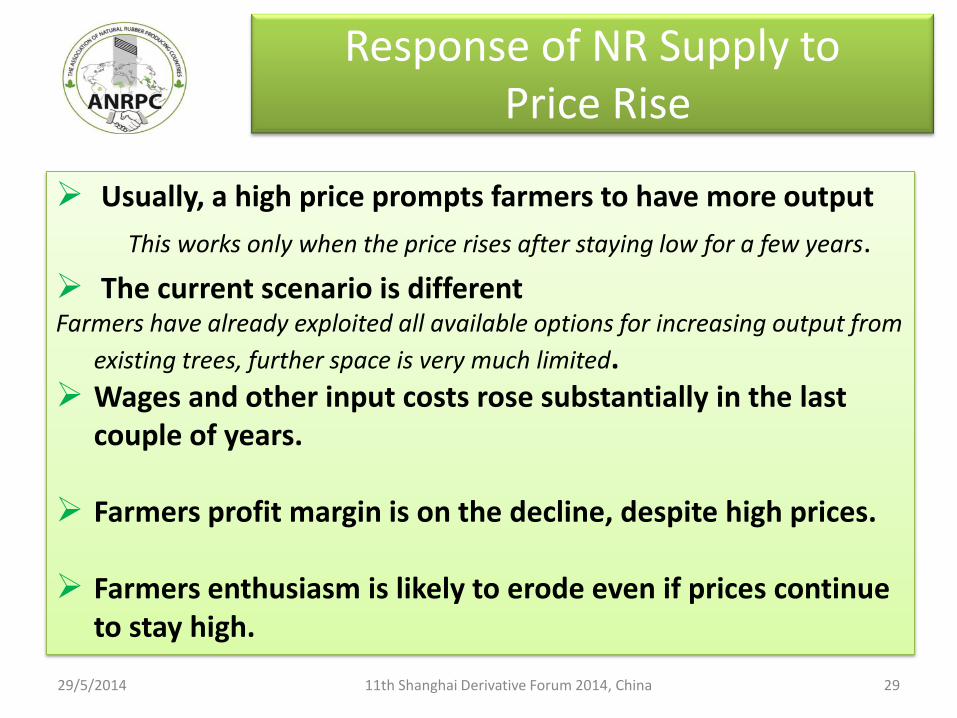
Response of NR Supply to Price Rise
29/5/2014 11th Shanghai Derivative Forum 2014, China 29
Usually, a high price prompts farmers to have more output
This works only when the price rises after staying low for a few years.
The current scenario is different Farmers have already exploited all available options for increasing output from
existing trees, further space is very much limited. Wages and other input costs rose substantially in the last
couple of years. Farmers profit margin is on the decline, despite high prices.
Farmers enthusiasm is likely to erode even if prices continue
to stay high.
29/5/2014 11th Shanghai Derivative Forum 2014, China 30
Outlooks of Future Demand of NR

29/5/2014 11th Shanghai Derivative Forum 2014, China 31
Outlook of Global GDP Growth
2012 2014 2016 2018
World Output 2.6 3.0 3.8 3.8
NAFTA Economies 2.7 2.4 3.4 2.8
Western Europe -0.3 1.5 1.8 1.7
European Union -0.3 1.5 2.0 1.9
Euro Zone -0.6 1.1 1.7 1.6
Central Europe & Balkan 1.2 2.8 2.6 2.3
Commwlth of Ind. States 3.4 1.4 3.5 3.7
Japan 1.4 1.4 0.9 1.3
China 7.7 7.5 7.4 7.6
India 4.7 5.3 6.5 7.4
South Korea 2.3 3.3 3.6 3.4
Latin America n Caribbean 2.4 2.1 3.6 4.0
Middle East 2.8 3.6 4.5 4.5
Source – IHS Economics April 2014

29/5/2014 11th Shanghai Derivative Forum 2014, China 32
Use of Natural Rubber in Tyres
Approx. 70 % NR global supply use for tyres
Tyres - OEM ( 30%) ,REM ( 70%)
Global Market 20% annual growth in value for 2008 - 2011 (ERJ)
Passenger Cars - Ratio of SR:NR varies
Light & Heavy Vehicles - High NR
Aviation - Higher NR
29/5/2014 11th Shanghai Derivative Forum 2014, China 33
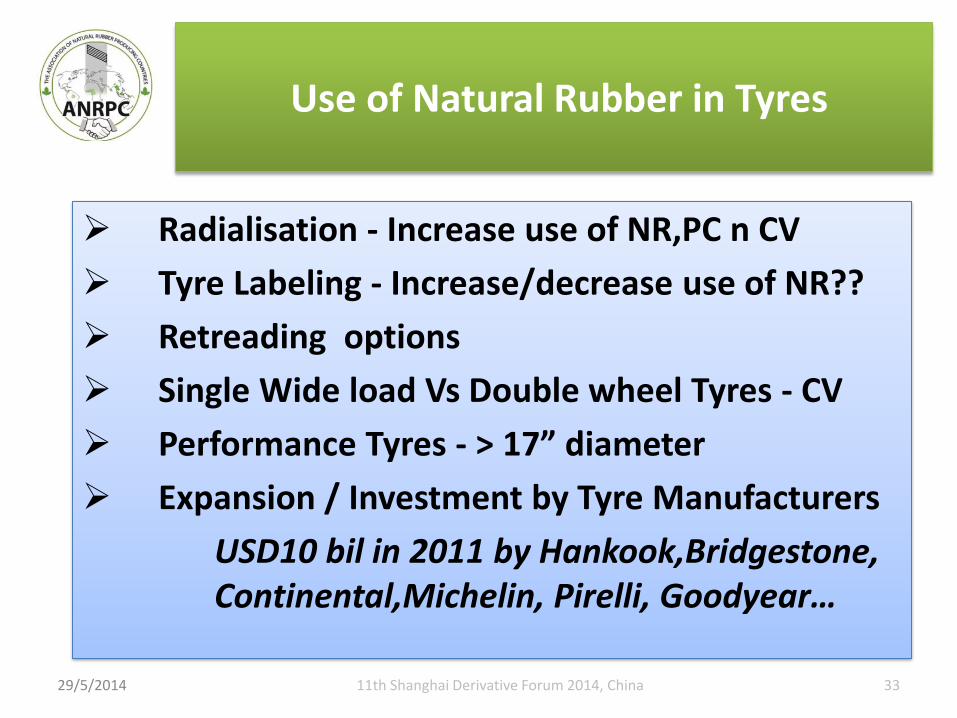
Use of Natural Rubber in Tyres
Radialisation - Increase use of NR,PC n CV
Tyre Labeling - Increase/decrease use of NR??
Retreading options
Single Wide load Vs Double wheel Tyres - CV
Performance Tyres - > 17” diameter
Expansion / Investment by Tyre Manufacturers
USD10 bil in 2011 by Hankook,Bridgestone, Continental,Michelin, Pirelli, Goodyear…
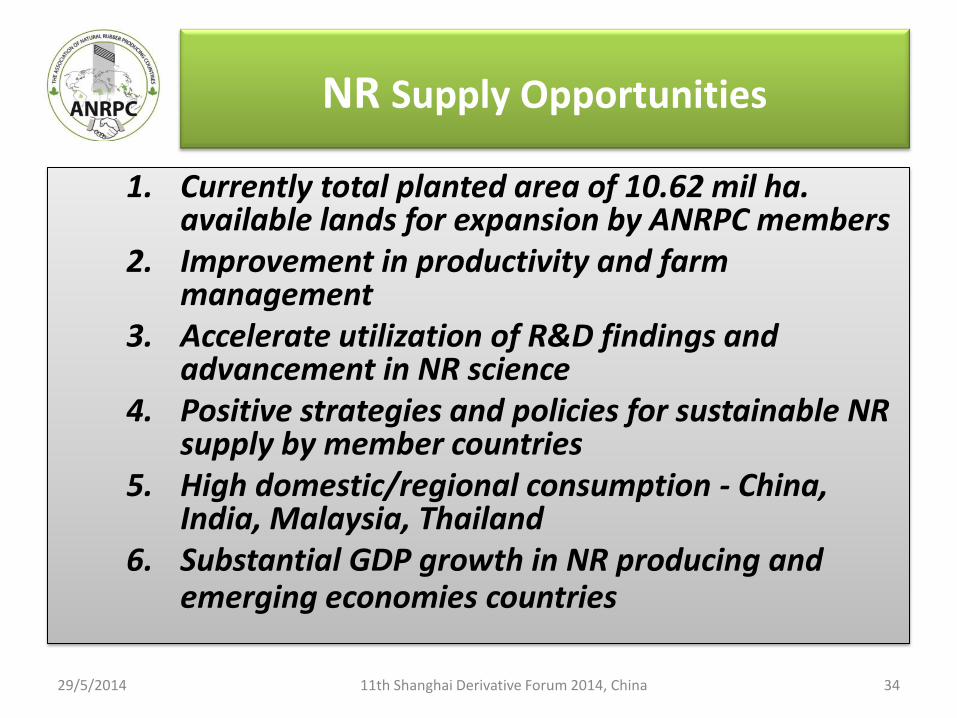
NR Supply Opportunities
1. Currently total planted area of 10.62 mil ha.
available lands for expansion by ANRPC members 2. Improvement in productivity and farm
management 3. Accelerate utilization of R&D findings and
advancement in NR science 4. Positive strategies and policies for sustainable NR
supply by member countries 5. High domestic/regional consumption - China,
India, Malaysia, Thailand 6. Substantial GDP growth in NR producing and
emerging economies countries
29/5/2014 34 11th Shanghai Derivative Forum 2014, China

Conclusions
• The NR demand growth in tandem with global GDP growth. Positive for world GDP of 3.0 % in 2014 to 3.8 % in 2018 growth.
• Consumption of NR in ANRPC has shown to
grow from 43% in 2005 to 63% in 2013 of total Global NR Consumption. Future increase in NR consumption is expected.
29/5/2014 35 11th Shanghai Derivative Forum 2014, China

Conclusions …
• Opportunities for positive supply growth of NR
are encouraging and sustainable by ANRPC’s members
• ANRPC’s members take position on balance between future global supply and demand of NR
• NR prices have shown to decrease ranging from -24 % to -26 % from January 2013 to May 2014. Not favourable to NR producing countries.
29/5/2014 36 11th Shanghai Derivative Forum 2014, China

29/5/2014 11th Shanghai Derivative Forum 2014, China 37
Thank You

Thank You!
29/5/2014 11th Shanghai Derivative Forum 2014,
China 38