global survey on internet security and trust -...
TRANSCRIPT

Global Survey on Internet Security and Trust• April 16, 2018
Methodology
Methdology, Part 1
• This survey was conducted by Ipsos on behalf of the Centre for International Governance Innovation
(CIGI), the United Nations Conference on Trade and Development (UNCTAD) and the Internet
Society (ISOC) between December 29, 2017, and March 5, 2018.
• The survey was conducted in 25 economies—Australia, Brazil, Canada, China, Egypt, France,
Germany, Great Britain, Hong Kong, India, Indonesia, Italy, Japan, Kenya, Mexico, Nigeria, Pakistan,
Poland, Russia, South Africa, Republic of Korea, Sweden, Tunisia, Turkey and the United States—and
involved 25,262 Internet users.
• Twenty-one of the economies utilized the Ipsos Internet panel system while Tunisia was conducted
via CATI, and Kenya, Nigeria and Pakistan utilized face-to-face interviewing, given online constraints
in these economies and the length of the poll. The inclusion of Russia is new to this year’s poll.
Methdology, Part 2
• In the US and Canada respondents were aged 18-64, and 16-64 in all other economies.
• For 2018, the economies of Russia and South Africa have been added to the BRICS definition,
which previously only included Brazil, India, and China (BIC). For analytic purposes, the BRICS data
is tracked against the BIC data from previous surveys, though the comparison is not direct.
• Approximately 1,000+ individuals were surveyed in each economy and are weighted to match the
population in each economy surveyed. The precision of Ipsos online polls is calculated using a
credibility interval. In this case, a poll of 1,000 is accurate to +/- 3.5 percentage points. For those
surveys conducted by CATI and face-to-face, the margin of error is +/-3.1, 19 times out of 20.
BRICS = Brazil, Russia, India, China, South AfricaAPAC = Asia Pacific
LATAM = Latin America
Privacy and Security
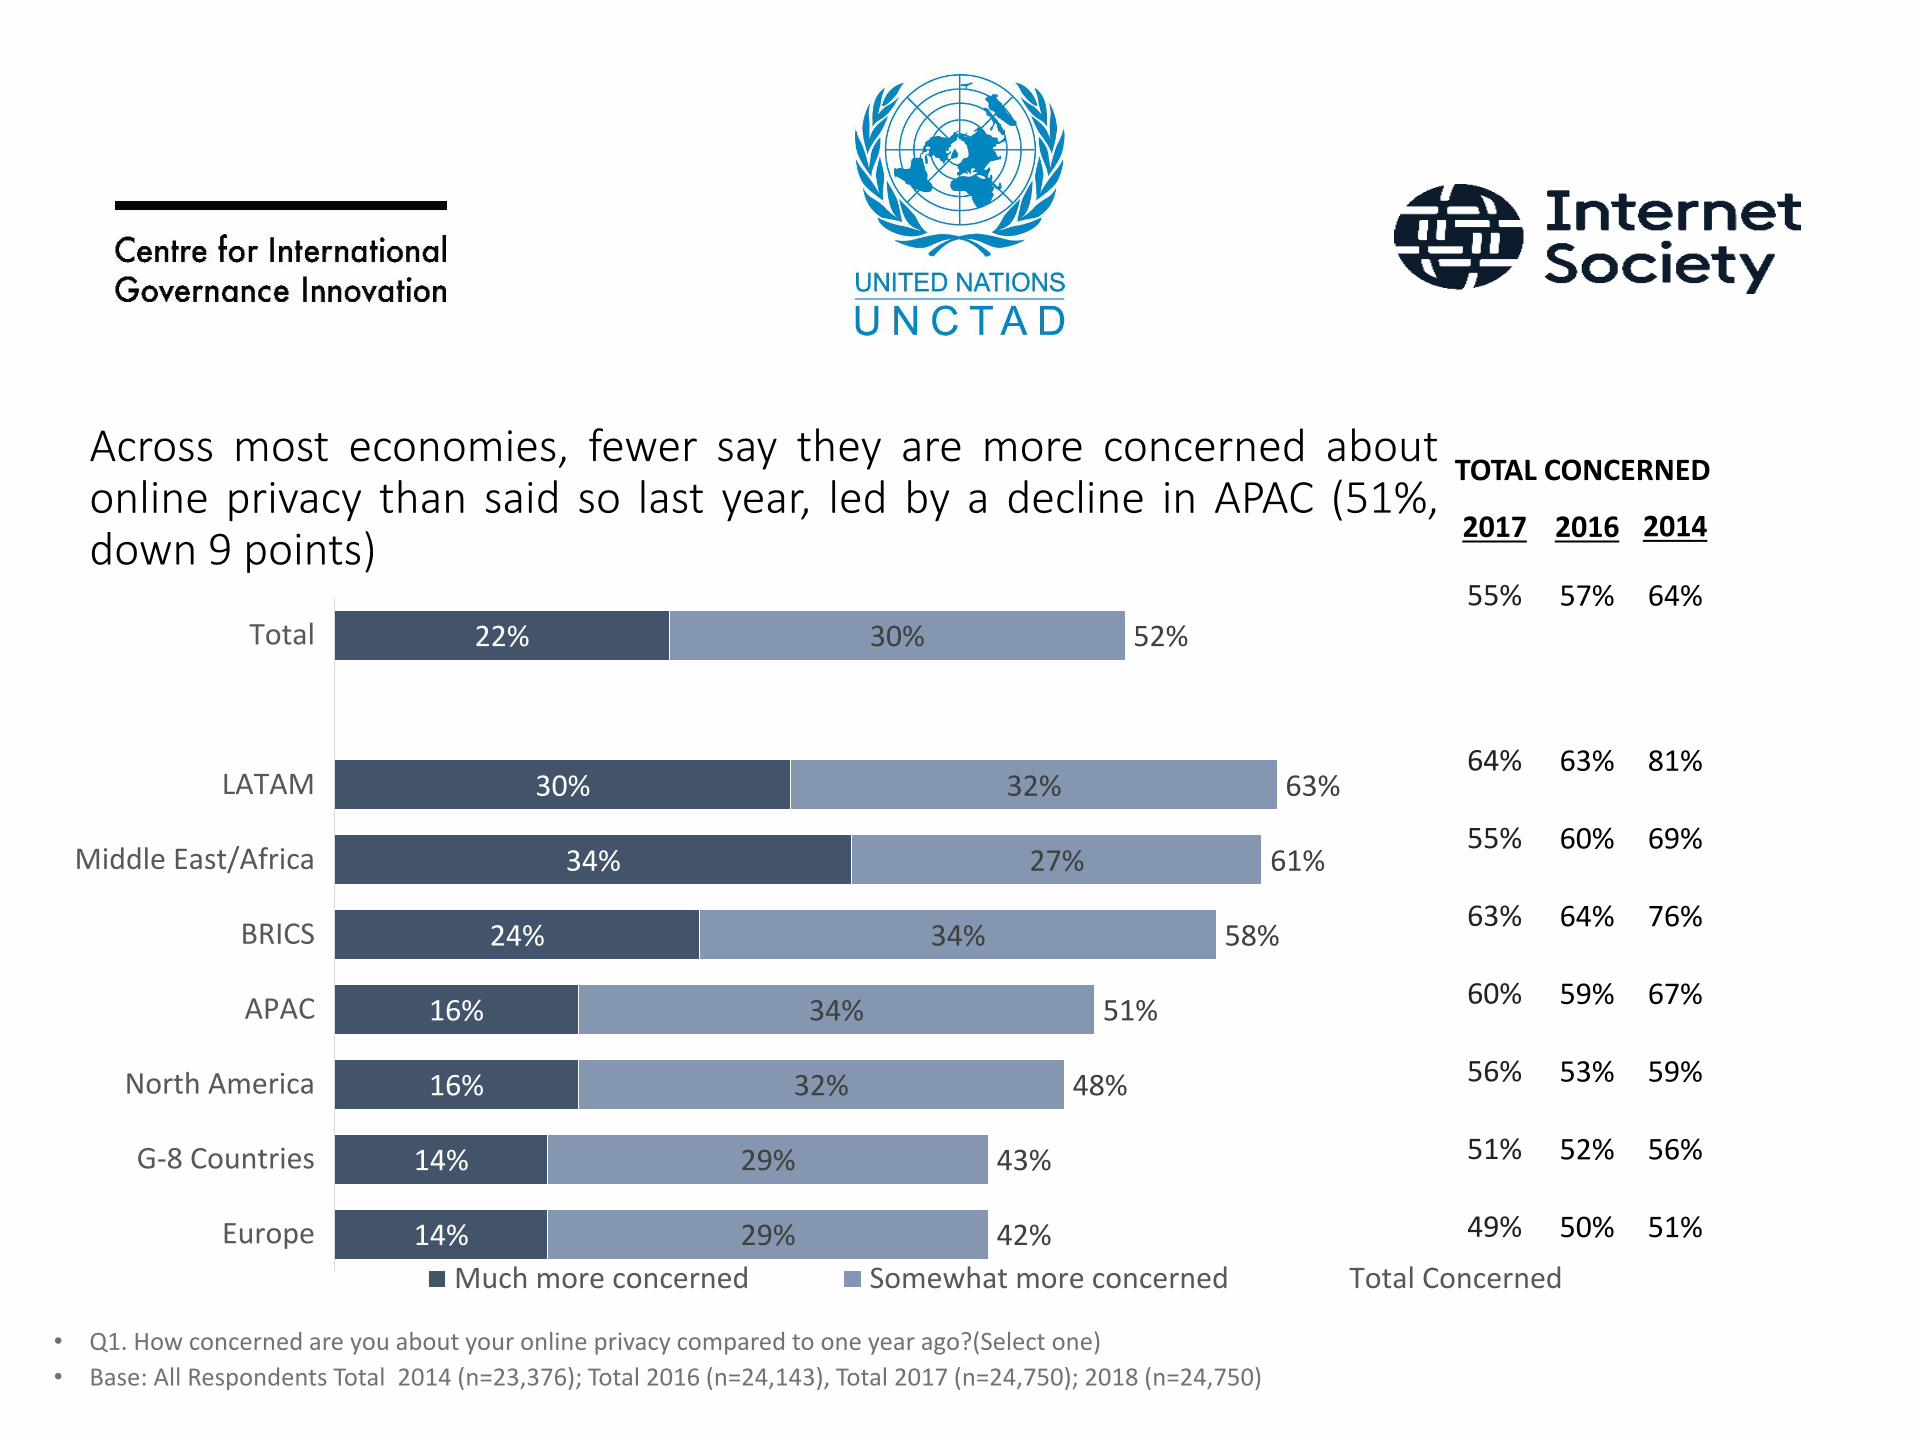
• Q1. How concerned are you about your online privacy compared to one year ago?(Select one)
• Base: All Respondents Total 2014 (n=23,376); Total 2016 (n=24,143), Total 2017 (n=24,750); 2018 (n=24,750)
Across most economies, fewer say they are more concerned aboutonline privacy than said so last year, led by a decline in APAC (51%,down 9 points)
22%
30%
34%
24%
16%
16%
14%
14%
30%
32%
27%
34%
34%
32%
29%
29%
52%
63%
61%
58%
51%
48%
43%
42%
Total
LATAM
Middle East/Africa
BRICS
APAC
North America
G-8 Countries
Europe
Much more concerned Somewhat more concerned Total Concerned
TOTAL CONCERNED
2017 2016 2014
55% 57% 64%
64% 63% 81%
55% 60% 69%
63% 64% 76%
60% 59% 67%
56% 53% 59%
51% 52% 56%
49% 50% 51%
Global Total
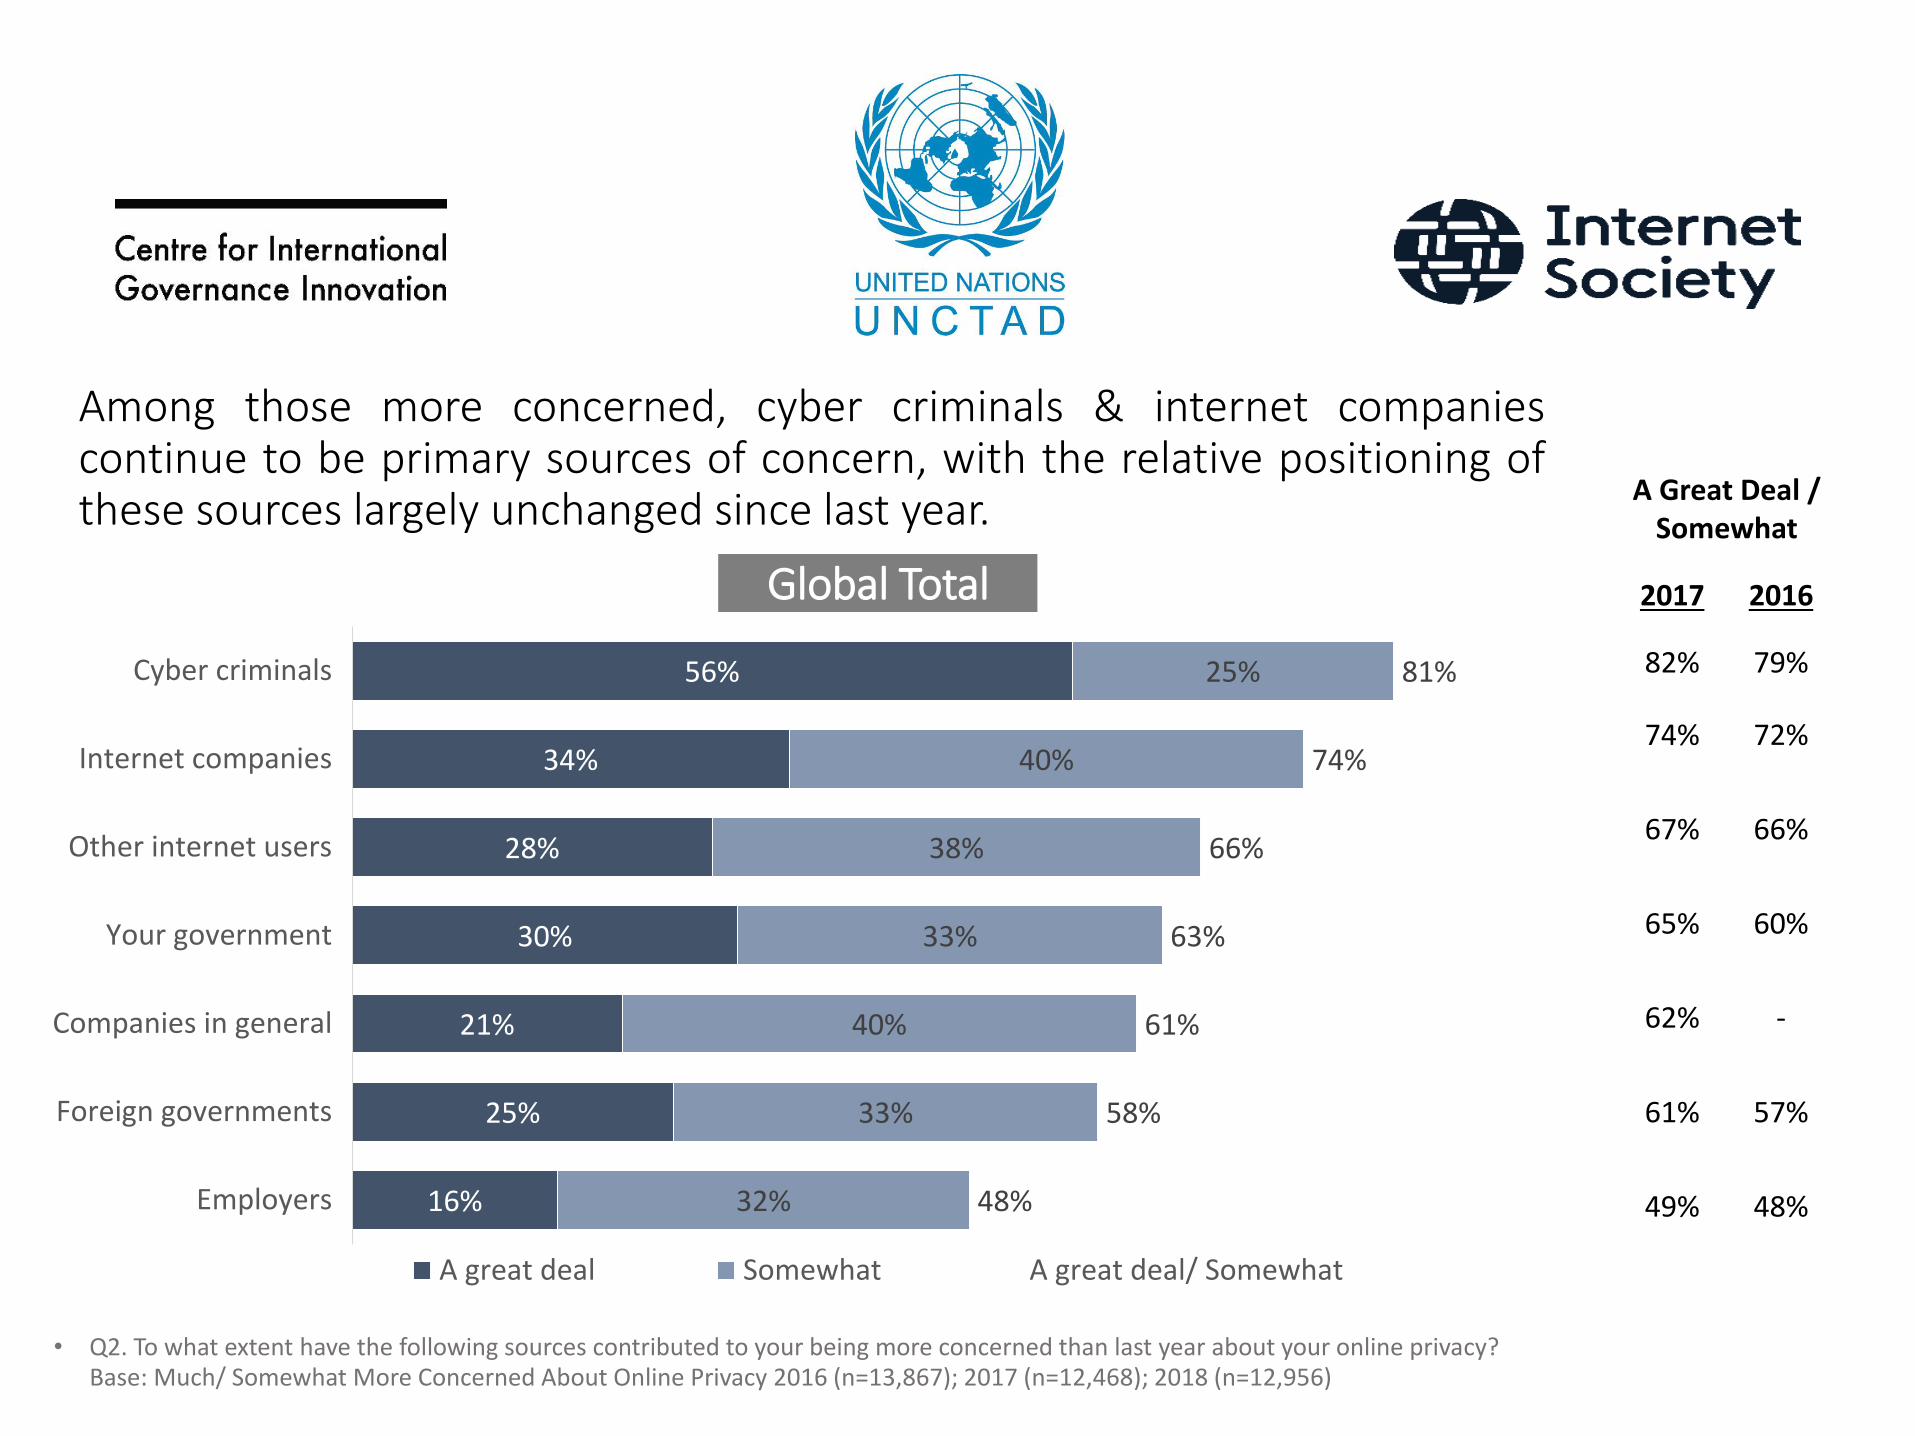
• Q2. To what extent have the following sources contributed to your being more concerned than last year about your online privacy?Base: Much/ Somewhat More Concerned About Online Privacy 2016 (n=13,867); 2017 (n=12,468); 2018 (n=12,956)
Among those more concerned, cyber criminals & internet companiescontinue to be primary sources of concern, with the relative positioning ofthese sources largely unchanged since last year.
56%
34%
28%
30%
21%
25%
16%
25%
40%
38%
33%
40%
33%
32%
81%
74%
66%
63%
61%
58%
48%
Cyber criminals
Internet companies
Other internet users
Your government
Companies in general
Foreign governments
Employers
A great deal Somewhat A great deal/ Somewhat
82% 79%
74% 72%
67% 66%
65% 60%
62% -
61% 57%
49% 48%
A Great Deal / Somewhat
2017 2016
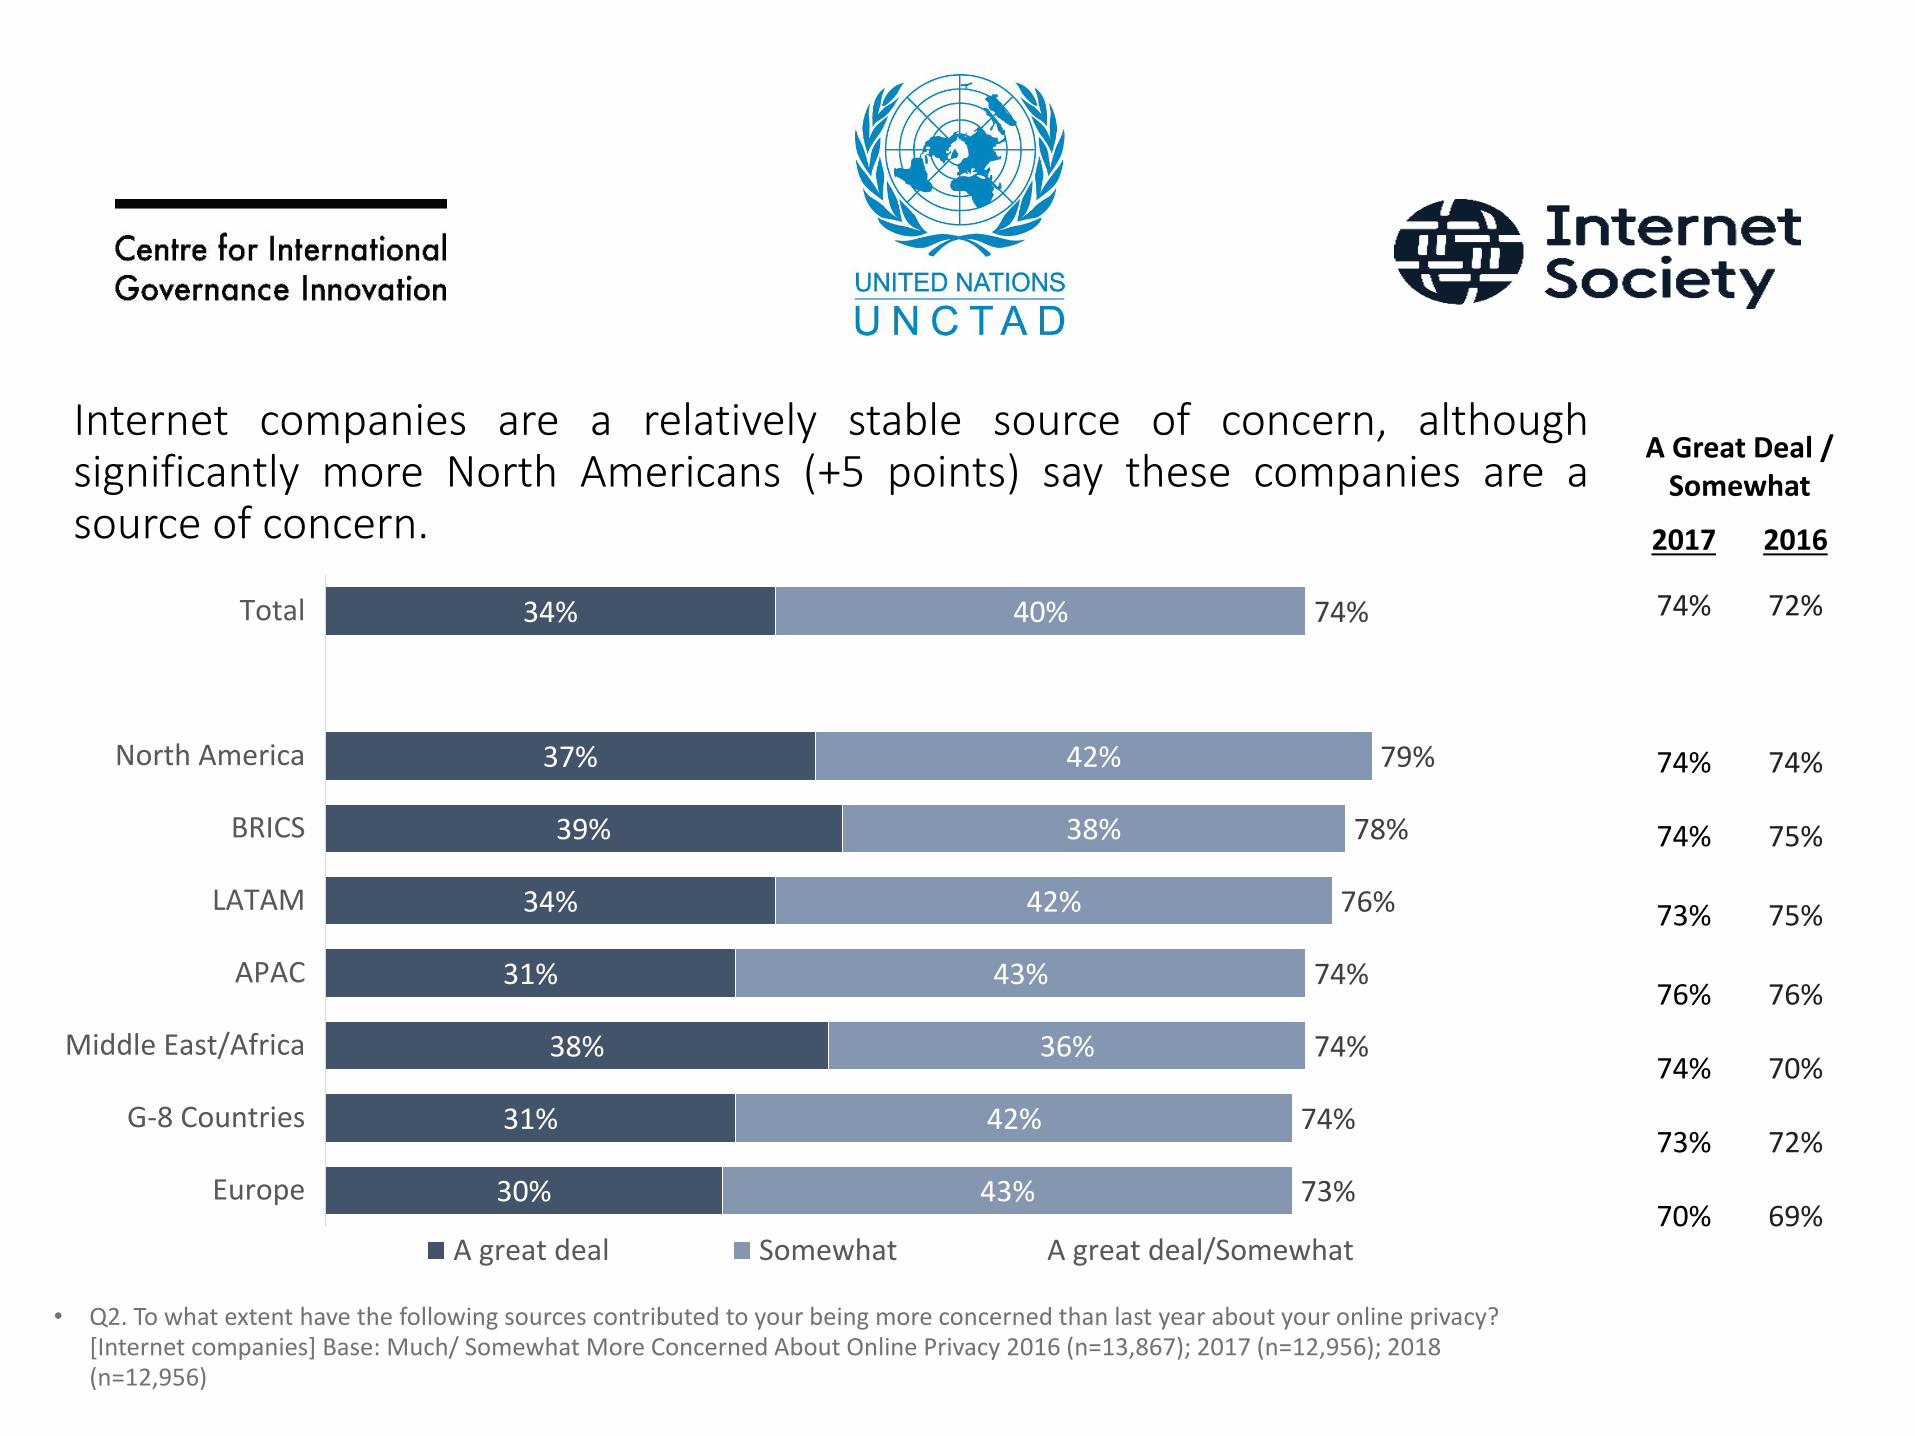
• Q2. To what extent have the following sources contributed to your being more concerned than last year about your online privacy?[Internet companies] Base: Much/ Somewhat More Concerned About Online Privacy 2016 (n=13,867); 2017 (n=12,956); 2018 (n=12,956)
Internet companies are a relatively stable source of concern, althoughsignificantly more North Americans (+5 points) say these companies are asource of concern.
34%
37%
39%
34%
31%
38%
31%
30%
40%
42%
38%
42%
43%
36%
42%
43%
74%
79%
78%
76%
74%
74%
74%
73%
Total
North America
BRICS
LATAM
APAC
Middle East/Africa
G-8 Countries
Europe
A great deal Somewhat A great deal/Somewhat
A Great Deal / Somewhat
2017 2016
74% 72%
74% 74%
74% 75%
73% 75%
76% 76%
74% 70%
73% 72%
70% 69%

TotalNorth
AmericaLATAM Europe APAC
G-8 Countries
BRICSMiddle
East/Africa
Base: All Respondents n=24,750 n=2,001 n=2,001 n=6,048 n=8,072 n=8,048 n=4,049 n=5,775
Avoiding opening emails from unknown email addresses
43% 42% 48% 41% 43% 40% 44% 37%
Avoiding certain Internet sites 36% 33% 48% 33% 31% 31% 40% 38%
Using antivirus software 36% 30% 49% 32% 39% 30% 47% 32%
Changing your password regularly 31% 29% 33% 26% 32% 26% 32% 33%
Avoiding certain web applications 30% 24% 37% 25% 27% 23% 34% 31%
Cutting down on the amount of biographically accurate information you divulge online
28% 22% 34% 25% 28% 22% 29% 24%
Self-censoring what you say online 20% 24% 19% 13% 20% 16% 18% 25%
Doing fewer financial transactions online 14% 11% 17% 9% 14% 9% 17% 15%
Changing who you communicate with 13% 12% 13% 8% 11% 8% 13% 15%
Making fewer on-line purchases 12% 11% 13% 9% 11% 9% 13% 13%
Closing Facebook and other social media accounts, etc.
10% 11% 9% 7% 9% 8% 11% 10%
Using the Internet less often 7% 6% 7% 4% 5% 4% 7% 11%
None of these 20% 28% 10% 26% 20% 30% 12% 18%• Q3. How have you changed anything about how you behave online compared to one year ago? (Please select all that apply.)
• Base: All Respondents Total 2018 (n=24,750)
Latin American Economies tend to avoid certain web applications most, while NorthAmericans and the Middle East and North African economies tend to be most likely to self-censor what they say online

• Q5. Compared to one year ago, would you say that it is easier or harder to do the following things on the internet: Base: All Respondents Total 2018 (n=24,235)
More say it is getting easier (43%), not harder (9%), tobuy goods and services online. However, fewer say it’sgetting easier to surf the internet with the knowledgethat content is not being censored. Global Total
43%
42%
40%
38%
36%
33%
32%
29%
28%
26%
24%
24%
47%
49%
51%
52%
56%
57%
54%
59%
58%
60%
63%
56%
9%
9%
9%
10%
8%
10%
13%
11%
14%
13%
13%
19%
Buying goods and services online
Find the content you seek
Access websites in a quick manner
Keep software up to date
Access local content and web sites
Rely on your favorite website to be online and working
Count on reliable mobile Internet service
Sending or receiving emails to or from foreign addresses
Access foreign content and web sites
Use encrypted communications
Use voice over IP (VoIP)—
Surf the internet with the knowledge that content is not being censored
Easier Same Harder
2017 Easier
2016 Easier
42% -
41% 46%
40% 45%
38% -
35% 42%
33% 39%
32% 38%
29% 35%
28% 36%
27% -
25% -
25% 29%

Trust
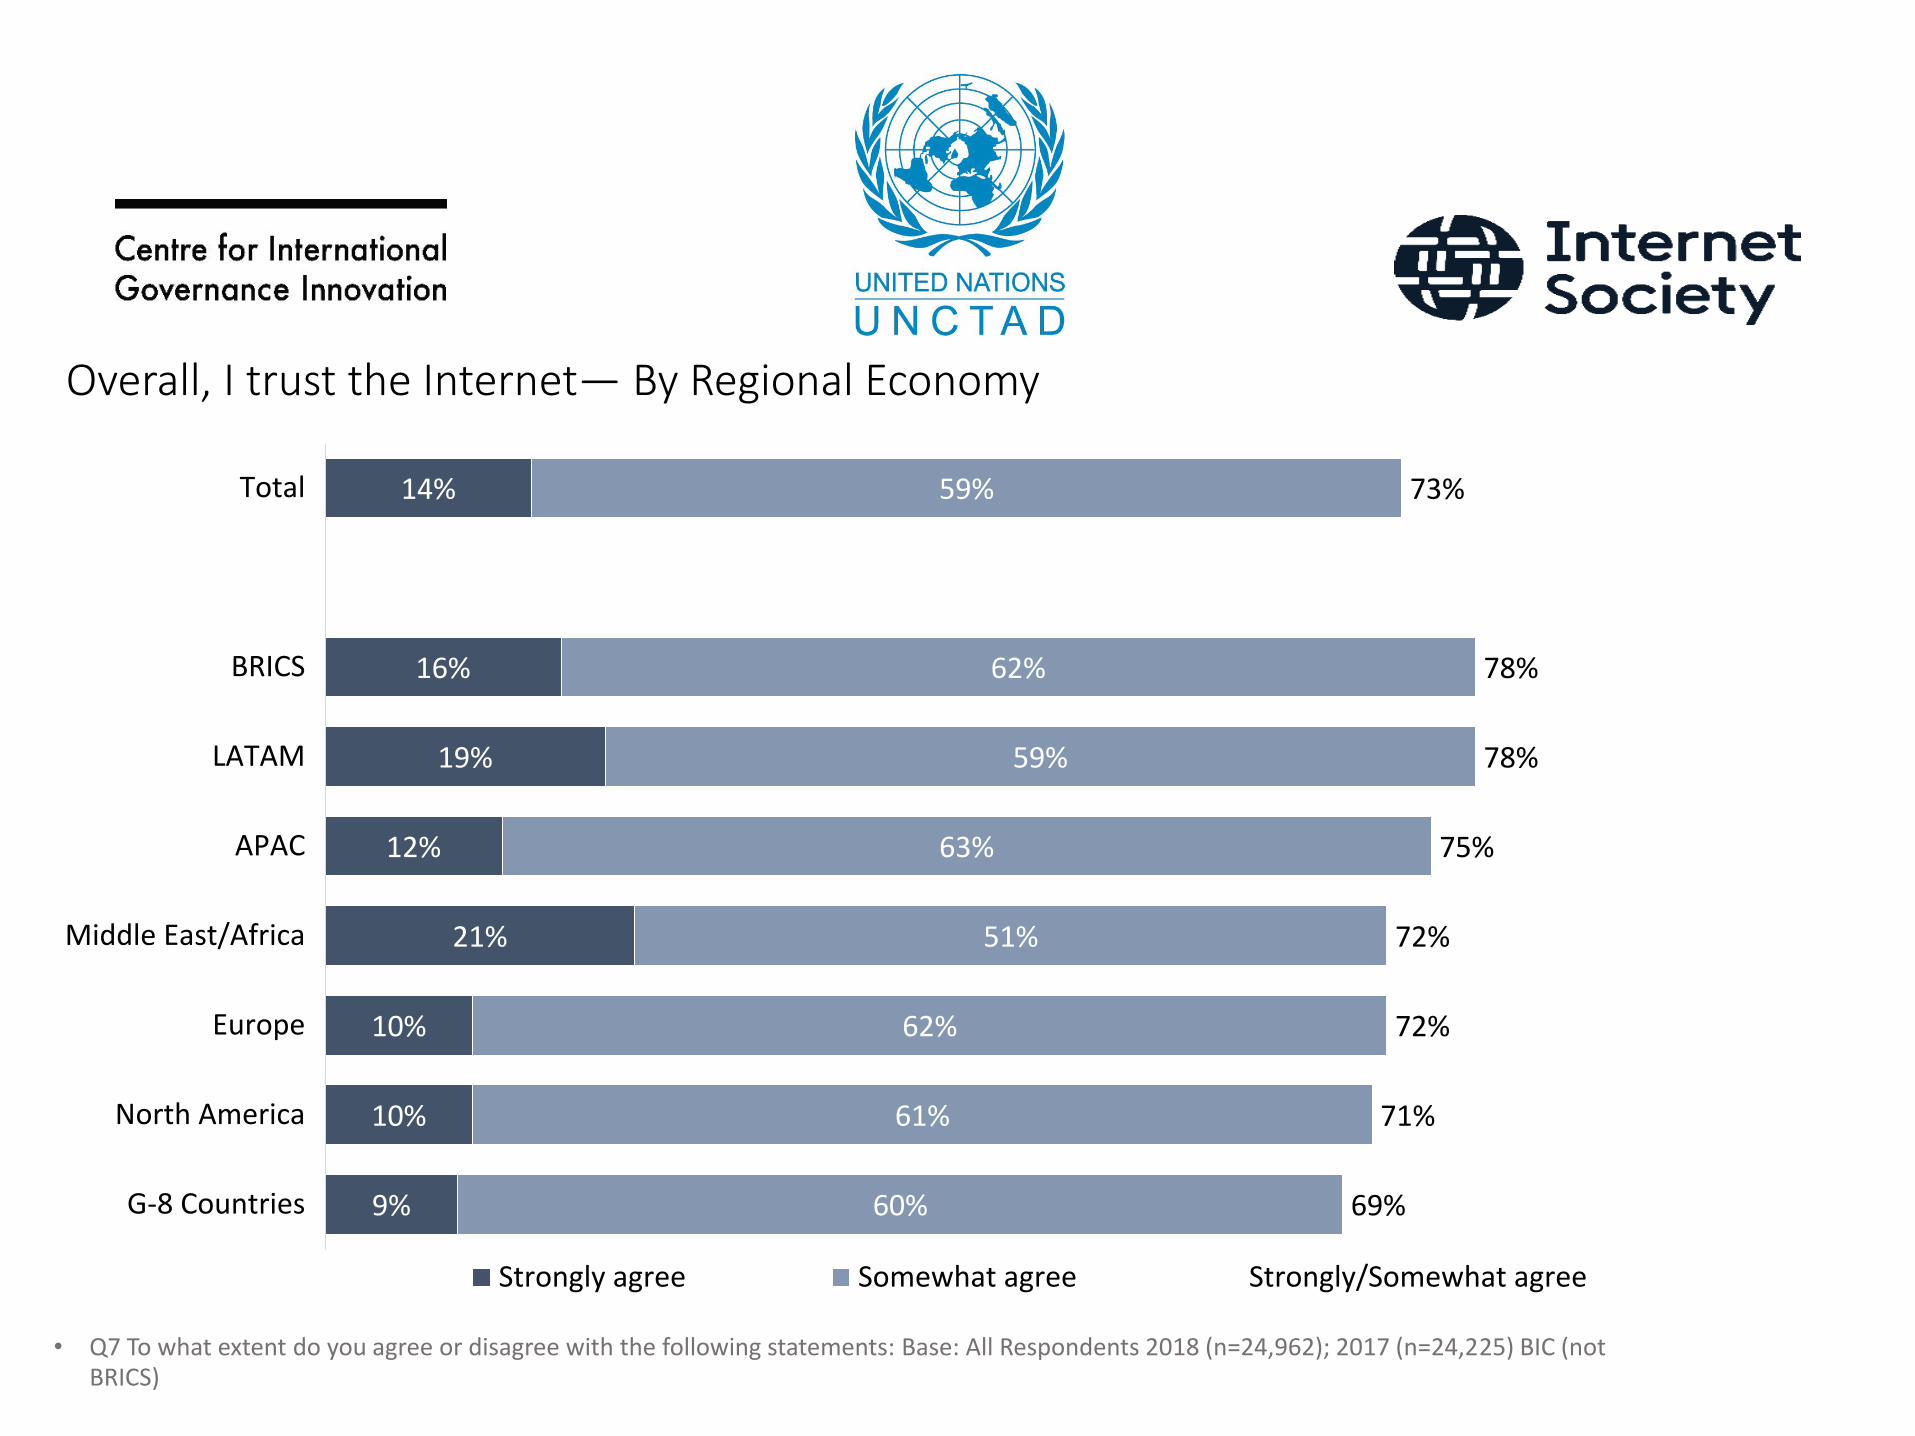
Overall, I trust the Internet— By Regional Economy
14%
16%
19%
12%
21%
10%
10%
9%
59%
62%
59%
63%
51%
62%
61%
60%
73%
78%
78%
75%
72%
72%
71%
69%
Total
BRICS
LATAM
APAC
Middle East/Africa
Europe
North America
G-8 Countries
Strongly agree Somewhat agree Strongly/Somewhat agree
• Q7 To what extent do you agree or disagree with the following statements: Base: All Respondents 2018 (n=24,962); 2017 (n=24,225) BIC (not BRICS)
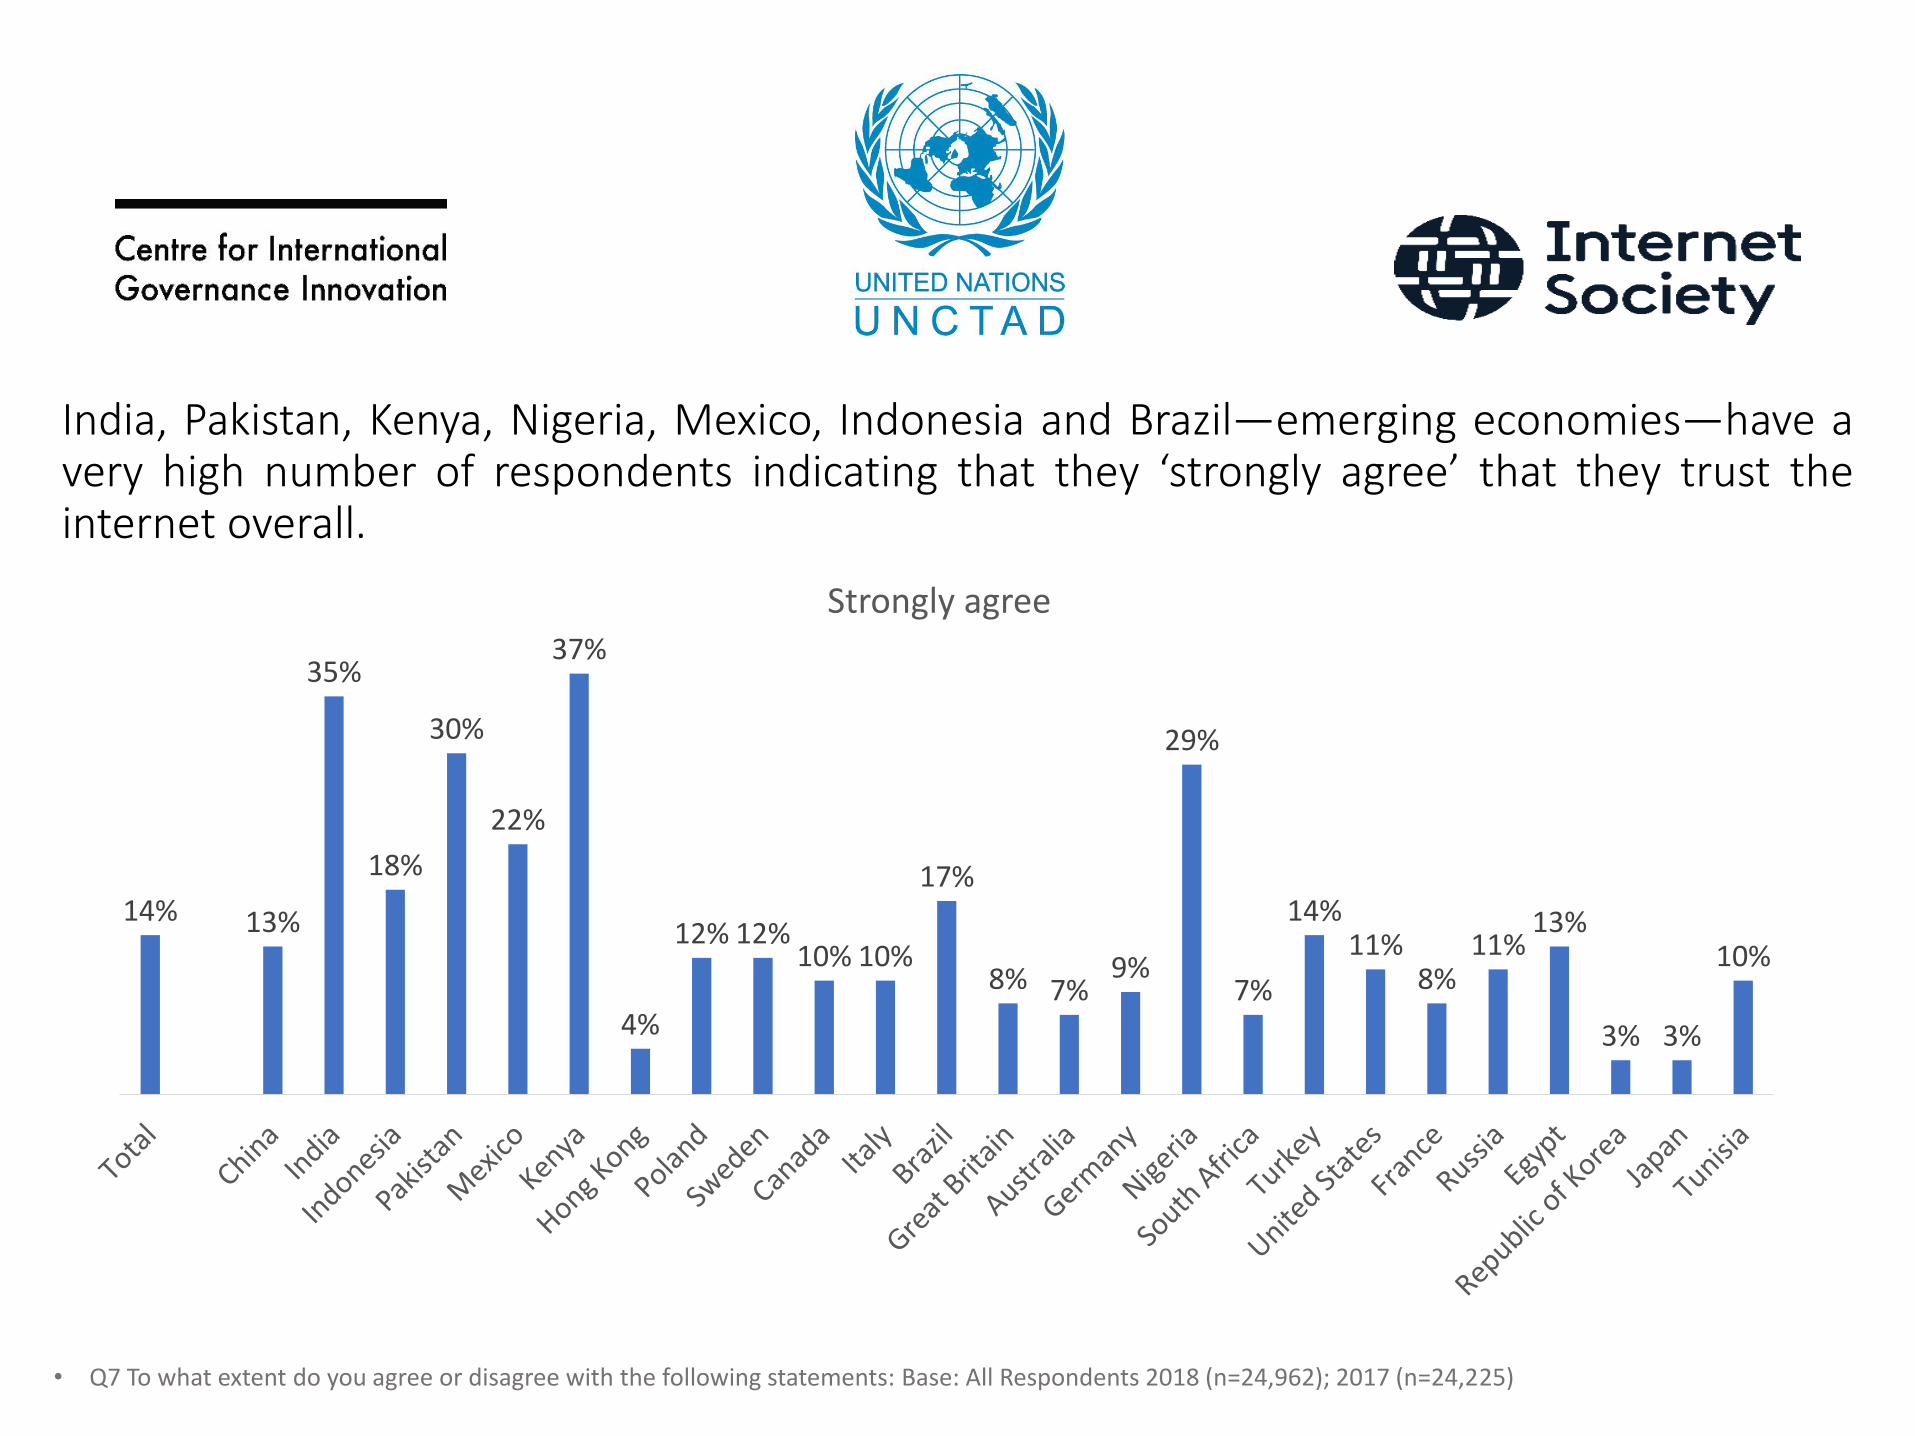
India, Pakistan, Kenya, Nigeria, Mexico, Indonesia and Brazil—emerging economies—have avery high number of respondents indicating that they ‘strongly agree’ that they trust theinternet overall.
• Q7 To what extent do you agree or disagree with the following statements: Base: All Respondents 2018 (n=24,962); 2017 (n=24,225)
14% 13%
35%
18%
30%
22%
37%
4%
12% 12%10% 10%
17%
8% 7%9%
29%
7%
14%11%
8%11%
13%
3% 3%
10%
Strongly agree

• Q8. To what extent do you agree or disagree that the following contribute to your distrust in the Internet? : Base: All Respondents who do not completely trust the internet (n=21,503)
Cybercriminals contribute the most to the distrust of the internet. However, there is a lot ofblame to go around, with a majority saying each of these entities at least somewhatcontributes to distrust.
46%
18%
18%
18%
13%
12%
13%
34%
50%
43%
43%
45%
45%
44%
80%
68%
61%
61%
58%
57%
57%
Cyber Criminals
Social Media Companies
Governments
Foreign Governments
Internet Service Providers
e-Commerce Platforms
Search Engines
Strongly Agree Somewhat Agree Strongly/Somewhat Agree

Social media companies are identified as a source of distrust the most in North America andthe Middle East and Africa, with significantly lower levels in the BRICS and Asian Pacificeconomies.
18%
22%
25%
21%
19%
19%
18%
13%
50%
51%
46%
48%
50%
48%
46%
51%
68%
73%
71%
70%
69%
66%
65%
64%
Total
North America
Middle East/Africa
LATAM
Europe
BRICS
G-8 Countries
APAC
Strongly agree Somewhat agree Strongly/Somewhat agree
• Q8. To what extent do you agree or disagree that the following contribute to your distrust in the Internet? : Base: All Respondents who do not completely trust the internet (n=21,503)
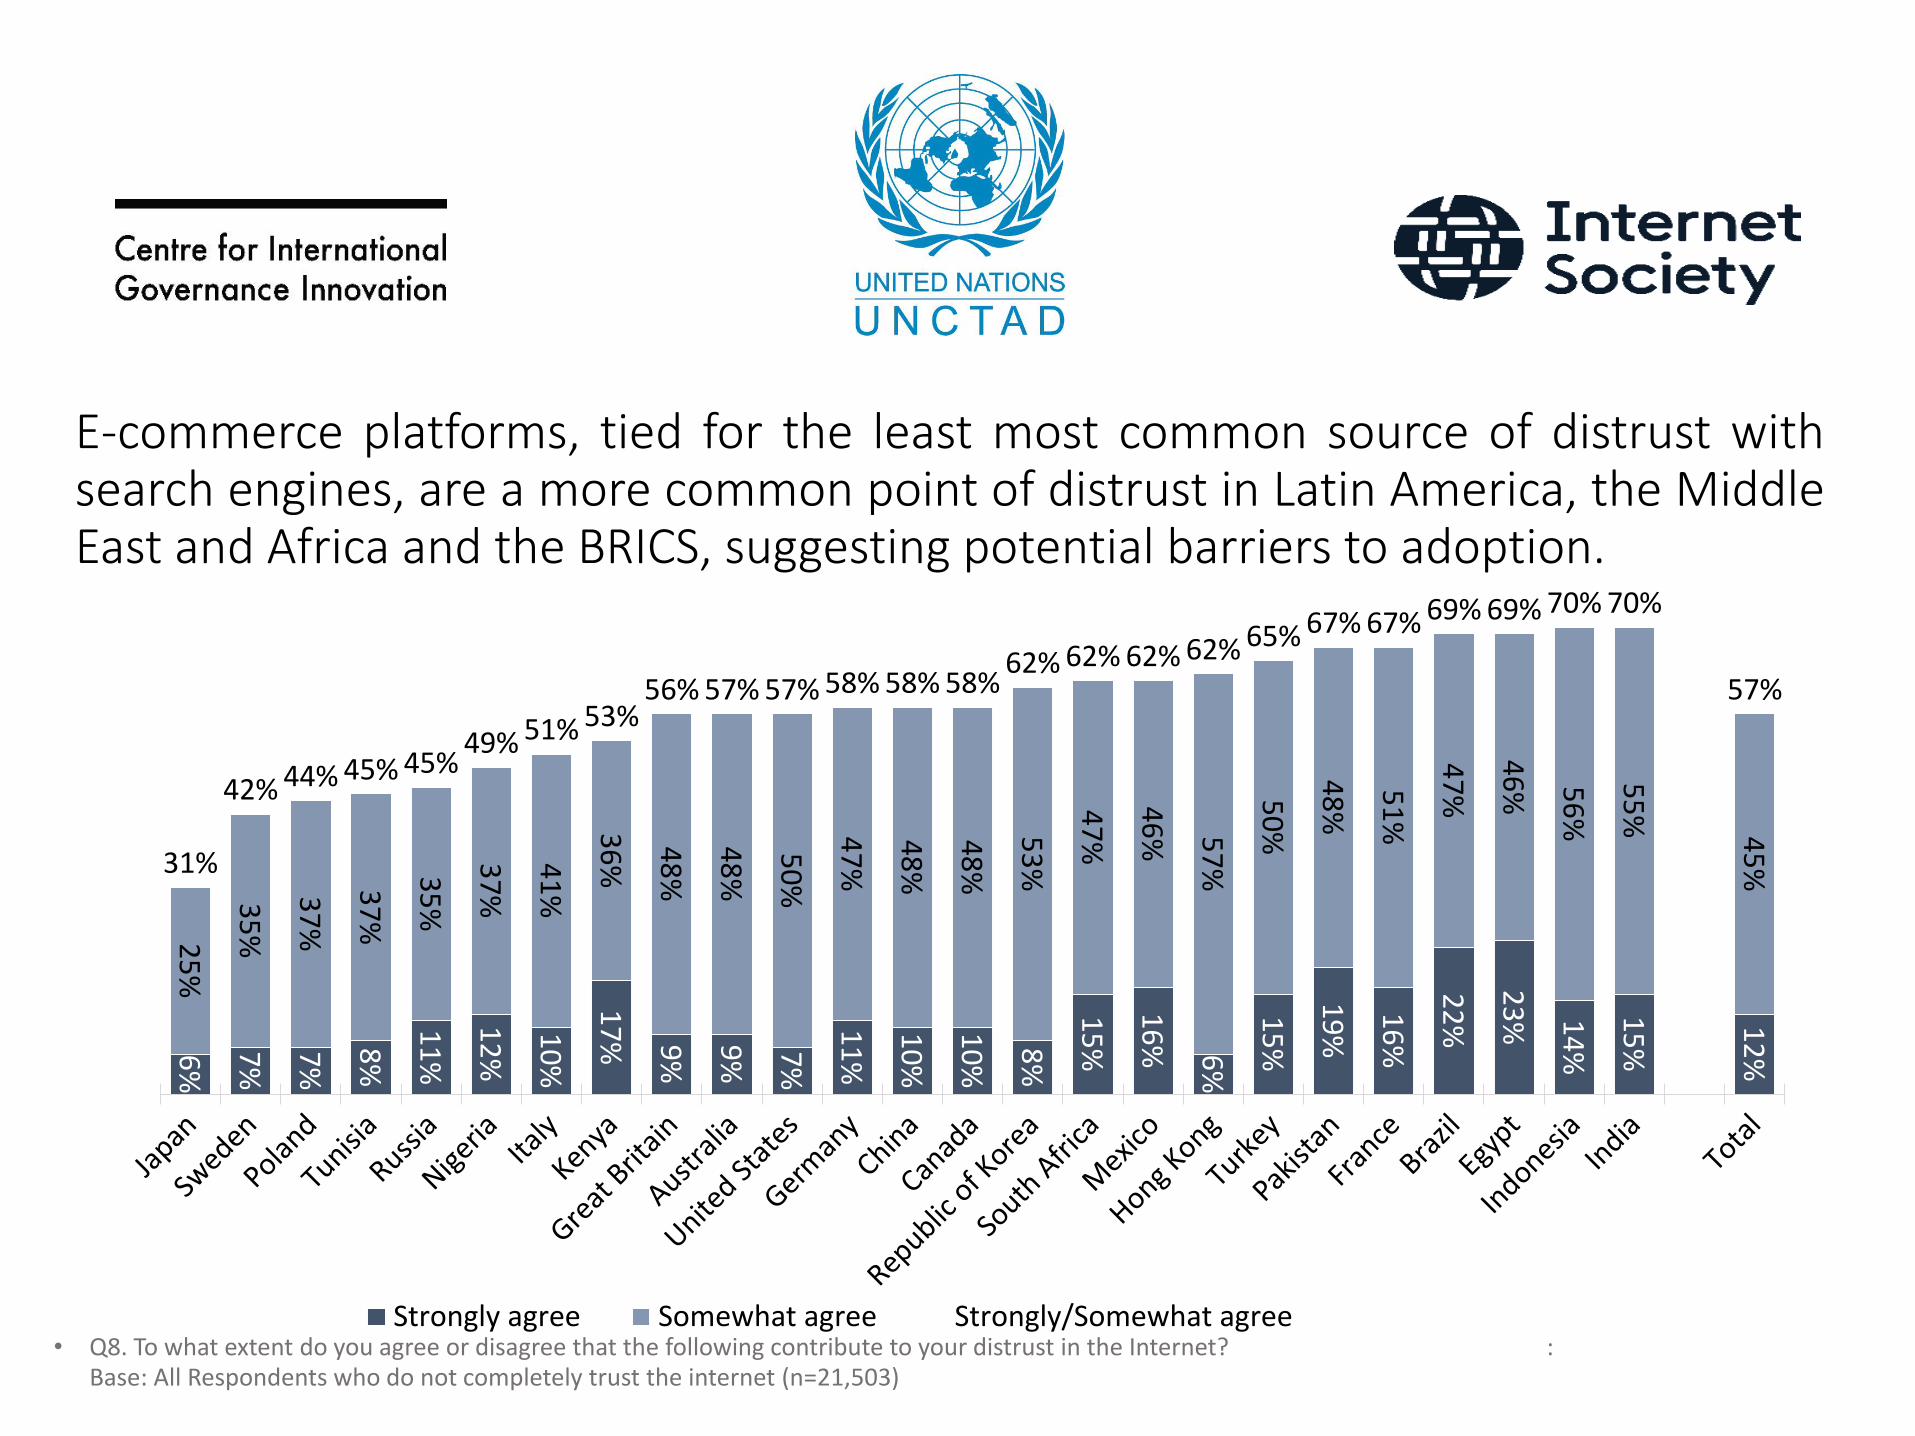
E-commerce platforms, tied for the least most common source of distrust withsearch engines, are a more common point of distrust in Latin America, the MiddleEast and Africa and the BRICS, suggesting potential barriers to adoption.
• Q8. To what extent do you agree or disagree that the following contribute to your distrust in the Internet? : Base: All Respondents who do not completely trust the internet (n=21,503)
12
%
15
%
14
%
23
%
22
%16
%
19
%
15
%6%
16
%
15
%8%
10
%
10
%
11
%7%
9%
9%
17
%10
%
12
%
11
%8%7%
7%6%
45
%
55
%
56
%
46
%
47
%51
%
48
%50
%57
%
46
%
47
%53
%
48
%
48
%
47
%50
%
48
%
48
%
36
%41
%
37
%
35
%
37
%
37
%
35
%25
%
57%
70%70%69%69%67%67%65%62%62%62%62%58%58%58%57%57%56%
53%51%49%45%45%44%42%
31%
Strongly agree Somewhat agree Strongly/Somewhat agree
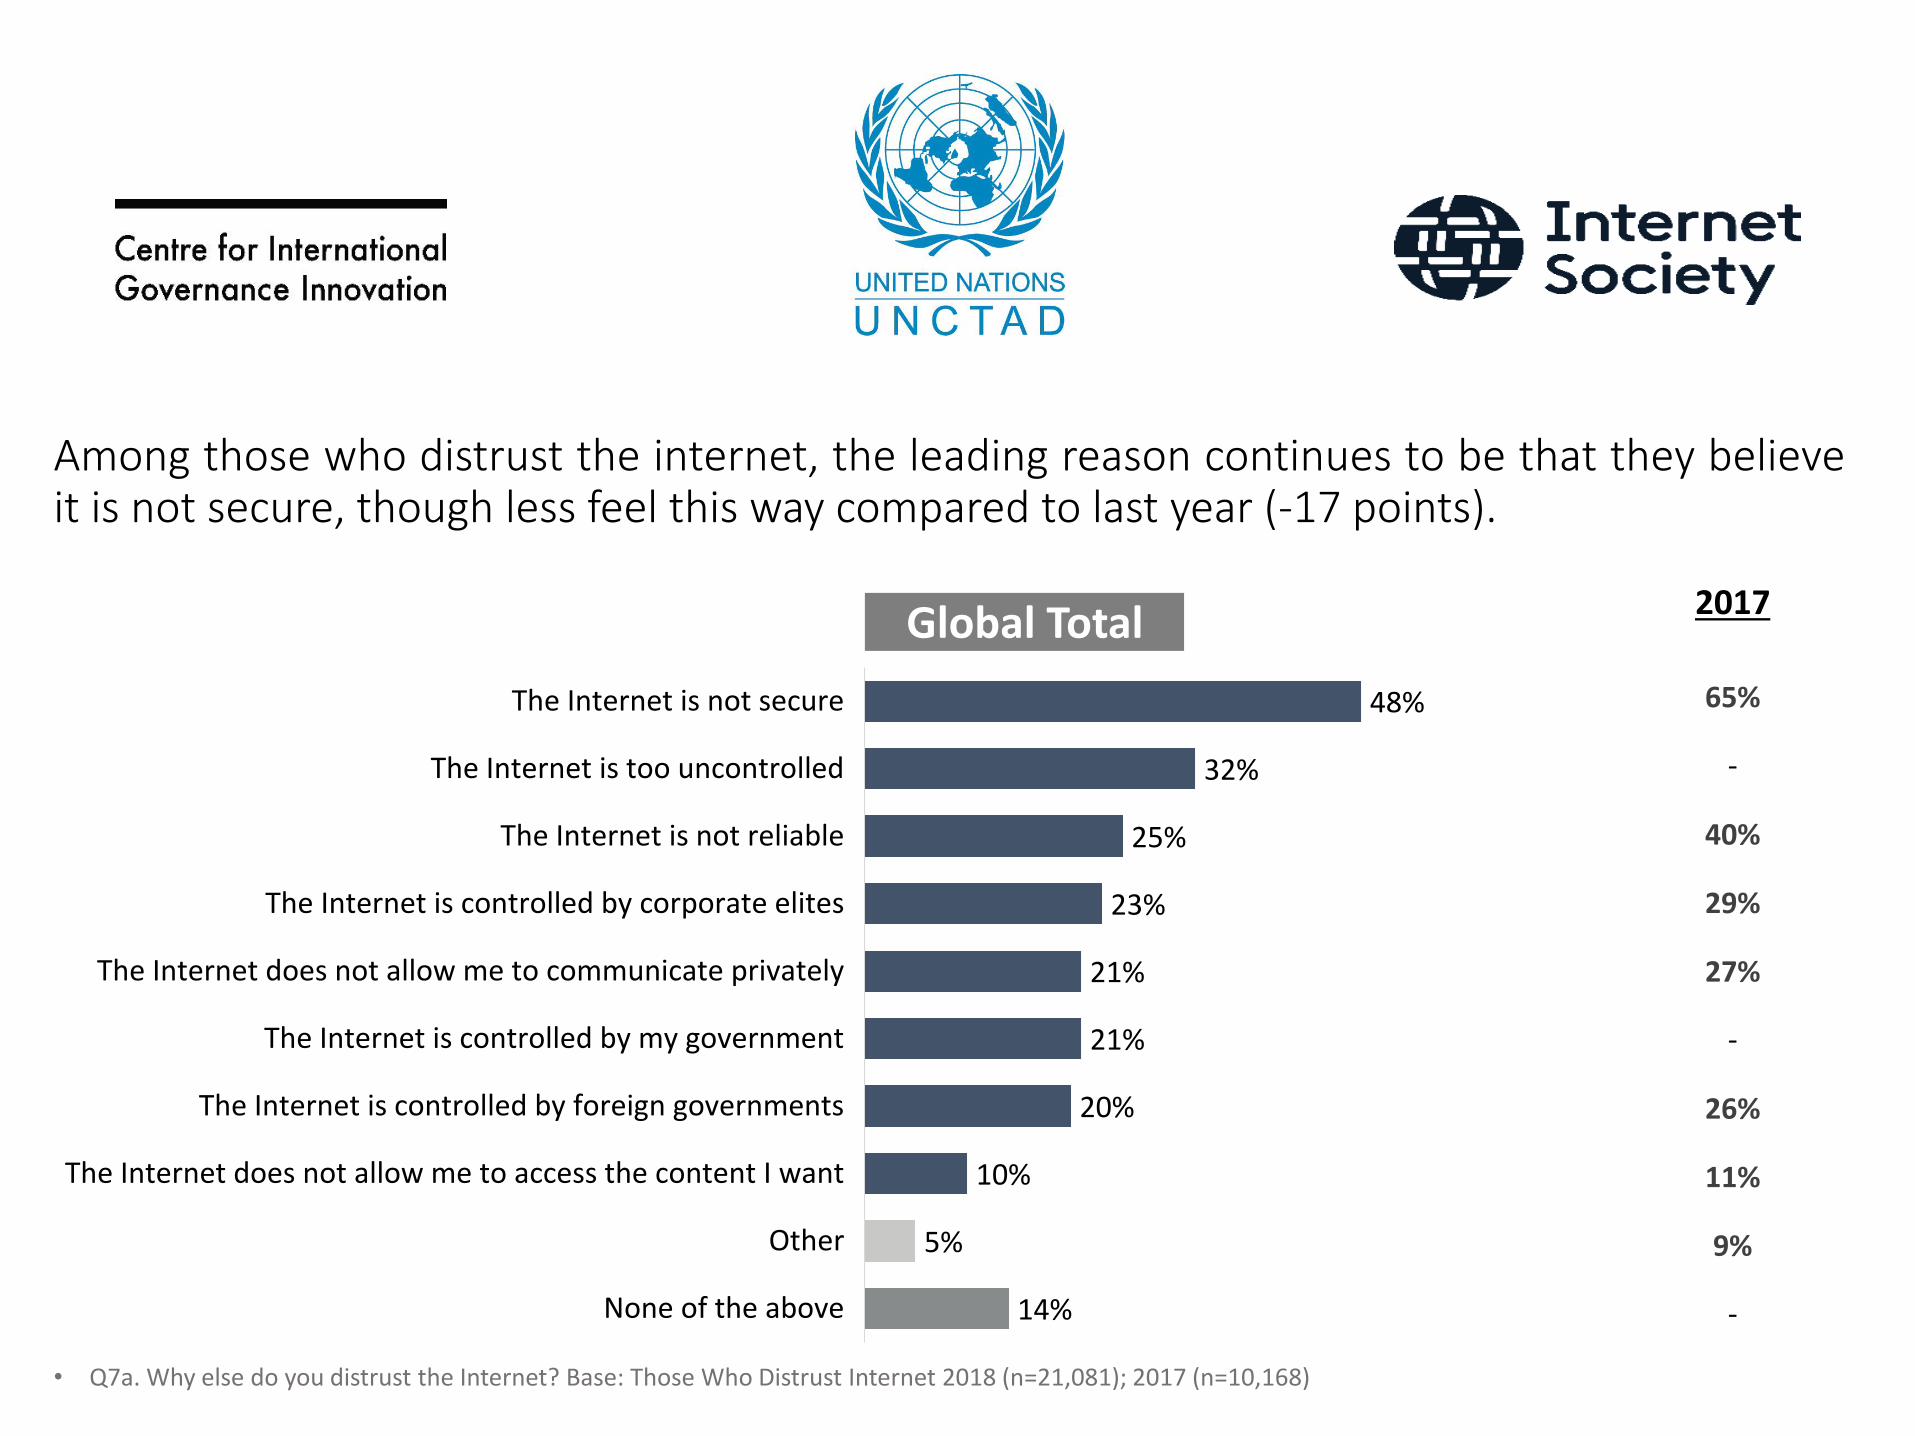
Among those who distrust the internet, the leading reason continues to be that they believeit is not secure, though less feel this way compared to last year (-17 points).
• Q7a. Why else do you distrust the Internet? Base: Those Who Distrust Internet 2018 (n=21,081); 2017 (n=10,168)
48%
32%
25%
23%
21%
21%
20%
10%
5%
14%
The Internet is not secure
The Internet is too uncontrolled
The Internet is not reliable
The Internet is controlled by corporate elites
The Internet does not allow me to communicate privately
The Internet is controlled by my government
The Internet is controlled by foreign governments
The Internet does not allow me to access the content I want
Other
None of the above
Global Total
65%
-
40%
29%
27%
-
26%
11%
9%
-
2017
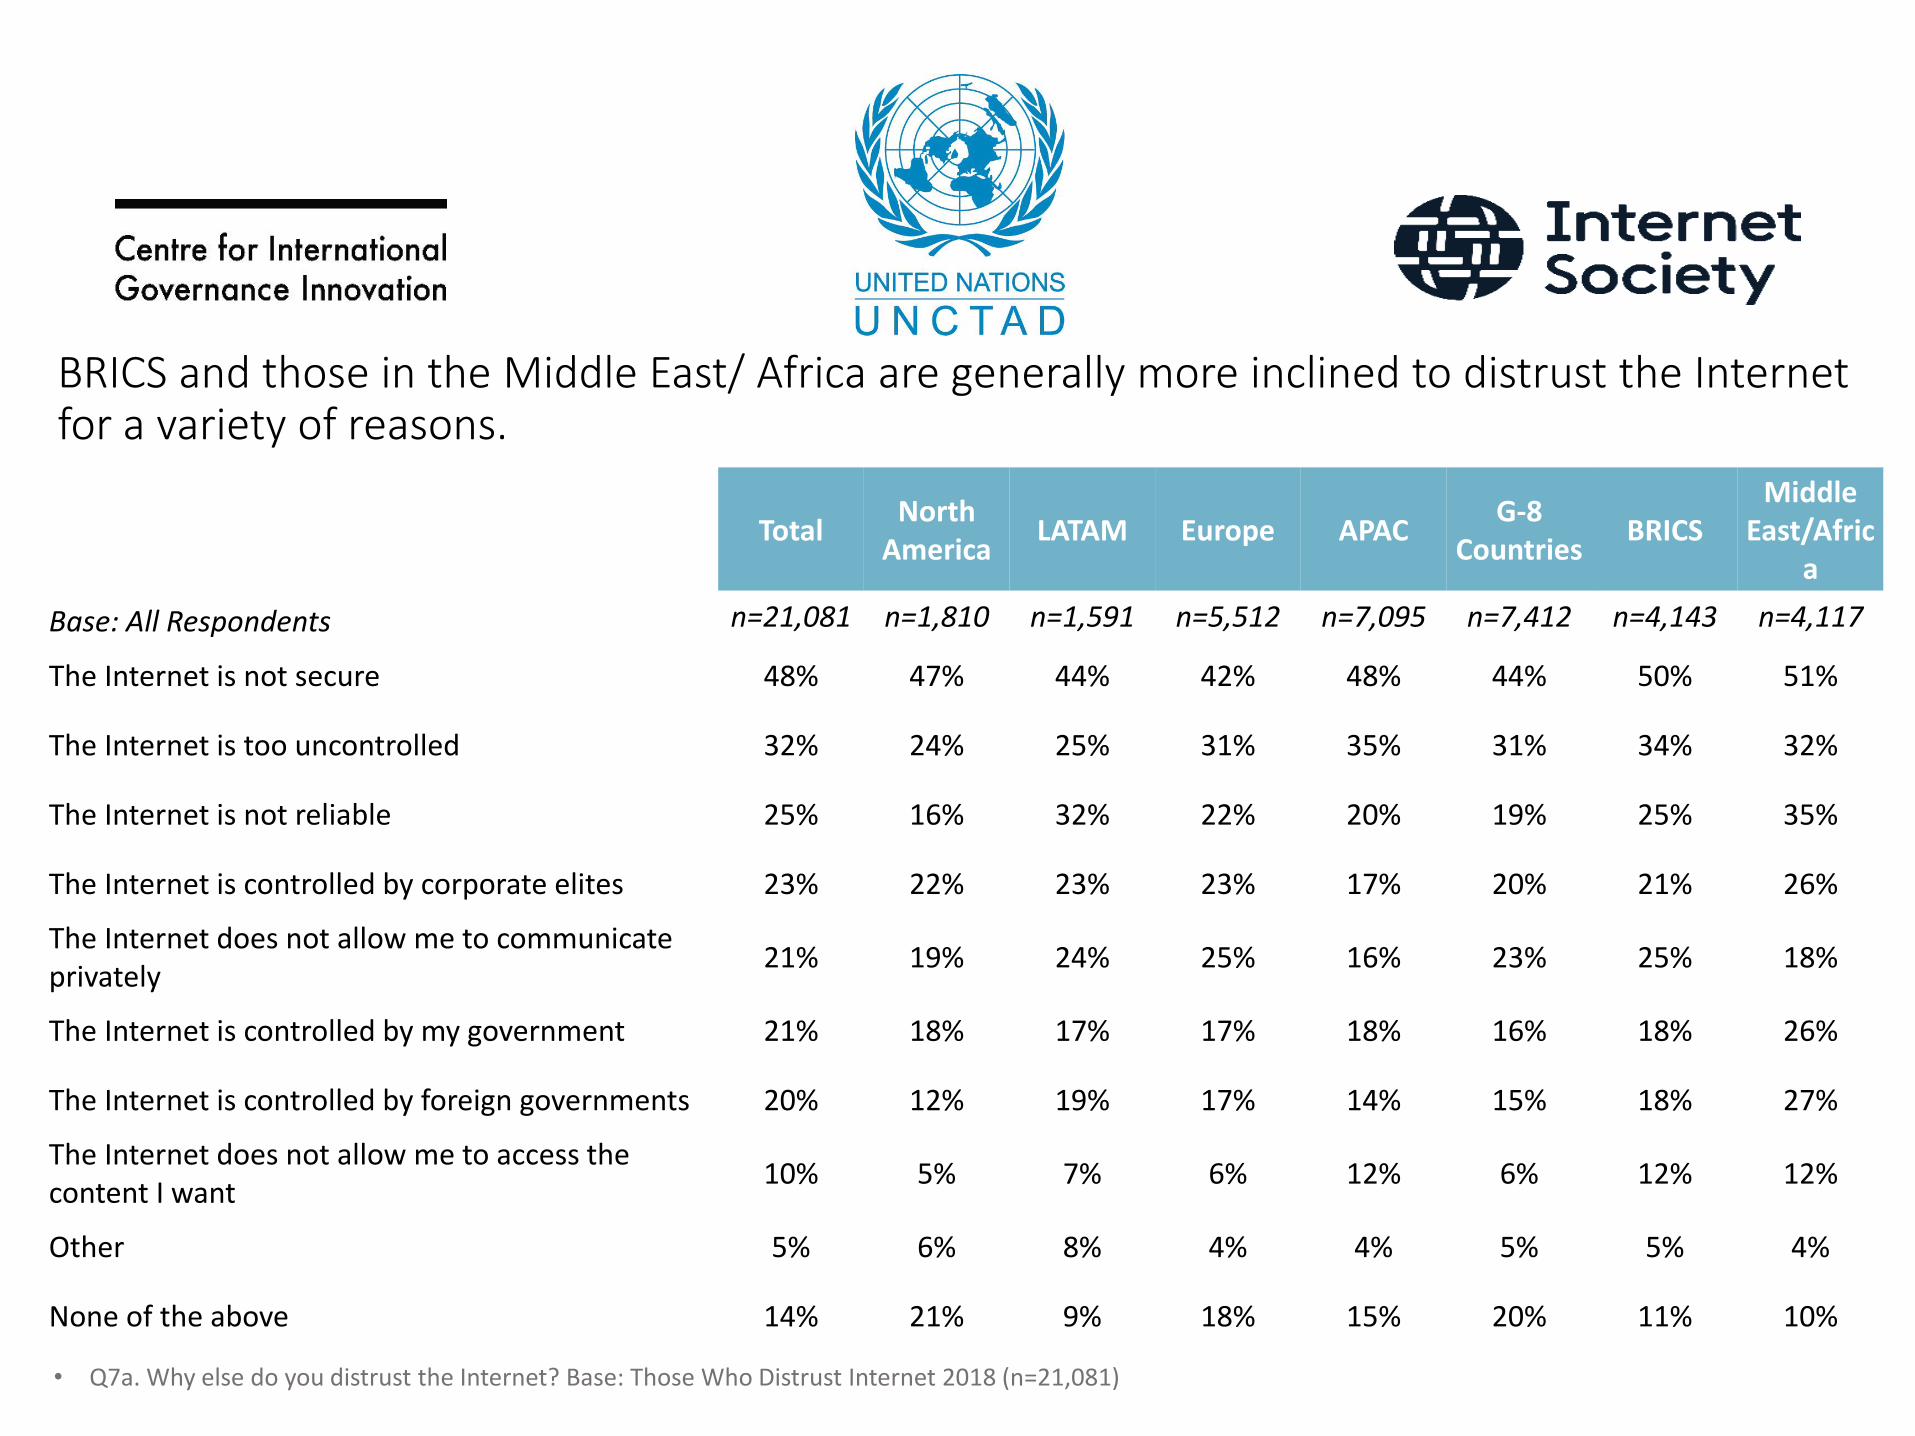
• Q7a. Why else do you distrust the Internet? Base: Those Who Distrust Internet 2018 (n=21,081)
BRICS and those in the Middle East/ Africa are generally more inclined to distrust the Internetfor a variety of reasons.
TotalNorth
AmericaLATAM Europe APAC
G-8 Countries
BRICSMiddle
East/Africa
Base: All Respondents n=21,081 n=1,810 n=1,591 n=5,512 n=7,095 n=7,412 n=4,143 n=4,117
The Internet is not secure 48% 47% 44% 42% 48% 44% 50% 51%
The Internet is too uncontrolled 32% 24% 25% 31% 35% 31% 34% 32%
The Internet is not reliable 25% 16% 32% 22% 20% 19% 25% 35%
The Internet is controlled by corporate elites 23% 22% 23% 23% 17% 20% 21% 26%
The Internet does not allow me to communicate privately
21% 19% 24% 25% 16% 23% 25% 18%
The Internet is controlled by my government 21% 18% 17% 17% 18% 16% 18% 26%
The Internet is controlled by foreign governments 20% 12% 19% 17% 14% 15% 18% 27%
The Internet does not allow me to access the content I want
10% 5% 7% 6% 12% 6% 12% 12%
Other 5% 6% 8% 4% 4% 5% 5% 4%
None of the above 14% 21% 9% 18% 15% 20% 11% 10%
Trust and E-commerce
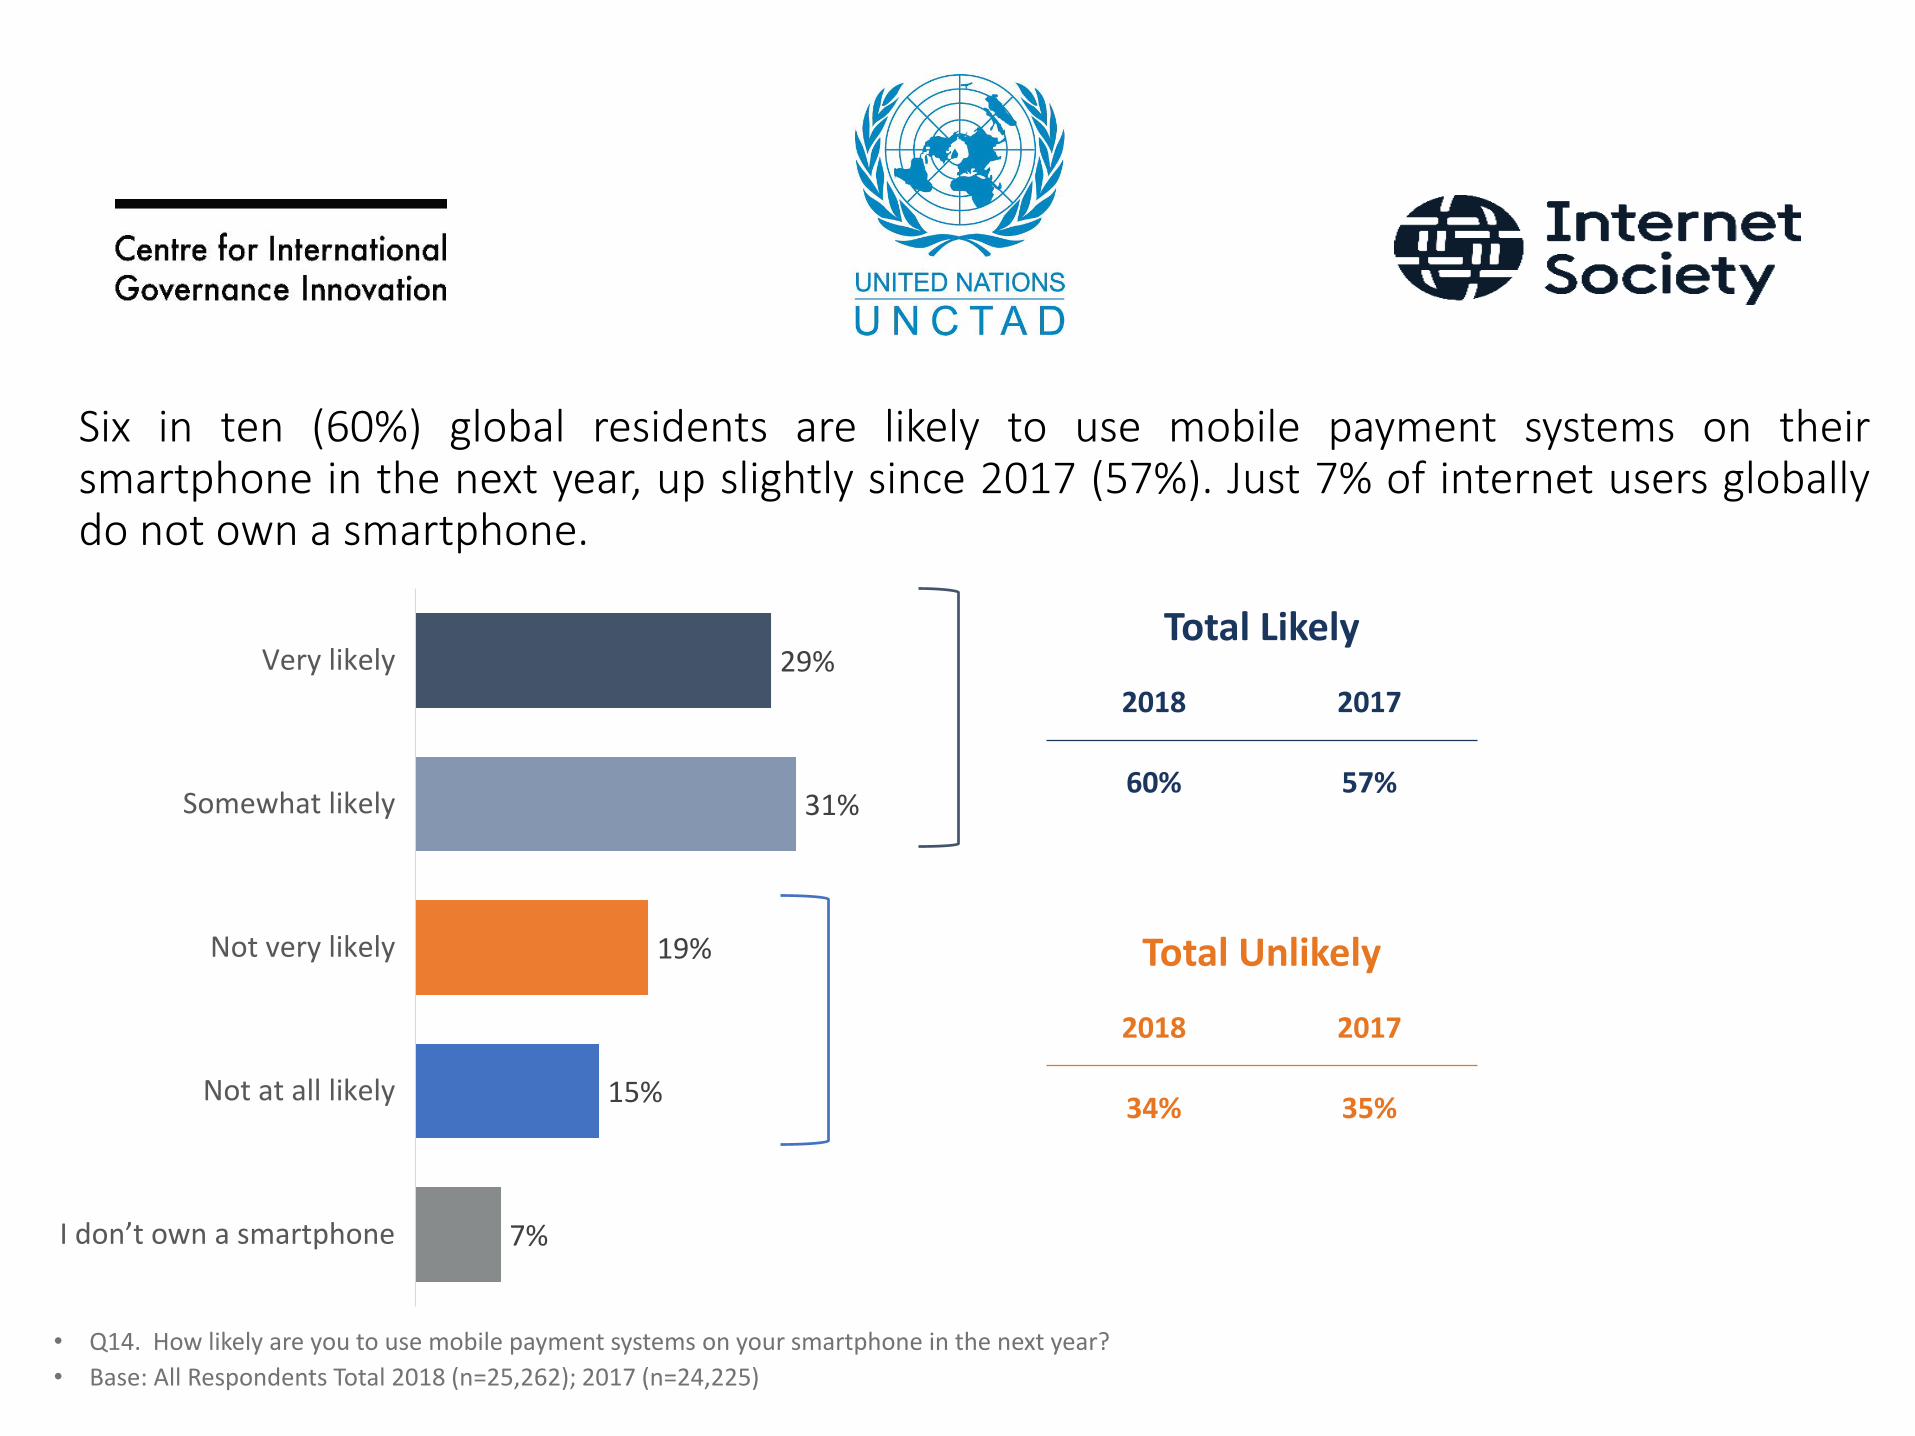
Six in ten (60%) global residents are likely to use mobile payment systems on theirsmartphone in the next year, up slightly since 2017 (57%). Just 7% of internet users globallydo not own a smartphone.
• Q14. How likely are you to use mobile payment systems on your smartphone in the next year?
• Base: All Respondents Total 2018 (n=25,262); 2017 (n=24,225)
29%
31%
19%
15%
7%
Very likely
Somewhat likely
Not very likely
Not at all likely
I don’t own a smartphone
Total Likely
2018 2017
60% 57%
Total Unlikely
2018 2017
34% 35%
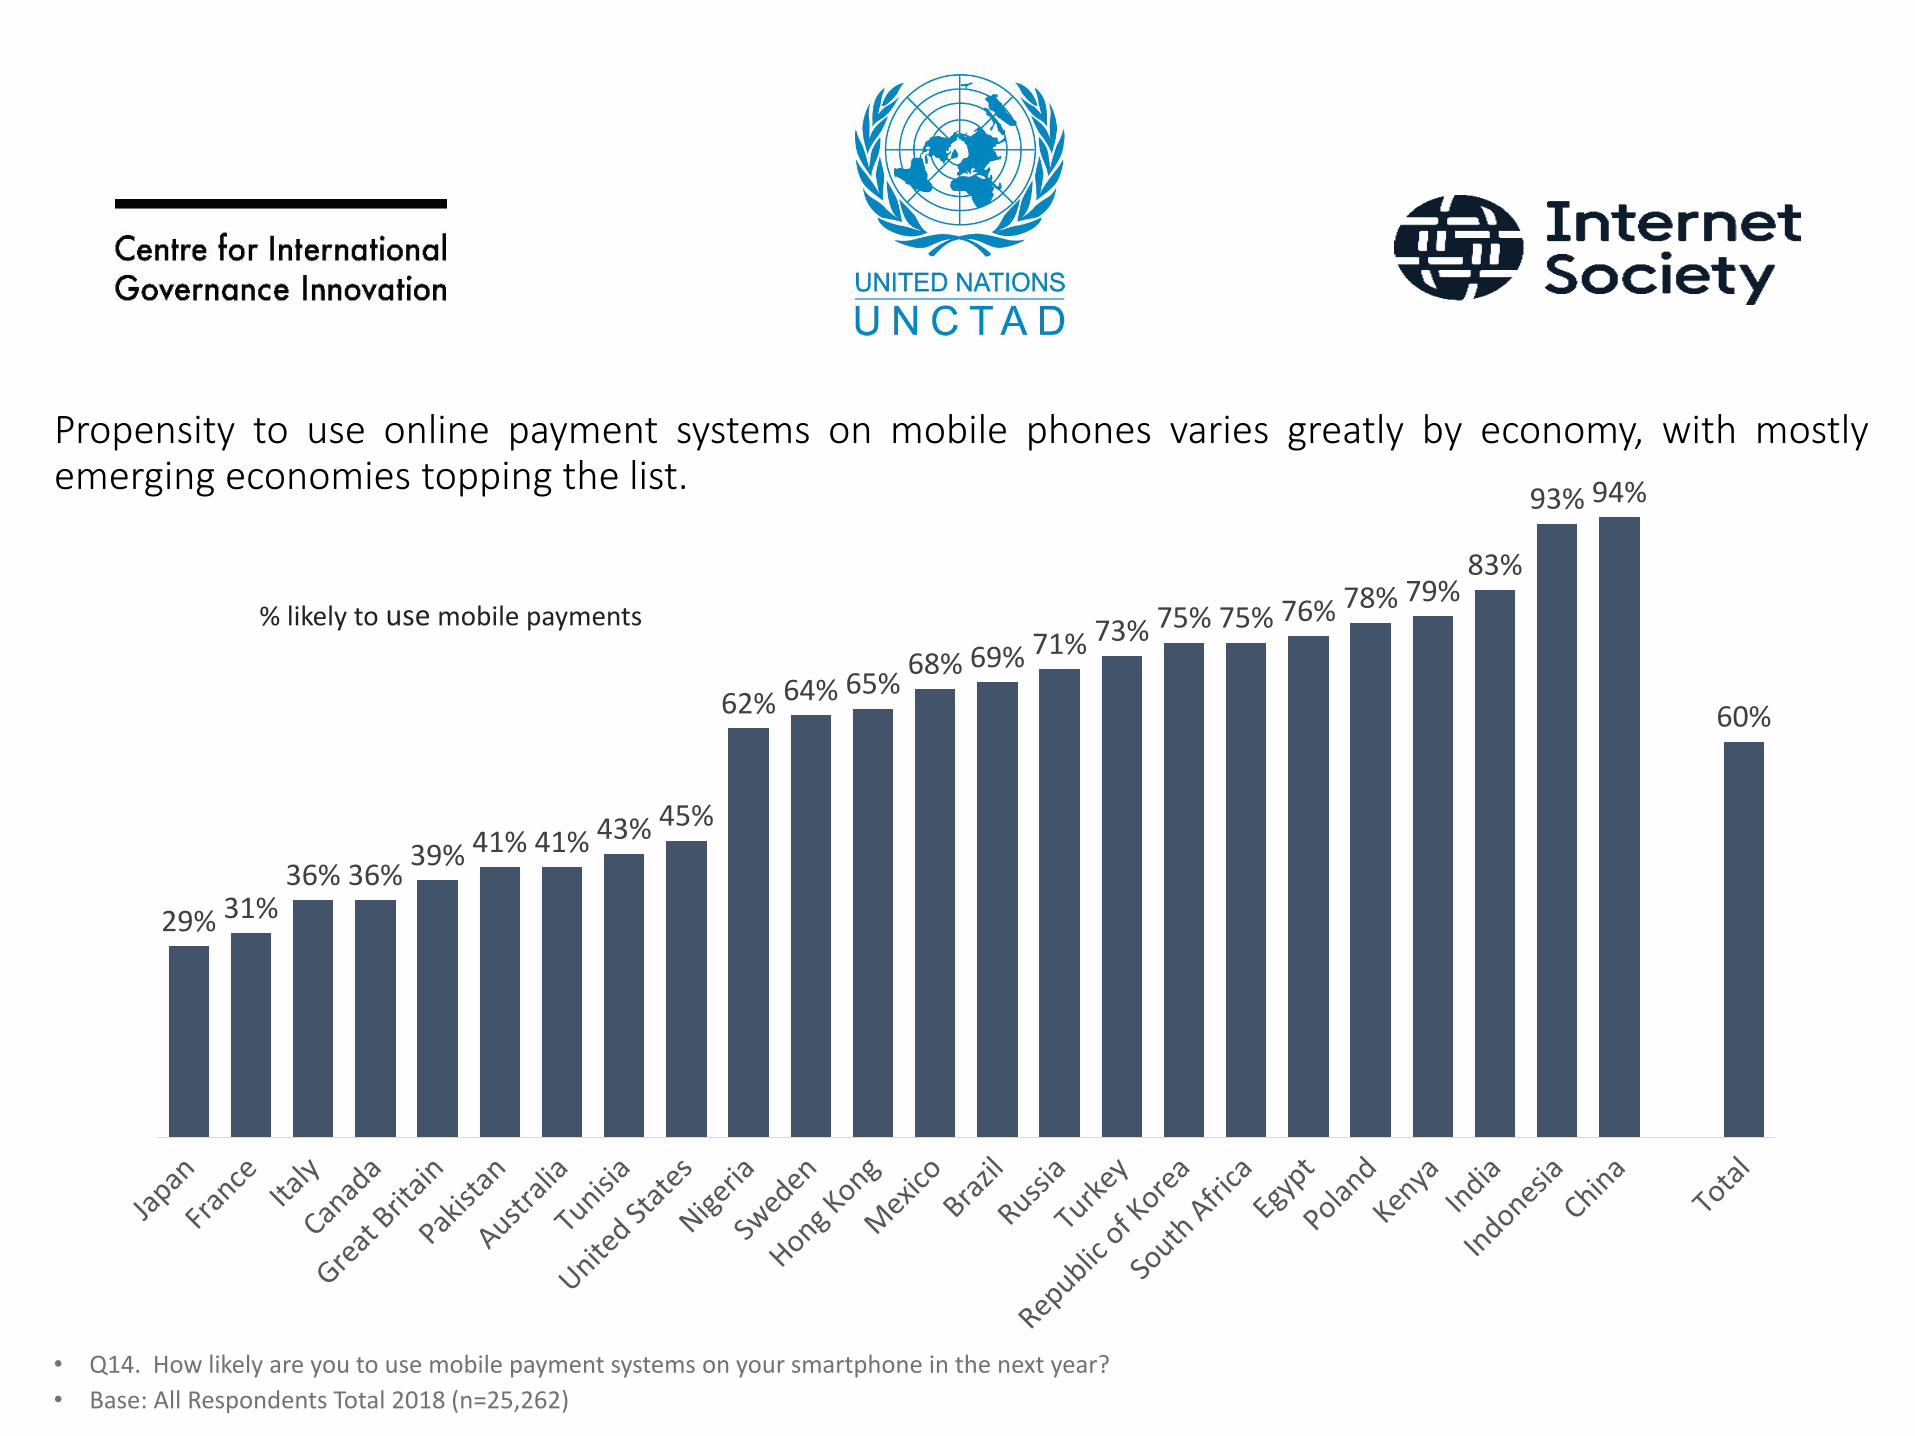
Propensity to use online payment systems on mobile phones varies greatly by economy, with mostlyemerging economies topping the list.
• Q14. How likely are you to use mobile payment systems on your smartphone in the next year?
• Base: All Respondents Total 2018 (n=25,262)
60%
94%93%
83%79%78%76%75%75%73%71%69%68%
65%64%62%
45%43%41%41%39%36%36%
31%29%
% likely to use mobile payments
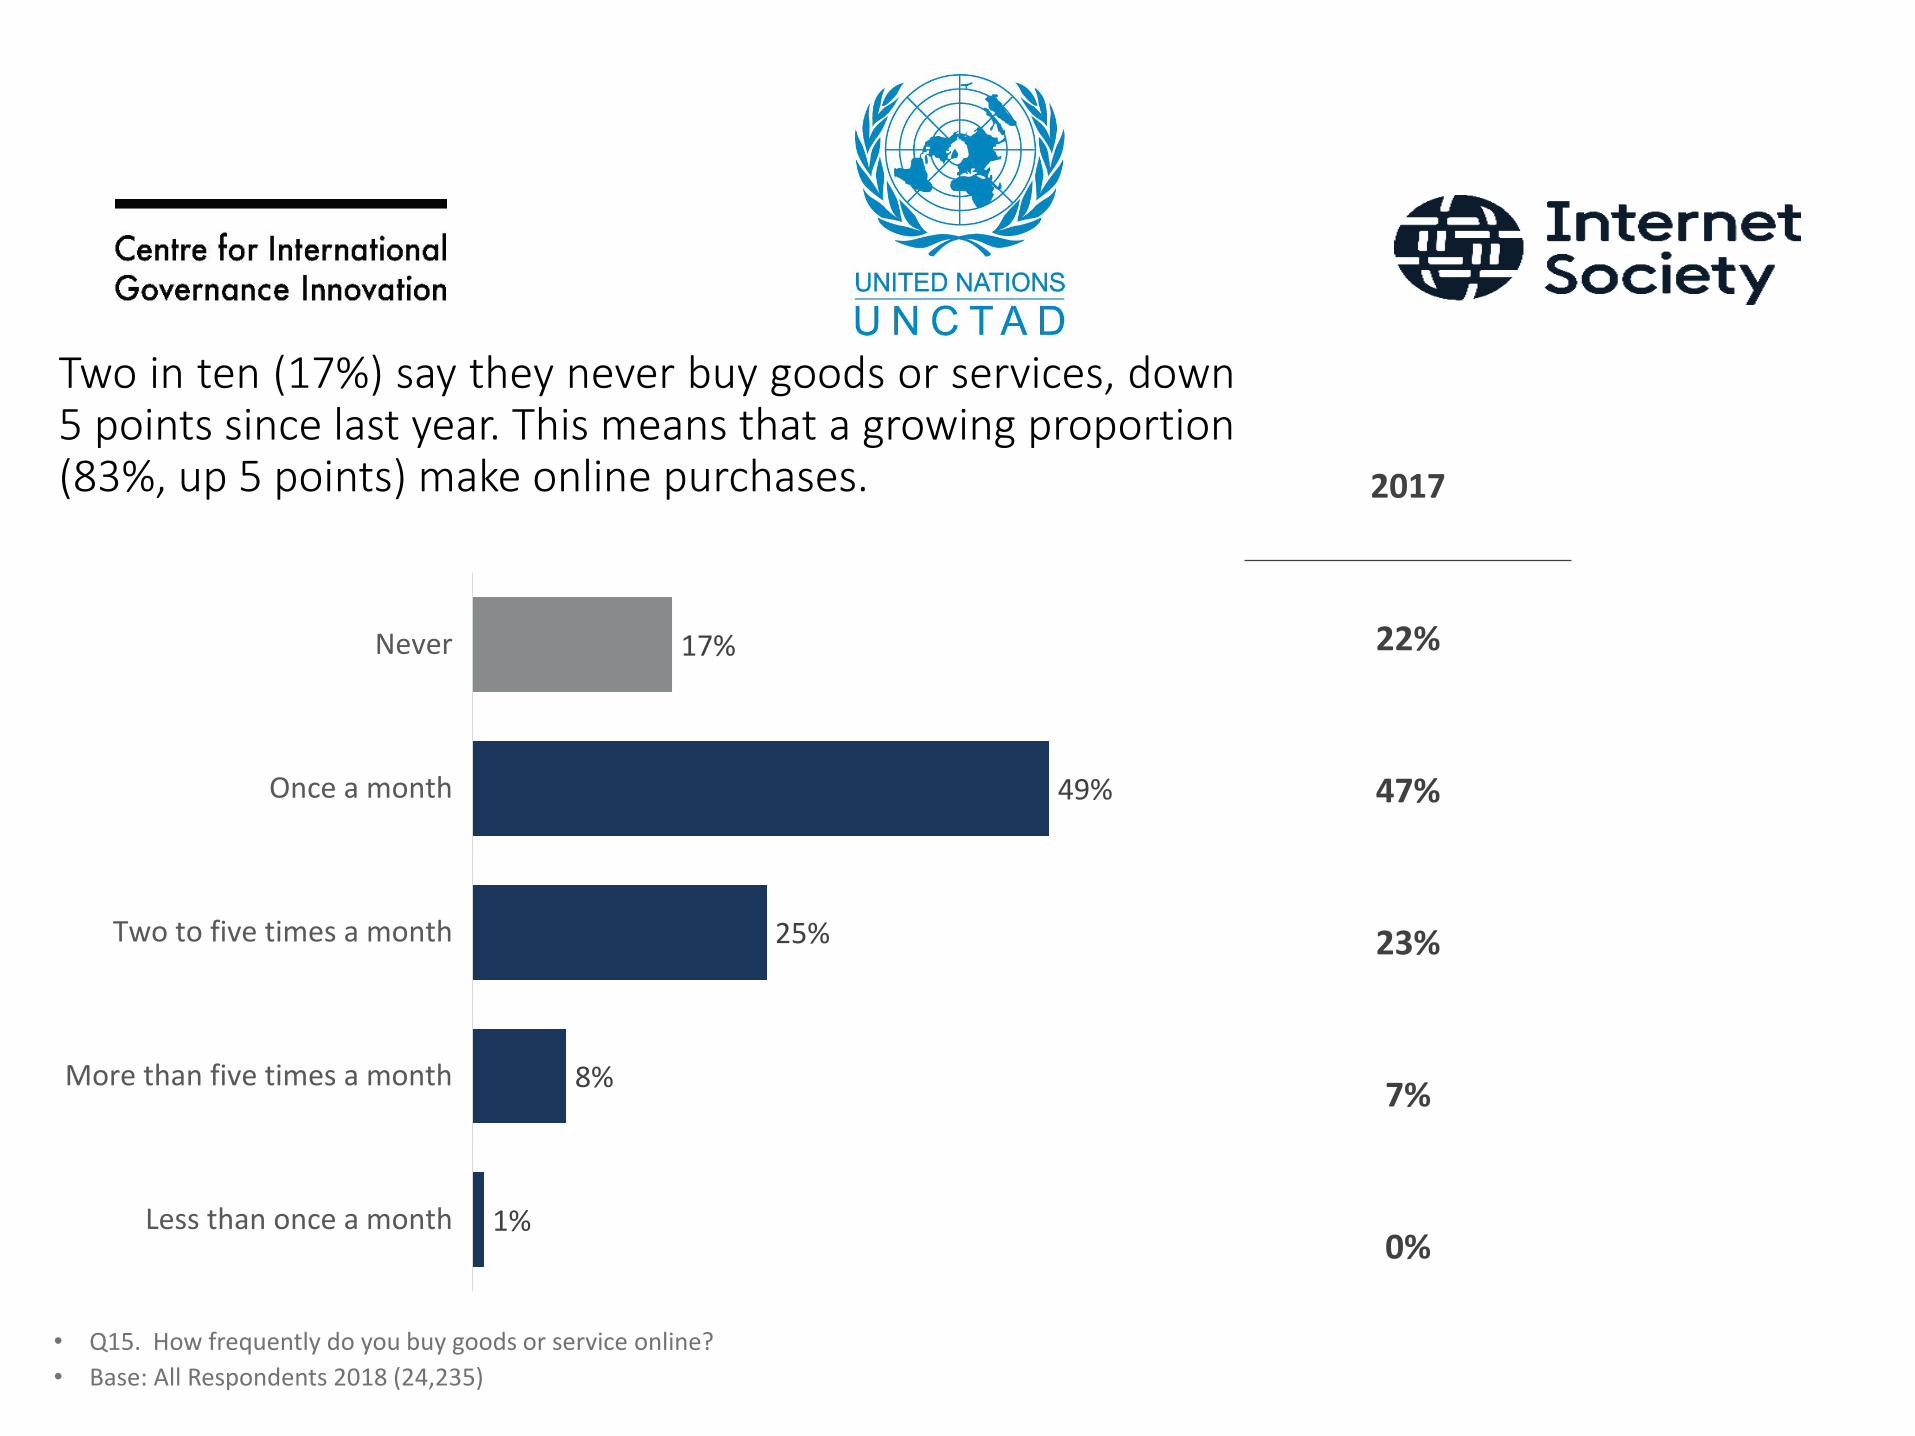
Two in ten (17%) say they never buy goods or services, down5 points since last year. This means that a growing proportion(83%, up 5 points) make online purchases.
• Q15. How frequently do you buy goods or service online?
• Base: All Respondents 2018 (24,235)
17%
49%
25%
8%
1%
Never
Once a month
Two to five times a month
More than five times a month
Less than once a month
2017
22%
47%
23%
7%
0%
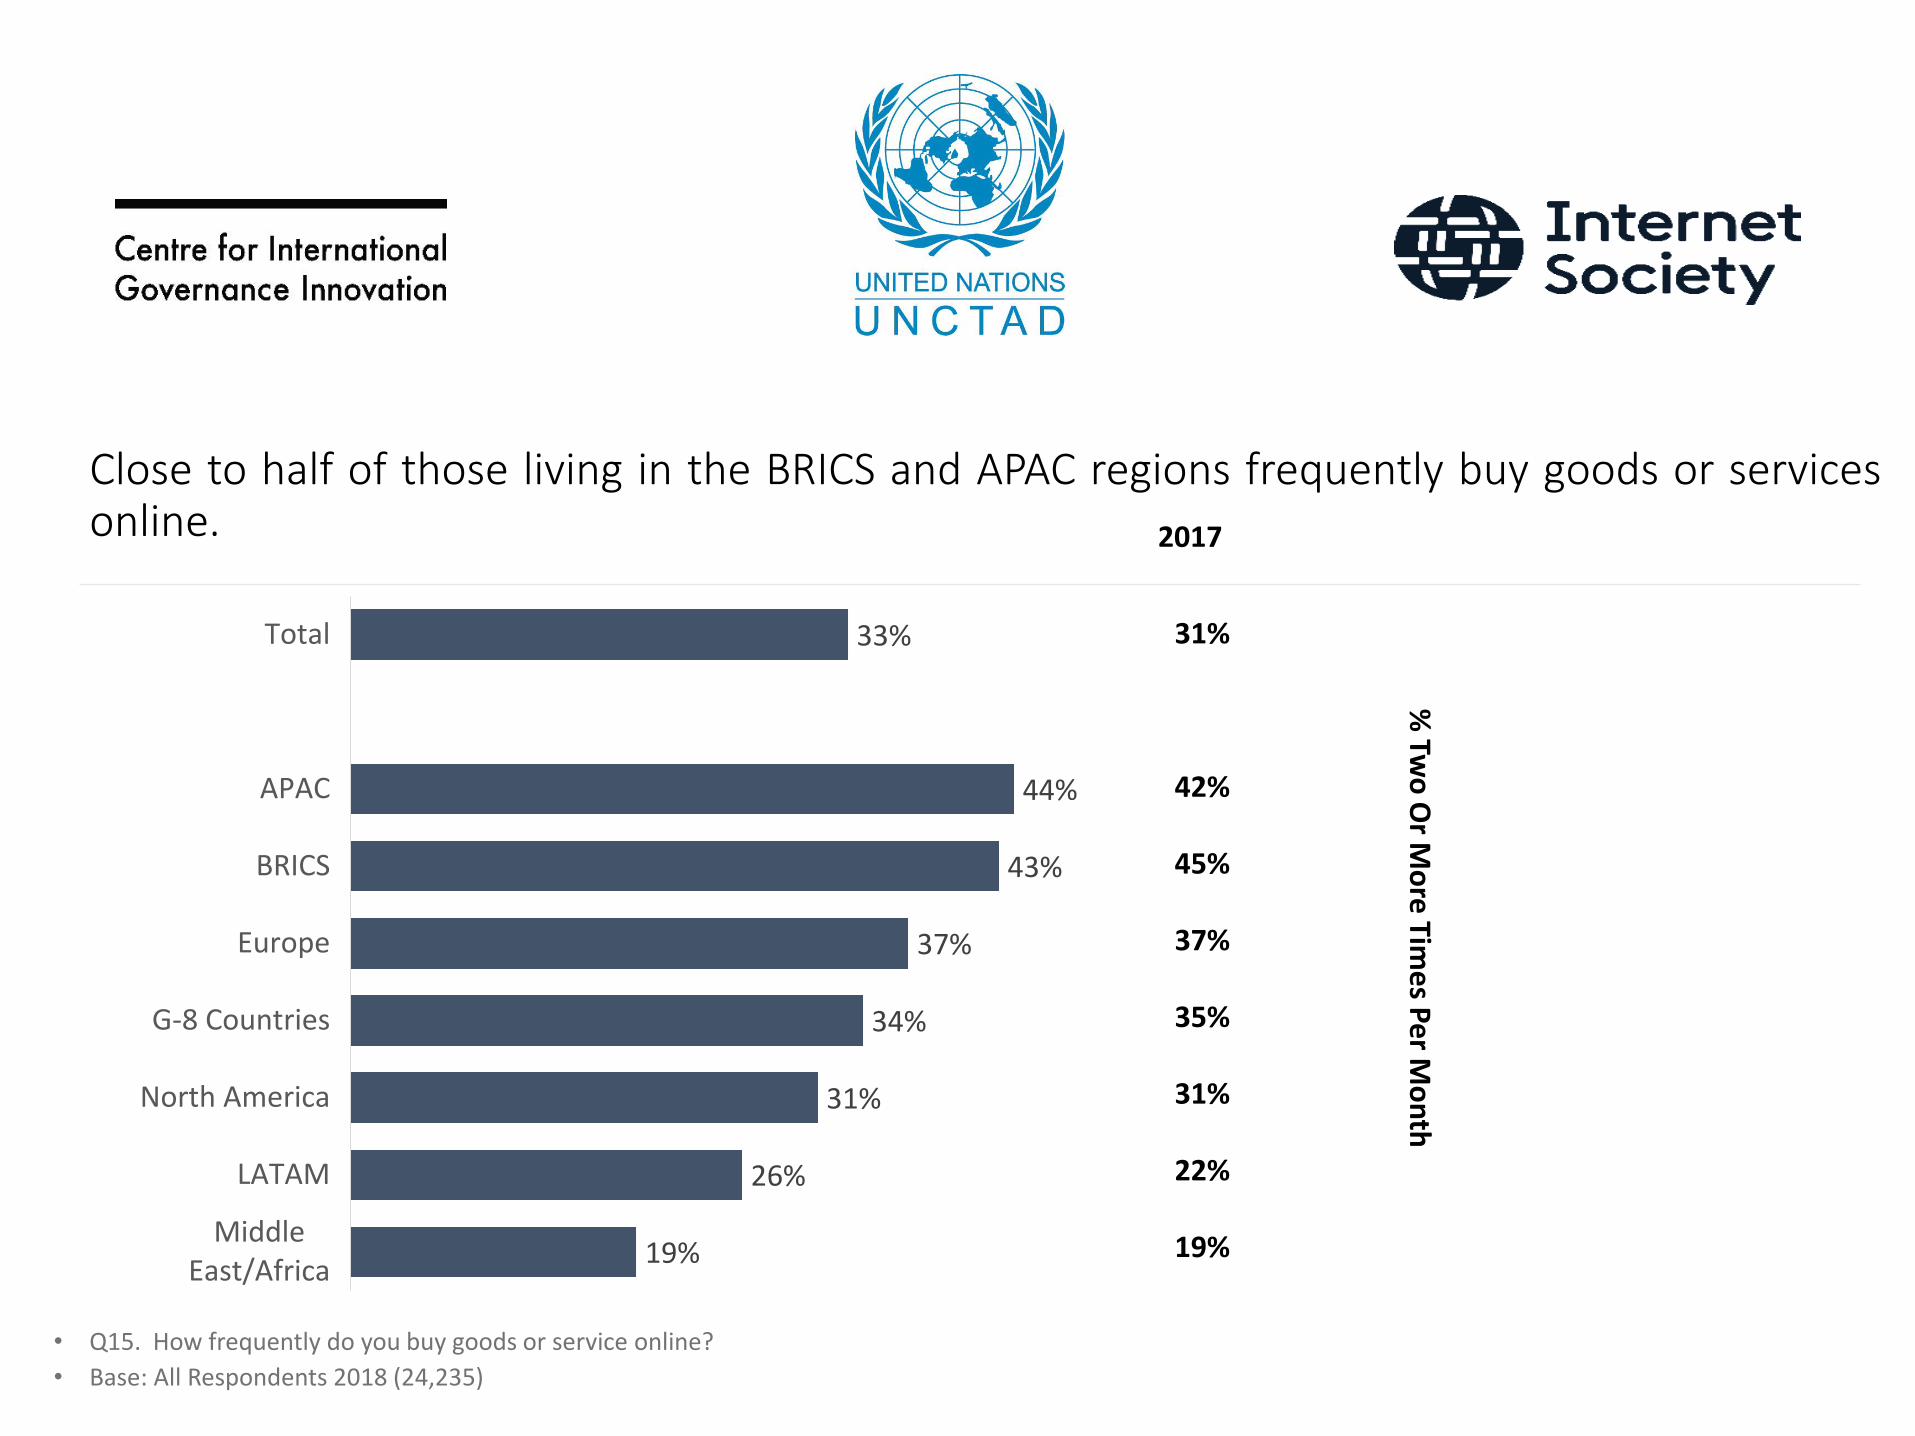
Close to half of those living in the BRICS and APAC regions frequently buy goods or servicesonline.
• Q15. How frequently do you buy goods or service online?
• Base: All Respondents 2018 (24,235)
33%
44%
43%
37%
34%
31%
26%
19%
Total
APAC
BRICS
Europe
G-8 Countries
North America
LATAM
MiddleEast/Africa
31%
42%
45%
37%
35%
31%
22%
19%
2017
% Tw
o O
r Mo
re Tim
es P
er M
on
th
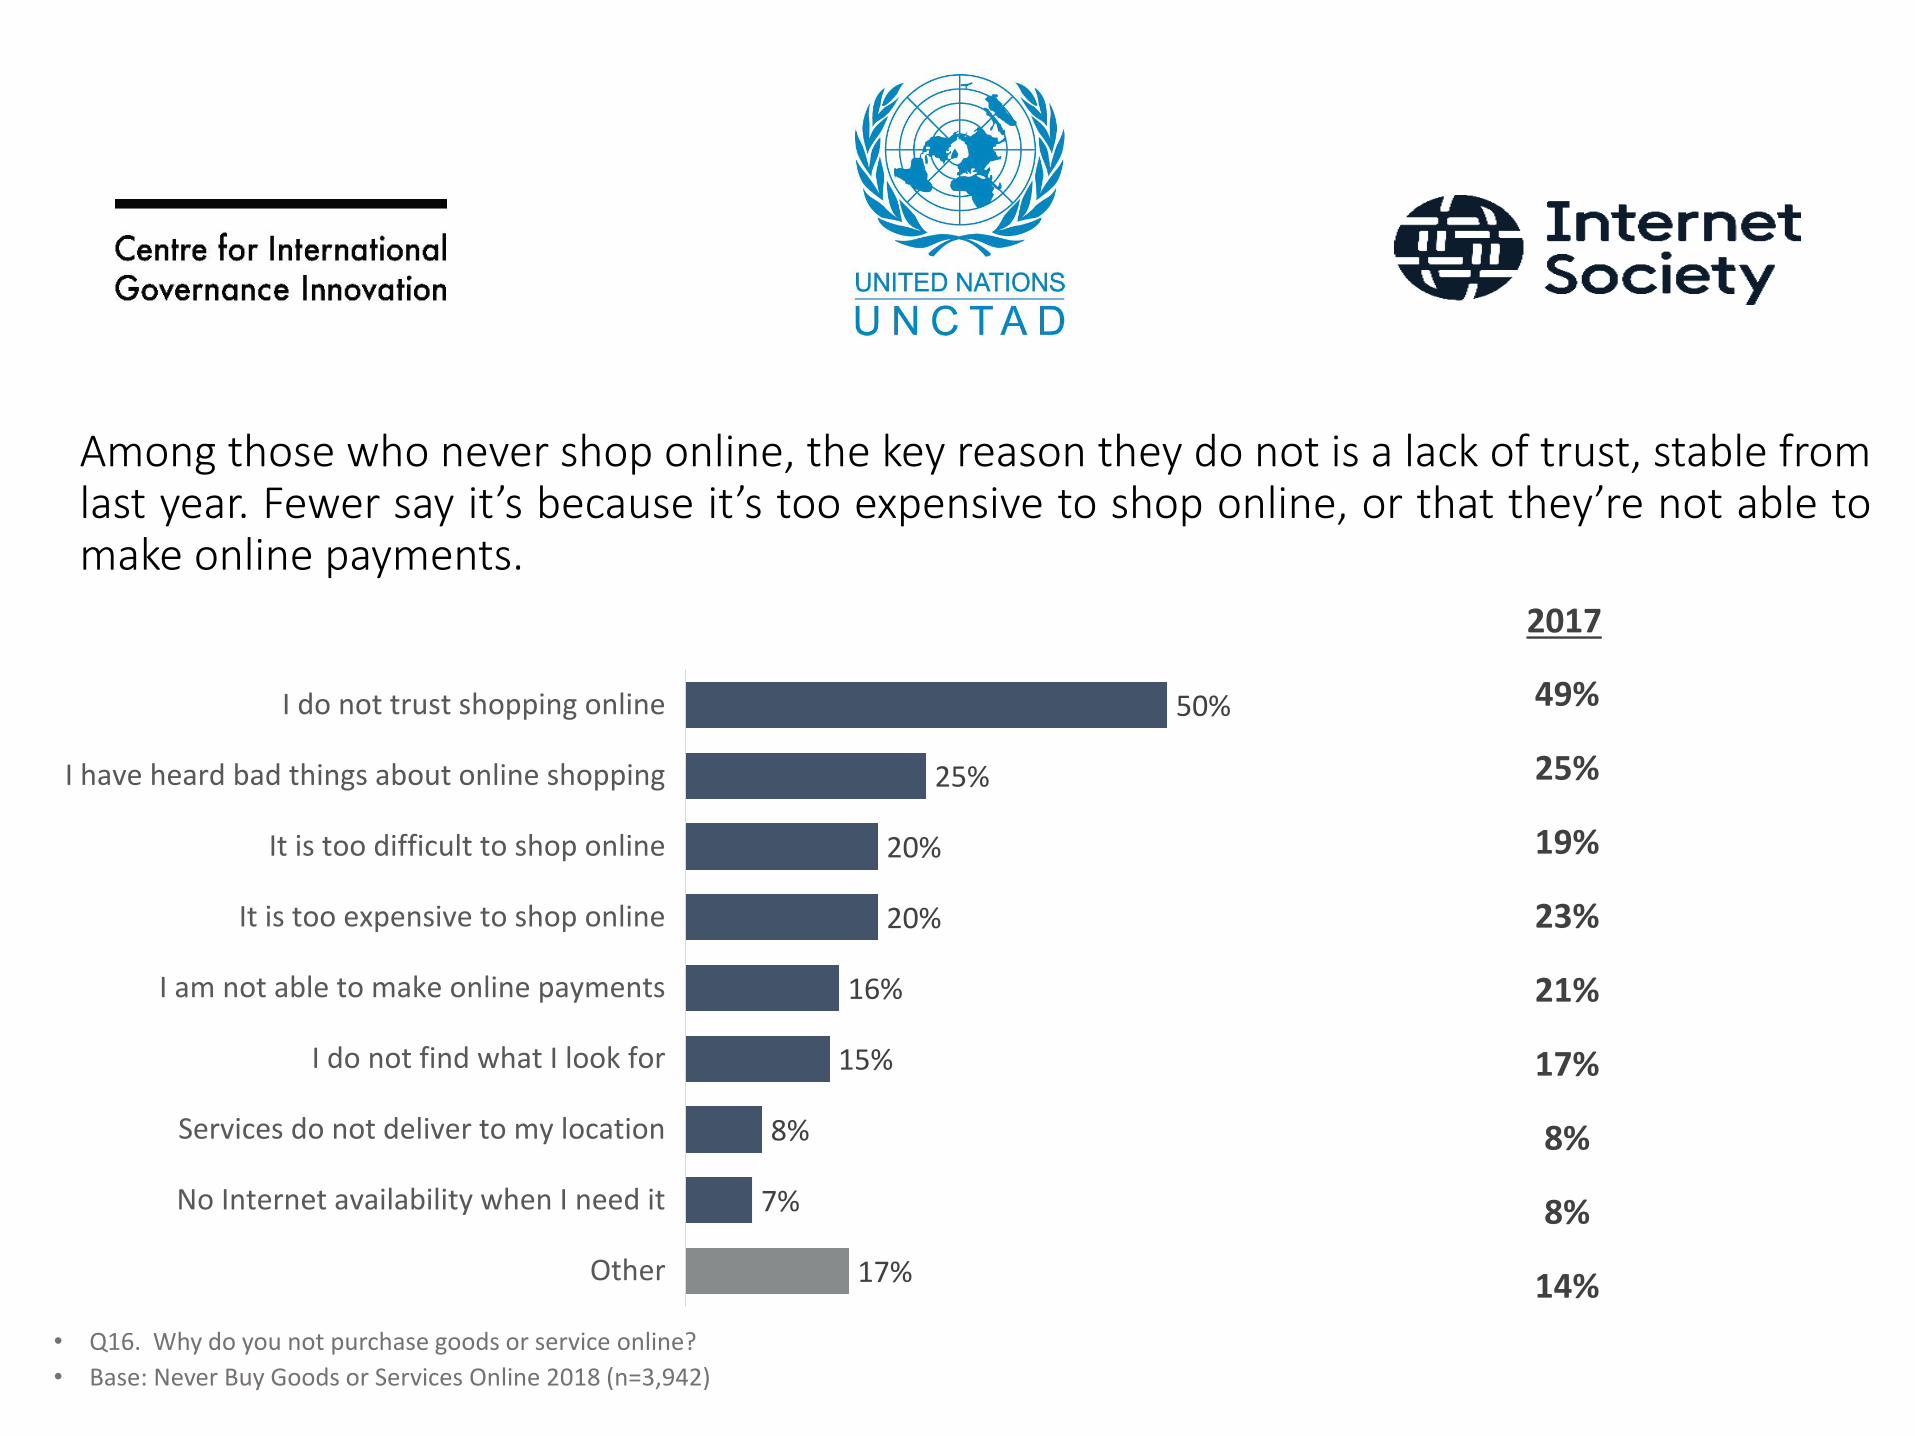
Among those who never shop online, the key reason they do not is a lack of trust, stable fromlast year. Fewer say it’s because it’s too expensive to shop online, or that they’re not able tomake online payments.
• Q16. Why do you not purchase goods or service online?
• Base: Never Buy Goods or Services Online 2018 (n=3,942)
50%
25%
20%
20%
16%
15%
8%
7%
17%
I do not trust shopping online
I have heard bad things about online shopping
It is too difficult to shop online
It is too expensive to shop online
I am not able to make online payments
I do not find what I look for
Services do not deliver to my location
No Internet availability when I need it
Other
49%
25%
19%
23%
21%
17%
8%
8%
14%
2017
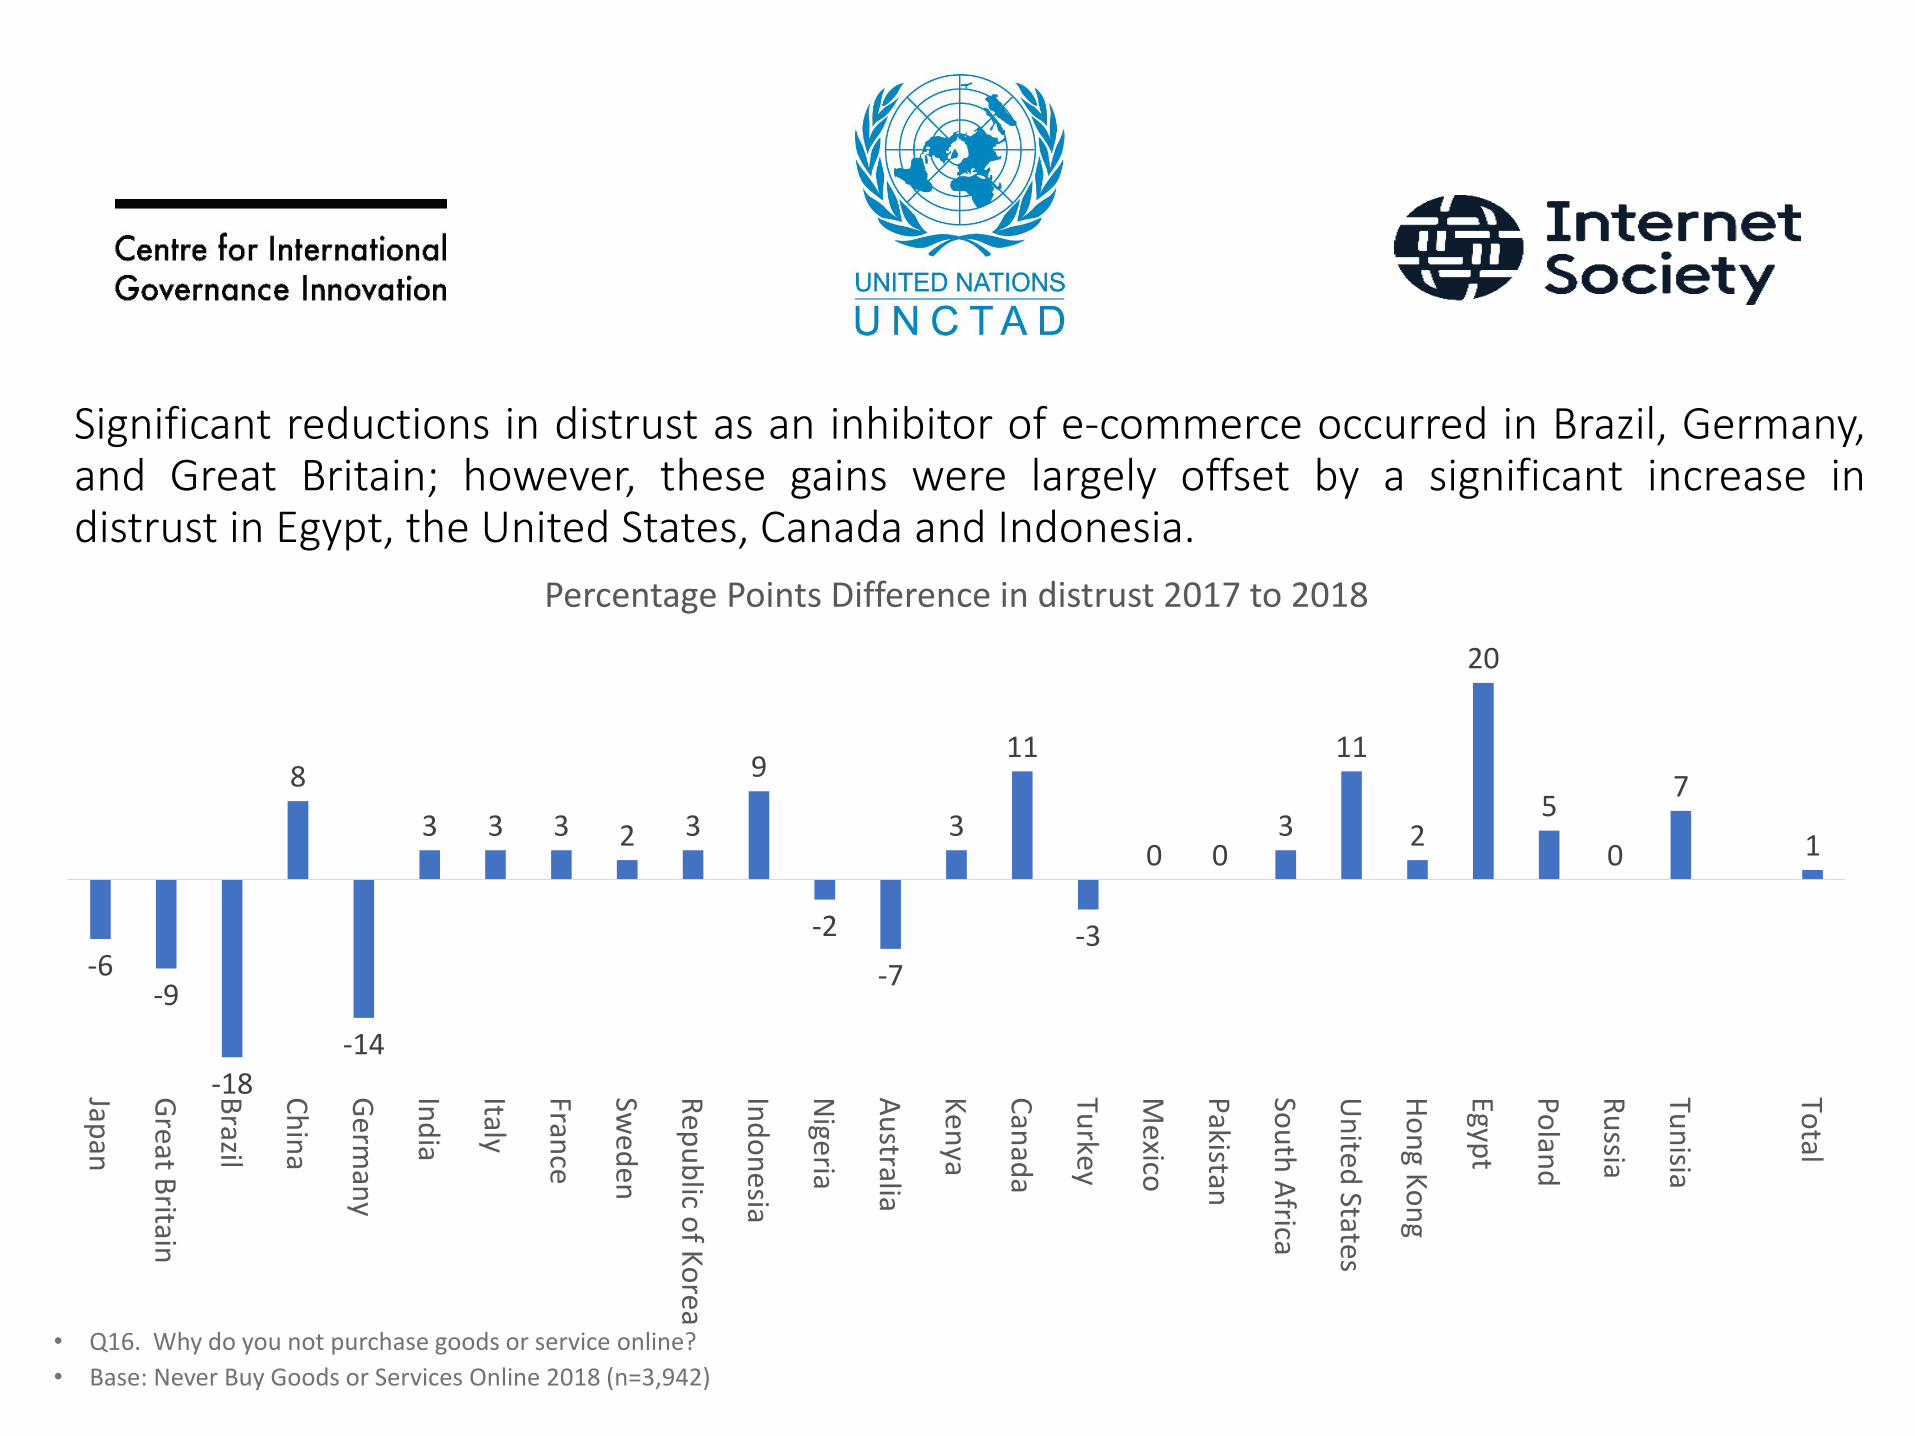
Significant reductions in distrust as an inhibitor of e-commerce occurred in Brazil, Germany,and Great Britain; however, these gains were largely offset by a significant increase indistrust in Egypt, the United States, Canada and Indonesia.
• Q16. Why do you not purchase goods or service online?
• Base: Never Buy Goods or Services Online 2018 (n=3,942)
1
7
0
5
20
2
11
300
-3
11
3
-7
-2
9
32333
-14
8
-18
-9-6
Total
Tun
isia
Ru
ssia
Po
land
Egypt
Ho
ng K
on
g
Un
ited States
Sou
th A
frica
Pakistan
Mexico
Turkey
Can
ada
Ken
ya
Au
stralia
Nigeria
Ind
on
esia
Rep
ub
lic of K
orea
Swed
en
France
Italy
Ind
ia
Germ
any
Ch
ina
Brazil
Great B
ritain
Japan
Percentage Points Difference in distrust 2017 to 2018
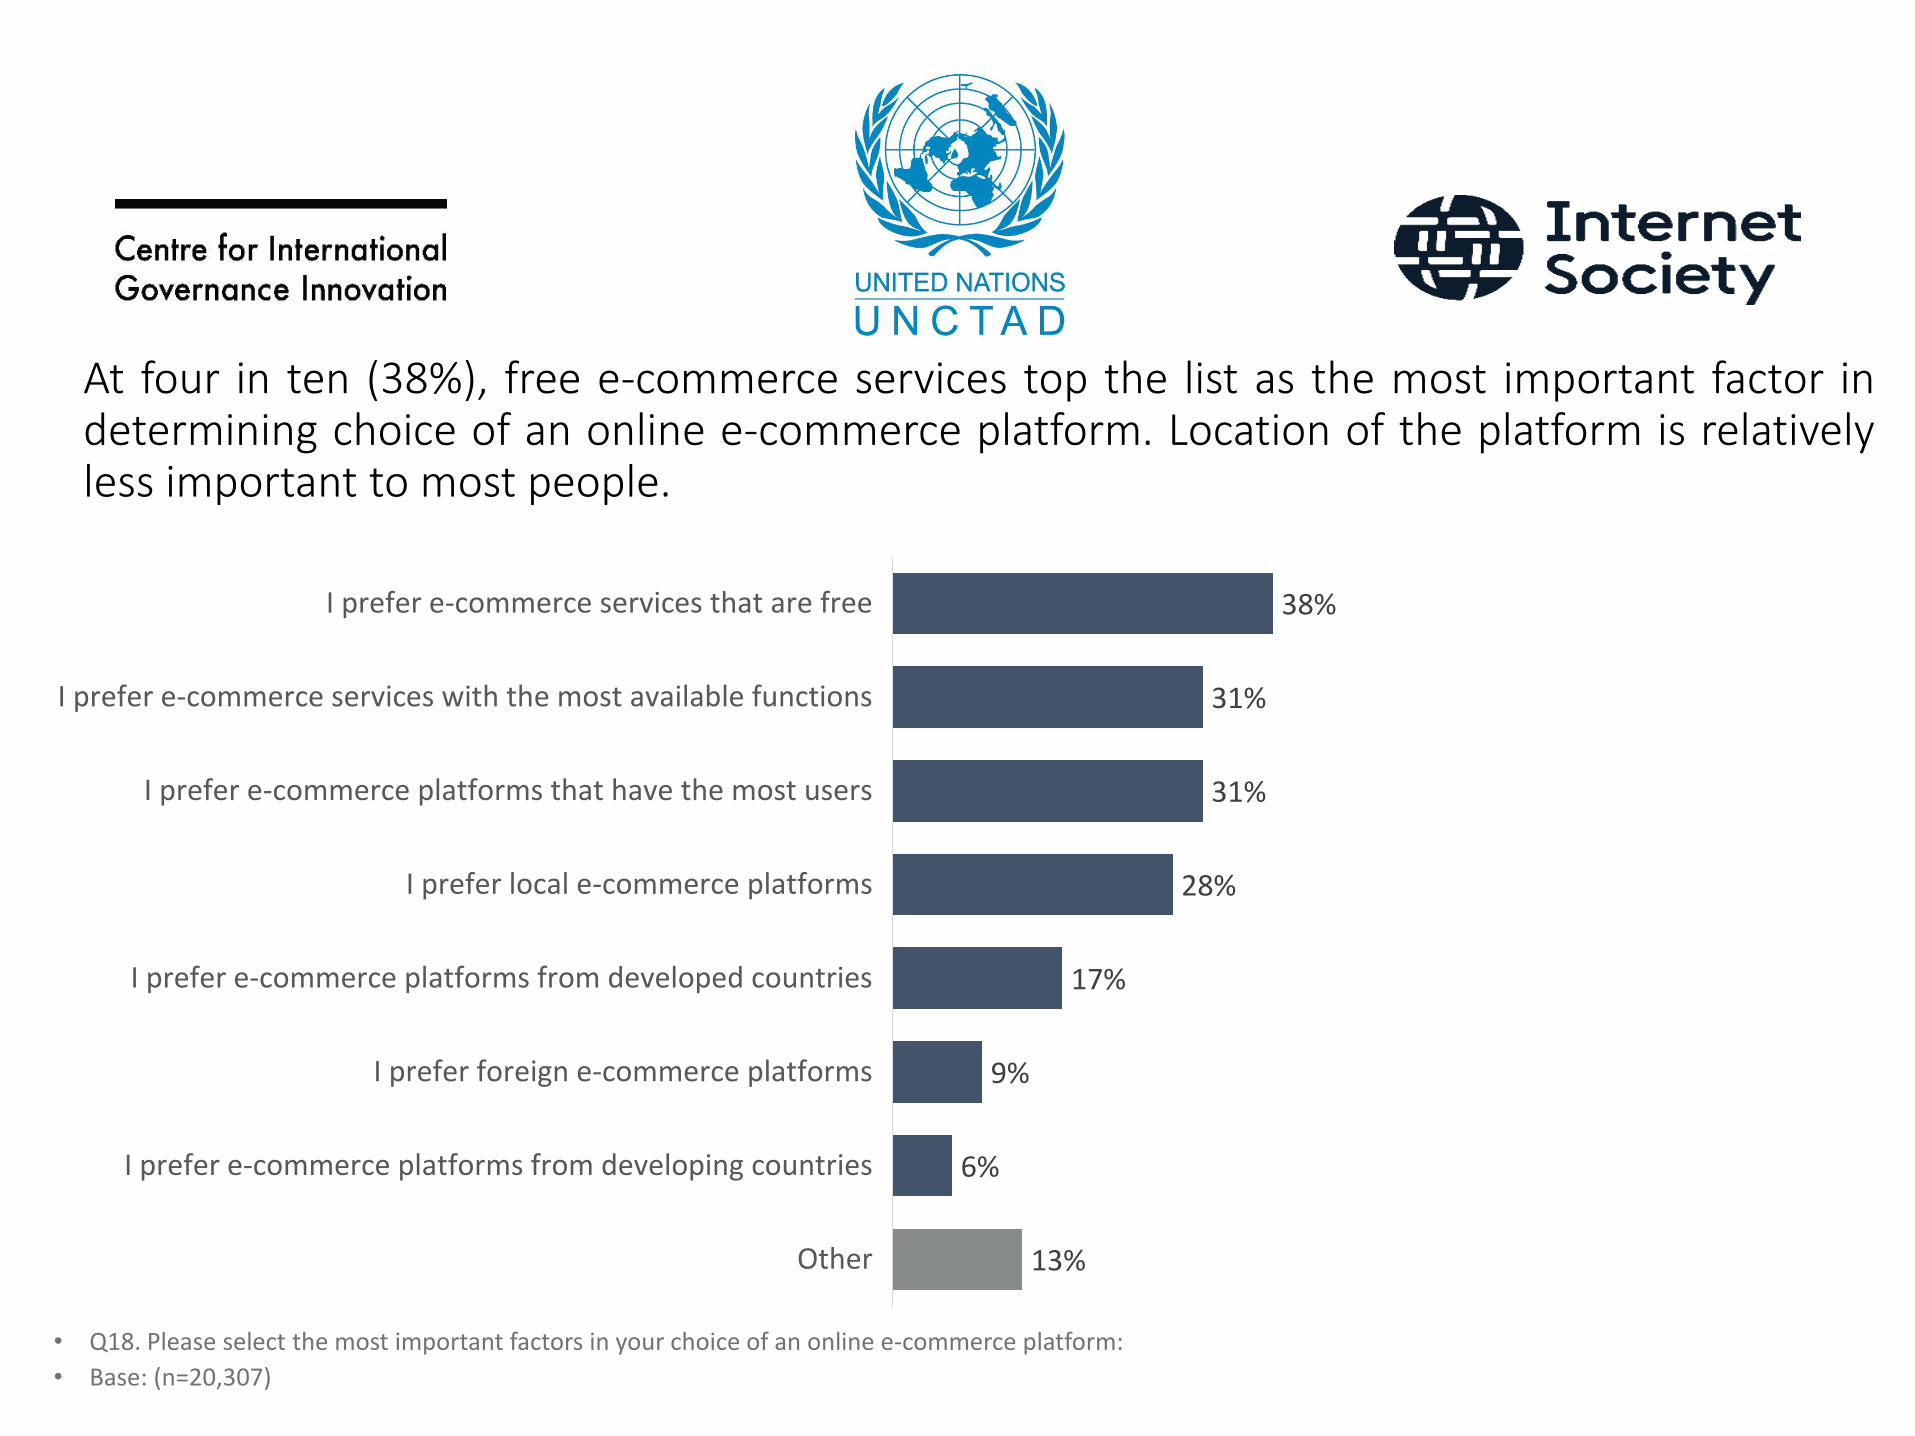
At four in ten (38%), free e-commerce services top the list as the most important factor indetermining choice of an online e-commerce platform. Location of the platform is relativelyless important to most people.
• Q18. Please select the most important factors in your choice of an online e-commerce platform:
• Base: (n=20,307)
38%
31%
31%
28%
17%
9%
6%
13%
I prefer e-commerce services that are free
I prefer e-commerce services with the most available functions
I prefer e-commerce platforms that have the most users
I prefer local e-commerce platforms
I prefer e-commerce platforms from developed countries
I prefer foreign e-commerce platforms
I prefer e-commerce platforms from developing countries
Other
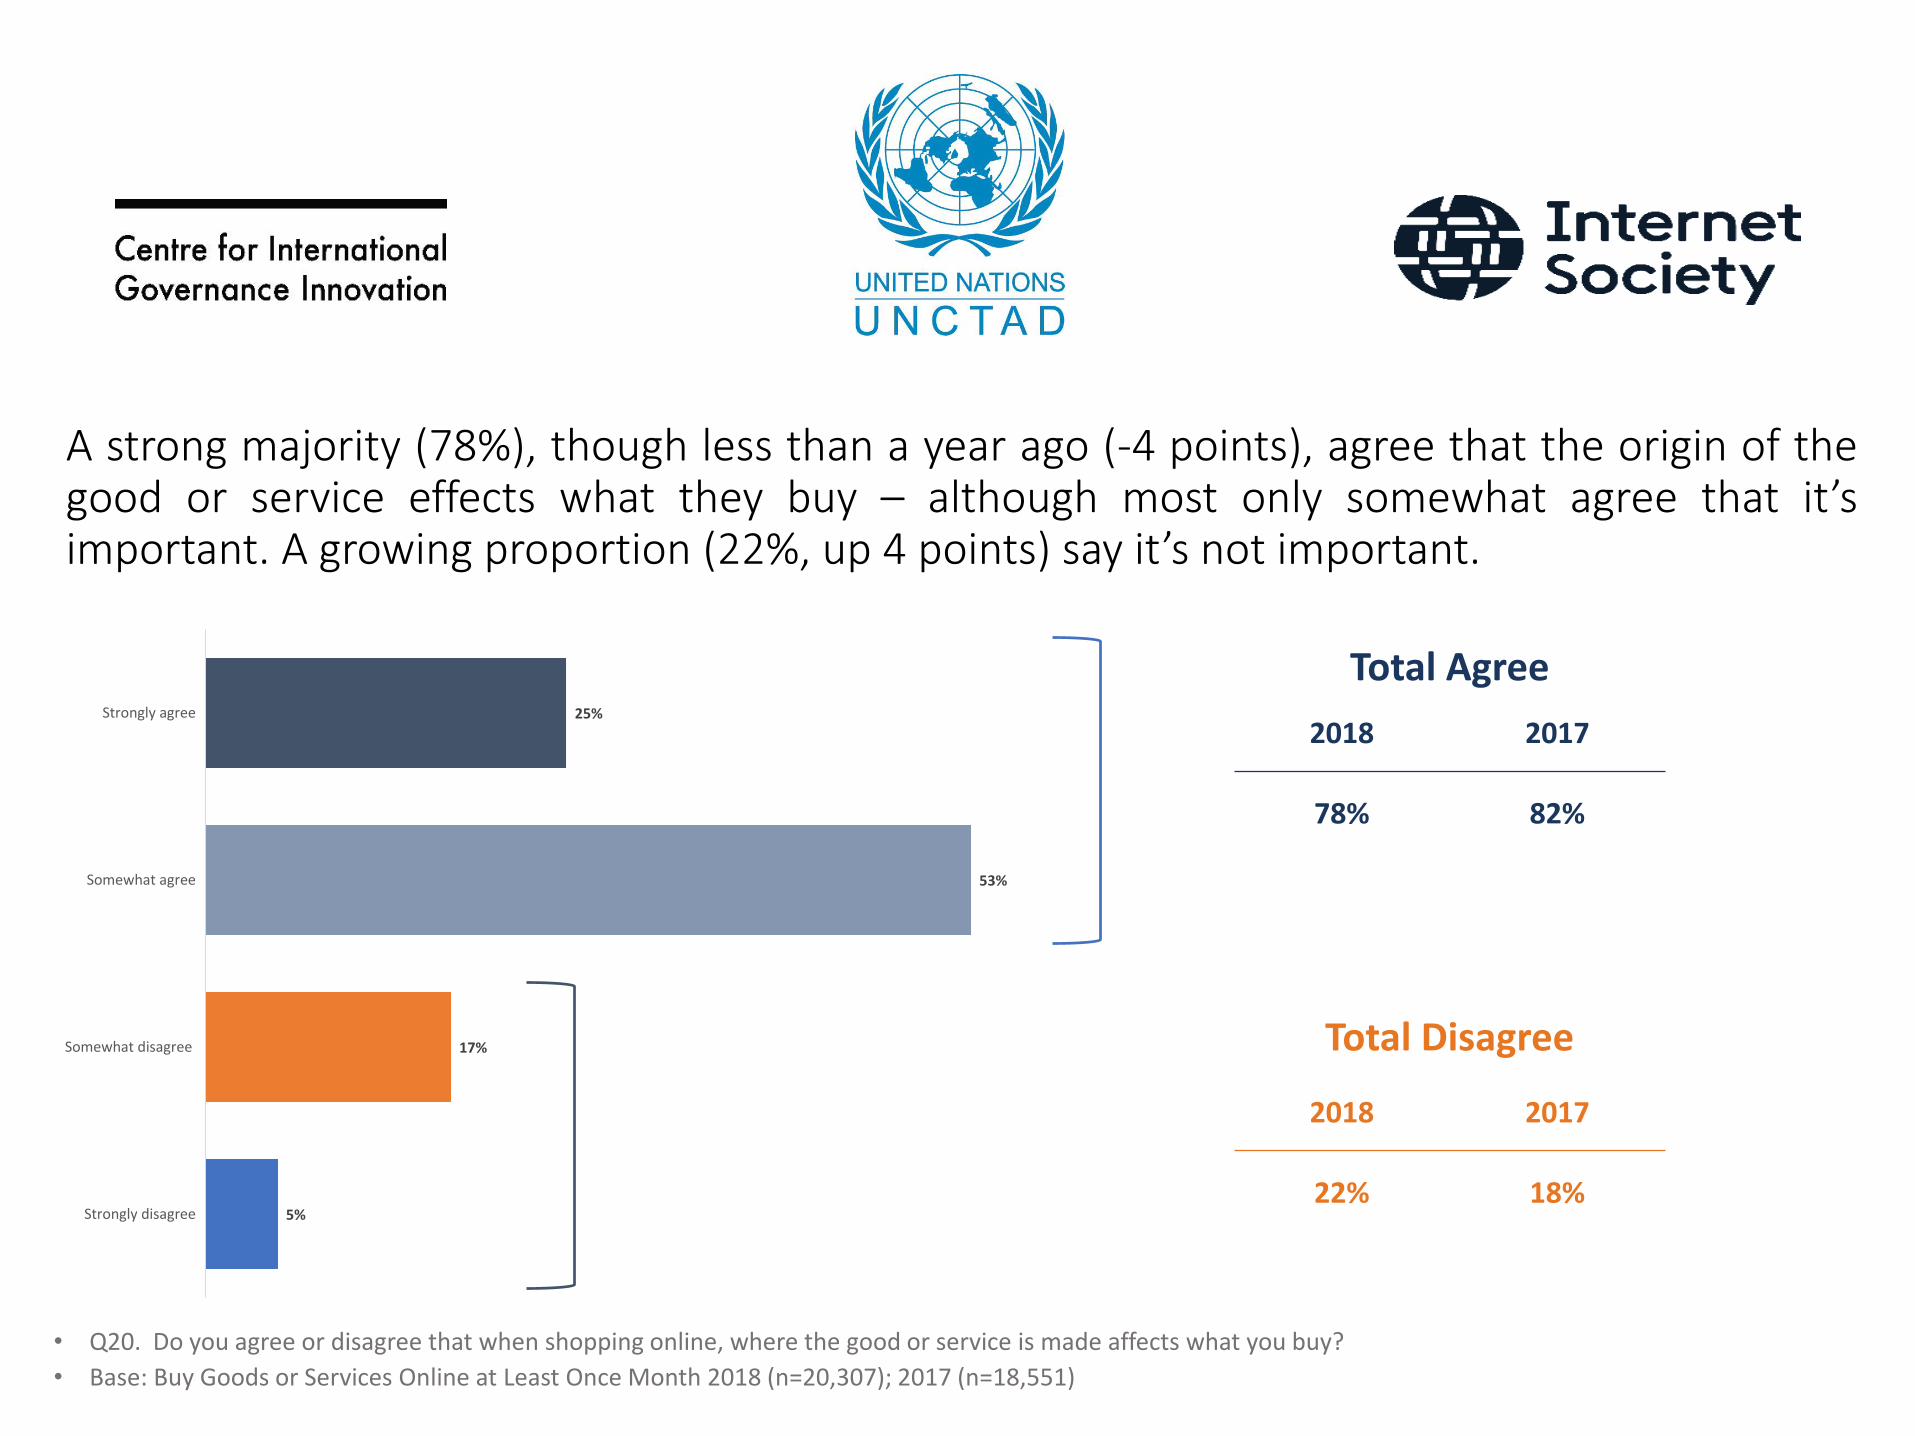
A strong majority (78%), though less than a year ago (-4 points), agree that the origin of thegood or service effects what they buy – although most only somewhat agree that it’simportant. A growing proportion (22%, up 4 points) say it’s not important.
• Q20. Do you agree or disagree that when shopping online, where the good or service is made affects what you buy?
• Base: Buy Goods or Services Online at Least Once Month 2018 (n=20,307); 2017 (n=18,551)
25%
53%
17%
5%
Strongly agree
Somewhat agree
Somewhat disagree
Strongly disagree
Total Agree
2018 2017
78% 82%
Total Disagree
2018 2017
22% 18%
Technological Progress
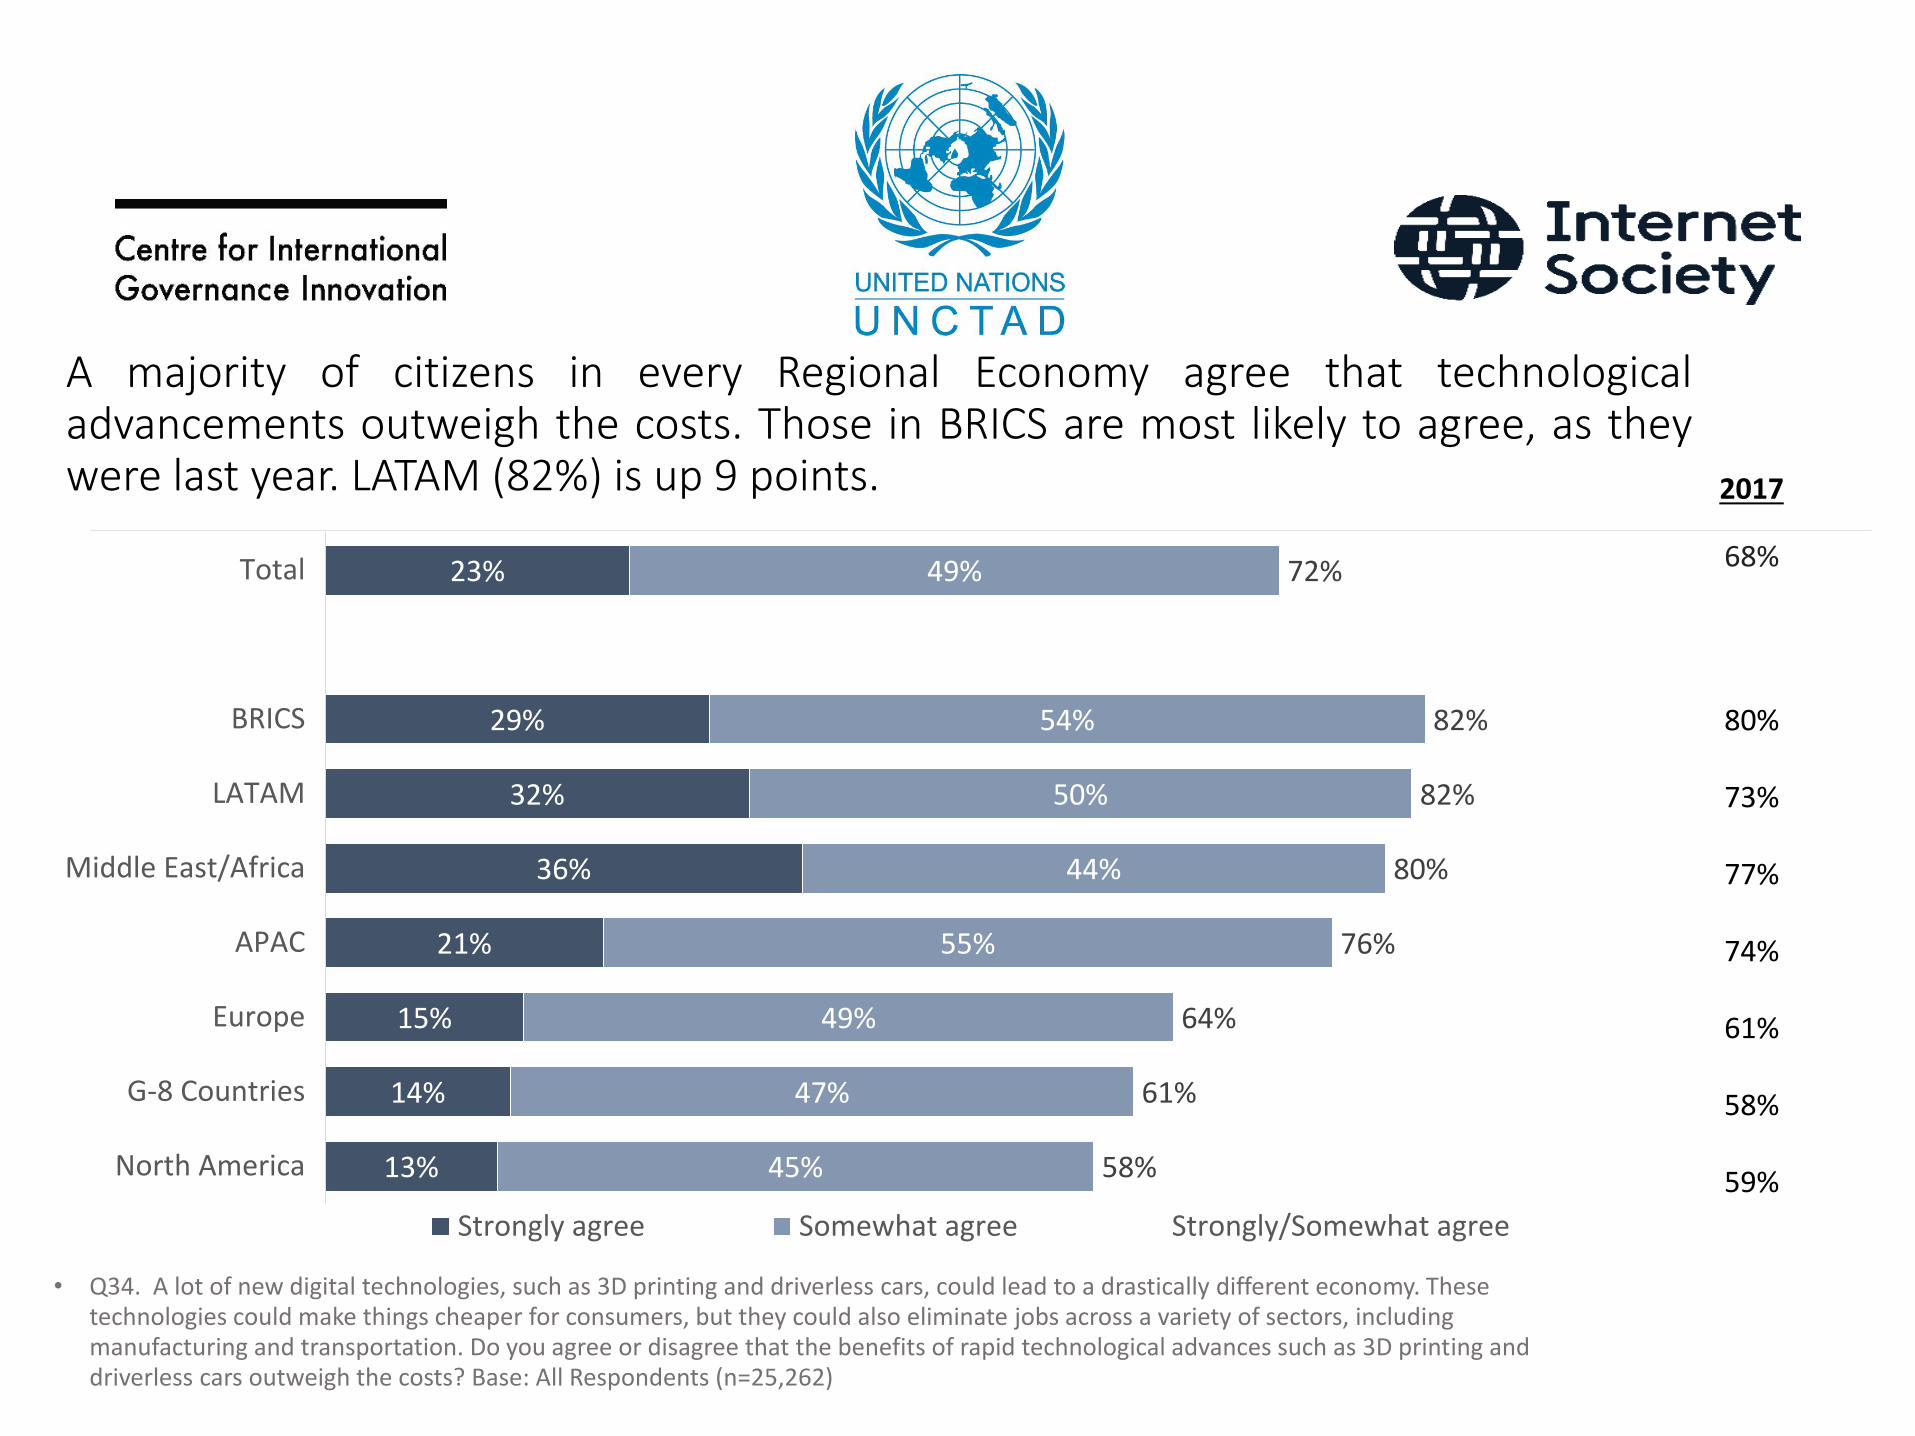
A majority of citizens in every Regional Economy agree that technologicaladvancements outweigh the costs. Those in BRICS are most likely to agree, as theywere last year. LATAM (82%) is up 9 points.
• Q34. A lot of new digital technologies, such as 3D printing and driverless cars, could lead to a drastically different economy. These technologies could make things cheaper for consumers, but they could also eliminate jobs across a variety of sectors, including manufacturing and transportation. Do you agree or disagree that the benefits of rapid technological advances such as 3D printing and driverless cars outweigh the costs? Base: All Respondents (n=25,262)
23%
29%
32%
36%
21%
15%
14%
13%
49%
54%
50%
44%
55%
49%
47%
45%
72%
82%
82%
80%
76%
64%
61%
58%
Total
BRICS
LATAM
Middle East/Africa
APAC
Europe
G-8 Countries
North America
Strongly agree Somewhat agree Strongly/Somewhat agree
2017
68%
80%
73%
77%
74%
61%
58%
59%
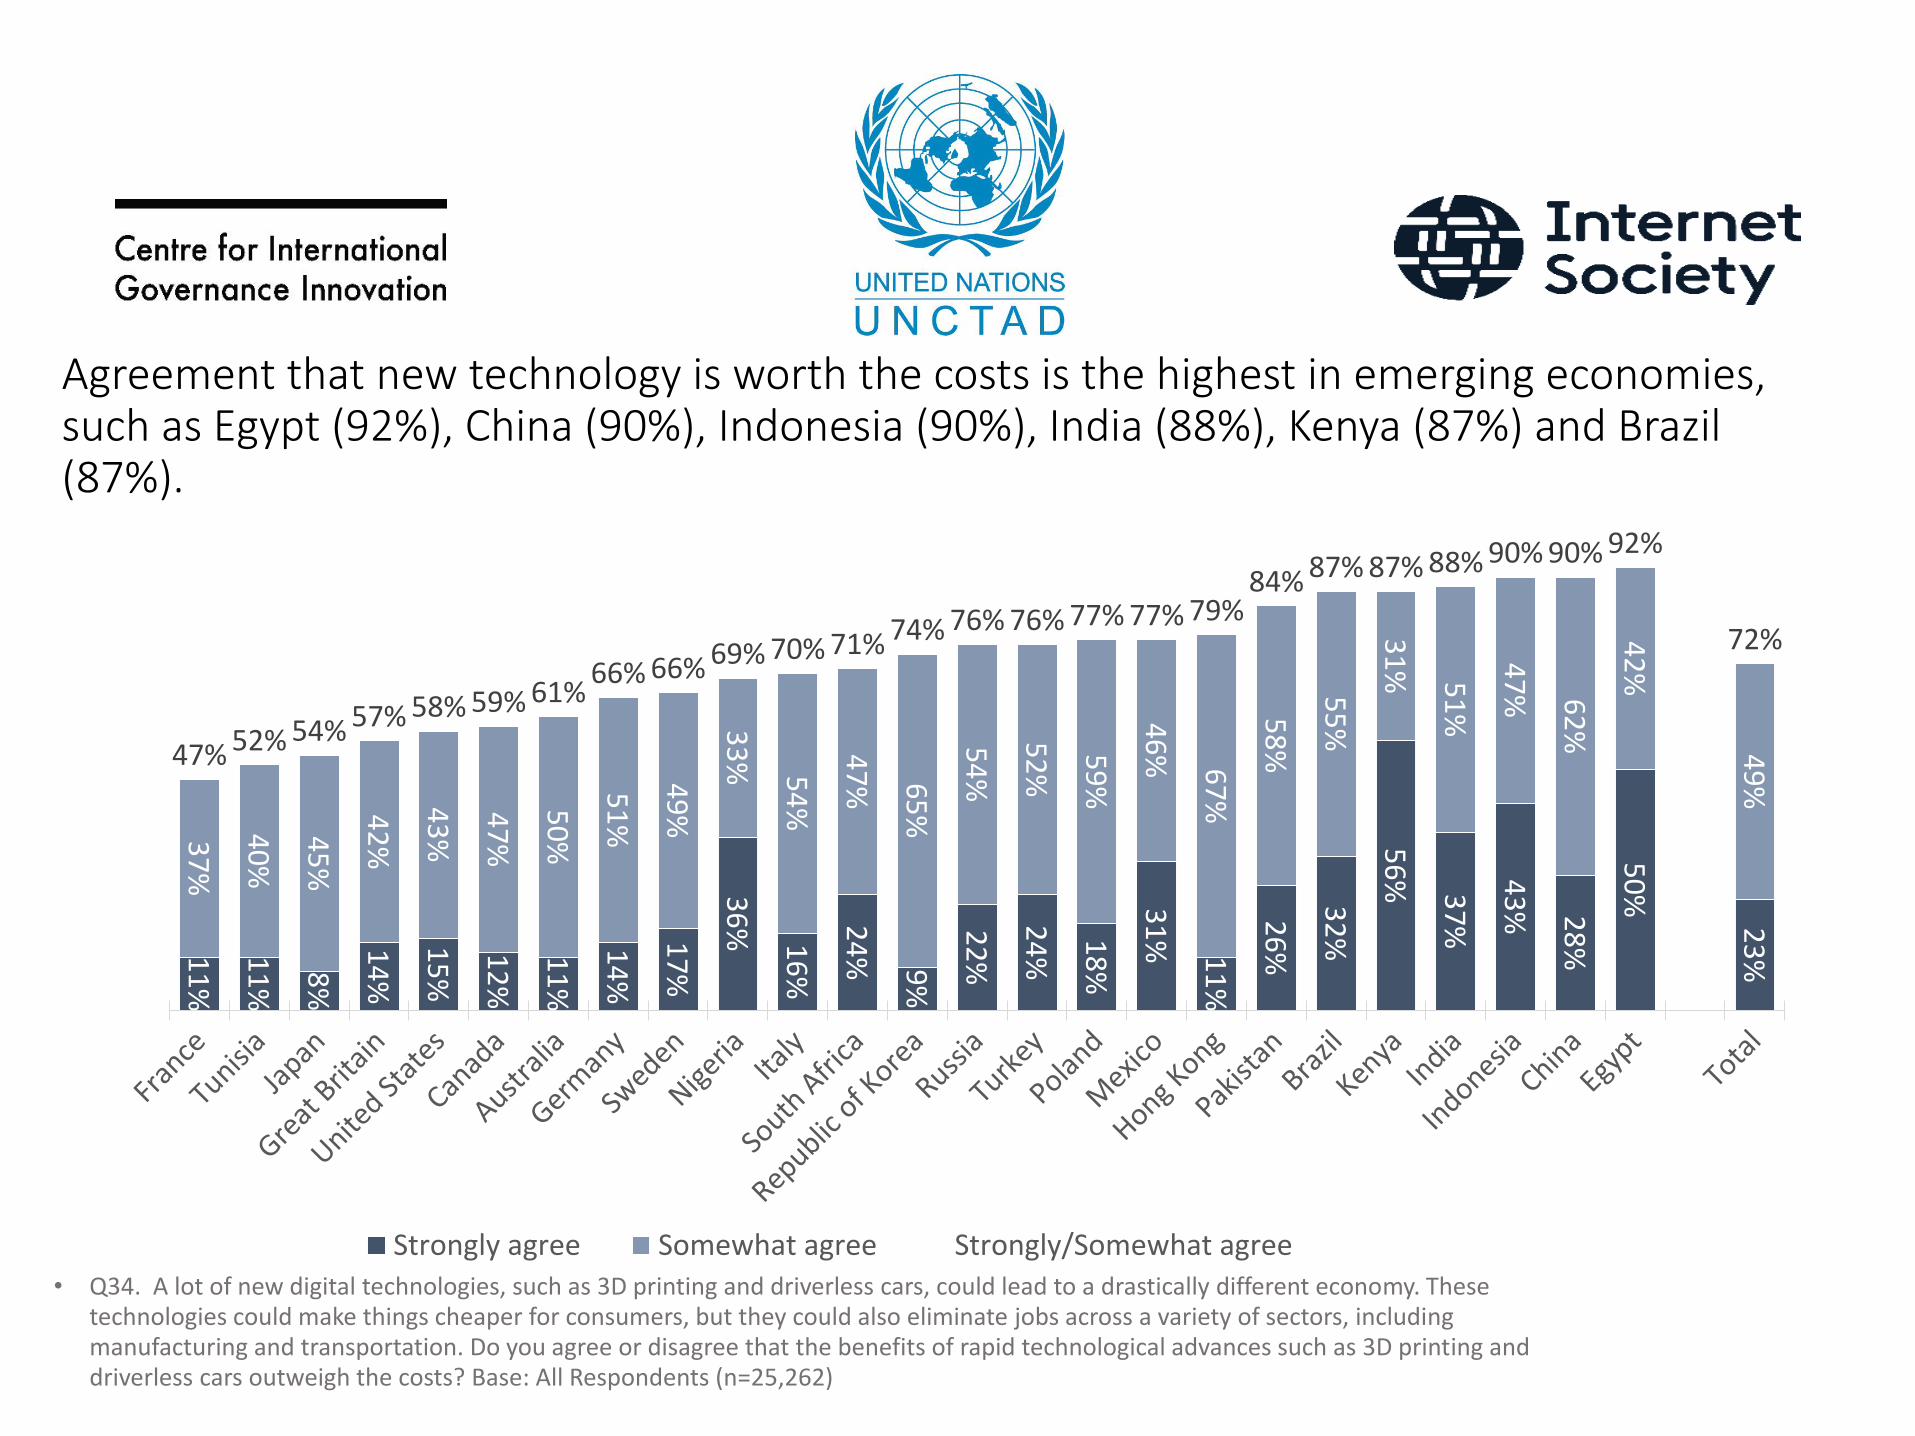
Agreement that new technology is worth the costs is the highest in emerging economies, such as Egypt (92%), China (90%), Indonesia (90%), India (88%), Kenya (87%) and Brazil (87%).
• Q34. A lot of new digital technologies, such as 3D printing and driverless cars, could lead to a drastically different economy. These technologies could make things cheaper for consumers, but they could also eliminate jobs across a variety of sectors, including manufacturing and transportation. Do you agree or disagree that the benefits of rapid technological advances such as 3D printing and driverless cars outweigh the costs? Base: All Respondents (n=25,262)
23
%
50
%
28
%
43
%
37
%
56
%
32
%
26
%11
%
31
%18
%
24
%
22
%9%
24
%16
%
36
%17
%
14
%
11
%
12
%
15
%
14
%8%
11
%
11
%
49
%
42
%
62
%
47
%51
%
31
%
55
%58
%
67
%
46
%59
%
52
%
54
%65
%
47
%54
%
33
%
49
%
51
%50
%
47
%
43
%
42
%45
%
40
%
37
%
72%
92%90%90%88%87%87%84%79%77%77%76%76%74%71%70%69%66%66%
61%59%58%57%54%52%47%
Strongly agree Somewhat agree Strongly/Somewhat agree
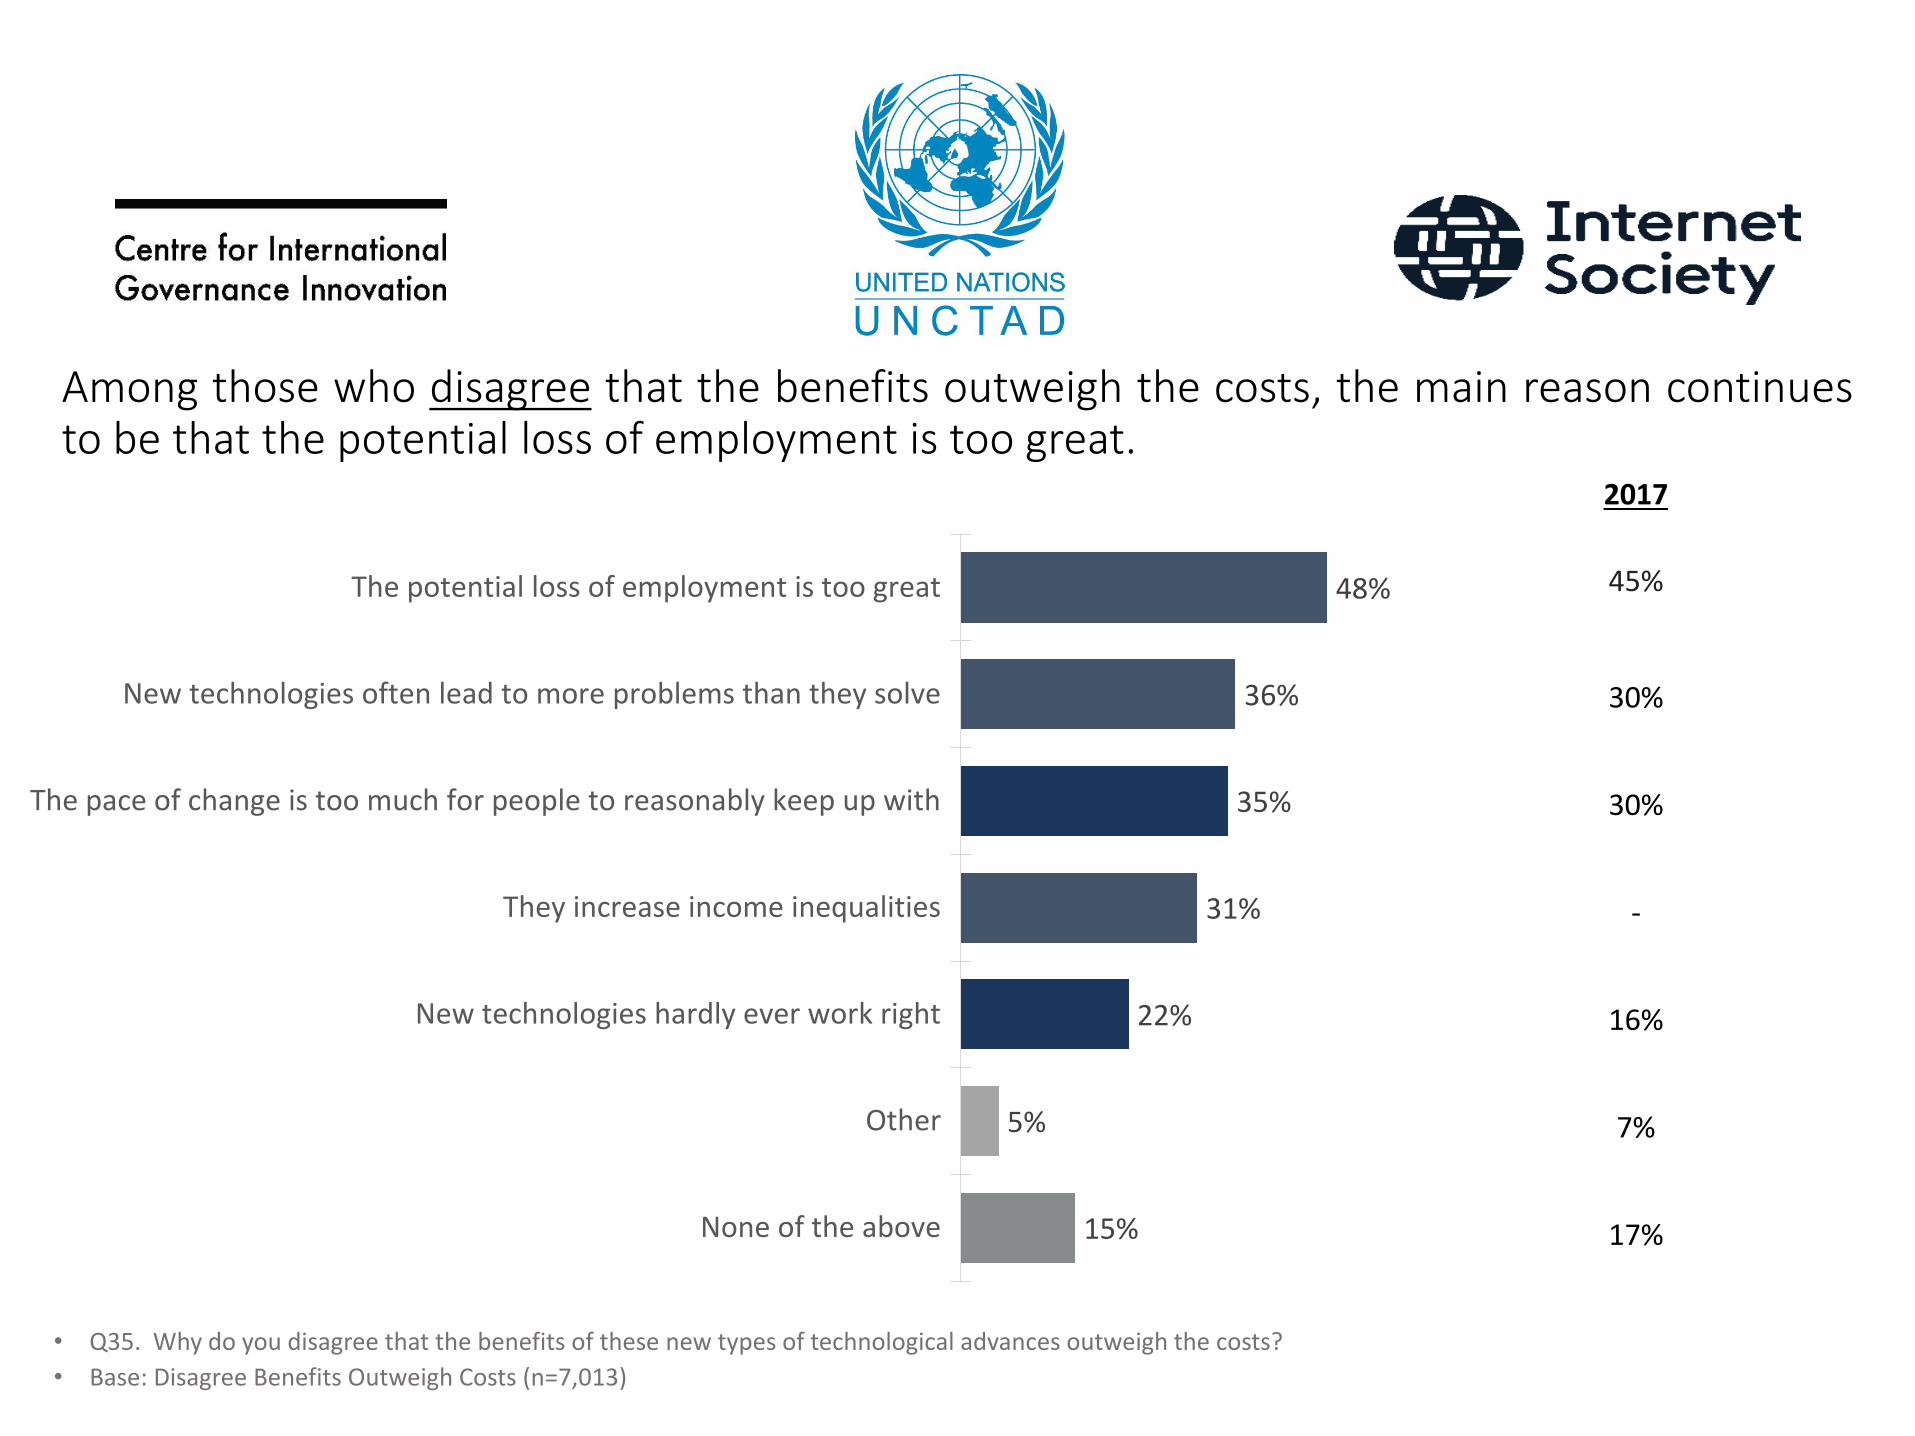
Among those who disagree that the benefits outweigh the costs, the main reason continuesto be that the potential loss of employment is too great.
• Q35. Why do you disagree that the benefits of these new types of technological advances outweigh the costs?
• Base: Disagree Benefits Outweigh Costs (n=7,013)
48%
36%
35%
31%
22%
5%
15%
The potential loss of employment is too great
New technologies often lead to more problems than they solve
The pace of change is too much for people to reasonably keep up with
They increase income inequalities
New technologies hardly ever work right
Other
None of the above
2017
45%
30%
30%
-
16%
7%
17%
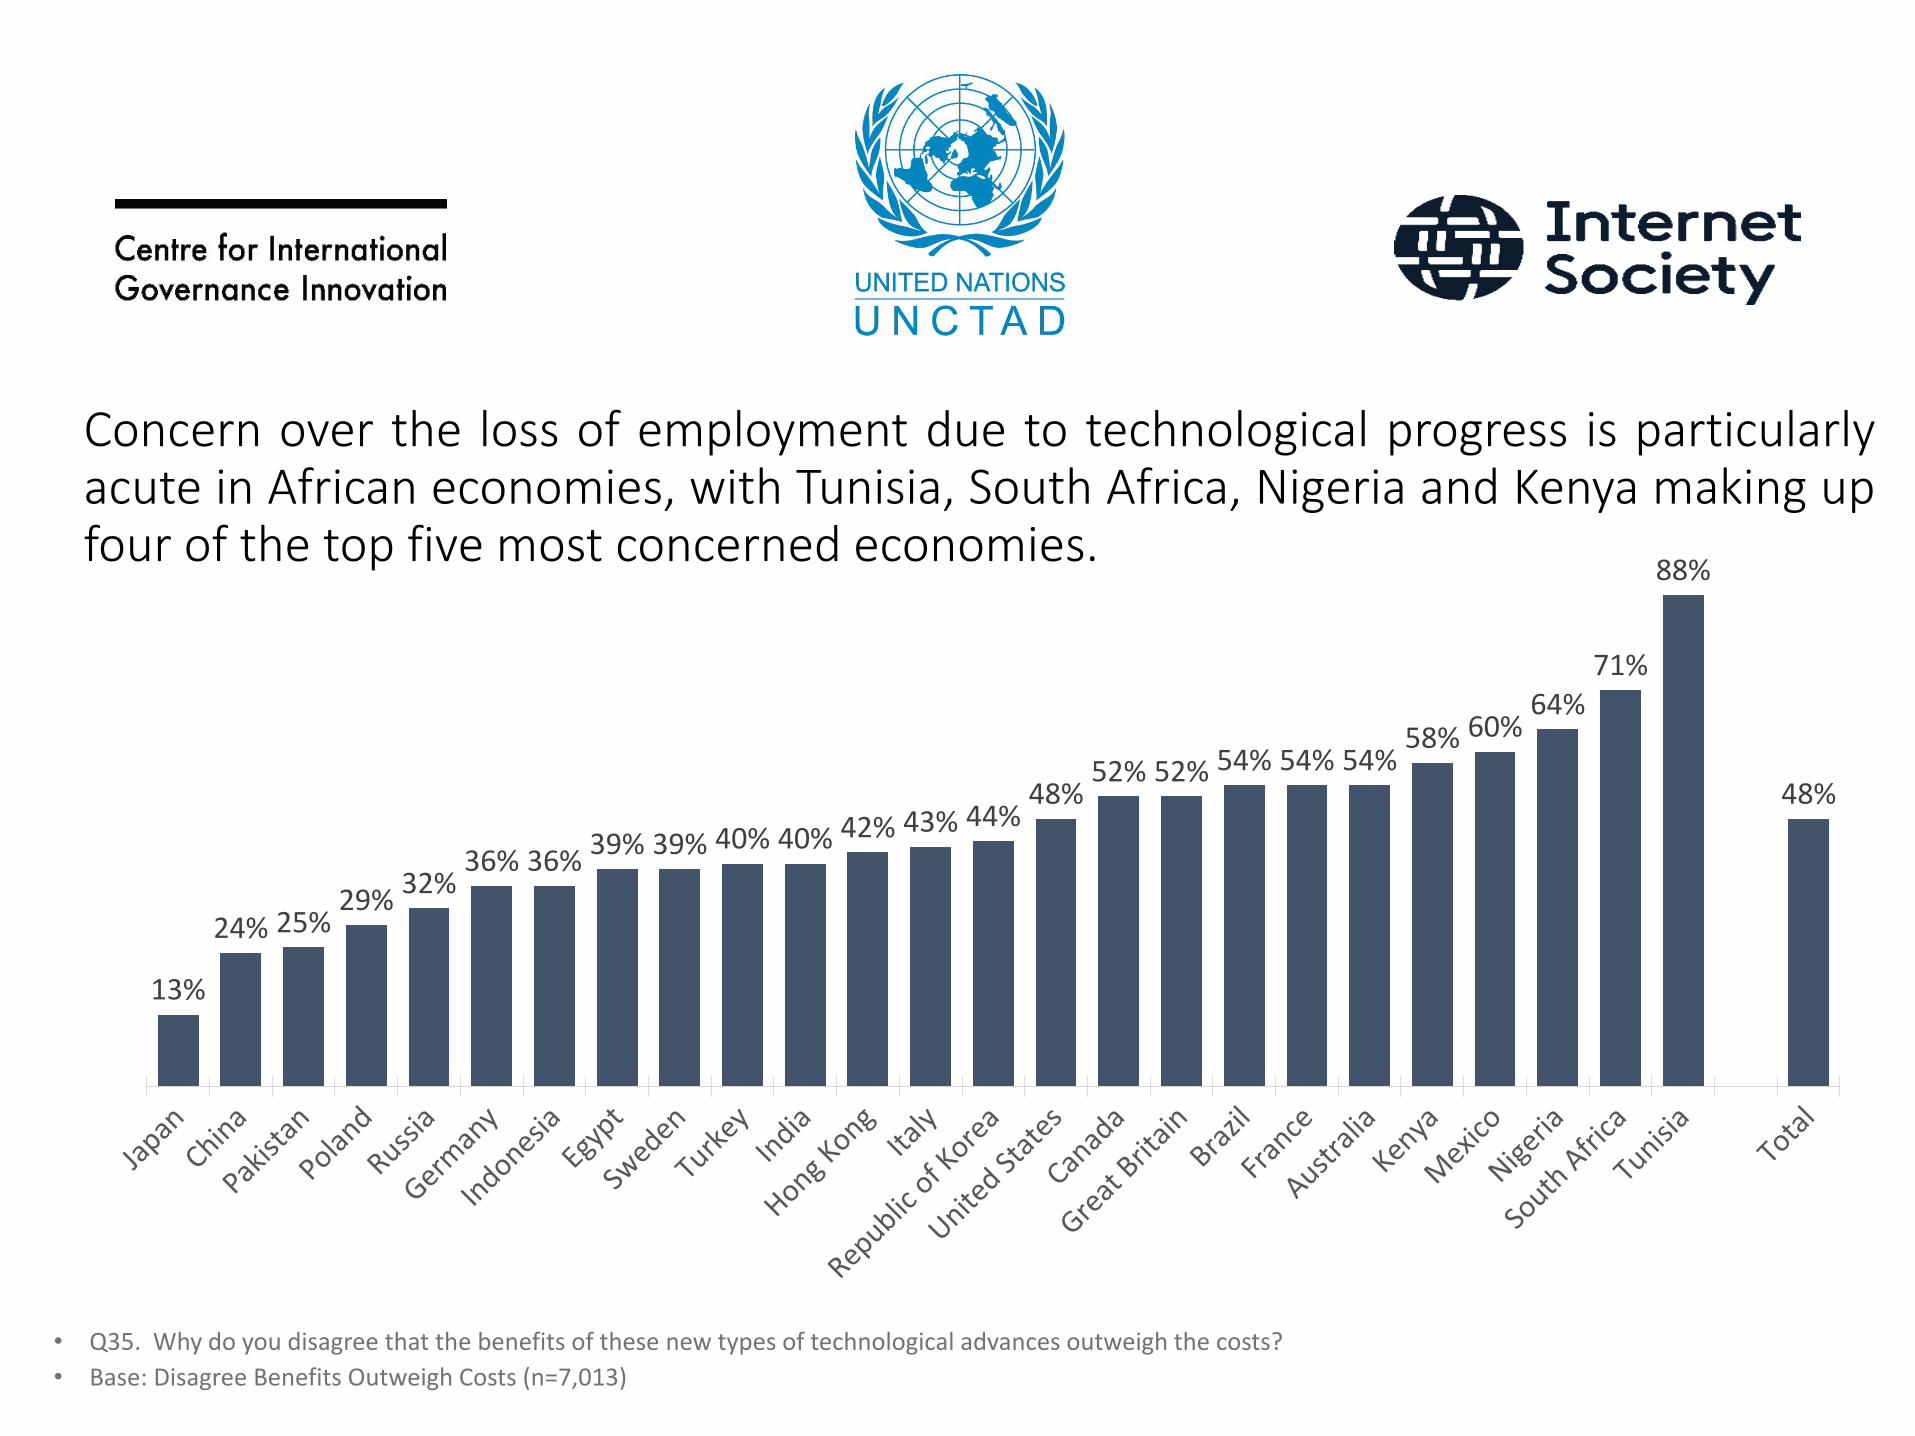
Concern over the loss of employment due to technological progress is particularlyacute in African economies, with Tunisia, South Africa, Nigeria and Kenya making upfour of the top five most concerned economies.
• Q35. Why do you disagree that the benefits of these new types of technological advances outweigh the costs?
• Base: Disagree Benefits Outweigh Costs (n=7,013)
48%
88%
71%64%
60%58%54%54%54%52%52%
48%44%43%42%40%40%39%39%
36%36%32%
29%25%24%
13%
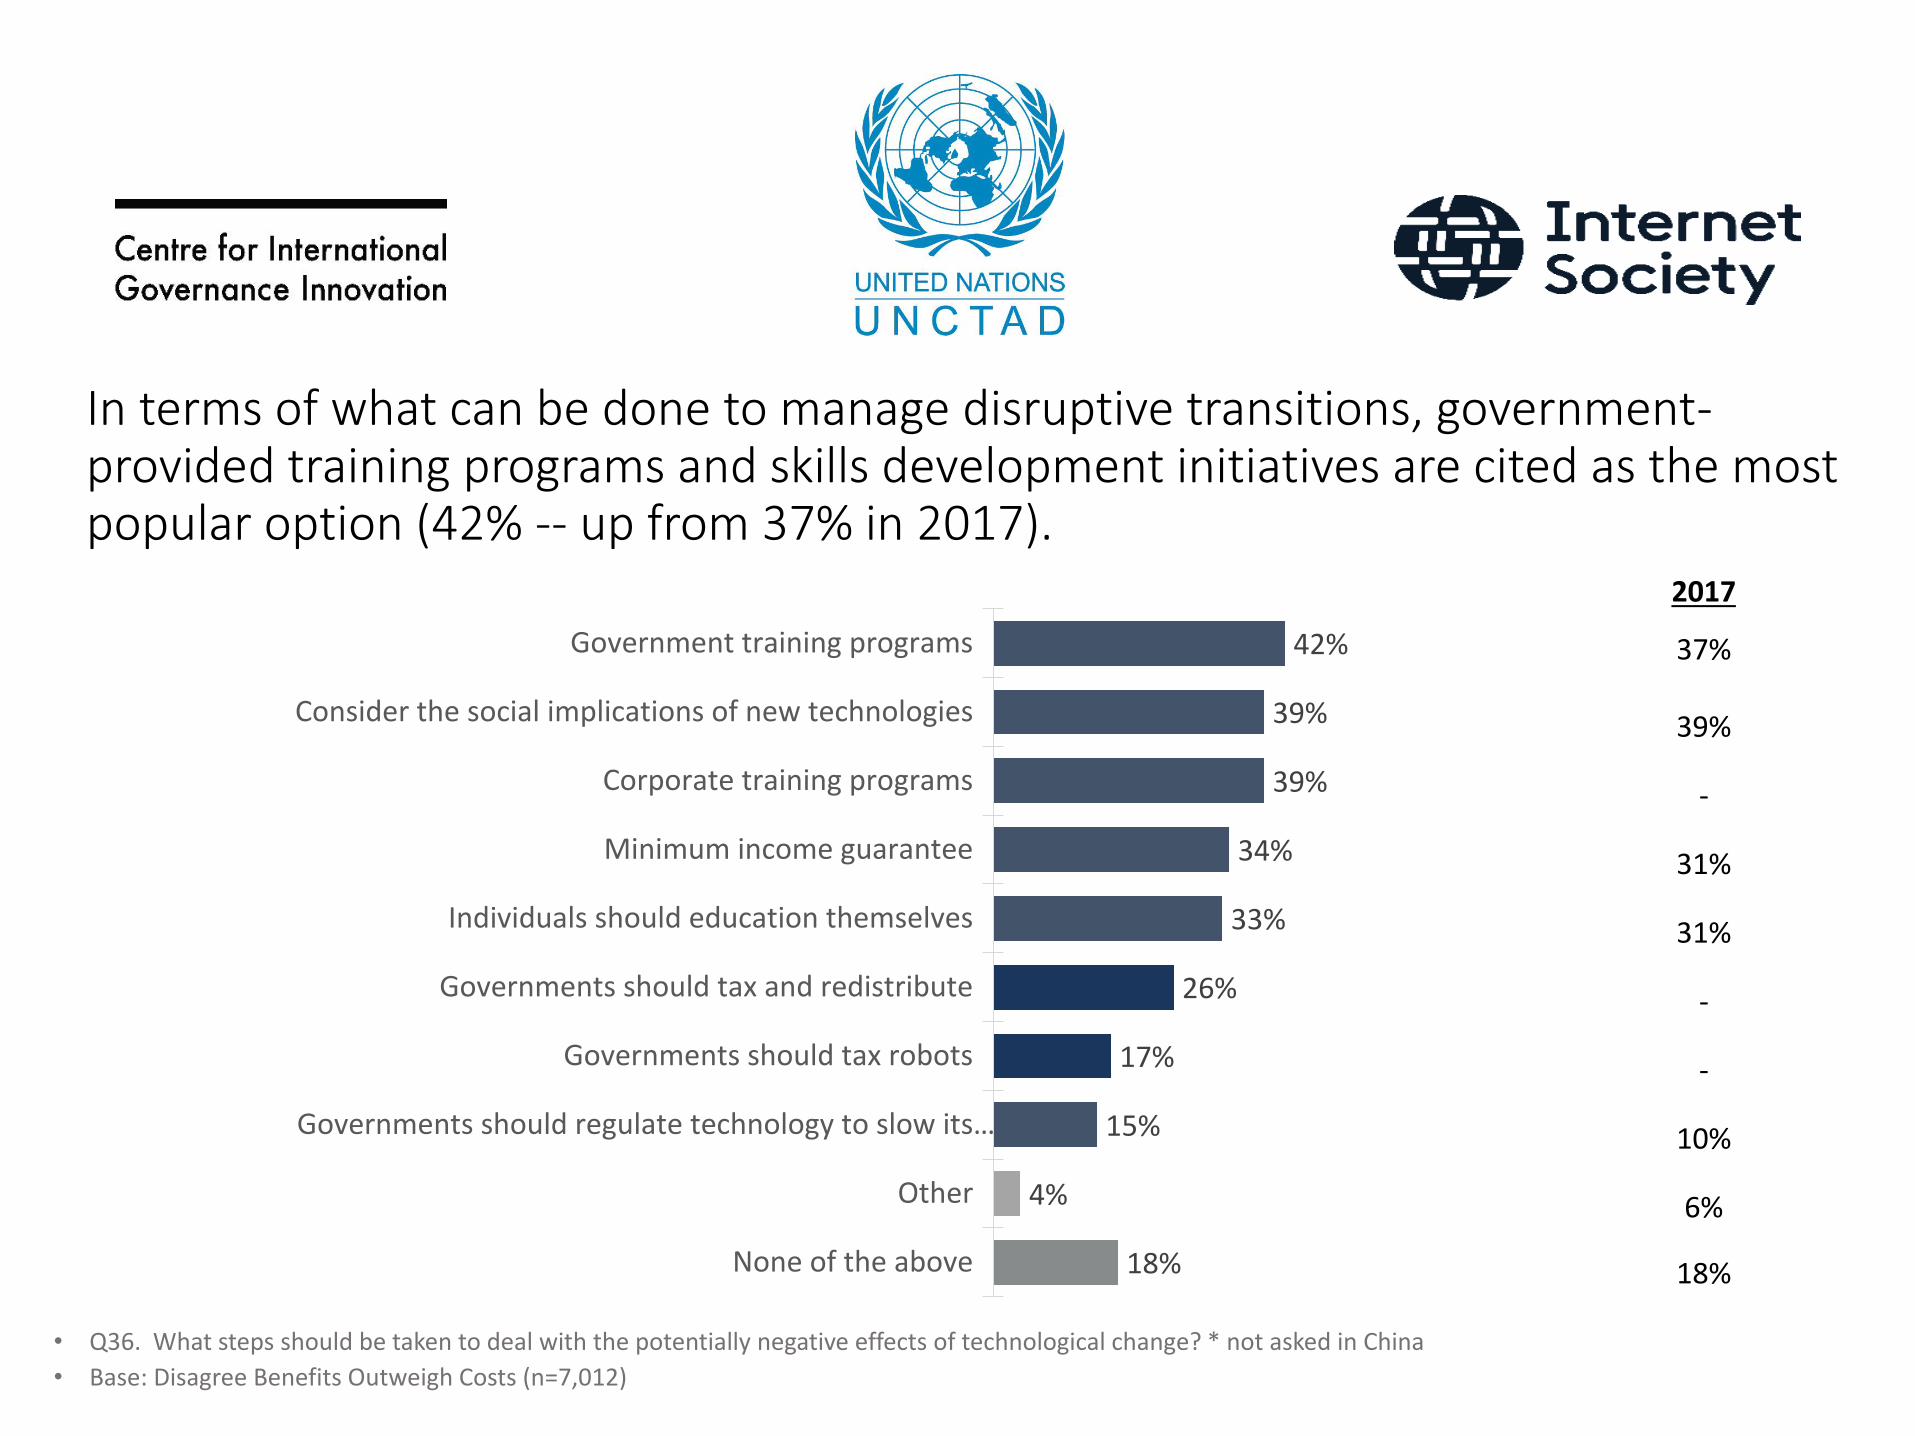
In terms of what can be done to manage disruptive transitions, government-provided training programs and skills development initiatives are cited as the most popular option (42% -- up from 37% in 2017).
42%
39%
39%
34%
33%
26%
17%
15%
4%
18%
Government training programs
Consider the social implications of new technologies
Corporate training programs
Minimum income guarantee
Individuals should education themselves
Governments should tax and redistribute
Governments should tax robots
Governments should regulate technology to slow its…
Other
None of the above
• Q36. What steps should be taken to deal with the potentially negative effects of technological change? * not asked in China
• Base: Disagree Benefits Outweigh Costs (n=7,012)
2017
37%
39%
-
31%
31%
-
-
10%
6%
18%

Developed Economies generally want to tax and spend, while emerging economies generallywant to cut taxes to facilitate growth and create jobs
30%
38%
36%
35%
32%
24%
23%
21%
34%
41%
37%
38%
39%
32%
28%
26%
36%
22%
26%
27%
29%
44%
49%
53%
Total
North America
G-8 Countries
Europe
APAC
BRICS
Middle East/Africa
LATAM
Governments should increase taxes on technology companies in order to help pay for social programs and services
Governments should keep tax levels on technology companies where they are
Governments should lower taxes on technology companies in order to encourage growth and create jobs
• Q42 Which of the following statements is closest to your point of view Base: All Respondents (n=25,259)
67 Erb Street West, Waterloo, ON, Canada N2L 6C2Telephone +1 519 885 2444Cell +1 519 239 5588
Thank you.