global technology ipo review full-year and q4 2014 - pwc · global technology ipo review full-year...
TRANSCRIPT

www.pwc.com
Global Technology IPO Review Full-year and Q4 2014
Technology Institute
A quarterly look at global trends in the technology IPO market
January 2015

Global Technology IPO Review Full-year and Q4 2014 1
Best year of the decade for global technology IPOs*
Raman Chitkara
Partner and Global Technology Industry Leader PricewaterhouseCoopers LLP [email protected]
Welcome to the full-year and fourth quarter 2014 issue of PwC’s Global Technology IPO Review. The year 2014 was a very exciting year for technology IPOs globally. The IPO
landscape witnessed some unique events:
Largest IPO ever of Alibaba.com raising US$21.8 billion
Highest proceeds of US$51.2 billion being raised in the last ten years and more than
the combined proceeds of the past three years (2011-2013 US$50.5 billion)
Record number of 118 listings
Broad global participation by 19 countries
Even amidst geopolitical challenges in Russia, Ukraine and the Middle East, technology IPO activity remained unfettered.
This year also witnessed the comeback of Chinese listings and the re-emergence of Europe
on the technology IPO map. Overall, Chinese technology IPOs dominated the 2014 IPO scene, surpassing the US with 45 versus 37 listings. However, the US exchanges (NYSE
and NASDAQ) maintained the number one global position with 56 versus 34 listings. In
the US, the NYSE brought 15% more technology companies public than NASDAQ (30 versus 26).
The Internet Software & Services subsector emerged as the clear favorite, not only in 2014
but also during the entire period of 2011-2014, while Software held the second spot since 2012. This year the Semiconductor subsector also made a comeback with the lifting of the
IPO freeze in China by the China Securities Regulatory Commission (CSRC).
The number of cross-border listings increased in 2014 though they declined in percentage terms, and US exchanges were the top favorite for companies listing outside their
domicile nation.
Though valuations for private companies remain quite high, thus depressing the need for capital from the public markets, the positive sentiment generated by the high-performing
technology IPOs in 2014, the surge in fourth quarter IPOs (34 versus 18 in the third
quarter) and the continued strength of the capital markets fuels anticipation that the 2015 technology IPO market will stay at a healthy pace.
If you would like to discuss these findings and how they may impact your business, please
reach out to me or any member of our global technology team listed at the back of this document.
Sincerely,
Raman Chitkara
Global Technology Industry Leader
*Issue size greater than US$40 million (includes overallotment) and based on trade date


Global Technology IPO Review Full-year and Q4 2014 3
Contents
Executive summary 4
Driven by Alibaba, the second half of 2014 surged 5
Chinese technology IPOs return in 2014 6
E-commerce growth and innovation have kept Internet Software & Services and Software ahead of all 8
Full-year 2014 technology IPO summary 9
Geographic distribution 11
Subsector distribution 16
Stock exchange distribution 21
Cross-border listings 22
Technology IPO listing detail 23
2010-2014 technology IPO summary 26
Summary by subsector 27
Q4 2014 technology IPO summary 31
Top 10 technology IPOs 32
Geographic distribution 33
Subsector distribution 39
Stock exchange distribution 40
Cross-border listings 43
Key financials 44
Valuation metrics 48
Top three subsectors in Q4 2014 50
Methodology 62
Contacts 63
About PwC’s Technology Institute 64
About PwC 64

4 Global Technology IPO Review Full-year and Q4 2014
Executive summary Following a lackluster performance during 2011 through 2013, the global technology IPO
market posted its best year of the decade in 2014, with the highest number of offerings (118)
and highest proceeds (US$51.2bn).
Year over year, total proceeds jumped by 347% and the number of deals grew by 84%. During
the period 2010-2014, total proceeds of US$119.6bn were raised from 447 deals—2014 alone
contributed 43% of the proceeds and 26% of the deals. Strong capital markets, relatively low volatility during most of 2014, the reopening of the Chinese exchanges and improvements in
Europe all contributed to the strong performance.
In 2014 we also saw much broader global participation with 19 countries across 16 exchanges—this was also the highest for the period 2010-2014. Despite geopolitical incidents
creating global market tensions, the technology IPO market showed resilience.
Figure 1: Technology IPOs 2010–2014
Source: Dealogic with analysis by PwC.
"What's impressive about 2014 results is not just that it was the best technology IPO market of the decade, but that there was such broad participation across the globe with 16 exchanges and companies from 19 countries. There is great excitement about the opportunities technology is bringing to all industries as is evident from the strong investor enthusiasm for IPOs of technology companies." −Raman Chitkara Global Technology Industry Leader, PwC
$17,952 $15,857
$23,155
$11,446
$51,193
$29,426
109
87 69
64
118 117
0
20
40
60
80
100
120
140
0
10,000
20,000
30,000
40,000
50,000
60,000
2010 2011 2012 2013 2014 2014 w/oAlibaba
Nu
mb
er
of
IPO
s
In U
S$m
n
Total proceeds (US$mn) Total number of deals
Global Technology IPO Review Full-year and Q4 2014 5
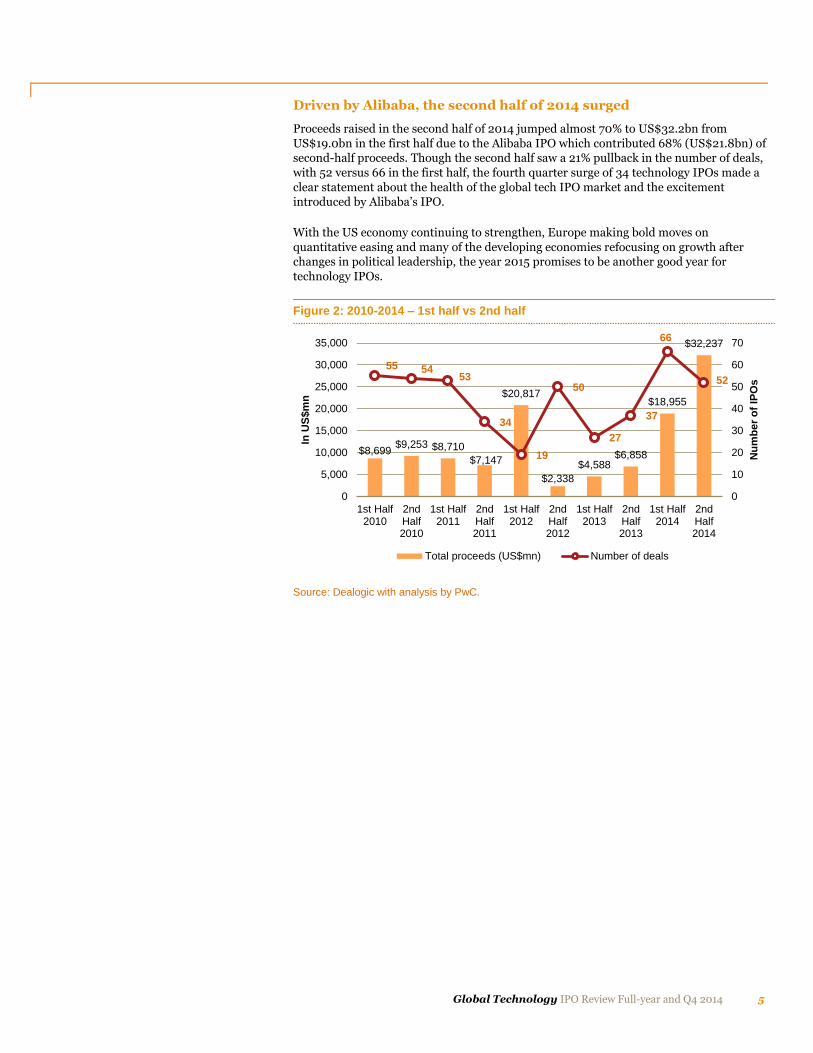
Driven by Alibaba, the second half of 2014 surged
Proceeds raised in the second half of 2014 jumped almost 70% to US$32.2bn from
US$19.0bn in the first half due to the Alibaba IPO which contributed 68% (US$21.8bn) of second-half proceeds. Though the second half saw a 21% pullback in the number of deals,
with 52 versus 66 in the first half, the fourth quarter surge of 34 technology IPOs made a
clear statement about the health of the global tech IPO market and the excitement introduced by Alibaba’s IPO.
With the US economy continuing to strengthen, Europe making bold moves on
quantitative easing and many of the developing economies refocusing on growth after changes in political leadership, the year 2015 promises to be another good year for
technology IPOs.
Figure 2: 2010-2014 – 1st half vs 2nd half
Source: Dealogic with analysis by PwC.
$8,699 $9,253 $8,710
$7,147
$20,817
$2,338
$4,588 $6,858
$18,955
$32,237
55 54 53
34
19
50
27
37
66
52
0
10
20
30
40
50
60
70
0
5,000
10,000
15,000
20,000
25,000
30,000
35,000
1st Half2010
2ndHalf2010
1st Half2011
2ndHalf2011
1st Half2012
2ndHalf2012
1st Half2013
2ndHalf2013
1st Half2014
2ndHalf2014
Nu
mb
er
of
IPO
s
In U
S$m
n
Total proceeds (US$mn) Number of deals
6 Global Technology IPO Review Full-year and Q4 2014
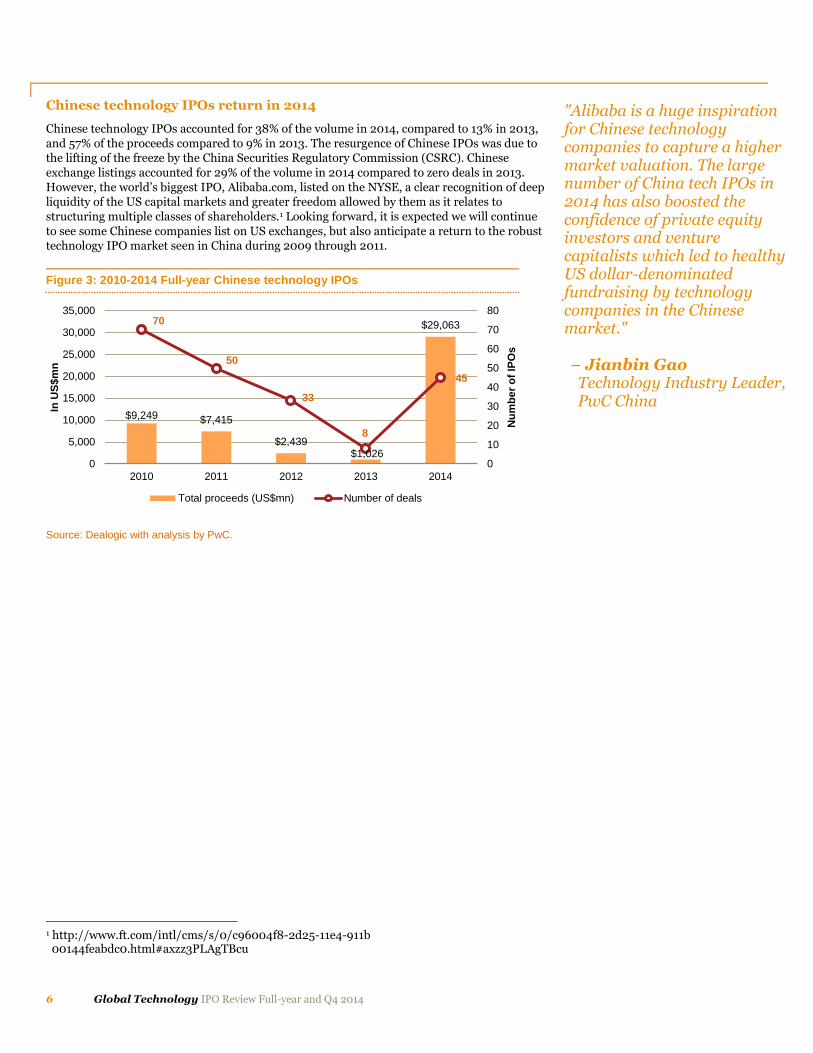
Chinese technology IPOs return in 2014
Chinese technology IPOs accounted for 38% of the volume in 2014, compared to 13% in 2013,
and 57% of the proceeds compared to 9% in 2013. The resurgence of Chinese IPOs was due to the lifting of the freeze by the China Securities Regulatory Commission (CSRC). Chinese
exchange listings accounted for 29% of the volume in 2014 compared to zero deals in 2013.
However, the world’s biggest IPO, Alibaba.com, listed on the NYSE, a clear recognition of deep liquidity of the US capital markets and greater freedom allowed by them as it relates to
structuring multiple classes of shareholders.1 Looking forward, it is expected we will continue
to see some Chinese companies list on US exchanges, but also anticipate a return to the robust technology IPO market seen in China during 2009 through 2011.
Figure 3: 2010-2014 Full-year Chinese technology IPOs
Source: Dealogic with analysis by PwC.
1 http://www.ft.com/intl/cms/s/0/c96004f8-2d25-11e4-911b 00144feabdc0.html#axzz3PLAgTBcu
$9,249 $7,415
$2,439 $1,026
$29,063 70
50
33
8
45
0
10
20
30
40
50
60
70
80
0
5,000
10,000
15,000
20,000
25,000
30,000
35,000
2010 2011 2012 2013 2014
Nu
mb
er
of
IPO
s
In U
S$m
n
Total proceeds (US$mn) Number of deals
"Alibaba is a huge inspiration for Chinese technology companies to capture a higher market valuation. The large number of China tech IPOs in 2014 has also boosted the confidence of private equity investors and venture capitalists which led to healthy US dollar-denominated fundraising by technology companies in the Chinese market." − Jianbin Gao Technology Industry Leader, PwC China

Global Technology IPO Review Full-year and Q4 2014 7
Europe and Japan make a comeback despite difficult market conditions
The European technology IPO market made a comeback in 2014, raising US$6.8bn from
14 offerings, compared to US$1.5bn from eight offerings in 2013. During the period 2010-2012, Europe had been a witness to falling proceeds and listings, but this trend started
reversing in 2013 and accelerated in 2014.
The UK was the leading country seeing seven deals with total proceeds of US$3.3bn (48%). The European region witnessed participation from a total of eight countries
(Belgium, France, Germany, Ireland, Luxembourg, Netherlands, Norway and the UK)
compared to five countries (France, Germany, Luxembourg, Switzerland and the UK) in 2013.
Figure 4: 2010-2014 Full-year European technology IPOs
Source: Dealogic with analysis by PwC.
Japan had four technology IPOs raising US$4.2bn, compared to three deals raising
US$321mn in 2013. The largest deal was Japan Display Inc, which raised proceeds of US$3bn in the first quarter of 2014.
Figure 5: 2010-2014 Full-year Japanese technology IPOs
Source: Dealogic with analysis by PwC.
$4,532
$1,846
$352
$1,485
$6,773
6 6
3
8
14
0
2
4
6
8
10
12
14
16
0
1,000
2,000
3,000
4,000
5,000
6,000
7,000
8,000
2010 2011 2012 2013 2014
Nu
mb
er
of
IPO
s
In U
S$m
n
Issue size (US$ mn) Number of IPOs (Right axis)
$66
$1,171
$48 $321
$4,221
1
1 1
3
4
0.0
0.5
1.0
1.5
2.0
2.5
3.0
3.5
4.0
4.5
0
500
1,000
1,500
2,000
2,500
3,000
3,500
4,000
4,500
2010 2011 2012 2013 2014
Nu
mb
er
of
IPO
s
In U
S$m
n
Issue size (US$ mn) Number of IPOs (Right axis)
"Although you probably have noticed a bit of volatility in the European market in 2014, we continue to see healthy investor interest as the economy recovers. This is especially true for the technology sector where a number of thriving startup centers, such as Berlin, have developed." −Werner Ballhaus European Technology Industry Leader, PwC Germany

8 Global Technology IPO Review Full-year and Q4 2014
E-commerce growth and innovation have kept Internet Software & Services and Software ahead of all
From the subsector perspective, the Internet Software & Services and Software subsectors together have raised the highest proceeds, contributing 79% of the total proceeds and 69% of
the total deals, as compared to 64% of the proceeds and 66% of deals in 2013. The two
subsectors have consistently held their place in the last five years, driven by the rapid increase in e-commerce and innovations in mobile and social. Given the growth in the digital economy,
it is expected that these two sectors will remain the favorites for some time to come.
Global Technology IPO Review Full-year and Q4 2014 9
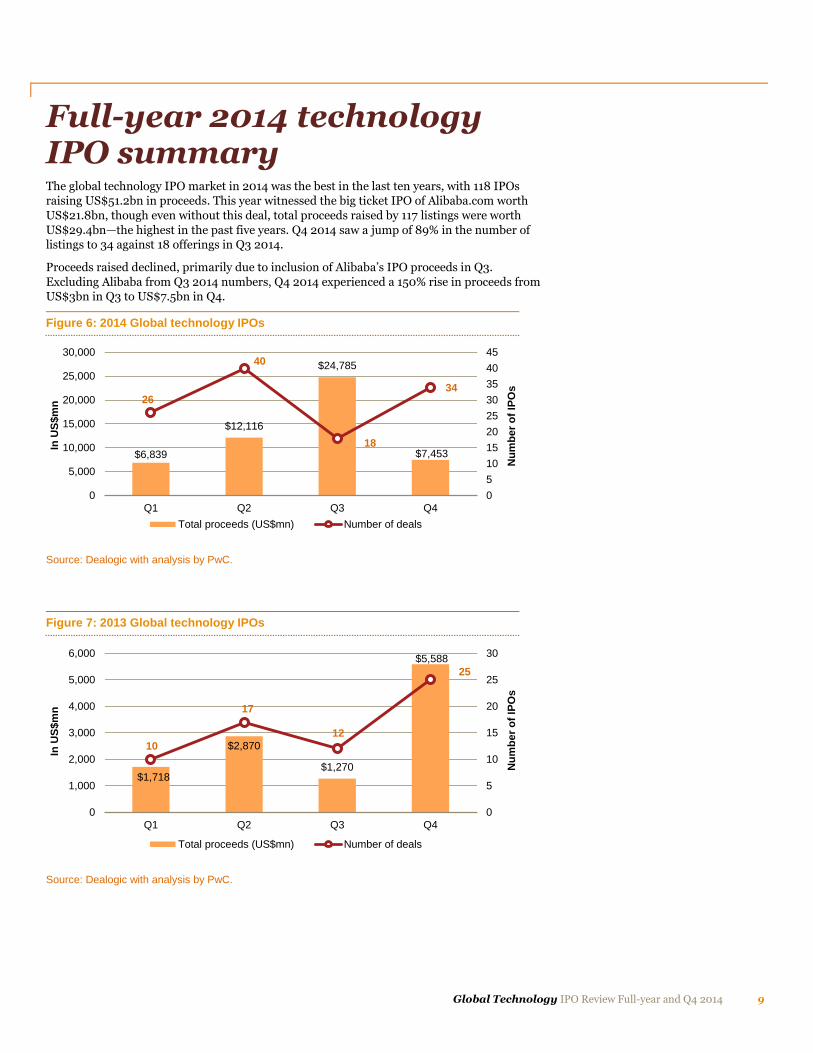
Full-year 2014 technology IPO summary The global technology IPO market in 2014 was the best in the last ten years, with 118 IPOs raising US$51.2bn in proceeds. This year witnessed the big ticket IPO of Alibaba.com worth
US$21.8bn, though even without this deal, total proceeds raised by 117 listings were worth
US$29.4bn—the highest in the past five years. Q4 2014 saw a jump of 89% in the number of listings to 34 against 18 offerings in Q3 2014.
Proceeds raised declined, primarily due to inclusion of Alibaba’s IPO proceeds in Q3.
Excluding Alibaba from Q3 2014 numbers, Q4 2014 experienced a 150% rise in proceeds from US$3bn in Q3 to US$7.5bn in Q4.
Figure 6: 2014 Global technology IPOs
Source: Dealogic with analysis by PwC.
Figure 7: 2013 Global technology IPOs
Source: Dealogic with analysis by PwC.
$6,839
$12,116
$24,785
$7,453
26
40
18
34
0
5
10
15
20
25
30
35
40
45
0
5,000
10,000
15,000
20,000
25,000
30,000
Q1 Q2 Q3 Q4N
um
be
r o
f IP
Os
In U
S$m
n
Total proceeds (US$mn) Number of deals
$1,718
$2,870
$1,270
$5,588
10
17
12
25
0
5
10
15
20
25
30
0
1,000
2,000
3,000
4,000
5,000
6,000
Q1 Q2 Q3 Q4
Nu
mb
er
of
IPO
s
In U
S$m
n
Total proceeds (US$mn) Number of deals

10 Global Technology IPO Review Full-year and Q4 2014
Source: Dealogic with analysis by PwC.
Figure 8: 2012 Global technology IPOs
$3,039
$17,779
$994 $1,344
30
20
11
8
0
5
10
15
20
25
30
35
0
2,000
4,000
6,000
8,000
10,000
12,000
14,000
16,000
18,000
20,000
Q1 Q2 Q3 Q4
Nu
mb
er
of
IPO
s
In U
S$m
n
Total proceeds (US$mn) Number of deals

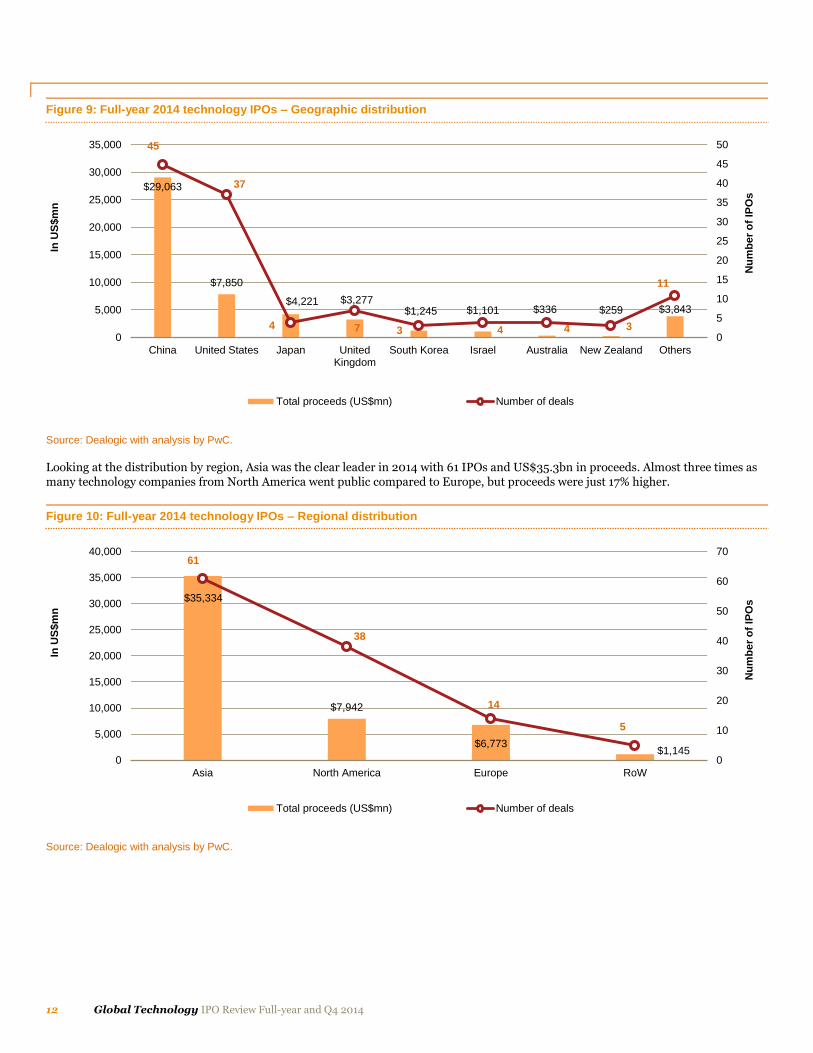
Global Technology IPO Review Full-year and Q4 2014 11
Geographic distribution
In 2014, technology IPOs witnessed the broadest geographic participation of the last five
years. Nineteen countries were represented in 2014 compared to 15 in 2010, 11 in 2011, just 6 in 2012 and 16 in 2013.
China’s re-emergence marked the biggest change in year-over-year activity. With 45 listings
and proceeds worth US$29.1bn in 2014, China surpassed its 2013 figures fourfold (463%) in the number of issues (8) and by 28 times in proceeds (US$1bn). Until 2013, the best year for
China in terms of proceeds and number of technology IPOs was 2010. Chinese companies
raised US$9.2bn from 70 deals in 2010. However, beyond 2010, proceeds from IPOs, and the number of technology companies going public declined the next three years. In 2014, China
raised the highest proceeds in five years, mainly driven by the IPO of Alibaba.
The US was in second place in 2014 with 37 deals and proceeds worth US$7.9bn. Compared to 2013, the growth in number of deals was 6% from 35 deals, while proceeds grew by 3% from
US$7.5bn. In the last five years, the US has experienced consistent growth in technology IPOs.
During the period 2010 to 2014, US technology companies raised proceeds worth US$42.8bn from 147 deals, while Chinese technology companies raised US$49.2bn from 206 deals. The
average deal size of US IPOs was 22% larger than that of the Chinese IPOs.
The UK also joined the ‘billion league’ in 2014 with proceeds of US$3.3bn from seven deals. The UK alone contributed 48% of total proceeds raised by European companies. In 2013, the
UK raised only US$730mn from four deals. The other European countries participating in
2014 were Belgium, France, Germany, Ireland, Luxembourg, the Netherlands and Norway, which helped Europe reach total proceeds worth US$6.8bn.
Japan contributed four IPOs with total proceeds of US$4.2bn, compared to three listings
worth US$321mn in 2013. The two largest offerings in Japan were Japan Display Inc (US$3bn) and Hitachi Maxell Ltd (US$706mn). Both IPOs were listed on the Tokyo Stock
Exchange in Q1 2014, when investor confidence was strong.2
South Korea and Israel also raised over a billion in proceeds with three and four listings raising US$1.2bn and US$1.1bn, respectively. Seven technology companies went public from
Australia (4) and New Zealand (3), raising US$336mn and US$259mn, respectively.
Other countries with one IPO each were Germany (US$2bn), France (US$782mn), Ireland (US$500mn), the Netherlands (US$188mn), Malaysia (US$169mn), Norway (US$107mn),
Belgium (US$96mn), Canada (US$92mn), Luxembourg (US$59mn), South Africa
(US$44mn) and Indonesia (US$42mn).
2 http://www.cnbc.com/id/101978396
“The UK tech market continues to produce good, credible IPO candidates and the pipeline remains strong. Further, the IPOs have been focused on retail, consumer and ‘fintech’, confirming that the UK is a leading tech country for consumer adoption of new technologies.”
− Jass Sarai Technology Industry Leader, PwC UK
12 Global Technology IPO Review Full-year and Q4 2014
Figure 9: Full-year 2014 technology IPOs – Geographic distribution
Source: Dealogic with analysis by PwC.
Looking at the distribution by region, Asia was the clear leader in 2014 with 61 IPOs and US$35.3bn in proceeds. Almost three times as many technology companies from North America went public compared to Europe, but proceeds were just 17% higher.
Figure 10: Full-year 2014 technology IPOs – Regional distribution
Source: Dealogic with analysis by PwC.
$29,063
$7,850
$4,221 $3,277 $1,245 $1,101 $336 $259 $3,843
45
37
4 7 3 4 4 3
11
0
5
10
15
20
25
30
35
40
45
50
0
5,000
10,000
15,000
20,000
25,000
30,000
35,000
China United States Japan UnitedKingdom
South Korea Israel Australia New Zealand Others
Nu
mb
er
of
IPO
s
In U
S$m
n
Total proceeds (US$mn) Number of deals
$35,334
$7,942
$6,773 $1,145
61
38
14
5
0
10
20
30
40
50
60
70
0
5,000
10,000
15,000
20,000
25,000
30,000
35,000
40,000
Asia North America Europe RoW
Nu
mb
er
of
IPO
s
In U
S$m
n
Total proceeds (US$mn) Number of deals

Global Technology IPO Review Full-year and Q4 2014 13
Figure 11: 2010-2014 US technology IPOs
Source: Dealogic with analysis by PwC.
$2,150
$4,926
$20,316
$7,591 $7,850
19
24
32
35 37
0
5
10
15
20
25
30
35
40
0
5,000
10,000
15,000
20,000
25,000
2010 2011 2012 2013 2014
Nu
mb
er
of
IPO
s
In U
S$m
n
Total proceeds (US$mn) Number of deals
"The US technology IPO market continues to be a leader in both number and volume of listings led by e-commerce, SaaS and cloud-based technology offerings. Looking ahead into 2015, the IPO pipeline remains strong indicating significant growth opportunities and momentum." −Alan Jones Deals Partner, PwC US

14 Global Technology IPO Review Full-year and Q4 2014
Figure 12: 2010-2014 Chinese technology IPOs
Source: Dealogic with analysis by PwC.
$9,249 $7,415
$2,439 $1,026
$29,063 70
50
33
8
45
0
10
20
30
40
50
60
70
80
0
5,000
10,000
15,000
20,000
25,000
30,000
35,000
2010 2011 2012 2013 2014N
um
be
r o
f IP
Os
In U
S$m
n
Total proceeds (US$mn) Number of deals
"The volatility of the Chinese capital markets, capricious changes in policy, and complex listing issues have led to many Chinese tech companies favoring US stock exchanges over Chinese domicile exchanges in 2014. However, with the successful launch of the Shanghai-Hong Kong Connect Program in November 2014, Chinese stock markets have become more competitive and should do well in 2015.” − Jianbin Gao Technology Industry Leader, PwC China

Global Technology IPO Review Full-year and Q4 2014 15
Figure 13: 2010-2014 European technology IPOs
Source: Dealogic with analysis by PwC.
Figure 14: 2010-2014 Japanese technology IPOs
Source: Dealogic with analysis by PwC.
$4,532
$1,846
$352
$1,485
$6,773
6 6
3
8
14
0
2
4
6
8
10
12
14
16
0
1,000
2,000
3,000
4,000
5,000
6,000
7,000
8,000
2010 2011 2012 2013 2014
Nu
mb
er
of
IPO
s
In U
S$m
n
Total proceeds (US$mn) Number of deals
$66
$1,171
$48
$321
$4,221
1
1
1
3 4
0
1
2
3
4
5
0
500
1,000
1,500
2,000
2,500
3,000
3,500
4,000
4,500
2010 2011 2012 2013 2014
Nu
mb
er
of
IPO
s
In U
S$m
n
Total proceeds (US$mn) Number of deals

16 Global Technology IPO Review Full-year and Q4 2014
Subsector distribution
Internet Software & Services led the subsectors in 2014 with 47 deals raising US$33.5bn. It
was the most active sector during the year, contributing 65% of total proceeds and 40% of total listings as compared to 43% of the proceeds and 38% of total listings in 2013. The sector
was primarily boosted by Alibaba’s IPO which raised the highest proceeds in history.
Excluding Alibaba, Internet Software & Services was still the highest in the group with proceeds of US$11.7bn.
The Software subsector has been maintaining its position as the second most important
technology subsector after Internet Software & Services. It raised US$7.1bn from 35 deals in 2014. The subsector contributed 14% of total proceeds and 30% of the total listings in 2014,
compared to 21% of the proceeds and 28% of the listings in 2013. The largest IPO in this sector
was Markit Ltd from the UK which raised US$1.2bn, while the smallest listing was Cartrack Holdings Limited from South Africa which raised US$44mn.
Computer Storage & Peripherals demonstrated marked improvement in proceeds in 2014, but
not in volume. The subsector raised US$4.7bn from five deals compared to US$1.6bn from eight deals in 2013. A reflection of the market at large, the subsector continues to struggle,
posting no deals during Q4 2014. It accounted for 9% of the total proceeds and 4% of the total
deals during the year. Japan Display Inc from Japan raised the highest proceeds of US$3.1bn, while Hubei Feilihua Quartz Glass Co Ltd from China was the smallest IPO in the sector,
raising US$50mn.
IT Consulting & Services improved in 2014 with proceeds of US$2.2bn from six deals compared to US$538mn from three deals in 2013. The subsector accounted for 4% of the total
proceeds and 5% of total listings. IMS Health Holdings Inc from the US raised the highest
proceeds of US$1.4bn, while Citadel Group Ltd had the smallest issue of US$41mn.
Semiconductors made a comeback in 2014 due in large part to the reopening of the Chinese
IPO market. The subsector raised US$1.8bn and had 12 listings during the year, compared to
US$308mn from four listings in 2013. Of the 12 listings, 10 were Chinese companies that listed in China. The subsector accounted for 4% of the total proceeds and 10% of the total
listings in 2014. Hua Hong Semiconductor Ltd from China raised the highest proceeds of
US$332mn, while Jiangsu Pacific Quartz Co Ltd had the smallest issue of US$59mn.
Communications Equipment was the only sector which witnessed a drop in total proceeds in
2014 when compared to 2013. The subsector raised total proceeds of US$1.1bn from nine
listings during the current year, while in 2013 it raised US$1.5bn from five listings. In 2014, it accounted for 2% of the total proceeds raised and 8% of the total listings. The average deal size
of the subsector declined by 62% in 2014 compared to 2013. The largest deal was from Arista
Networks Inc from the US which raised US$226mn, while the smallest deal was of Link Net PT of Indonesia which raised US$42mn.

Global Technology IPO Review Full-year and Q4 2014 17
Figure 15: Full-year 2014 subsector distribution
Source: Dealogic with analysis by PwC.
Quarterly summary by subsector
Figure 16: Full-year 2014 Internet Software & Services IPOs
Source: Dealogic with analysis by PwC.
$33,491
$7,129
$4,740 $2,222
$1,812 $1,029
$770
47
35
5 6 12
9
4 0
5
10
15
20
25
30
35
40
45
50
0
5,000
10,000
15,000
20,000
25,000
30,000
35,000
40,000
Internet Software& Services
Software ComputerStorage &
Peripherals
IT Consulting &Services
Semiconductors CommunicationsEquipment
Others
Nu
mb
er
of
IPO
s
In U
S$m
n
Total proceeds (US$mn) Number of deals
$1,775
$5,131
$22,813
$3,772
11
20
6
10
0
5
10
15
20
25
0
5,000
10,000
15,000
20,000
25,000
Q1 2014 Q2 2014 Q3 2014 Q4 2014N
um
be
r o
f IP
Os
In U
S$m
n
Total proceeds (US$mn) Number of deals

18 Global Technology IPO Review Full-year and Q4 2014
Figure 17: Full-year 2014 Software IPOs
Source: Dealogic with analysis by PwC.
Figure 18: Full-year 2014 Computer Storage & Peripherals IPOs
Source: Dealogic with analysis by PwC.
$391
$3,095
$1,272
$2,371
5
11
6
13
0
2
4
6
8
10
12
14
0
500
1,000
1,500
2,000
2,500
3,000
3,500
Q1 2014 Q2 2014 Q3 2014 Q4 2014
Nu
mb
er
of
IPO
s
In U
S$m
n
Total proceeds (US$mn) Number of deals
$3,790
$782
$167 $0
2
1
2
-
0
1
2
3
0
500
1,000
1,500
2,000
2,500
3,000
3,500
4,000
Q1 2014 Q2 2014 Q3 2014 Q4 2014
Nu
mb
er
of
IPO
s
In U
S$m
n
Total proceeds (US$mn) Number of deals

Global Technology IPO Review Full-year and Q4 2014 19
Figure 19: Full-year 2014 Semiconductor IPOs
Source: Dealogic with analysis by PwC.
Figure 20: Full-year 2014 IT Consulting & Services IPOs
Source: Dealogic with analysis by PwC.
$246 $315
$533
$718
2 2
4
4
0
1
2
3
4
5
0
100
200
300
400
500
600
700
800
Q1 2014 Q2 2014 Q3 2014 Q4 2014
Nu
mb
er
of
IPO
s
In U
S$m
n
Total proceeds (US$mn) Number of deals
$210
$1,907
$0 $106
2
2
-
2
0
1
2
3
4
0
500
1,000
1,500
2,000
2,500
Q1 2014 Q2 2014 Q3 2014 Q4 2014
Nu
mb
er
of
IPO
s
In U
S$m
n
Total proceeds (US$mn) Number of deals

20 Global Technology IPO Review Full-year and Q4 2014
Figure 21: Full-year 2014 Communications Equipment IPOs
Source: Dealogic with analysis by PwC.
Figure 22: Full-year 2014 other subsector IPOs
Source: Dealogic with analysis by PwC.
$427
$268
$0
$334
4
2
-
3
0
1
2
3
4
0
50
100
150
200
250
300
350
400
450
Q1 2014 Q2 2014 Q3 2014 Q4 2014
Nu
mb
er
of
IPO
s
In U
S$m
n
Total proceeds (US$mn) Number of deals
$0
$618
$0
$152
-
2
-
2
0
1
2
3
4
0
100
200
300
400
500
600
700
Q1 2014 Q2 2014 Q3 2014 Q4 2014N
um
be
r o
f IP
Os
In U
S$m
n
Total proceeds (US$mn) Number of deals

Global Technology IPO Review Full-year and Q4 2014 21
Stock exchange distribution
US exchanges (NYSE and NASDAQ) accounted for 71% of the total proceeds and 47% of the
total listings in 2014. This was lower than 2013 when the exchanges accounted for 80% of the total proceeds and 70% of the total listings. As noted earlier, the reopening of China’s
IPO market was the primary factor impacting the decline in US share. The US exchanges
together accounted for US$36.1bn and the NYSE listed the big ticket IPO of Alibaba. The NYSE surpassed NASDAQ in both proceeds and number of listings and accounted for 81% of
the proceeds and 54% of the listings in the US.
The NYSE alone raised US$29.4bn from 30 listings, while proceeds from NASDAQ were US$6.8bn from 26 listings. In addition, 27% of the offerings listed on the NYSE were non-US
companies (8) compared to 22% (6) in 2013, while 42% of the companies listed on NASDAQ
in 2014 were non-US companies (11). The average deal size in the US exchanges was US$645mn.
Over the last five years (2010-2014), the number of listings has been gradually rising on the
NYSE while that of NASDAQ has been falling. In 2012, the NYSE overtook NASDAQ in
terms of volume (18 technology company listings versus 16) and in 2013 it surpassed
NASDAQ in both volume and proceeds.
The US exchanges surpassed the Chinese exchanges (Shenzhen, Shanghai and Hong Kong) in both volume and proceeds in 2014. Together, the Chinese exchanges raised US$4.1bn
from 34 listings. Compared to the US exchanges, the Chinese exchanges saw smaller IPOs
with an average deal size of US$119mn, whereas the US exchanges had an average deal size of US$645mn. The Hong Kong exchange accounted for 38% of total proceeds raised in
China, which was the highest among the three Chinese exchanges. The Shenzhen exchange
accounted for the highest deal volume, contributing 47% of all listings in the Chinese exchanges. No foreign companies listed in China in 2014.
The London AIM raised US$2.1bn from eight listings in 2014, compared to US$730mn from
four listings in 2013. The first half of the year for European exchanges was positive due in part to US capital investment in European equities.
The Tokyo Stock Exchange, too, showed resilience in 2014 with proceeds of US$4.2bn from
four listings. Though the Japanese economy continues to struggle and officially re-entered recession in the third quarter of 20143, the technology IPO market of Japan bucked the
trend. Three of the four listings were listed in the first half of 2014, when investor confidence
was higher. Only one deal listed in December 2014.
Figure 23: 2014 Stock exchange distribution
Source: Dealogic with analysis by PwC.
3 http://www.nytimes.com/2014/11/17/business/international/defying-expectations-japans-economy-shrinks-further.html?_r=0
$29,369
$6,755
$1,395 $1,106 $1,557 $336 $259
$2,119 $4,221
$4,077
30
26
16
8
10
4 3
8
4 9
0
5
10
15
20
25
30
35
0
5,000
10,000
15,000
20,000
25,000
30,000
35,000
NYSE NASDAQ Shenzhen Shanghai SEHK ASX NZSE LSE Tokyo SE Others
Nu
mb
er
of
IPO
s
In U
S$m
n
Total proceeds (US$mn) Number of deals

22 Global Technology IPO Review Full-year and Q4 2014
Cross-border listings
Cross-border listings in 2014 constituted 18% of the total, with 21 offerings listing on foreign
exchanges. The percentage of cross-border listings rose in 2012 (23%) due to the CSRC action in China, but in 2013 (17%) and 2014 (18%), it returned to prior levels as Chinese tech
companies were not forced to seek out alternate exchanges. Of the 21 cross-border listings in
2014, 52% of the listings were Chinese companies listing on US exchanges (NYSE and NASDAQ). Israel was the next highest with 19% (4) of the listings. Two of Israel’s companies
listed on the NYSE and NASDAQ, while the other two companies listed on the London
exchange. Other cross-border listings included Belgium, Luxembourg, Malaysia, the Netherlands and the UK with one deal each. The US exchanges were the preferred destination
garnering 90% (19) of the cross-border listings.
Figure 24: 2010–2014 Cross-border listings
Source: Dealogic with analysis by PwC.
90 74
53 53
97
19 13
16 11
21
0
20
40
60
80
100
120
140
2010 2011 2012 2013 2014
Domestic deals Cross-border deals
17%
15%
23% 17%
18%

Global Technology IPO Review Full-year and Q4 2014 23
Technology IPO listing detail
Table 1: 2014 IPOs – By issue date
Issue date Company Sector Proceeds (US$ mn)
Primary exchange
Domicile nation
Q1
01/21/2014 Guangdong Qtone Education Co Ltd Internet Software & Services 82 Shenzhen China
01/23/2014 Beijing Forever Technology Co Ltd Software 86 Shenzhen China
01/23/2014 Yangzhou Yangjie Electronic Technology Co Ltd
Semiconductors 66 Shenzhen China
01/24/2014 Care.com, Inc Internet Software & Services 91 NYSE United States
01/27/2014 DigiWin Software Co Ltd Software 103 Shenzhen China
01/27/2014 Shenzhen Ysstech Info-Tech Co Ltd Software 49 Shenzhen China
01/27/2014 Sichuan Troy Information Technology Co Ltd
Communications Equipment 43 Shenzhen China
01/28/2014 Shanghai Amarsoft Information Technology Co Ltd
IT Consulting & Services 67 Shenzhen China
01/28/2014 Beijing Tongtech Co Ltd Software 47 Shenzhen China
01/29/2014 NSFOCUS Information Technology Co Ltd
IT Consulting & Services 143 Shenzhen China
01/29/2014 NetPosa Technologies, Ltd Communications Equipment 121 Shenzhen China
02/10/2014 China Wafer Level CSP Co Ltd Semiconductors 180 Shanghai China
02/28/2014 Varonis Systems, Inc Software 106 NASDAQ United States
03/07/2014 Coupons.com, Inc Internet Software & Services 168 NYSE United States
03/14/2014 Castlight Health, Inc Internet Software & Services 178 NYSE United States
03/18/2014 Hitachi Maxell Ltd Computer Storage & Peripherals
706 Tokyo SE Japan
03/19/2014 Japan Display, Inc Computer Storage & Peripherals
3,084 Tokyo SE Japan
03/19/2014 Paylocity Holding Corp Internet Software & Services 120 NASDAQ United States
03/20/2014 Q2 Holdings, Inc Internet Software & Services 101 NYSE United States
03/21/2014 A10 Networks, Inc Communications Equipment 188 NYSE United States
03/21/2014 Amber Road, Inc Internet Software & Services 96 NYSE United States
03/21/2014 Borderfree, Inc Internet Software & Services 80 NASDAQ United States
03/26/2014 King Digital Entertainment Plc Internet Software & Services 500 NYSE Ireland
03/27/2014 TriNet Group, Inc Internet Software & Services 240 NYSE United States
03/28/2014 2U, Inc Internet Software & Services 119 NASDAQ United States
03/28/2014 Aerohive Networks, Inc Communications Equipment 75 NYSE United States
Q2
04/01/2014 The Rubicon Project, Inc Internet Software & Services 102 NYSE United States
04/03/2014 IMS Health Holdings Inc IT Consulting & Services 1,495 NYSE United States
04/03/2014 GrubHub Inc Internet Software & Services 221 NYSE United States
04/03/2014 Opower Inc Software 133 NYSE United States
04/03/2014 Five9 Inc Internet Software & Services 81 NASDAQ United States
04/03/2014 JUST EAT Plc Internet Software & Services 597 LSE United Kingdom
04/09/2014 BAIOO Family Interactive Limited Internet Software & Services 196 SEHK China
04/14/2014 Paycom Software Inc Internet Software & Services 115 NYSE United States
04/16/2014 Sabre Corp Software 721 NASDAQ United States
04/16/2014 Weibo Corp Internet Software & Services 328 NASDAQ China
04/16/2014 Leju Holdings Limited Internet Software & Services 100 NYSE China
05/07/2014 Cheetah Mobile Inc Software 193 NYSE China
05/08/2014 Tuniu Corp Internet Software & Services 83 NASDAQ China

24 Global Technology IPO Review Full-year and Q4 2014
Issue date Company Sector Proceeds (US$ mn)
Primary exchange
Domicile nation
Q2
05/13/2014 Link Net PT Communications Equipment 42 JKSE Indonesia
05/14/2014 Zendesk Inc Software 115 NYSE United States
05/15/2014 TrueCar Inc Internet Software & Services 80 NASDAQ United States
05/16/2014 Jumei International holding Ltd Internet Software & Services 245 NYSE China
05/21/2014 SunEdison Semiconductor Ltd Semiconductors 94 NASDAQ United States
05/21/2014 JD.com, Inc Internet Software & Services 1,780 NASDAQ China
05/22/2014 Marimedia Ltd Software 50 LSE Israel
06/03/2014 Kinaxis Inc Internet Software & Services 92 TSX Canada
06/05/2014 Arista Networks, Inc Communications Equipment 226 NYSE United States
06/06/2014 Game Digital Plc Software 203 LSE United Kingdom
06/06/2014 Gentrack Group Ltd Software 84 NZSE New Zealand
06/11/2014 MobileIron Inc Software 100 NASDAQ United States
06/11/2014 Zhaopin Ltd Internet Software & Services 76 NYSE China
06/16/2014 Feitian Technologies Co Ltd Electronics 126 Shanghai China
06/17/2014 FDM Group(Holdings)PLC IT Consulting & Services 412 LSE United Kingdom
06/17/2014 Guangdong Ellington Electn Semiconductors 221 Shanghai China
06/18/2014 Zoopla Property Group PLC Internet Software & Services 598 LSE United Kingdom
06/23/2014 Chanjet Information Technology Software 116 SEHK China
06/23/2014 VOYAGE GROUP Inc Internet Software & Services 103 Tokyo SE Japan
06/23/2014 Xunlei Ltd Internet Software & Services 101 NASDAQ China
06/23/2014 IMImobile Ltd Internet Software & Services 51 LSE United Kingdom
06/24/2014 Imprivata Inc Internet Software & Services 75 NYSE United States
06/18/2014 Markit Ltd Software 1,283 NASDAQ United Kingdom
06/24/2014 Materialise NV Software 96 NASDAQ Belgium
06/25/2014 GoPro Inc Electronics 491 NASDAQ United States
06/25/2014 Ourgame International Holdings Internet Software & Services 107 SEHK China
06/26/2014 Worldline SA Computer Storage & Peripherals
782 EPA France
Q3
07/02/2014 Smartgroup Corporation Ltd Internet Software & Services 106 ASX Australia
07/08/2014 Tian Ge Interactive Holdings Limited Internet Software & Services 207 SEHK China
07/17/2014 Cogobuy Group Internet Software & Services 177 SEHK China
07/17/2014 Globant SA Software 59 NYSE Luxembourg
07/17/2014 TubeMogul, Inc Software 44 NASDAQ United States
07/31/2014 Mobileye NV Software 890 NYSE Israel
07/31/2014 Shenzhen Absen Optoelectronic Co Ltd Semiconductors 59 Shenzhen China
08/06/2014 iDreamSky Technology Limited Software 116 NASDAQ China
08/08/2014 Vista Group International Limited Software 79 NZSE New Zealand
08/27/2014 Jolywood (Suzhou) Sunwatt Co Ltd Semiconductors 80 Shenzhen China
8/27/2014 Hollyland (China) Electronics Technology Corporation Limited
Semiconductors 129 Shanghai China
09/18/2014 Alibaba Group Holding Ltd Internet Software & Services 21,767 NYSE China
09/23/2014 CyberArk Software Software 86 NASDAQ Israel
09/24/2014 Travelport Worldwide Internet Software & Services 480 NYSE United States
09/30/2014 Crossrider Plc Internet Software & Services 75 LSE Israel
9/01/2014 Hangzhou First Pv Material Co Ltd Semiconductors 265 Shanghai China
9/01/2014 XiAn Tian He Defense Technology Co Ltd
Computer Storage & Peripherals
117 Shenzhen China
9/01/2014 Hubei Feilihua Quartz Glass Co Ltd Computer Storage & Peripherals
50 Shenzhen China

Global Technology IPO Review Full-year and Q4 2014 25
Issue date Company Sector Proceeds (US$ mn)
Primary exchange
Domicile nation
Q4
10/02/2014 Rocket Internet AG Internet Software & Services 1,764 XTRA Germany
10/02/2014 Scatec Solar ASA Semiconductors 107 OSE Norway
10/03/2014 Yodlee Inc Software 75 NASDAQ United States
10/06/2014 DEVSISTERS Corp Software 133 South Korea
South Korea
10/09/2014 MOL Global Inc Internet Software & Services 169 NASDAQ Malaysia
10/10/2014 Gamma Communications Plc Communications Equipment 133 LSE United Kingdom
10/10/2014 HubSpot Inc Software 125 NYSE United States
10/15/2014 Hua Hong Semiconductor Ltd Semiconductors 332 SEHK China
10/31/2014 Jiangsu Pacific Quartz Co Ltd Semiconductors 59 Shanghai China
11/05/2014 Spigen Korea Co Ltd Communications Equipment 49 South Korea
South Korea
11/06/2014 Sugon Info Ind Co Ltd/Dawning Information Industry Co Ltd
IT Consulting & Services 65 Shanghai China
11/06/2014 Upland Software Inc Software 46 NASDAQ United States
11/12/2014 Citadel Group Ltd IT Consulting & Services 41 ASX Australia
11/14/2014 Samsung SDS Co Ltd Software 1,063 South Korea
South Korea
11/20/2014 Cnova NV Internet Software & Services 188 NASDAQ Netherlands
11/26/2014 Orion Health Group Ltd Software 96 NZSE New Zealand
12/02/2014 Q Technology (Group) Co Ltd Electronics 90 SEHK China
12/03/2014 Chaozhou Three-Circle Group Co Ltd Semiconductors 220 Shenzhen China
12/04/2014 Tianjin Keyvia Electric Co.,Ltd Electronics 62 Shenzhen China
12/05/2014 Feiyu Technology Software 85 SEHK China
12/09/2014 Aconex Ltd Internet Software & Services 117 ASX Australia
12/10/2014 Yangtze Optical Fibre And Cable Joint Stock Limited Company
Communications Equipment 152 SEHK China
12/11/2014 LendingClub Corporation/Liberty Corp Internet Software & Services 870 NYSE United States
12/11/2014 Momo Inc Internet Software & Services 216 NASDAQ China
12/12/2014 New Relic Inc Software 115 NYSE United States
12/12/2014 Workiva Inc Software 101 NYSE United States
12/12/2014 Hortonworks Inc Software 100 NASDAQ United States
12/12/2014 Connecture Inc Internet Software & Services 53 NASDAQ United States
12/16/2014 Surfstitch Group Ltd Internet Software & Services 71 ASX Australia
12/16/2014 OnDeck Capital Inc Internet Software & Services 230 NYSE United States
12/18/2014 Gumi Inc Software 328 Tokyo SE Japan
12/22/2014 Cartrack Holdings Limited Software 44 JSE South Africa
12/30/2014 Linekong Interactive Co Ltd Internet Software & Services 93 SEHK China
12/30/2014 Linewell Software Co Ltd Software 60 Shanghai China
Source: Dealogic with analysis by PwC.

26 Global Technology IPO Review Full-year and Q4 2014
2010-2014 technology IPO summary
During the period 2010-2014, technology IPOs raised total proceeds of US$119.6bn from 447
listings. In the last five years, 2014 has been the best year for technology IPOs contributing
43% of proceeds and 26% of offerings. The number of listings witnessed a consistent drop from 109 in 2010 to 64 in 2013, but shot up in 2014 to 118, owing to strong capital markets
and investor interest in participating and benefiting from the digital revolution. Total
proceeds also exhibited a steady decline from 2010 (excluding the US$16bn Facebook IPO in 2012) to 2013, which was reversed in 2014. During the period 2010-2014, total proceeds
witnessed a CAGR of 30%, and a CAGR of 13% (excluding Alibaba’s IPO).
The Internet Software & Services subsector has consistently outperformed all other sectors in the last four years (2011-2014), and has raised a total of US$63.5bn from 112 listings. The
Alibaba.com IPO further boosted the subsector’s performance. Given the increase and rapid
acceptance of e-commerce and mobile solutions, Internet Software & Services is likely benefit for some time to come.
The Software subsector has maintained second place during the last three years (2012-2014),
raising proceeds of US$12.2bn from 72 listings. The three Software innovation mega trends, which included the shift from desktop computing to mobile computing (including phones and
tablets), from physical infrastructure to cloud and from installed software to software
delivered ‘as-a-service’ (SaaS), have helped the subsector to evolve and hold its place.4
Computer Storage and Peripherals made a comeback in 2014 in terms of proceeds raised after
its lowest contribution in 2012. In the last five years, the subsector has raised a total of
US$9.1bn from 30 listings. In 2014, the subsector raisedUS$4.7bn—more than total proceeds raised during the period 2010-2013, US$4.4bn.
The Semiconductor subsector also made a comeback in 2014 after its declining performance
over the last four years. The decline was attributable to the freeze in Chinese IPOs imposed by the CSRC. The subsector raised US$12.2bn from 87 listings during the period 2010-2014.
2014 witnessed proceeds of US$1.8bn from 12 listings. The proceeds raised were the highest
since 2012.
The IT Consulting and Services subsector raised US$2.2bn from six listings in 2014. The
subsector has experienced flat performance since 2011. Between 2010 and 2014 US$8.4bn was
raised from 47 listings.
The Telecommunications Equipment subsector was the only sector which declined in terms of
total proceeds raised. Proceeds fell by 32% in 2014 to US$1bn from US$1.5bn in 2013. During
the period 2010-2014 the subsector raised total proceeds of US$5.7bn from 33 listings.
4 http://www.forbes.com/sites/truebridge/2013/09/17/the-software-revolution-a-sector- trends-series/

Global Technology IPO Review Full-year and Q4 2014 27
Figure 25: 2010-2014 Technology IPOs
Source: Dealogic with analysis by PwC.
Summary by subsector
Figure 26: 2010-2014 Internet Software & Services IPOs
Source: Dealogic with analysis by PwC.
$17,952
$15,857
$23,155
$11,446
$51,193
$29,426
109
87 69
64
118 117
0
20
40
60
80
100
120
140
0
10,000
20,000
30,000
40,000
50,000
60,000
2010 2011 2012 2013 2014 2014 w/o Alibaba
Nu
mb
er
of
IPO
s
In U
S$m
n
Total proceeds (US$mn) Number of deals
$1,401
$7,639
$17,451
$4,901
$33,491
7
26
15
24
47
0
5
10
15
20
25
30
35
40
45
50
0
5,000
10,000
15,000
20,000
25,000
30,000
35,000
40,000
2010 2011 2012 2013 2014
Nu
mb
er
of
IPO
s
In U
S$m
n
Total proceeds (US$mn) Number of deals

28 Global Technology IPO Review Full-year and Q4 2014
Figure 27: 2010-2014 Software IPOs
Source: Dealogic with analysis by PwC.
Figure 28: 2010-2014 Computer Storage & Peripherals IPOs
Source: Dealogic with analysis by PwC.
$1,968
$1,040
$2,721 $2,396
$7,129
15
12
19 18
35
0
5
10
15
20
25
30
35
40
0
1,000
2,000
3,000
4,000
5,000
6,000
7,000
8,000
2010 2011 2012 2013 2014
Nu
mb
er
of
IPO
s
In U
S$m
n
Total proceeds (US$mn) Number of deals
$1,601
$748
$329
$1,685
$4,740 8
5
4
8
5
0
1
2
3
4
5
6
7
8
9
0
500
1,000
1,500
2,000
2,500
3,000
3,500
4,000
4,500
5,000
2010 2011 2012 2013 2014N
um
be
r o
f IP
Os
In U
S$m
n
Total proceeds (US$mn) Number of deals

Global Technology IPO Review Full-year and Q4 2014 29
Figure 29: 2010-2014 Semiconductor IPOs
Source: Dealogic with analysis by PwC.
Figure 30: 2010-2014 IT Consulting & Services IPOs
Source: Dealogic with analysis by PwC.
$6,109
$2,646
$1,446
$308
$1,812
41
16 15
4 12
0
5
10
15
20
25
30
35
40
45
0
1,000
2,000
3,000
4,000
5,000
6,000
7,000
2010 2011 2012 2013 2014
Nu
mb
er
of
IPO
s
In U
S$m
n
Total proceeds (US$mn) Number of deals
$4,502
$574 $515
$538
$2,222
24
6
8
3
6
0
5
10
15
20
25
30
0
500
1,000
1,500
2,000
2,500
3,000
3,500
4,000
4,500
5,000
2010 2011 2012 2013 2014N
um
be
r o
f IP
Os
In U
S$m
n
Total proceeds (US$mn) Number of deals

30 Global Technology IPO Review Full-year and Q4 2014
Figure 31: 2010-2014 Telecommunications Equipment IPOs
Source: Dealogic with analysis by PwC.
Figure 32: 2010-2014 Other subsectors
Source: Dealogic with analysis by PwC.
$568
$2,291
$267
$1,512
$1,029 4
11
4
5
9
0
2
4
6
8
10
12
0
500
1,000
1,500
2,000
2,500
2010 2011 2012 2013 2014
Nu
mb
er
of
IPO
s
In U
S$m
n
Total proceeds (US$mn) Number of deals
$1,803
$922
$399
$106
$770
15
11
6
2
4
0
2
4
6
8
10
12
14
16
0
200
400
600
800
1,000
1,200
1,400
1,600
1,800
2,000
2010 2011 2012 2013 2014N
um
be
r o
f IP
Os
In U
S$m
n
Total proceeds (US$mn) Number of deals
Global Technology IPO Review Full-year and Q4 2014 31
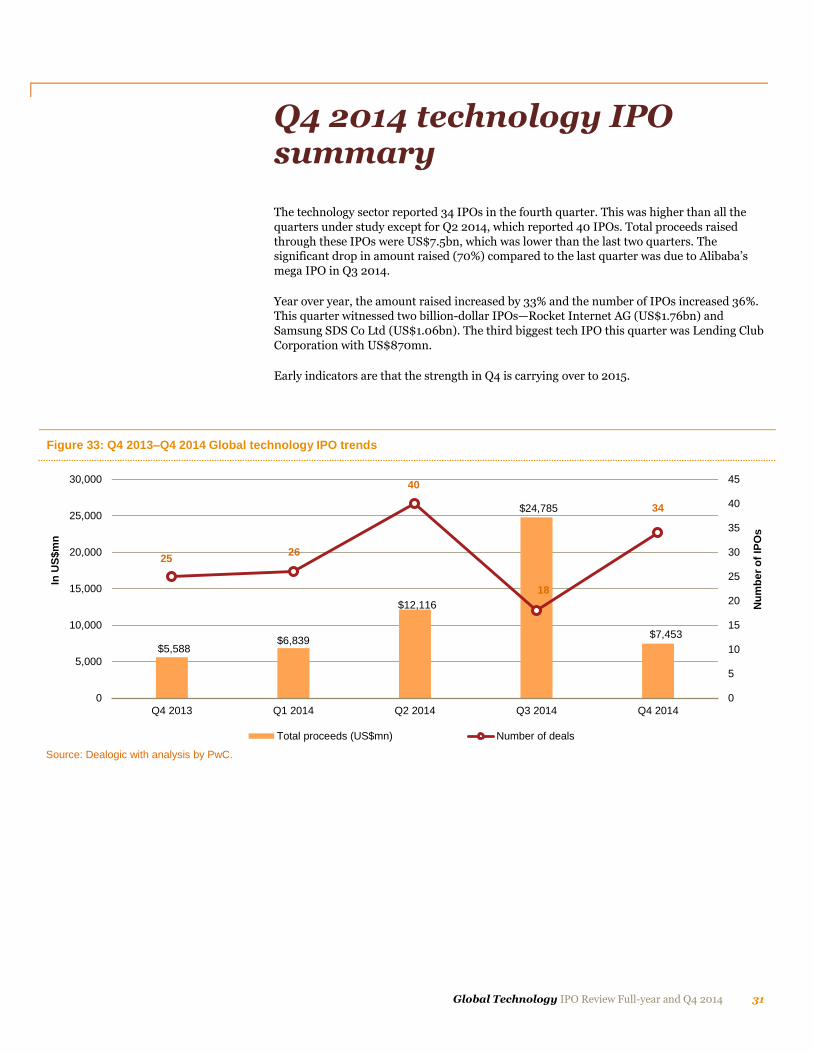
Q4 2014 technology IPO summary
The technology sector reported 34 IPOs in the fourth quarter. This was higher than all the
quarters under study except for Q2 2014, which reported 40 IPOs. Total proceeds raised
through these IPOs were US$7.5bn, which was lower than the last two quarters. The significant drop in amount raised (70%) compared to the last quarter was due to Alibaba’s
mega IPO in Q3 2014.
Year over year, the amount raised increased by 33% and the number of IPOs increased 36%. This quarter witnessed two billion-dollar IPOs—Rocket Internet AG (US$1.76bn) and
Samsung SDS Co Ltd (US$1.06bn). The third biggest tech IPO this quarter was Lending Club
Corporation with US$870mn.
Early indicators are that the strength in Q4 is carrying over to 2015.
Figure 33: Q4 2013–Q4 2014 Global technology IPO trends
Source: Dealogic with analysis by PwC.
$5,588 $6,839
$12,116
$24,785
$7,453
25 26
40
18
34
0
5
10
15
20
25
30
35
40
45
0
5,000
10,000
15,000
20,000
25,000
30,000
Q4 2013 Q1 2014 Q2 2014 Q3 2014 Q4 2014
Nu
mb
er
of
IPO
s
In U
S$m
n
Total proceeds (US$mn) Number of deals

32 Global Technology IPO Review Full-year and Q4 2014
Top 10 technology IPOs
Internet Software & Services again dominated the top 10 listings for the quarter, with 60% share. The Software and Semiconductor subsectors followed with two each in the top 10.
Total proceeds from the top 10 IPOs came to US$5.4bn. US stock exchanges led the way with
five companies out of the top 10 listed in the US. In terms of participation, there were seven exchanges where the top 10 IPOs raised funds indicating a healthier market for tech
companies. Korean, Tokyo and Frankfurt exchanges listed technology IPOs in Q4. The top two
IPOs of Rocket Internet AG and Samsung SDS Co were listed in Germany and Korea respectively, which is an aberration to the general historic trend which shows that the largest
IPOs are raised in US-based stock exchanges.
Table 2: IPO summary – Top 10 listings
Issue date Company Sector Proceeds (US$mn)
Primary exchange
Domicile
nation
10/02/2014 Rocket Internet AG Internet Software & Services 1,764 XTRA Germany
11/14/2014 Samsung SDS Co Ltd Software 1,063 South Korea South Korea
12/11/2014 Lending Club Corporation/Liberty Corp
Internet Software & Services 870 NYSE United States
10/15/2014 Hua Hong Semiconductor Ltd Semiconductors 332 SEHK China
12/18/2014 Gumi Inc Software 328 Tokyo SE Japan
12/16/2014 OnDeck Capital Inc Internet software & services 230 NYSE United States
12/03/2014 Chaozhou Three-Circle Group Co Ltd
Semiconductors 220 Shenzhen China
12/11/2014 Momo Inc Internet Software & Services 216 NASDAQ China
11/20/2014 Cnova NV Internet Software & Services 188 NASDAQ Netherlands
10/09/2014 MOL Global Inc Internet Software & Services 169 NASDAQ Malaysia
Source: Dealogic with analysis by PwC.

Global Technology IPO Review Full-year and Q4 2014 33
Geographic distribution
In terms of number of IPOs, China led the way with 11 IPOs. China was followed by the US with nine technology IPOs. But in terms of proceeds, US companies raised more than their
Chinese counterparts, US$1.7bn versus US$1.4bn, and due to the smaller number of
offerings, US companies received higher average proceeds.
European participation included Germany, with the largest tech IPO of the quarter—
US$1.8bn—the Netherlands, with US$188mn, was also in the top 10 for the quarter, followed
by the UK with US$133mn and Norway with US$107mn. Rest of the World (RoW) includes Japan with US$328mn, Malaysia with US$188mn, New Zealand with US$96mn and South
Africa, the only African country with a tech IPO in 2014, raising US$44mn.
Figure 34: Q4 2014 Geographic distribution
Source: Dealogic with analysis by PwC.
$1,715
$1,435 $1,245
$229
$2,192
$637
9
11
3 3
4 4
0
2
4
6
8
10
12
14
16
18
0
500
1,000
1,500
2,000
2,500
United States China S Korea Australia Europe RoW
Nu
mb
er
of
IPO
s
In U
S$m
n
Issue size Number of IPOs (Right axis)

34 Global Technology IPO Review Full-year and Q4 2014
On a regional basis, Asia led with US$3.5bn in proceeds and 20 listings, followed by Europe with US$2.2bn and four listings. North
America came in third with US$1.7bn and nine listings. With the reopening of the Chinese IPO market, it is anticipated Asia will remain
a dominant force in the year ahead. However, it is encouraging to see innovation and entrepreneurialism spread across the globe, which is a very healthy sign for the future of the technology industry.
Figure 35: Q4 2014 Regional analysis – Proceeds in US$ millions
Source: Dealogic with analysis by PwC.
Figure 36: Q4 2014 Regional analysis – Number of listings
Source: Dealogic with analysis by PwC.
$1,562 $500
$4,777
$0
$4,141 $4,022 $3,903
$50 $524 $58
$23,153
$1,051 $1,715 $2,192
$3,501
$44 0
5,000
10,000
15,000
20,000
25,000
North America Europe Asia RoW
In U
S$m
n
Q1 2014 Q2 2014 Q3 2014 Q4 2014
12
1
13
0
15
8
16
1 2
1
12
3
9
4
20
1
0
5
10
15
20
25
North America Europe Asia RoW
Q1 2014 Q2 2014 Q3 2014 Q4 2014
Global Technology IPO Review Full-year and Q4 2014 35
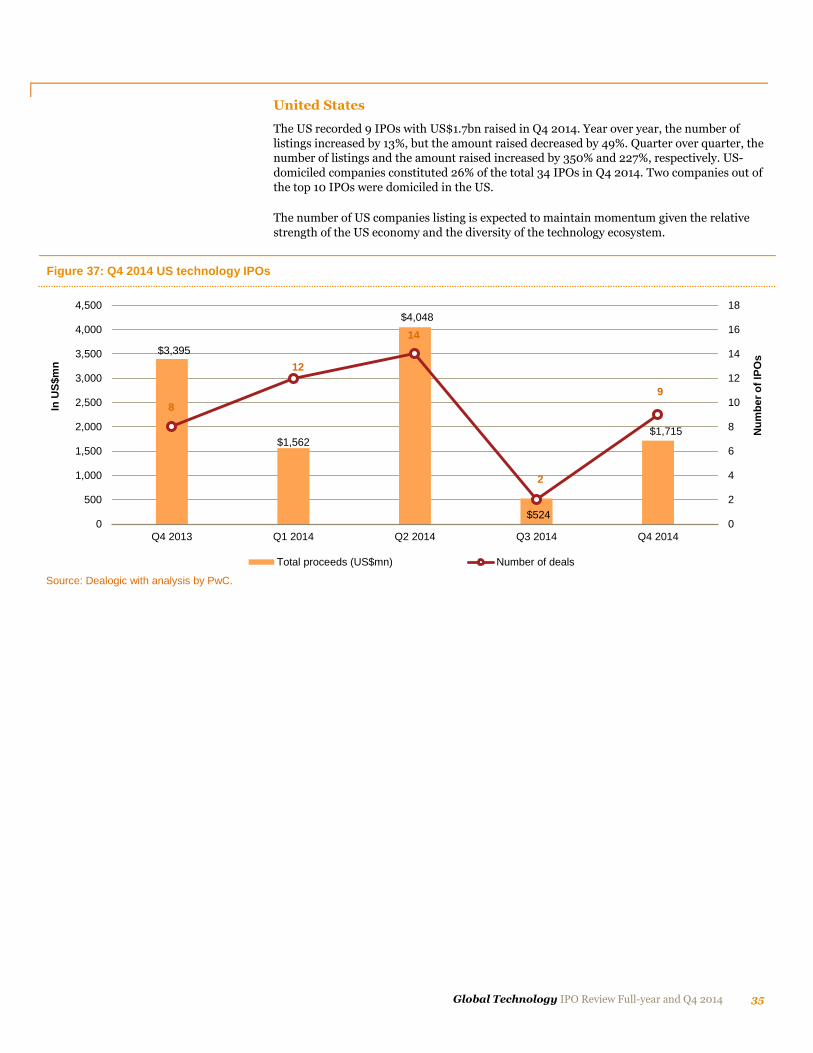
United States
The US recorded 9 IPOs with US$1.7bn raised in Q4 2014. Year over year, the number of
listings increased by 13%, but the amount raised decreased by 49%. Quarter over quarter, the number of listings and the amount raised increased by 350% and 227%, respectively. US-
domiciled companies constituted 26% of the total 34 IPOs in Q4 2014. Two companies out of
the top 10 IPOs were domiciled in the US.
The number of US companies listing is expected to maintain momentum given the relative
strength of the US economy and the diversity of the technology ecosystem.
Figure 37: Q4 2014 US technology IPOs
Source: Dealogic with analysis by PwC.
$3,395
$1,562
$4,048
$524
$1,715
8
12
14
2
9
0
2
4
6
8
10
12
14
16
18
0
500
1,000
1,500
2,000
2,500
3,000
3,500
4,000
4,500
Q4 2013 Q1 2014 Q2 2014 Q3 2014 Q4 2014
Nu
mb
er
of
IPO
s
In U
S$m
n
Total proceeds (US$mn) Number of deals

36 Global Technology IPO Review Full-year and Q4 2014
China
China reported 11 IPOs with US$1.4bn of proceeds. In terms of number of listings, it was 10%
higher sequentially, but declined sharply in terms of proceeds due to the Alibaba IPO in the third quarter. Year over year, the proceeds increased by 60% and the number of listings
increased by 83%.
In contrast to prior quarters, only one Chinese company went public on a foreign exchange (NASDAQ), but consistent with past listings, it was one of the top 10 tech IPOs of the quarter.
Figure 38: Q4 2014 Chinese technology IPOs
Source: Dealogic with analysis by PwC.
$899 $987
$3,673
$22,968
$1,435
6
11
13
10
11
0
3
6
9
12
15
0
5,000
10,000
15,000
20,000
25,000
Q4 2013 Q1 2014 Q2 2014 Q3 2014 Q4 2014
Nu
mb
er
of
IPO
s
In U
S$m
n
Total proceeds (US$mn) Number of deals

Global Technology IPO Review Full-year and Q4 2014 37
Europe
Two of the top 10 deals in the fourth quarter were European technology companies, Rocket
Internet AG of Germany (#1) and Cnova NV of the Netherlands (#9). Europe witnessed only one IPO in the third quarter so sequentially its performance was very impressive in
terms of both number of listings and proceeds. Year-over-year proceeds jumped over
200% and listings were equal, four each in Q4’13 and Q4’14, with three of the Q4’13 listings making the top 10.
Figure 39: Q4 2014 European technology IPOs
Source: Dealogic with analysis by PwC.
$704
$500
$4,022
$59
$2,192
4
1
8
1
4
0
2
4
6
8
10
12
14
16
18
0
500
1,000
1,500
2,000
2,500
3,000
3,500
4,000
4,500
Q3 2013 Q1 2014 Q2 2014 Q3 2014 Q4 2014
Nu
mb
er
of
IPO
s
In U
S$m
n
Issue size Number of IPOs (Right axis)
"Coming on the heels of Alibaba Group Holding Ltd, Rocket Internet AG is the largest German IPO since 2007, clearly demonstrating that demand for e-commerce stocks continues to heat up globally and has arrived in Europe now." −Werner Ballhaus European Technology Industry Leader, PwC Germany

38 Global Technology IPO Review Full-year and Q4 2014
All other geographies
The last few quarters have seen better global participation in the technology IPO market.
US$7.5bn was raised in 2014 from technology companies outside the US, China and Europe.
Q4 2014 saw participation from companies in Australia, Japan, Malaysia, New Zealand, South
Africa and South Korea. Three of the top 10 IPOs were from other geographies, and 50% of the
top 10 IPOs were from countries other than the US and China.
Figure 40: Q4 2014 All other geographies technology IPOs
Source: Dealogic with analysis by PwC.
$592
$3,790
$372
$1,235
$2,110 7
2
5 5
10
0
2
4
6
8
10
12
14
16
0
500
1,000
1,500
2,000
2,500
3,000
3,500
4,000
Q3 2013 Q1 2014 Q2 2014 Q3 2014 Q4 2014
Nu
mb
er
of
IPO
s
In U
S$m
n
Issue size Number of IPOs (Right axis)

Global Technology IPO Review Full-year and Q4 2014 39
Subsector distribution
The Q4 2014 technology IPO subsector distribution was more in line with historical trends. Internet Software & Services led the way with 51% of the total proceeds and 29% of the total
number of IPOs. Most of the big-ticket IPOs were from this subsector and many were in the
top 10.
Internet Software & services was followed by the Software subsector with 32% of the total
proceeds but 38% of the number of IPOs listed this quarter.
The Semiconductor subsector came in third, with 10% of the amount raised and 12% of the listings. The resurgence of Chinese technology companies responding to the reopening of the
China IPO market has driven Semiconductor subsector IPOs in Q4 2014.
Communication Equipment had three listings with US$334mn proceeds, followed by two listings each for Electronics and IT Consulting & Services with US$152mn and US$106mn,
respectively.
Figure 41: Q4 2014 Subsector distribution
Source: Dealogic with analysis by PwC.
$3,772
$2,371
$718
$334 $152 $106
10
13
4 3
2 2
0
2
4
6
8
10
12
14
16
0
500
1,000
1,500
2,000
2,500
3,000
3,500
4,000
Internet Software &Services
Software Semiconductors CommunicationsEquipment
Electronics IT Consulting &Services
Nu
mb
er
of
IPO
s
In U
S$m
n
Total proceeds (US$mn) Number of deals

40 Global Technology IPO Review Full-year and Q4 2014
Stock exchange distribution
In terms of amount raised, XTRA (Germany) led the way with 24% of total proceeds, but just one listing, Rocket Internet AG, the largest Q4 2014 tech IPO. It was followed by the NYSE
with 19% of total proceeds. The NYSE's popularity in the technology sphere increased as the
operator relaxed its standards in late 2008 to allow smaller, newer companies to list. Previously, firms needed a market value of US$750mn and a track record of profitability to list.
New rules dropped the threshold to US$150mn in market value and no operating history
before listing.5
South Korean exchanges listed three tech IPOs—Samsung SDS Co Ltd, Devsisters Corp and
Spigen Korea Co Ltd—a 17% share of proceeds. NASDAQ followed with 11% share of proceeds.
On a combined basis, Chinese stock exchanges, including Hong Kong, had a 16% share of proceeds.
In terms of number of listings, NASDAQ led the way with seven listings, followed by the NYSE
and SEHK with five technology IPOs each. Shanghai, Australia and South Korea exchanges had
three IPOs each.
The number of stock exchanges where these 34 IPOs went public shows the slowly changing global dynamics in the technology world. With both markets and technology maturing across the world, companies are raising funds in a variety of countries. It is no longer a monopoly of US and Chinese markets. There were 13 stock exchanges supporting tech IPOs in Q4 2014.
Figure 42: Q4 2014 Stock exchange distribution
Source: Dealogic with analysis by PwC.
5 http://www.wsj.com/articles/SB10001424127887323894704578113183311774610
$1,441
$847
$282 $184
$753 $229
$44
$1,245
$133 $96 $107
$328
$1,764
5
7
2
3
5
3
1
3
1 1 1 1 1 0
2
4
6
8
10
12
14
16
0
200
400
600
800
1,000
1,200
1,400
1,600
1,800
2,000
NYSE Nasdaq Shenzhen Shanghai SEHK ASX JSE SouthKorea
LSE NZSE OSE TSE XTRA
Nu
mb
er
of
IPO
s
In U
S$m
n
Total proceeds (US$mn) Number of deals
"The second half of 2014 was a very active period for IPOs in Australia. In particular, PE funds crystallised significant value from traditional businesses that they acquired several years ago through moving to new digital technology-based business models. This resulted in very successful IPOs in late 2014." − David Wiadrowski Technology Industry Leader, PwC Australia

Global Technology IPO Review Full-year and Q4 2014 41
Table 3: Q4 2014 Stock exchanges – North America*
Issue date Company Sector Proceeds (US$ mn)
Primary exchange
Domicile
nation
10/03/2014 Yodlee Inc Software 75 NASDAQ United States
10/09/2014 MOL Global Inc Internet Software & Services 169 NASDAQ Malaysia
10/10/2014 HubSpot Inc Software 125 NYSE United States
11/06/2014 Upland Software Inc Software 46 NASDAQ United States
11/20/2014 Cnova NV Internet Software & Services 188 NASDAQ Netherlands
12/11/2014 LendingClub Corporation/ Liberty Corp
Internet Software & Services 870 NYSE United States
12/11/2014 Momo Inc Internet Software & Services 216 NASDAQ China
12/12/2014 New Relic Inc Software 115 NYSE United States
12/12/2014 Workiva Inc Software 101 NYSE United States
12/12/2014 Hortonworks Inc Software 100 NASDAQ United States
12/12/2014 Connecture Inc Internet Software & Services 53 NASDAQ United States
12/16/2014 OnDeck Capital Inc Internet Software & Services 230 NYSE United States
Source: Dealogic with analysis by PwC.
* Deals have been classified based on the exchange where capital was raised.
Table 4: Q4 2014 Stock exchanges – Asia*
Issue date Company Sector Proceeds (US$ mn)
Primary exchange
Domicile nation
10/06/2014 DEVSISTERS Corp Software 133 KOSDAQ South Korea
10/15/2014 Hua Hong Semiconductor Ltd Semiconductors 332 SEHK China
10/31/2014 Jiangsu Pacific Quartz Co Ltd Semiconductors 59 Shanghai China
11/05/2014 Spigen Korea Co Ltd Communications Equipment 49 KOSDAQ South Korea
11/06/2014 Sugon Info Ind Co Ltd/Dawning Information Industry Co Ltd
IT Consulting & Services 65 SSE China
11/12/2014 Citadel Group Ltd IT Consulting & Services 41 ASX Australia
11/14/2014 Samsung SDS Co Ltd Software 1,063 KRX South Korea
11/26/2014 Orion Health Group Ltd Software 96 NZSE New Zealand
12/02/2014 Q Technology (Group) Co Ltd Electronics 90 SEHK China
12/03/2014 Chaozhou Three-Circle Group Co Ltd
Semiconductors 220 Shenzhen China
12/04/2014 Tianjin Keyvia Electric Co Ltd Electronics 62 Shenzhen China
12/05/2014 Feiyu Technology Software 85 SEHK China
12/09/2014 Aconex Ltd Internet Software & Services 117 ASX Australia
12/10/2014 Yangtze Optical Fibre And Cable Joint Stock Limited Company
Communications Equipment 152 SEHK China
12/16/2014 Surfstitch Group Ltd Internet Software & Services 71 ASX Australia
12/18/2014 Gumi Inc Software 328 Tokyo SE Japan
12/30/2014 Linekong Interactive Co Ltd Internet Software & Services 93 SEHK China
12/30/2014 Linewell Software Co Ltd Software 60 SHA China
Source: Dealogic with analysis by PwC.
* Deals have been classified based on the exchange where capital was raised.

42 Global Technology IPO Review Full-year and Q4 2014
Table 5: Q4 2014 Stock exchanges – Europe*
Issue date Company Sector Proceeds (US$ mn)
Primary exchange
Domicile nation
10/02/2014 Rocket Internet AG Internet Software & Services 1,764 XTRA Germany
10/02/2014 Scatec Solar ASA Semiconductors 107 OSE Norway
10/10/2014 Gamma Communications Plc Communications Equipment 133 London Stock Exchange AIM
United Kingdom
Source: Dealogic with analysis by PwC.
* Deals have been classified based on the exchange where capital was raised.
Table 6: Q4 2014 Stock exchanges – Other*
Issue date Company Sector Proceeds (US$ mn)
Primary exchange
Domicile nation
12/22/2014 Cartrack Holdings Limited Software 44 JSE South Africa
Source: Dealogic with analysis by PwC.
* Deals have been classified based on the exchange where capital was raised.

Global Technology IPO Review Full-year and Q4 2014 43
Cross-border listings
In contrast to the second and third quarters of 2014, just three of the 34 listings were cross-border IPOs in Q4. In the prior quarter, 33% of the listings were cross-border compared to
only 9% in Q4. Reopening of the Chinese IPO market coupled with renewed interest and vigor
in European and other Asian countries for emerging technology companies, may point to Q4 activity being more typical than what we’ve seen the past couple of years.
The three companies to list cross-border in Q4 were CNova NV from the Netherlands, MOL
Global, a Malaysia-based company and Momo Inc, a Chinese company, all of which listed on NASDAQ.
Figure 43: Q4 2014 Cross-border listings
Source: Dealogic with analysis by PwC.
25 29
12
31
1
11
6
3
0
5
10
15
20
25
30
35
40
45
Q1 2014 Q2 2014 Q3 2014 Q4 2014
Domestic deals Cross-border deals
4%
28%
33%
9%

44 Global Technology IPO Review Full-year and Q4 2014
Key financials
Figure 44: Q4 2014 and full-year 2014 Technology IPOs – Net income
Source: Dealogic with analysis by PwC.
The average Last Twelve Months (LTM) net income for Q4 2014 was US$14.2mn, with 53%
of the companies reporting a positive net income. Samsung SDS Co Ltd reported the highest
net income of US$330.3mn, followed by Rocket Internet AG which reported net income of US$190.7mn. Hortonworks Inc, a major Software company, reported the highest net loss of
US$10.7.7mn, followed by Linekong Interactive Co. Ltd, an Internet Software & Services
company, reporting a net loss of US$62.1mn.
53%
47%
Q4 2014
Positive net income Negative net income
61%
39%
Full-year 2014
Positive net income Negative net income

Global Technology IPO Review Full-year and Q4 2014 45
In terms of full-year 2014, the percentage of companies with positive net income was much
better than Q4 2014 with 61% declaring positive LTM net income. The overall improved net
income situation among tech IPO companies was due to the profitability of several of this year’s global tech IPO class.
There is one trend that clearly stands out—investors are growing more tolerant of tech
companies going public with net loss. Previously, fewer companies with net losses filed. Looking at the last quarter vis-à-vis the full year, we see that 47% of the newly listed
companies in Q4 2014 had net losses versus 39% for the whole year.
In terms of average revenue for the quarter, the Software subsector reported the highest average revenue of US$664.2mn with 13 companies listing this quarter. Communications
Equipment companies, with US$561.7mn average revenue, were next, followed by Internet
Software & Services with average revenue of US$469.4mn.
The Semiconductor subsector reported the highest average EBITDA of US$87.3mn, followed
by the Communications Equipment subsector with US$66.9mn. Coming in third was the
Software subsector with US$6.7mn, but its average was skewed by Samsung SDS Co Ltd. The revival of Chinese companies in the IPO market has led to positive momentum in the
Semiconductor subsector.
In contrast to historical trends, the top two subsectors with the highest average net income were both hardware-oriented—Semiconductor and Communications Equipment—with
US$49.7mn and US$41.6mn, respectively. As these subsectors are more capex-intensive, it
generally takes longer for these companies to achieve positive net income.
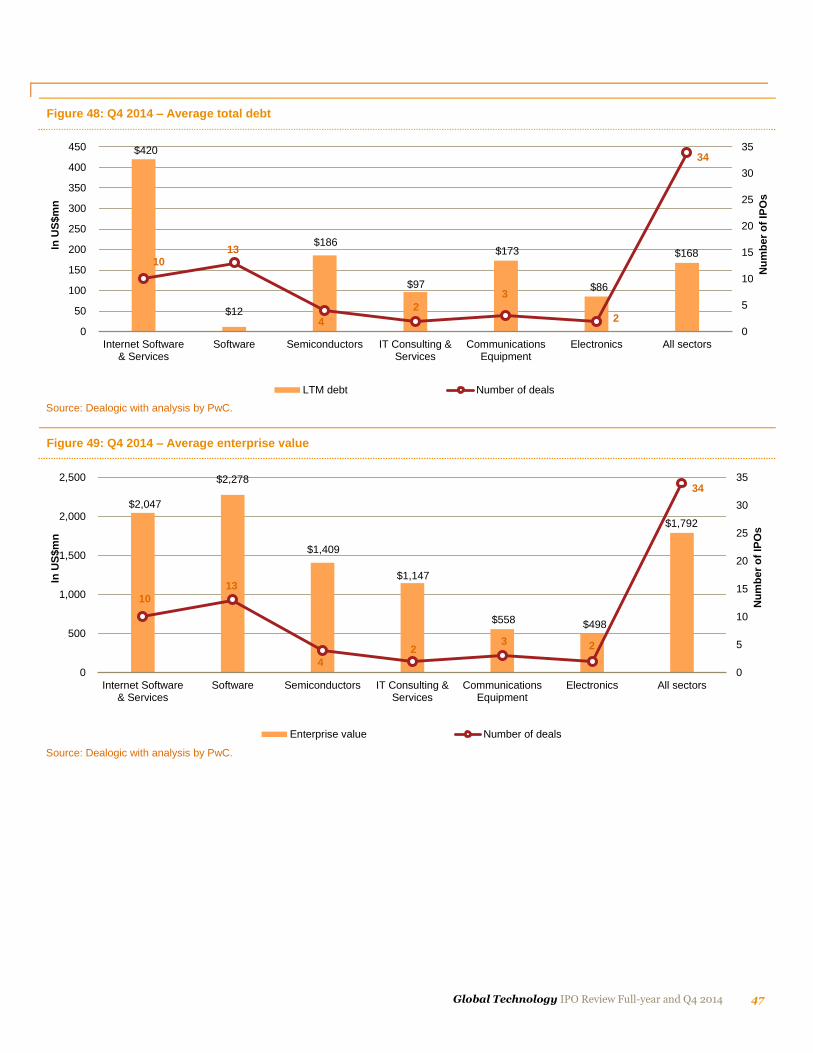
The average enterprise value of the Software subsector was the highest at US$2.3bn, followed
by the Internet Software & Services subsector at US$2.0bn. Recent US tech IPOs have been in
the Software and Internet Services subsectors. The booming US markets coupled with pre-IPO VC and PE investments led to extremely high valuations for companies in these two subsectors
across the world.
Figure 45: Q4 2014 – Average LTM revenue
Source: Dealogic with analysis by PwC.
$469
$664
$276
$214
$562
$175
$490
10
13 4
2 3
2
34
0
5
10
15
20
25
30
35
0
100
200
300
400
500
600
700
Internet Software& Services
Software Semiconductors IT Consulting &Services
CommunicationsEquipment
Electronics All sectors
Nu
mb
er
of
IPO
s
In U
S$m
n
LTM revenue Number of deals

46 Global Technology IPO Review Full-year and Q4 2014
Figure 46: Q4 2014 – Average LTM EBITDA
Source: Dealogic with analysis by PwC.
Figure 47: Q4 2014 – Average LTM net income
Source: Dealogic with analysis by PwC.
-$7
$64
$87
$12
$67
$27
$42
10
13
4 2
3
2
34
0
5
10
15
20
25
30
35
(20)
0
20
40
60
80
100
Internet Software& Services
Software Semiconductors IT Consulting &Services
CommunicationsEquipment
Electronics All sectors
Nu
mb
er
of
IPO
s
In U
S$m
n
LTM EBITDA Number of deals
-$1
$10
$50
$10
$42
$23
$14 10
13
4 2
3
2
34
0
5
10
15
20
25
30
35
(10)
0
10
20
30
40
50
60
Internet Software& Services
Software Semiconductors IT Consulting &Services
CommunicationsEquipment
Electronics All sectors
Nu
mb
er
of
IPO
s
In U
S$m
n
LTM net income Number of deals
Global Technology IPO Review Full-year and Q4 2014 47
Figure 48: Q4 2014 – Average total debt
Source: Dealogic with analysis by PwC.
Figure 49: Q4 2014 – Average enterprise value
Source: Dealogic with analysis by PwC.
$420
$12
$186
$97
$173
$86
$168 10
13
4
2
3
2
34
0
5
10
15
20
25
30
35
0
50
100
150
200
250
300
350
400
450
Internet Software& Services
Software Semiconductors IT Consulting &Services
CommunicationsEquipment
Electronics All sectors
Nu
mb
er
of
IPO
s
In U
S$m
n
LTM debt Number of deals
$2,047
$2,278
$1,409
$1,147
$558 $498
$1,792
10
13
4
2 3 2
34
0
5
10
15
20
25
30
35
0
500
1,000
1,500
2,000
2,500
Internet Software& Services
Software Semiconductors IT Consulting &Services
CommunicationsEquipment
Electronics All sectors
Nu
mb
er
of
IPO
s
In U
S$m
n
Enterprise value Number of deals

48 Global Technology IPO Review Full-year and Q4 2014
Valuation metrics
The technology industry is undergoing an upward valuation shift with more positive investor sentiment towards the sector. Leading the valuation story are major Internet Software &
Services companies that are listing with overly high valuations, based on rapid revenue
growth but without a positive bottom line. Pre-IPO funding has also changed the market dynamics with easy money being available from VCs and PEs and even hedge funds coming
into the fray.
The average EV/LTM revenue for all the companies in Q4 2014 was 3.7x, which is in line with other industries. Leading the multiple metrics was the IT Consulting & Services subsector
with 5.4x, followed by the Semiconductor and Internet Software & Services subsectors with
5.1x and 4.4x, respectively. Communications Equipment had the lowest multiple of 1.1x.
IT Consulting & Services reported the highest EV/LTM EBITDA multiple of 94.4x, followed
by the Software subsector with 35.8x. The average industry multiple overall was 43.1x.
Communications Equipment had the lowest multiple of 8.3x.
Figure 50: Q4 2014 EV/LTM revenue
Source: Dealogic with analysis by PwC.
4.4 x
3.4 x
5.1 x
5.4 x
1.0 x
2.8 x
3.7 x
10
13
4
2 3 2
34
0
5
10
15
20
25
30
35
0 .0 x
1 .0 x
2 .0 x
3 .0 x
4 .0 x
5 .0 x
6 .0 x
Internet Software& Services
Software Semiconductors IT Consulting &Services
CommunicationsEquipment
Electronics All sectors
Nu
mb
er
of
IPO
s
In U
S$m
n
EV/LTM revenue No. of deals
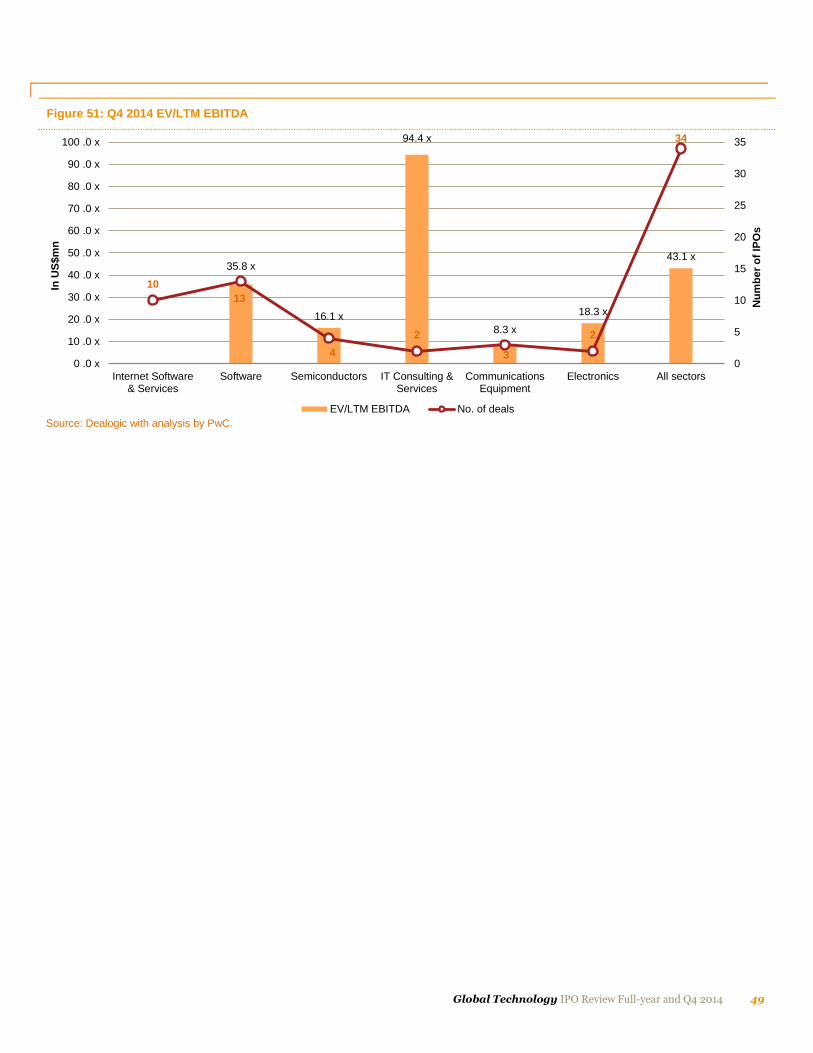
Global Technology IPO Review Full-year and Q4 2014 49
Figure 51: Q4 2014 EV/LTM EBITDA
Source: Dealogic with analysis by PwC.
35.8 x
16.1 x
94.4 x
8.3 x
18.3 x
43.1 x
10
13
4
2
3
2
34
0
5
10
15
20
25
30
35
0 .0 x
10 .0 x
20 .0 x
30 .0 x
40 .0 x
50 .0 x
60 .0 x
70 .0 x
80 .0 x
90 .0 x
100 .0 x
Internet Software& Services
Software Semiconductors IT Consulting &Services
CommunicationsEquipment
Electronics All sectors
Nu
mb
er
of
IPO
s
In U
S$m
n
EV/LTM EBITDA No. of deals

50 Global Technology IPO Review Full-year and Q4 2014
Top three subsectors in Q4 2014
Internet Software & Services
In terms of average revenue, Internet Software & Services was relatively flat year over year in
the fourth quarter, but dipped sharply by 77% quarter over quarter. This drop resulted from
the two big ticket IPOs in Q3—Alibaba and Travelport Worldwide—which had reported high revenue.
LTM EBITDA and net income are all in the negative in Q4 2014, compared to US$896mn and
US$828mn, respectively, last quarter and US$77mn and US$13mn in Q4 2013.
Average debt levels increased sharply by US$420mn year over year by more than 200%, but
dropped compared to the last quarter.
EV/LTM revenue (4.4.x) was down by 63% year-on-year and by 80% compared to the last quarter in Q4 2014.
Figure 52: Internet Software & Services – LTM revenue
Source: Dealogic with analysis by PwC.
$118
$468
$383
$866
$2,066
$469
6
12 11
20
6
10
0
5
10
15
20
25
0
500
1,000
1,500
2,000
2,500
Q3 2013 Q4 2013 Q1 2014 Q2 2014 Q3 2014 Q4 2014
Nu
mb
er
of
IPO
s
In U
S$m
n
LTM revenue Total no. of deals
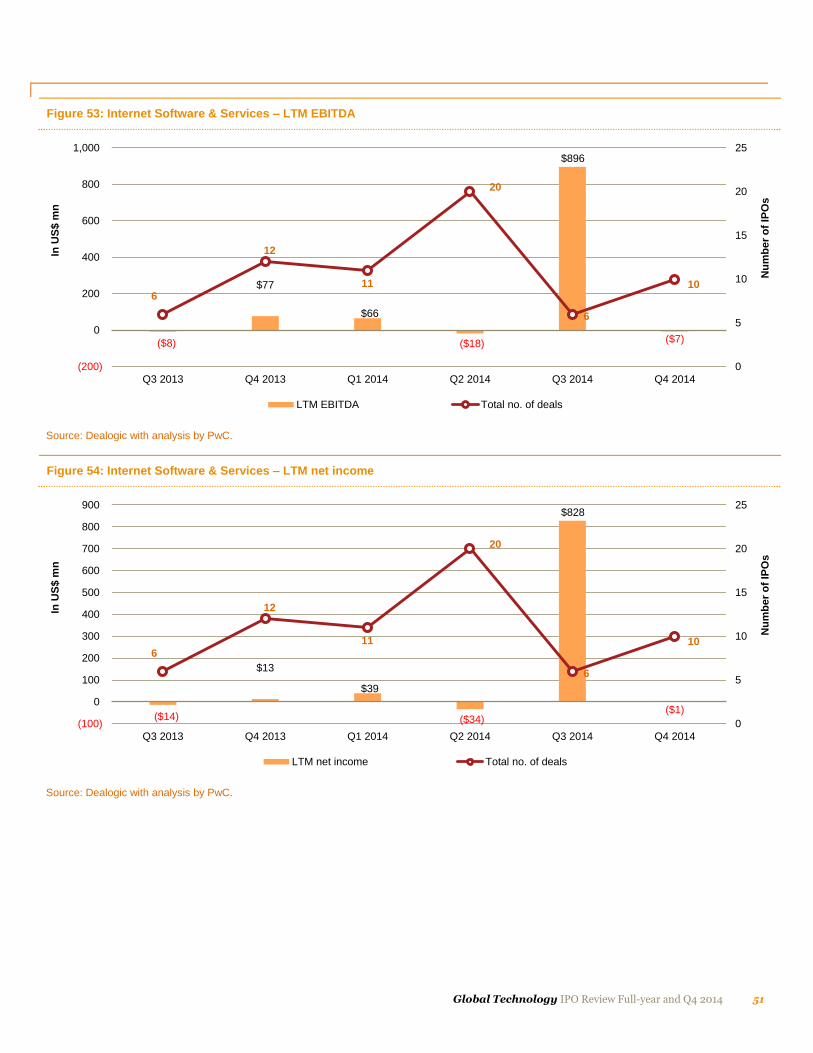
Global Technology IPO Review Full-year and Q4 2014 51
Figure 53: Internet Software & Services – LTM EBITDA
Source: Dealogic with analysis by PwC.
Figure 54: Internet Software & Services – LTM net income
Source: Dealogic with analysis by PwC.
($8)
$77
$66
($18)
$896
($7)
6
12
11
20
6
10
0
5
10
15
20
25
(200)
0
200
400
600
800
1,000
Q3 2013 Q4 2013 Q1 2014 Q2 2014 Q3 2014 Q4 2014
Nu
mb
er
of
IPO
s
In U
S$ m
n
LTM EBITDA Total no. of deals
($14)
$13
$39
($34)
$828
($1)
6
12
11
20
6
10
0
5
10
15
20
25
(100)
0
100
200
300
400
500
600
700
800
900
Q3 2013 Q4 2013 Q1 2014 Q2 2014 Q3 2014 Q4 2014
Nu
mb
er
of
IPO
s
In U
S$ m
n
LTM net income Total no. of deals

52 Global Technology IPO Review Full-year and Q4 2014
Figure 55: Internet Software & Services – Enterprise value
Source: Dealogic with analysis by PwC.
Figure 56: Internet Software & Services – Total debt
Source: Dealogic with analysis by PwC.
$1,058
$5,516
$1,406
$3,457
$44,873
$2,047
6
12
11
20
6
10
0
5
10
15
20
25
0
5,000
10,000
15,000
20,000
25,000
30,000
35,000
40,000
45,000
50,000
Q3 2013 Q4 2013 Q1 2014 Q2 2014 Q3 2014 Q4 2014
Nu
mb
er
of
IPO
s
In U
S$ m
n
Enterprise value Total no. of deals
$9
$127
$78 $38
$2,296
$420
6
12
11
20
6
10
0
5
10
15
20
25
0
500
1,000
1,500
2,000
2,500
Q3 2013 Q4 2013 Q1 2014 Q2 2014 Q3 2014 Q4 2014
Nu
mb
er
of
IPO
s
In U
S$ m
n
Total debt Total no. of deals

Global Technology IPO Review Full-year and Q4 2014 53
Figure 57: Internet Software & Services – EV/LTM revenue
Source: Dealogic with analysis by PwC.
Figure 58: Internet Software & Services – EV/LTM EBITDA
Source: Dealogic with analysis by PwC.
8.9x
11.8x
3.7x 4.0x
21.7x
4.4x
6
12
11
20
6
10
0
5
10
15
20
25
0
5
10
15
20
25
Q3 2013 Q4 2013 Q1 2014 Q2 2014 Q3 2014 Q4 2014
Nu
mb
er
of
IPO
s
In U
S$ m
n
EV/LTM revenue Total no. of deals
0.00x
71.96x
21.17x
0.00x
50.06x
0.00x
6
12
11
20
6
10
0
5
10
15
20
25
0
10
20
30
40
50
60
70
80
Q3 2013 Q4 2013 Q1 2014 Q2 2014 Q3 2014 Q4 2014
Nu
mb
er
of
IPO
s
In U
S$ m
n
EV/LTM EBITDA Total no. of deals

54 Global Technology IPO Review Full-year and Q4 2014
Software
Fourth quarter average revenue of US$664mn increased sharply sequentially (600%) and by
130% year over year. Compared to the last five quarters, the Software subsector reported its best performance, with the highest number of IPOs (13) in Q4 2014.
The average EBITDA and net income increased sharply quarter over quarter due to a very low
average EBITDA and net income in Q3 2014. The average EBITDA and net income of US$64mn and US$10mn in Q4 2014 dropped by 20% and 147% year over year.
Average EV was flat quarter over quarter but dropped by 33% year over year to US$2.2bn
from US$3.3bn. For the Software subsector, the debt levels were traditionally low and the average debt has dipped further in the last two quarters. Ab influx of funding has also
positively contributed to keeping debt low; year over year, debt levels decreased by 93%.
The valuation multiples of EV/LTM revenue (3.4x) and EV/LTM EBITDA (35.8x) decreased by 70.7% and 15.5%, respectively, compared to the last year, and by 87% and 86%
sequentially.
Figure 59: Software – LTM revenue
Source: Dealogic with analysis by PwC.
$79
$290
$65
$554
$92
$664
2
5
5
11
6
13
0
2
4
6
8
10
12
14
0
100
200
300
400
500
600
700
Q3 2013 Q4 2013 Q1 2014 Q2 2014 Q3 2014 Q4 2014
Nu
mb
er
of
IPO
s
In U
S$ m
n
LTM revenue Total no. of deals

Global Technology IPO Review Full-year and Q4 2014 55
Figure 60: Software – LTM EBITDA
Source: Dealogic with analysis by PwC.
Figure 61: Software – LTM net income
Source: Dealogic with analysis by PwC.
(25)
80
8
96
9
64
2
5
5
11
6
13
0
2
4
6
8
10
12
14
(40)
(20)
0
20
40
60
80
100
120
Q3 2013 Q4 2013 Q1 2014 Q2 2014 Q3 2014 Q4 2014
Nu
mb
er
of
IPO
s
In U
S$ m
n
LTM EBITDA Total no. of deals
(36)
(21)
6
0
5
10
2
5
5
11
6
13
0
2
4
6
8
10
12
14
(40)
(30)
(20)
(10)
0
10
20
Q3 2013 Q4 2013 Q1 2014 Q2 2014 Q3 2014 Q4 2014
Nu
mb
er
of
IPO
s
In U
S$ m
n
LTM net income Total no. of deals

56 Global Technology IPO Review Full-year and Q4 2014
Figure 62: Software – Enterprise value
Source: Dealogic with analysis by PwC.
Figure 63: Software – Total debt
Source: Dealogic with analysis by PwC.
$2,500
$3,391
$509
$2,158 $2,352
$2,278
2
5
5
11
6
13
0
2
4
6
8
10
12
14
0
500
1,000
1,500
2,000
2,500
3,000
3,500
4,000
Q3 2013 Q4 2013 Q1 2014 Q2 2014 Q3 2014 Q4 2014
Nu
mb
er
of
IPO
s
In U
S$ m
n
Enterprise value Total no. of deals
$17
$169
$5
$374
$3 $12
2
5
5
11
6
13
0
2
4
6
8
10
12
14
0
50
100
150
200
250
300
350
400
Q3 2013 Q4 2013 Q1 2014 Q2 2014 Q3 2014 Q4 2014
Nu
mb
er
of
IPO
s
In U
S$ m
n
Total debt Total no. of deals

Global Technology IPO Review Full-year and Q4 2014 57
Figure 64: Software – EV/LTM revenue
Source: Dealogic with analysis by PwC.
Figure 65: Software – EV/LTM EBITDA
Source: Dealogic with analysis by PwC.
31.7x
11.7x
7.8x
3.9x
25.5x
3.4x
2
5
5
11
6
13
0
2
4
6
8
10
12
14
0
5
10
15
20
25
30
35
Q3 2013 Q4 2013 Q1 2014 Q2 2014 Q3 2014 Q4 2014
Nu
mb
er
of
IPO
s
In U
S$ m
n
EV/LTM revenue Total no. of deals
0.0x
42.3x
62.1x
22.5x
258.0x
35.8x
2
5
5
11
6
13
0
2
4
6
8
10
12
14
0
50
100
150
200
250
300
Q3 2013 Q4 2013 Q1 2014 Q2 2014 Q3 2014 Q4 2014
Nu
mb
er
of
IPO
s
In U
S$ m
n
EV/LTM EBITDA Total no. of deals
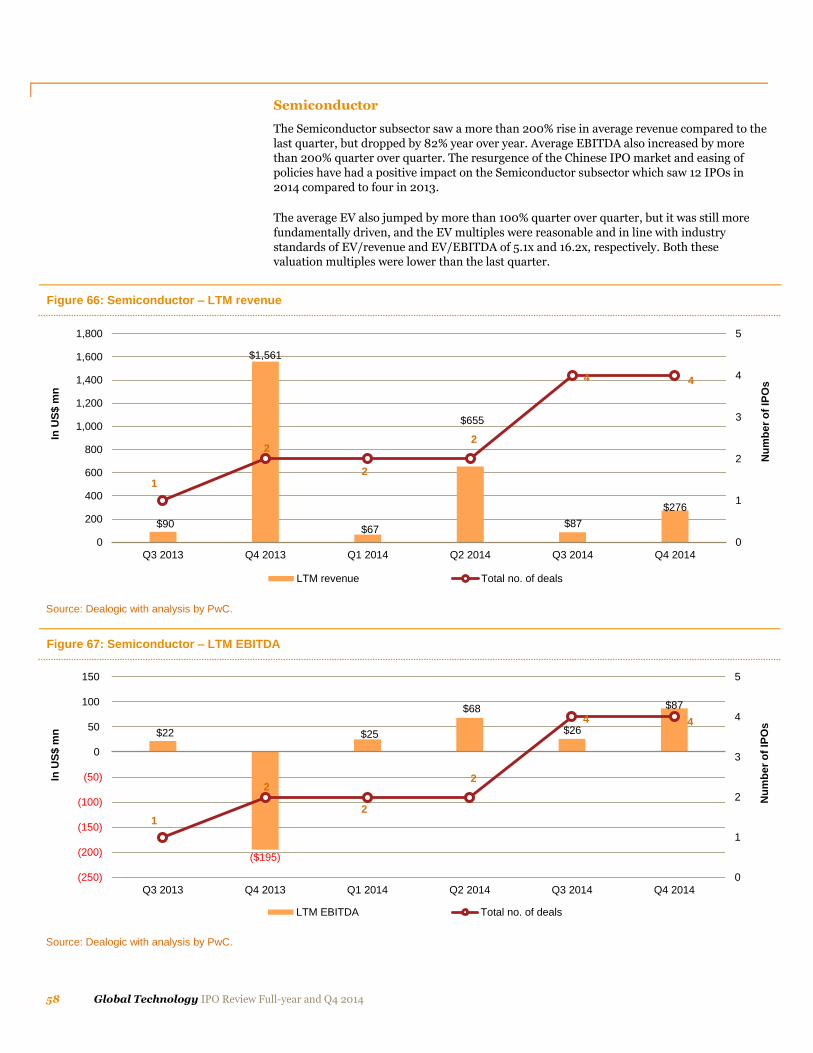
58 Global Technology IPO Review Full-year and Q4 2014
Semiconductor
The Semiconductor subsector saw a more than 200% rise in average revenue compared to the
last quarter, but dropped by 82% year over year. Average EBITDA also increased by more than 200% quarter over quarter. The resurgence of the Chinese IPO market and easing of
policies have had a positive impact on the Semiconductor subsector which saw 12 IPOs in
2014 compared to four in 2013.
The average EV also jumped by more than 100% quarter over quarter, but it was still more
fundamentally driven, and the EV multiples were reasonable and in line with industry
standards of EV/revenue and EV/EBITDA of 5.1x and 16.2x, respectively. Both these valuation multiples were lower than the last quarter.
Figure 66: Semiconductor – LTM revenue
Source: Dealogic with analysis by PwC.
Figure 67: Semiconductor – LTM EBITDA
Source: Dealogic with analysis by PwC.
$90
$1,561
$67
$655
$87
$276
1
2
2
2
4 4
0
1
2
3
4
5
0
200
400
600
800
1,000
1,200
1,400
1,600
1,800
Q3 2013 Q4 2013 Q1 2014 Q2 2014 Q3 2014 Q4 2014
Nu
mb
er
of
IPO
s
In U
S$ m
n
LTM revenue Total no. of deals
$22
($195)
$25
$68
$26
$87
1
2
2
2
4 4
0
1
2
3
4
5
(250)
(200)
(150)
(100)
(50)
0
50
100
150
Q3 2013 Q4 2013 Q1 2014 Q2 2014 Q3 2014 Q4 2014
Nu
mb
er
of
IPO
s
In U
S$ m
n
LTM EBITDA Total no. of deals
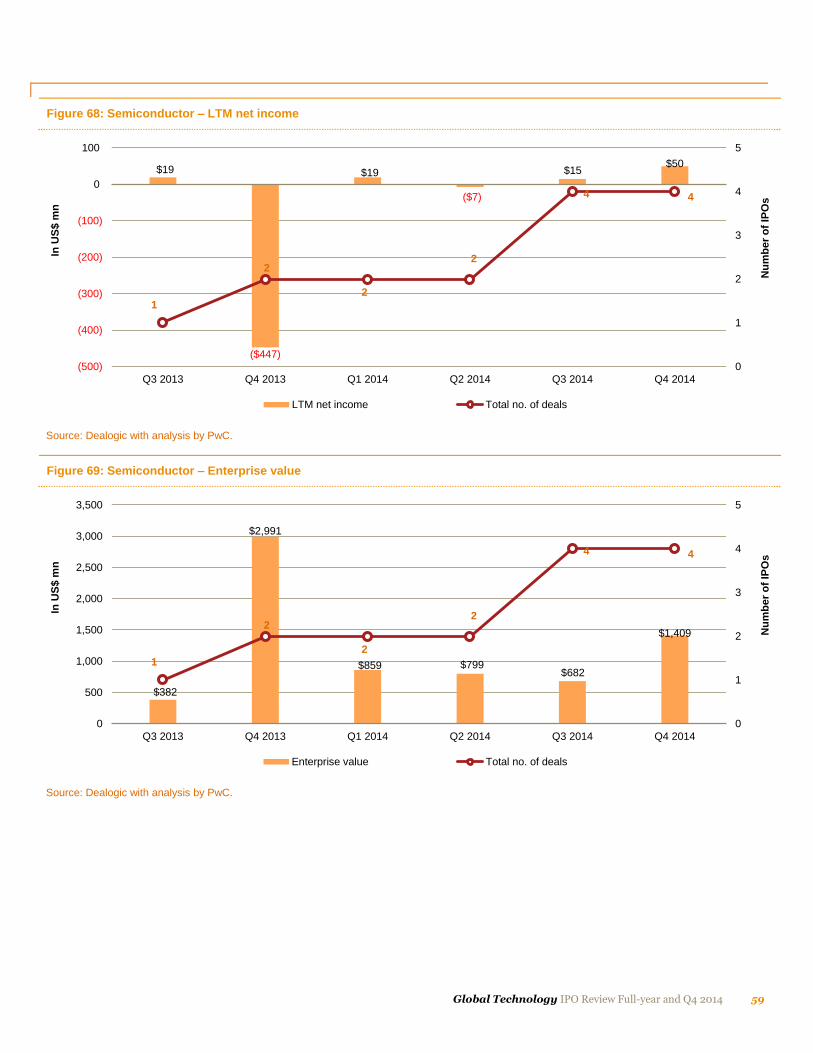
Global Technology IPO Review Full-year and Q4 2014 59
Figure 68: Semiconductor – LTM net income
Source: Dealogic with analysis by PwC.
Figure 69: Semiconductor – Enterprise value
Source: Dealogic with analysis by PwC.
$19
($447)
$19
($7)
$15 $50
1
2
2
2
4 4
0
1
2
3
4
5
(500)
(400)
(300)
(200)
(100)
0
100
Q3 2013 Q4 2013 Q1 2014 Q2 2014 Q3 2014 Q4 2014
Nu
mb
er
of
IPO
s
In U
S$ m
n
LTM net income Total no. of deals
$382
$2,991
$859 $799 $682
$1,409
1
2
2
2
4 4
0
1
2
3
4
5
0
500
1,000
1,500
2,000
2,500
3,000
3,500
Q3 2013 Q4 2013 Q1 2014 Q2 2014 Q3 2014 Q4 2014
Nu
mb
er
of
IPO
s
In U
S$ m
n
Enterprise value Total no. of deals

60 Global Technology IPO Review Full-year and Q4 2014
Figure 70: Semiconductor – Total debt
Source: Dealogic with analysis by PwC.
Figure 71: Semiconductor – EV/LTM revenue
Source: Dealogic with analysis by PwC.
$0
$1,827
$6 $6 $0
$186
1
2
2
2
4 4
0
1
2
3
4
5
0
200
400
600
800
1,000
1,200
1,400
1,600
1,800
2,000
Q3 2013 Q4 2013 Q1 2014 Q2 2014 Q3 2014 Q4 2014
Nu
mb
er
of
IPO
s
In U
S$ m
n
Total debt Total no. of deals
4.30x
1.90x
12.80x
1.20x
7.90x
9.70x
1
2
2
2
4 4
0
1
2
3
4
5
0
2
4
6
8
10
12
14
Q3 2013 Q4 2013 Q1 2014 Q2 2014 Q3 2014 Q4 2014
Nu
mb
er
of
IPO
s
In U
S$ m
n
EV/LTM revenue Total no. of deals

Global Technology IPO Review Full-year and Q4 2014 61
Figure 72: Semiconductor – EV/LTM EBITDA
Source: Dealogic with analysis by PwC.
17.10x
0.00x
35.01x
11.70x
25.80x 26.40x
1
2
2
2
4 4
0
1
2
3
4
5
0
5
10
15
20
25
30
35
40
Q3 2013 Q4 2013 Q1 2014 Q2 2014 Q3 2014 Q4 2014
Nu
mb
er
of
IPO
s
In U
S$ m
n
EV/LTM EBITDA Total no. of deals

62 Global Technology IPO Review Full-year and Q4 2014
Methodology
The Global Technology IPO Review for Q4 and full-year 2014 is based on PwC’s analysis
of transaction data extracted from Dealogic. The analysis considers IPOs across all
countries worldwide during the period 1 October 2014 to 31 December 2014 (Q4), 1 January 2014 to 31 December 2014 (full-year) and from 2010-2014. Financial data was
also obtained from Dealogic.
The definition of the Technology sector is based on the Dealogic database industry classifications and includes the following subsectors:
Internet Software & Services
IT Consulting & Services
Professional Services (e.g., Application Software, Software Solutions)
Semiconductors
Software
Computer Storage & Peripherals
– Computer, Computer Peripheral Equipment
– Computer Storage Device Manufacturing
Electronic Computer Manufacturing
Communications Equipment
Only IPOs with issue size greater than US$40mn were included in the analysis.
All monetary amounts are in US dollars unless otherwise indicated.
mn – millions
bn - billions
LTM – Last twelve months
* Figures are rounded
Global Technology IPO Review Full-year and Q4 2014 63
Contacts
For more information
If you would like to discuss how these findings might impact your business or your future strategy, please reach out to any of our technology industry leaders listed below.
Raman Chitkara
Global Technology Leader Phone: 1 408 817 3746
Email: [email protected]
Rod Dring – Australia Phone: 61 2 8266 7865
Email: [email protected]
Estela Vieira – Brazil Phone: 55 1 3674 3802
Email: [email protected]
Christopher Dulny – Canada Phone: 1 416 869 2355
Email: [email protected]
Jianbin Gao – China Phone: 86 21 2323 3362
Email: [email protected]
Pierre Marty – France Phone: 33 1 5657 58 15
Email: [email protected]
Werner Ballhaus – Germany Phone: 49 211 981 5848
Email: [email protected]
Sandeep Ladda – India Phone: 91 22 6689 1444
Email: [email protected]
Masahiro Ozaki – Japan Phone: 81 3 5326 9090
Email: [email protected]
Hoonsoo Yoon – Korea Phone: 82 2 709 0201
Email: [email protected]
Ilja Linnemeijer – The Netherlands Phone: 31 88 792 4956
Email: [email protected]
Yury Pukha – Russia Phone: 7 495 223 5177
Email: [email protected]
Greg Unsworth – Singapore Phone: 65 6236 3738
Email: [email protected]
Philip Shepherd – UAE Phone: 97 1 43043501
Email: [email protected]
Jass Sarai – UK Phone: 44 0 1895 52 2206
Email: [email protected]
Pierre-Alain Sur – US Phone: 1 646 471 6973
Email: [email protected]
Alan Jones - US (Deals Partner) Phone: 1 415 498 7398
Email: [email protected]

64 Global Technology IPO Review Full-year and Q4 2014
About PwC’s Technology Institute
The Technology Institute is PwC’s global research network that studies the business of technology
and the technology of business with the purpose of creating thought leadership that offers both
fact-based analysis and experience-based perspectives. Technology Institute insights and
viewpoints originate from active collaboration between our professionals across the globe and their
first-hand experiences working in and with the technology industry.
About PwC
PwC firms help organisations and individuals create the value they’re looking for. We’re a network of firms in 157 countries with more than 195,000 people who are committed to delivering quality
in assurance, tax and advisory services. Tell us what matters to you and find out more by visiting us
at http://www.pwc.com/

pwc.com
© 2015 PwC. All rights reserved. PwC refers to the PwC network and/or one or more of its member firms, each of which is a separate legal entity. Please see http://www.pwc.com/structure for further details. This content is for general information purposes only, and should not be used as a substitute for consultation with professional advisors.