global technology, media and telecom (tmt) m&a quarterly · framework, tmt m&a activity in...
TRANSCRIPT

Global Technology, Media and Telecom (TMT) M&A QuarterlyQ4’2018

©2019 KPMG Corporate Finance, a Delaware limited liability company. Member FINRA and SIPC. KPMG CorporateFinance is a subsidiary of KPMG LLP, a Delaware limited liability partnership and the U.S. member firm of the KPMGnetwork of independent member firms affiliated with KPMG International Cooperative (“KPMG International”), a Swiss entity.All rights reserved. NDPPS 640221
2
Selected Recent Transactions (1)
2014-2018 Advisor Rankings(3) # of Deals
1. KPMG(1) 2,260
2. PwC 2,066
3. Ernst & Young LLP 1,426
4. Rothschild & Co. 1,402
5. Deloitte 1,393
6. Houlihan Lokey 1,274
7. BDO 1,100
8. Lazard 922
9. IMAP 854
10. Oaklins 832
Source: Thomson Reuters SDC
(1) Represents the Corporate Finance practices of KPMG International’s network of independent member firms.(2) Using conversion rate as on November 21. 2018 (1 GBP = 1.279 USD).(3) League tables include completed deals which have value between $0 to $500mm and also where deal value is not disclosed.
2018 Advisor Rankings(3) # of Deals
1. KPMG(1) 464
2. PwC 365
3. Deloitte 339
4. Rothschild & Co. 313
5. Houlihan Lokey 261
6. Ernst & Young LLP 235
7. BDO 229
8. Lazard 201
9. Sumitomo Mitsui Financial 184
10. Oaklins 173
Co
mm
un
icat
ion
Tec
hn
olo
gy
and
Ele
ctro
nic
sIT
Ser
vice
s an
d B
PO
Inte
rnet
an
d M
edia
So
ftw
are
2018 TMT Advisor Rankings(3) # of Deals
1. KPMG(1) 70
2. Deloitte 62
3. BDO 53
4. PwC 52
5. Raymond James Financial 51
6. Rothschild & Co. 48
7. Ernst & Young LLP 47
8. Oaklins 46
9. Houlihan Lokey 44
10. Sumitomo Mitsui Financial 38
LCL
Value not disclosedDecember 2017
advised LCL on its sale to Kakaku.com
KPMG CF Japan
KPMG CF United Kingdom
PRIME Research
Value not disclosedJanuary 2018
advised PRIME Research on its sale to Cision Ltd.
KPMG CF Sweden
Vitruvian Partners
Value not disclosedDecember 2017
advised Vitruvian Partners on its acquisition of The EasyPark Group
KPMG CF United States
TRS Technologies
Value not disclosedJanuary 2018
advised TRS Technologies, Inc. on its sale to Tayca Corporation
KPMG CF United Kingdom
GCI
$264.2 millionMay 2018
advised GCI on its sale to Mayfair Equity Partners
KPMG CF United Kingdom
RIBA Enterprises
Value not disclosedJune 2018
advised RIBA Enterprises in raising a minority investment of 42.5% from LDC
KPMG CF United States
Eze Castle Integration
Value not disclosedMay 2018
advised Eze Castle Integration on raising an investment from H.I.G. Capital
KPMG CF United States
BeneSys
Value not disclosedOctober 2018
advised BeneSys on its sale from The Riverside Company to Tenex Capital
Management
KPMG CF United States
tCell.io
Value not disclosedOctober 2018
advised tCell.io on its sale to Rapid7
KPMG CF United Kingdom
Tenzing Private Equity
Value not disclosedOctober 2018
advised Tenzing Private Equity LLP on the acquisition of Corvia Ltd (Ticketer)
KPMG CF United Kingdom
Ink
Value not disclosedOctober 2018
advised the shareholders of Volanti Media (Holdings) Limited (Ink) on its sale to The
Stagwell Group
KPMG CF Netherlands
TVcN
Value not disclosedJanuary 2019
advised ManpowerGroup Netherlands B.V. on the sale of TVcN B.V. to Opportunity
Partners
KPMG CF Netherlands
ProActiveSoftware
Value not disclosedNovember 2018
advised ProActive Software on its sale to Visma Group
KPMG CF United States & Japan
ReachLocal Japan
Value not disclosedSeptember 2018
advised ReachLocal Japan on its sale to New Horizon Capital
KPMG CF United States
Ubisense
$44.8 million(2)
December 2018
advised Ubisense on the sale of its SmartSpace division to Investcorp
Technology Partners
KPMG CF Canada
Logiq3
Value not disclosedDecember 2017
advised Logiq3 on its sale to Reinsurance Group of America

©2019 KPMG Corporate Finance, a Delaware limited liability company. Member FINRA and SIPC. KPMG CorporateFinance is a subsidiary of KPMG LLP, a Delaware limited liability partnership and the U.S. member firm of the KPMGnetwork of independent member firms affiliated with KPMG International Cooperative (“KPMG International”), a Swiss entity.All rights reserved. NDPPS 640221
3
KPMG CF Transaction Spotlight
Overview: KPMG Corporate Finance LLC (“KPMG CF”) acted as the exclusive investment
banking advisor to tCell on its sale to Rapid7. tCell is a best-in-class security platform designed to protect web applications in the
cloud. tCell combines the best features of web application firewalls and runtimeapplication self-protection, and is the only next generation web application firewalldesigned for cloud deployment in production environments.
Engagement: KPMG CF’s deep industry knowledge, effective positioning, strong relationships
with strategic and financial acquirers, and ability to drive a competitive processresulted in a successful outcome for all parties.
Overview: A global team of KPMG Corporate Finance professionals from KPMG Corporate
Finance LLC in the U.S. and KPMG Corporate Finance UK (collectively “KPMGCorporate Finance) acted as the exclusive financial advisor to Ubisense on the saleof its SmartSpace division to Investcorp Technology Partners, an affiliate ofInvestcorp Bank B.S.C., for an enterprise value of £35.0 million ($44.8 million)(2).
SmartSpace provides an Industrial Internet of Things (“I-IoT”) platform for real-time linkage of customers’ information technology and discrete manufacturingactivities.
SmartSpace’s solution includes a highly scalable, modular software platform andReal-Time Location System (“RTLS”) sensing hardware. The SmartSpace platformconverts dynamic location data into actionable information in order to form adigital twin, enabling enhanced optimization, visualization, analytics and control ofindustrial processes.
Engagement: The key factors leading to KPMG Corporate Finance’s selection as advisor were our
industry knowledge of I-IoT technology and business models, our history as aleading IoT transaction advisor, our knowledge of key strategic and financialbuyers, the team’s carve out transaction expertise, as well as our ability to presenta world class, cross-border investment banking team to the client’s board.
KPMG US originated the opportunity and partnered closely with the UKTechnology Investment Banking team who were integral in winning theengagement and supporting the sell side process
Additionally, the FDD team in London was brought in to deliver a seller’s QoEreport.
Value not disclosedOctober 2018
Acted as the lead financial advisor to
on its sale to
$44.8 million(2)
December 2018
Acted as the financial advisor to
on the sale of its SmartSpace division to
SellerBuyer
(1) Represents the Corporate Finance practices of KPMG International’s network of independent member firms.(2) Using conversion rate as on November 21. 2018 (1 GBP = 1.279 USD).
Buyer Seller

©2019 KPMG Corporate Finance, a Delaware limited liability company. Member FINRA and SIPC. KPMG CorporateFinance is a subsidiary of KPMG LLP, a Delaware limited liability partnership and the U.S. member firm of the KPMGnetwork of independent member firms affiliated with KPMG International Cooperative (“KPMG International”), a Swiss entity.All rights reserved. NDPPS 640221
4
• Driven by a wave of mega deals announced by the likes of IBM, HCL, and SAP, the TMT sectorregistered 2,298 deals aggregating $200.6 billion in the last quarter of 2018, making 2018 a recordyear in terms of deal value, surpassing the previous record set in 2015.
• The largest deal announced in the quarter was IBM’s $33.6 billion acquisition of Red Hat. Oncecompleted, this will represent the largest software deal and the third largest technology acquisition.
• On similar lines, deal value in the mid-market segment (<$500 million) witnessed a Y-o-Y growth of~23% with deal value increasing from $39.5 billion in Q4’2017 to $48.6 billion in Q4’2018.
• Supported by continued high volume of dry powder, private equity activity picked up in the quarter,reaching a total of 208 deals, compared to 174 deals in Q3’2018.
• Strengthened by continued activity in the machine learning, cloud computing, IoT, converged ITinfrastructure, and big data space, both financial and strategic players are expected to carry themomentum in deal volume through the coming year.
Global TMT Sector M&A Activity
Sub-sector M&A activity
IT Services and BPO (2)
Internet and Media (3) Software (4)
Sources: Thomson One and other publicly available information.
Notes: We have sourced the sub-sector classifications from Capital IQ as below:(1) Communications Technology and Electronics: Computers & Peripherals; Electronics; Semiconductors; Space and Satellites; Telecommunications Equipment;
Telecommunications Services; Wireless; and Other Telecom.(2) IT Services and BPO: Companies/targets with primary industry classification as IT Consulting & Services.(3) Internet and Media: Advertising & Marketing; Broadcasting; Cable; Casinos & Gaming; E-commerce / B2B; Internet and Catalog Retailing; Internet Infrastructure;
Motion Pictures / Audio Visual; Publishing ; and Other Media & Entertainment.(4) Software: Companies/targets with primary industry classification as Internet Software & Services; Software; and Other High Technology.(5) Deal Values are based on transactions with disclosed deal values only.
(Aggregate values in $ billions) (5)
Value # of Deals Value
Q4’18 $80.7 571 $15.2 546
Q4’17
# of Deals
$49.1 519 $12.5 501
Total Deals <$500 mm Deals
Value # of Deals Value
Q4’18 $8.3 423 $6.2 421
Q4’17
# of Deals
$10.4 431 $5.1 426
Total Deals <$500 mm Deals
Value # of Deals Value
Q4’18 $32.4 564 $11.1 548
Q4’17
# of Deals
$117.5 673 $9.7 661
Total Deals <$500 mm Deals
Value # of Deals Value
Q4’18 $79.1 740 $16.0 723
Q4’17
# of Deals
$43.9 767 $12.2 751
Total Deals <$500 mm Deals
Communications Technology and Electronics (1)

©2019 KPMG Corporate Finance, a Delaware limited liability company. Member FINRA and SIPC. KPMG CorporateFinance is a subsidiary of KPMG LLP, a Delaware limited liability partnership and the U.S. member firm of the KPMGnetwork of independent member firms affiliated with KPMG International Cooperative (“KPMG International”), a Swiss entity.All rights reserved. NDPPS 640221
5
Country Spotlight: KPMG CF’s Technology Practice in Nordics• Fueled by stable political climate and positive policy
framework, TMT M&A activity in the Nordics region hasposted strong numbers and overall growth in 2018.
• Some of the key trends observed in the Nordics M&Aspace are:o Pushed by two megadeals: Danish telecom operator,
TDC’s $6.7 billion take-private deal, and the $4.2billion(2) acquisition of Sweden based Com HemHolding by Tele2 AB, Nordic TMT M&A saw a 780%increase in value, with the total deal value amountingfrom $2.2 billion(2) in 2017 to $19.1 billion(2) till YTD2018(1).
o In terms of deal value, TMT deals constituted ~30% ofall the deals in the region for YTD 2018(1).
o Private and venture capital investment scaled theirhighest levels in terms of volume, with PE playersshowing interest in both small and large IT companies.
o Nordic private equity saw 36 TMT deals in YTD 2018(1)
– a 20% increase in volume compared to 2017.o In the last few years, the region has witnessed large
scale consolidation in the telecom sector. This can behighlighted through the recent acquisition of TDCGroup and the merger of several regional telecombusinesses.
Recent Transactions
Acted as financial adviser to Procuritas
Partners Ab in the acquisition of NetcontrolOy
Procuritas Partners Ab
Value Undisclosed
KPMG
August 2018
Provided FDD and TDD assistance to Kinnevik and IAG in connection with their investment in
Monese Limited
Kinnevik and IAG
Value Undisclosed
KPMG
September 2018
Acting as financial adviser to a managed service provider on an
ongoing deal
Project Gold
Value Undisclosed
KPMG
Ongoing
Provided FDD and TDD assistance to Kinnevik on the acquisition of
Kolonial.no
Kinnevik
Value Undisclosed
KPMG
August 2018
Provided sell-side assistance on the sale of
the company to Total Specific Solutions B.V
Forskringens Datacenter A/S
KPMG
Value UndisclosedAugust 2018
Provided FDD and TDD assistance to Viria Oyj on their acquisition of
Ymon Oy.
Viria OyjKPMG
Value UndisclosedAugust 2018
Provided FDD and TDD assistance to Siili
Solutions Oyj on their acquisition of Vala Group
Oy.
Siili Solutions Oyj
Value Undisclosed
KPMG
August 2018
Provided FDD assistance to Kinnevik on the acquisition of
Swedish start-up Karma
Kinnevik
Value Undisclosed
KPMG
August 2018
Provided due diligence services to Axcel on their acquisition of Loopia & Active 24 from Visma
Axcel
Value Undisclosed
KPMG
June 2018
Acted as financial adviser to Administer Oy in raising acquisition and
growth capital from Bocap and in their
acquisition of Silta Oy
Administer Oy
Value Undisclosed
KPMG
May 2018
Provided FDD assistance to Vitruvian
on the acquisition of parking app EasyPark
VitruvianDeal Advisory
Value UndisclosedDecember 2017
Provided financial, tax, technology due diligence and valuation services to
Nordea on the acquisition of Tink
NordeaKPMG
Value UndisclosedOctober 2017
Key TMT Team Members
Martin EricssonPartner CFKPMG, Sweden
Nigel RousePartner TS, Head of TMT sectorKPMG, Sweden
Tom NymanPartner CF, Head of TMT sectorKPMG, Finland
Stian ThynessSenior Manager, Head of TMT sectorKPMG, Norway
Eric Bots-BjerreDirector, Head of TMT sectorKPMG, Denmark
The Nordics TMT team comprises of approximately 35 professionals across Deal Advisory and is led by the following:
$6.5$3.9
$11.5
$2.2
$19.2
2014 2015 2016 2017 2018YTD
Deal Value ($bn)
23 24 26 30 36
118 136 135 139 118
141160 161 169
154
2014 2015 2016 2017 2018YTD
PE deal count Strategic deal count
(1) As of October 15, 2018.(2) Using conversion rate as on January 14. 2019 (1 Euro = 1.146 USD).
(2)
(1)
(1)

©2019 KPMG Corporate Finance, a Delaware limited liability company. Member FINRA and SIPC. KPMG CorporateFinance is a subsidiary of KPMG LLP, a Delaware limited liability partnership and the U.S. member firm of the KPMGnetwork of independent member firms affiliated with KPMG International Cooperative (“KPMG International”), a Swiss entity.All rights reserved. NDPPS 640221
6
$114.2 $176.6
$208.7
$319.4
$106.2 $110.4 $146.5
$221.0 $270.0
$395.8
$211.4 $200.6
2,137 2,287 2,157 2,295 2,332 2,443 2,444 2,3902,684
2,2582,281 2,298
-500
400
1,300
2,200
3,100
4,000
$0.0
$100.0
$200.0
$300.0
$400.0
$500.0
Q1'16 Q2'16 Q3'16 Q4'16 Q1'17 Q2'17 Q3'17 Q4'17 Q1'18 Q2'18 Q3'18 Q4'18
Deal V
olum
eD
eal V
alu
e ($
bn
)
Deal Value ($ bn) Deal Volume
$31.6 $31.9 $27.8
$36.6 $34.6 $34.0 $39.2 $39.5
$45.4 $38.3
$43.0 $48.6
2,0982,228
2,1062,240 2,292
2,394 2,404 2,339
2,622
2,195 2,238 2,238
0
500
1,000
1,500
2,000
2,500
3,000
$0.0
$10.0
$20.0
$30.0
$40.0
$50.0
Q1'16 Q2'16 Q3'16 Q4'16 Q1'17 Q2'17 Q3'17 Q4'17 Q1'18 Q2'18 Q3'18 Q4'18
Deal V
olumeD
eal V
alue
($
bn)
Deal Value ($ bn) Deal Volume
91.2% 89.2% 89.9% 90.9% 89.9% 89.1% 88.5% 88.8% 88.1% 87.1% 89.6% 87.5%
8.8% 10.8% 10.1% 9.1% 10.1% 10.9% 11.5% 11.2% 11.9% 12.9% 10.4% 12.5%
0%
20%
40%
60%
80%
100%
Q1'16 Q2'16 Q3'16 Q4'16 Q1'17 Q2'17 Q3'17 Q4'17 Q1'18 Q2'18 Q3'18 Q4'18
Dea
l Vol
ume
(%)
Strategic Buyers Financial Buyers
(1) Based on deals with disclosed deal values only.
Q4’18Change (%) Deal Value # of DealsYoY (9.2)% (3.8%)
QoQ (5.1%) 0.7%
Global TMT M&A Trend: Q1’16 – Q4’18
Global TMT M&A Trend by Buyer Type: Q1’16 – Q4’18
Global TMT Mid-Market M&A Trend (<$500 mm) (1): Q1’16 – Q4’18
Source: Thomson One
©2019 KPMG Corporate Finance, a Delaware limited liability company. Member FINRA and SIPC. KPMG CorporateFinance is a subsidiary of KPMG LLP, a Delaware limited liability partnership and the U.S. member firm of the KPMGnetwork of independent member firms affiliated with KPMG International Cooperative (“KPMG International”), a Swiss entity.All rights reserved. NDPPS 640221
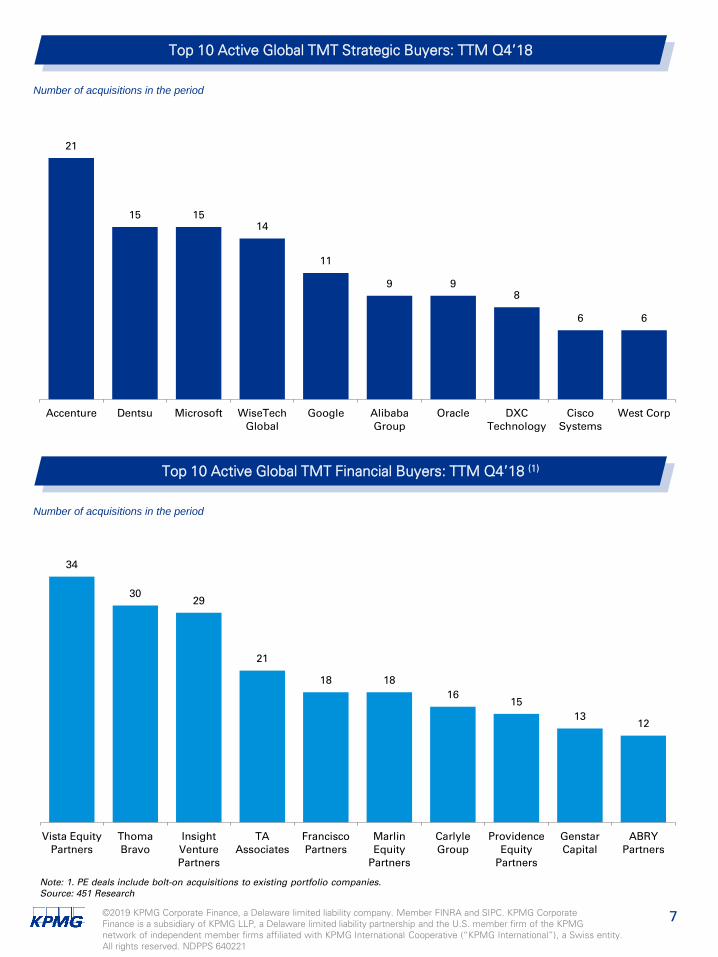
7
21
15 1514
11
9 98
6 6
Accenture Dentsu Microsoft WiseTechGlobal
Google AlibabaGroup
Oracle DXCTechnology
CiscoSystems
West Corp
34
3029
21
18 1816
1513
12
Vista EquityPartners
ThomaBravo
InsightVenturePartners
TAAssociates
FranciscoPartners
MarlinEquity
Partners
CarlyleGroup
ProvidenceEquity
Partners
GenstarCapital
ABRYPartners
Note: 1. PE deals include bolt-on acquisitions to existing portfolio companies.Source: 451 Research
Top 10 Active Global TMT Strategic Buyers: TTM Q4’18
Top 10 Active Global TMT Financial Buyers: TTM Q4’18 (1)
Number of acquisitions in the period
Number of acquisitions in the period

©2019 KPMG Corporate Finance, a Delaware limited liability company. Member FINRA and SIPC. KPMG CorporateFinance is a subsidiary of KPMG LLP, a Delaware limited liability partnership and the U.S. member firm of the KPMGnetwork of independent member firms affiliated with KPMG International Cooperative (“KPMG International”), a Swiss entity.All rights reserved. NDPPS 640221
8
2.9x 2.9x 3.0x 3.0x 3.2x 3.3x 3.3x 3.3x 3.3x 3.1x 3.1x 2.8x
14.5x 14.9x 15.6x 15.9x17.0x 17.3x 18.0x 17.9x 17.3x 17.0x
16.1x14.7x
0.0x
5.0x
10.0x
15.0x
20.0x
Q1'16 Q2'16 Q3'16 Q4'16 Q1'17 Q2'17 Q3'17 Q4'17 Q1'18 Q2'18 Q3'18 Q4'18EV/Revenue EV/EBITDA
2.0x 2.0x 2.2x 1.9x
2.6x 2.0x
2.3x 2.3x 2.2x 2.8x 2.2x 2.3x
14.1x
12.0x
13.6x 13.7x 13.3x 13.7x
11.9x 12.8x
18.2x
16.6x 16.3x
11.3x
0.0x
4.0x
8.0x
12.0x
16.0x
20.0x
Q1'16 Q2'16 Q3'16 Q4'16 Q1'17 Q2'17 Q3'17 Q4'17 Q1'18 Q2'18 Q3'18 Q4'18
EV/Revenue EV/EBITDA
80
100
120
140
160
180
200
Jan-16 Jul-16 Dec-16 Jul-17 Dec-17 Jul-18 Dec-18
(Jan
uar
y 1,
201
6 =
100)
S&P Global 1200 Information Technology S&P Global 1200 MediaS&P Global 1200 Telecommunication Services
+0.4%
S&P Global TMT Index Price Performance: Q1’16 – Q4’18
Global TMT Public LTM Multiples (1,2): Q1’16 – Q4’18
Global TMT M&A Transactions LTM Multiples (2): Q1’16 – Q4’18
Source: Thomson One, Capital IQ.
(1) Trading multiples include average multiples calculated for all the ‘Public Companies’ operating in the TMT space (with market capitalization of at least $500mm) classified under the primary industry classifications listed on all major exchanges globally.
(2) EV/Revenue and EV/EBITDA multiples greater than 10.0x and 50.0x, respectively, were excluded from the analysis.
+47.3%
-9.2%

©2019 KPMG Corporate Finance, a Delaware limited liability company. Member FINRA and SIPC. KPMG CorporateFinance is a subsidiary of KPMG LLP, a Delaware limited liability partnership and the U.S. member firm of the KPMGnetwork of independent member firms affiliated with KPMG International Cooperative (“KPMG International”), a Swiss entity.All rights reserved. NDPPS 640221
9
Market Data Operating Metrics Valuation Multiples$ value millions, except per share
LatestQuarterEnding
SharePrice
% of 52Week High
Market Cap. (1)
EnterpriseValue (2)
Revenue Revenue Growth (3)LTM
GrossLTM
EBITDA EV / Revenue EV / EBITDA
Company Name LTM 2018E 2019E 2017 – 2018E 2018E – 2019E Margin% Margin% LTM 2018E 2019E LTM 2018E 2019E
Communication Services
Verizon Sep-18 $56.22 91.3% $232,302 $345,611 $130,537 $130,927 $132,346 4.6% 1.1% 58.8% 36.5% 2.6x 2.6x 2.6x 7.3x 7.3x 7.1x
AT&T Sep-18 $28.54 72.6% $207,714 $385,258 $164,439 $174,040 $185,421 8.7% 6.5% 52.8% 31.2% 2.3x 2.2x 2.1x 7.5x 6.8x 6.3x
China Mobile Sep-18 $9.62 89.6% $197,007 $129,304 $107,545 $108,335 $111,226 (5.4%) 2.7% 67.9% 39.9% 1.2x 1.2x 1.2x 3.0x 3.2x 3.2x
Deutsche Telekom Sep-18 $16.95 94.7% $80,324 $158,485 $89,425 $86,041 $89,898 (4.6%) 4.5% 31.0% 27.6% 1.8x 1.8x 1.8x 6.4x 6.0x 5.7x
NTT Sep-18 $40.85 82.2% $77,950 $129,818 $104,874 NA $108,373 NA NA 51.1% 26.6% 1.2x NA 1.2x 4.7x NA 4.5x
Vodafone Sep-18 $1.95 63.8% $52,069 $89,575 $52,622 $52,884 $52,856 (11.0%) (0.1%) 30.0% 26.5% 1.7x 1.7x 1.7x 6.4x 5.4x 5.3x
Telefónica Sep-18 $8.40 85.3% $43,076 $107,843 $57,804 $55,804 $56,060 (10.7%) 0.5% 59.9% 34.1% 1.9x 1.9x 1.9x 5.5x 5.9x 5.9x
Orange S.A. Jun-18 $16.21 92.8% $42,990 $81,686 $48,151 $47,181 $48,235 (4.1%) 2.2% 39.1% 30.4% 1.7x 1.7x 1.7x 5.6x 5.5x 5.4x
SingTel Sep-18 $2.15 80.3% $35,108 $42,410 $12,814 $12,698 $12,861 (3.0%) 1.3% 29.4% 28.2% 3.3x 3.3x 3.3x 11.7x 11.6x 11.7x
Telstra Jun-18 $2.01 75.3% $23,864 $35,593 $19,239 $19,942 $19,269 (11.1%) (3.4%) 47.1% 25.4% 1.9x 1.8x 1.8x 7.3x 5.3x 5.7x
Comm. Services Upper Quartile 90.9% 2.2x 2.2x 2.0x 7.3x 6.8x 6.2x
Comm. Services Median 83.8% 1.8x 1.8x 1.8x 6.4x 5.9x 5.6x
Comm. Services Lower Quartile 76.5% 1.7x 1.7x 1.7x 5.5x 5.4x 5.4x
Communication Technology
Cisco Systems Oct-18 $43.33 87.6% $194,810 $177,862 $50,266 $50,802 $52,285 5.8% 2.9% 62.2% 30.0% 3.5x 3.5x 3.4x 11.8x 9.9x 9.6x
TSMC Sep-18 $7.37 84.1% $191,026 $176,243 $33,428 $33,678 $36,225 2.3% 7.6% 48.9% 65.9% 5.3x 5.2x 4.9x 8.0x 8.0x 7.4x
Broadcom Nov-18 $254.28 92.7% $103,561 $116,762 $20,848 $21,388 $24,985 13.5% 16.8% 66.3% 45.9% 5.6x 5.5x 4.7x 12.2x 8.2x 7.7x
Keyence Sep-18 $507.50 76.9% $61,541 $52,887 $5,069 $5,329 $5,856 22.6% 9.9% 82.4% 56.3% NM 9.9x 9.0x 18.5x 17.9x 16.1x
Nokia Sep-18 $5.76 93.4% $32,211 $29,851 $25,963 $25,588 $26,547 (7.1%) 3.7% 39.6% 10.4% 1.1x 1.2x 1.1x 11.0x 9.4x 7.6x
Foxconn (Hon Hai) Sep-18 $2.31 58.2% $32,061 $35,384 $171,005 $166,401 $167,732 6.1% 0.8% 6.0% 3.1% 0.2x 0.2x 0.2x 6.6x 6.3x 5.8x
Ericsson Sep-18 $8.77 91.0% $28,863 $27,948 $22,592 $23,389 $23,428 (5.3%) 0.2% 32.7% 3.2% 1.2x 1.2x 1.2x 38.5x 13.2x 9.1x
FleetCor Technologies Sep-18 $185.72 80.7% $16,464 $20,012 $2,400 $2,412 $2,585 7.4% 7.2% 79.2% 53.8% 8.3x 8.3x 7.7x 15.5x 14.7x 13.5x
Citrix Sep-18 $102.46 87.7% $13,808 $14,131 $2,950 $2,963 $3,085 4.9% 4.1% 86.9% 30.9% 4.8x 4.8x 4.6x 15.5x 12.9x 12.6x
ZTE Sep-18 $2.85 50.4% $11,218 $12,683 $13,248 $12,597 $14,938 (26.1%) 18.6% 31.2% (0.8%) 1.0x 1.0x 0.8x NM 15.2x 9.3x
Juniper Networks Sep-18 $26.91 87.4% $9,288 $8,037 $4,706 $4,691 $4,787 (6.6%) 2.0% 59.1% 17.9% 1.7x 1.7x 1.7x 9.6x 7.7x 7.4x
Amdocs Sep-18 $58.58 81.7% $8,176 $7,700 $3,975 $4,006 $4,125 2.9% 3.0% 34.7% 18.2% 1.9x 1.9x 1.9x 10.6x 9.6x 8.9x
Comm. Technology Upper Quartile 88.5% 5.0x 5.3x 4.8x 15.5x 13.5x 10.4x
Comm. Technology Median 85.8% 1.9x 2.7x 2.6x 11.8x 9.8x 9.0x
Comm. Technology Lower Quartile 79.7% 1.2x 1.2x 1.2x 10.1x 8.2x 7.6x
Electronics
Apple Sep-18 $157.74 67.6% $748,539 $796,721 $265,595 $268,531 $280,447 12.6% 4.4% 38.3% 30.8% 3.0x 3.0x 2.8x 9.7x 9.7x 9.6x
Samsung Sep-18 $34.76 71.5% $230,997 $171,905 $225,656 $223,134 $221,427 (0.7%) (0.8%) 46.5% 35.2% 0.8x 0.8x 0.8x 2.2x 2.2x 2.4x
Sony Corporation Sep-18 $48.54 76.4% $61,616 $57,522 $77,106 $80,010 $80,824 7.5% 1.0% 27.7% 12.7% 0.7x 0.7x 0.7x 5.9x 5.1x 5.0x
Canon Sep-18 $27.35 68.3% $29,534 $31,106 $35,369 $36,549 $36,743 0.8% 0.5% 47.2% 15.5% 0.9x 0.9x 0.8x 5.7x 5.8x 5.8x
Panasonic Corporation Sep-18 $9.03 56.9% $21,058 $23,163 $71,661 $74,796 $77,509 8.1% 3.6% 28.6% 8.0% 0.3x 0.3x 0.3x 4.1x 3.7x 3.3x
LG Electronics Inc. Sep-18 $55.96 54.4% $9,522 $17,556 $56,334 $55,822 $59,641 (1.4%) 6.8% 24.4% 7.9% 0.3x 0.3x 0.3x 4.0x 4.0x 3.7x
Lenovo Sep-18 $0.68 88.2% $8,116 $11,604 $48,869 $49,939 $51,877 13.9% 3.9% 13.8% 3.7% 0.2x 0.2x 0.2x 6.5x 6.7x 6.2x
Electronics Upper Quartile 73.9% 0.8x 0.8x 0.8x 6.2x 6.2x 6.0x
Electronics Median 68.3% 0.7x 0.7x 0.7x 5.7x 5.2x 5.0x
Electronics Lower Quartile 62.2% 0.3x 0.3x 0.3x 4.0x 3.8x 3.6x
Global TMT Selected Public Comps: Communications Technology & Electronics
Source: Capital IQ. Financials are calendarized to December year-end.(1) Market Data including Market Capitalization amounts are based on closing share prices as of December 31, 2018.(2) Enterprise Value (EV) equals Market Capitalization plus Debt, Preferred Equity, and Minority Interest, minus Cash and Cash Equivalents.(3) EBITDA equals Earnings before Interest,Taxes, Depreciation, and Amortization.

©2019 KPMG Corporate Finance, a Delaware limited liability company. Member FINRA and SIPC. KPMG CorporateFinance is a subsidiary of KPMG LLP, a Delaware limited liability partnership and the U.S. member firm of the KPMGnetwork of independent member firms affiliated with KPMG International Cooperative (“KPMG International”), a Swiss entity.All rights reserved. NDPPS 640221
10
Source: 451research.
Announced Date Target Name Target Country Acquirer Name Deal Value
($ mm)EV /
RevenueEV /
EBITDA
26-Dec-2018 Frontline P.C.B. Solutions Israel Orbotech Ltd. $95 - -
20-Dec-2018 Small Giant Games Oy Finland Zynga Inc. $560 - -
19-Dec-2018 WirelessCar [Volvo Group] Sweden Volkswagen AG $121 2.2x -
18-Dec-2018 Luxtera Inc. U.S. Cisco Systems Inc. $660 - -
14-Dec-2018 Antelliq Group [BC Partners] U.S. Merck & Co. Inc. $2,400 8.9x -
12-Dec-2018 Sparton Corporation U.S. Cerberus Capital Management $182 0.5x 6.9x
12-Dec-2018Kcell JSC [Telia Company/Fintur Holdings] Kazakhstan Kazakhtelecom JSC $446 1.0x 2.7x
07-Dec-2018 Pioneer Corp. Japan Baring Private Equity Partners $902 0.2x 3.2x
03-Dec-2018 Reciprocal Labs Corp. U.S. ResMed Inc. $225 - -
27-Nov-2018 SSI Controls Technologies U.S. Amphenol Corporation $400 2.2x -
26-Nov-2018 E2M Technologies B.V. Netherlands MTS Systems Corporation $80 - -
21-Nov-2018Ubisense Group (RTLS SmartSpace business unit) U.K. Investcorp Technology Partners $45 3.2x -
14-Nov-2018 Astronics Corporation U.S. Advantest Corporation $185 - -
12-Nov-2018 Siltectra GmbH [MIG AG] Germany Infineon Technologies AG $142 - -
09-Nov-2018 Finisar Corporation U.S. II-VI Incorporated $3,200 2.6x -
09-Nov-2018 Amimon Inc. U.S. The Vitec Group PLC $55 - -
08-Nov-2018 ARRIS International plc U.S. CommScope Inc. $7,400 1.3x 14.4x
30-Oct-2018 Electro Scientific Industries U.S. MKS Instruments Inc. $1,041 2.4x 8.8x
29-Oct-2018 Alpha Technologies Inc. U.S. EnerSys $750 1.3x -
26-Oct-2018 Clarion Co. Ltd. [Hitachi] Japan Faurecia SA $1,256 0.7x 8.9x
24-Oct-2018 Advanced Traffic Solutions U.S. Cubic Corporation $236 - -
24-Oct-2018 Tactilis Sdn Bhd Malaysia Global Invacom Group Ltd. $198 - -
22-Oct-2018Suzhou Huaqi Intelligent Technology Co. [NetPosa] China BII Railway Transportation
Technology Holdings Co. Ltd.$159 - -
14-Oct-2018 L3 Technologies Inc. U.S. Harris Corporation $15,640 1.8x -
11-Oct-2018 Dialog Semiconductor Germany Apple Inc. $300 - -
11-Oct-2018 Spireon Inc. [Bertram Capital] U.S. Greenbriar Equity Group LLC $350 - -
10-Oct-2018 Esterline Technologies U.S. TransDigm Group Incorporated $3,607 1.9x 9.7x
08-Oct-2018 Cable Onda S.A. Panama Millicom International Cellular $1,002 3.1x 7.3x
08-Oct-2018 Asia Pacific Data Centre Australia NEXTDC Ltd. $148 3.1x -
02-Oct-2018Starhome BV [Fortissimo Capital] Switzerland Vista Equity Partners Management $100 - -
Upper Quartile 2.7x 9.1x
Median 2.1x 8.1x
Lower Quartile 1.2x 6.0x
Global TMT Selected Transactions (1): Communications Technology & Electronics
(1) Top M&A transactions on the basis of disclosed deal value in Q4’18.

©2019 KPMG Corporate Finance, a Delaware limited liability company. Member FINRA and SIPC. KPMG CorporateFinance is a subsidiary of KPMG LLP, a Delaware limited liability partnership and the U.S. member firm of the KPMGnetwork of independent member firms affiliated with KPMG International Cooperative (“KPMG International”), a Swiss entity.All rights reserved. NDPPS 640221
11
Global TMT Selected Public Comps: IT Services and BPO (1/2)
Market Data Operating Metrics Valuation Multiples$ value millions, except per share
LatestQuarterEnding
SharePrice
% of 52Week High
Market Cap. (1)
EnterpriseValue (2)
Revenue Revenue Growth (3)LTM
GrossLTM
EBITDA EV / Revenue EV / EBITDA
Company Name LTM 2018E 2019E 2017 – 2018E 2018E – 2019E Margin% Margin% LTM 2018E 2019E LTM 2018E 2019E
IT Commercial Services
Accenture Nov-18 $141.01 80.3% $89,887 $85,921 $40,295 $40,590 $43,454 14.1% 7.1% 31.5% 16.3% 2.1x 2.1x 2.0x 13.1x 12.5x 11.8x
CGI Group Sep-18 $61.19 95.7% $16,915 $18,154 $8,902 $8,529 $8,803 (2.3%) 3.2% 30.6% 16.8% 2.0x 2.1x 2.1x 12.2x 11.6x 11.0x
Capgemini Jun-18 $99.38 72.5% $16,134 $18,900 $15,143 $15,067 $16,149 (1.7%) 7.2% 26.3% 12.4% 1.2x 1.3x 1.2x 10.0x 9.0x 8.2x
DXC Technology Sep-18 $53.17 49.3% $14,894 $19,478 $24,162 $21,746 $20,818 7.9% (4.3%) 29.0% 22.6% 0.8x 0.9x 0.9x 3.6x 4.0x 4.1x
Atos (4) Jun-18 $81.84 54.6% $8,739 $12,723 $14,805 $14,108 $15,632 (7.8%) 10.8% 14.5% 12.6% 0.9x 0.9x 0.8x 6.8x 6.7x 5.5x
Virtusa Sep-18 $42.59 72.7% $1,274 $1,501 $1,151 $1,200 $1,363 24.9% 13.6% 29.3% 7.5% 1.3x 1.3x 1.1x 17.3x 16.1x 11.1x
Perficient Sep-18 $22.26 71.6% $739 $813 $488 $495 $525 9.4% 6.1% 35.3% 11.7% 1.7x 1.6x 1.5x 14.3x 10.9x 9.6x
Unisys Sep-18 $11.63 55.5% $593 $760 $2,809 $2,815 $2,852 4.2% 1.3% 23.2% 10.3% 0.3x 0.3x 0.3x 2.6x 1.9x 1.8x
IT Commercial Svs Upper Quartile 74.6% 1.8x 1.8x 1.7x 13.4x 11.8x 10.8x
IT Commercial Svs Median 72.0% 1.3x 1.3x 1.1x 11.1x 9.9x 8.9x
IT Commercial Svs Lower Quartile 55.3% 0.8x 0.9x 0.9x 6.0x 5.9x 5.1x
Government Consulting
Tyler Technologies Sep-18 $185.82 73.6% $7,214 $6,942 $911 $938 $1,039 11.2% 10.8% 47.1% 21.3% 7.6x 7.4x 6.7x 35.8x 24.7x 21.7x
Booz Allen Hamilton Sep-18 $45.07 85.2% $6,415 $7,857 $6,367 $6,500 $6,971 5.9% 7.2% 23.8% 9.9% 1.2x 1.2x 1.1x 12.4x 12.2x 11.6x
MAXIMUS Sep-18 $65.09 89.5% $4,174 $3,807 $2,392 $2,441 $3,023 (1.1%) 23.8% 24.8% 14.7% 1.6x 1.6x 1.3x 10.9x 10.8x 9.3x
CACI International Sep-18 $144.03 71.7% $3,579 $4,599 $4,548 $4,637 $4,923 5.6% 6.2% 33.6% 9.7% 1.0x 1.0x 0.9x 10.4x 10.3x 10.2x
Science Applications International Nov-18 $63.70 68.3% $2,710 $3,554 $4,595 $4,587 $4,728 4.8% 3.1% 9.8% 7.5% 0.8x 0.8x 0.8x 10.3x 10.5x 9.9x
ManTech International Sep-18 $52.30 76.8% $2,078 $2,063 $1,924 $1,955 $2,102 13.9% 7.5% 14.5% 8.4% 1.1x 1.1x 1.0x 12.8x 12.3x 11.1x
ICF International Sep-18 $64.78 78.8% $1,221 $1,448 $1,281 $1,314 $1,421 8.2% 8.1% 36.3% 8.7% 1.1x 1.1x 1.0x 13.0x 11.8x 10.6x
Govt. Consulting Upper Quartile 82.0% 1.4x 1.4x 1.2x 12.9x 12.2x 11.4x
Govt. Consulting Median 76.8% 1.1x 1.1x 1.0x 12.4x 11.9x 10.6x
Govt. Consulting Lower Quartile 72.7% 1.0x 1.0x 1.0x 10.6x 10.6x 10.2x
Offshore Consulting
Wipro Sep-18 $4.74 96.0% $21,366 $18,299 $7,713 $8,260 $8,898 (3.5%) 7.7% 29.3% 17.4% 2.4x 2.2x 2.1x 13.6x 12.2x 10.7x
Tech Mahindra Sep-18 $10.39 92.6% $9,194 $8,132 $4,513 $4,880 $5,423 3.2% 11.1% 34.2% 17.0% 1.8x 1.7x 1.5x 10.6x 9.2x 8.1x
Infosys Sep-18 $9.47 87.3% $41,163 $37,506 $11,313 $11,361 $12,784 4.3% 12.5% 34.7% 26.5% 3.3x 3.3x 2.9x 12.5x 12.6x 11.6x
HCL Technologies Sep-18 $13.86 85.7% $19,296 $18,941 $8,179 $8,336 $9,432 5.5% 13.2% 34.8% 23.2% 2.3x 2.3x 2.0x 10.0x 9.8x 8.5x
Tata Consultancy Services Sep-18 $27.20 83.2% $102,061 $97,337 $18,484 $20,250 $22,814 7.0% 12.7% 44.7% 27.1% 5.3x 4.8x 4.3x 19.5x 17.5x 15.5x
MphasiS Sep-18 $14.57 79.3% $2,818 $2,526 $984 $1,077 $1,244 9.5% 15.5% 43.0% 17.3% 2.6x 2.3x 2.0x 14.8x 13.5x 11.5x
Cognizant Sep-18 $63.48 74.6% $36,757 $32,718 $15,824 $16,112 $17,355 8.8% 7.7% 39.0% 20.9% 2.1x 2.0x 1.9x 9.9x 9.8x 8.7x
Mindtree Sep-18 $12.40 73.0% $2,039 $1,925 $860 $959 $1,121 15.2% 17.0% 32.0% 15.0% 2.2x 2.0x 1.7x 14.9x 13.1x 10.8x
Hexaware Technologies Sep-18 $4.78 59.7% $1,422 $1,320 $607 $670 $786 8.5% 17.3% 23.7% 15.6% 2.2x 2.0x 1.7x 13.9x 12.1x 10.2x
Offshore Consulting Upper Quartile 87.3% 2.6x 2.4x 2.1x 14.8x 13.2x 11.8x
Offshore Consulting Median 83.2% 2.3x 2.2x 2.1x 13.6x 12.1x 10.9x
Offshore Consulting Lower Quartile 74.6% 2.2x 2.0x 1.8x 10.6x 9.9x 8.7x
Source: Capital IQ. Financials are calendarized to December year-end.(1) Market Data including Market Capitalization amounts are based on closing share prices as of December 31, 2018.(2) Enterprise Value (EV) equals Market Capitalization plus Debt, Preferred Equity, and Minority Interest, minus Cash and Cash Equivalents.(3) EBITDA equals Earnings before Interest,Taxes, Depreciation, and Amortization.(4) Atos is adjusted for Syntel’s acquisition.
©2019 KPMG Corporate Finance, a Delaware limited liability company. Member FINRA and SIPC. KPMG CorporateFinance is a subsidiary of KPMG LLP, a Delaware limited liability partnership and the U.S. member firm of the KPMGnetwork of independent member firms affiliated with KPMG International Cooperative (“KPMG International”), a Swiss entity.All rights reserved. NDPPS 640221
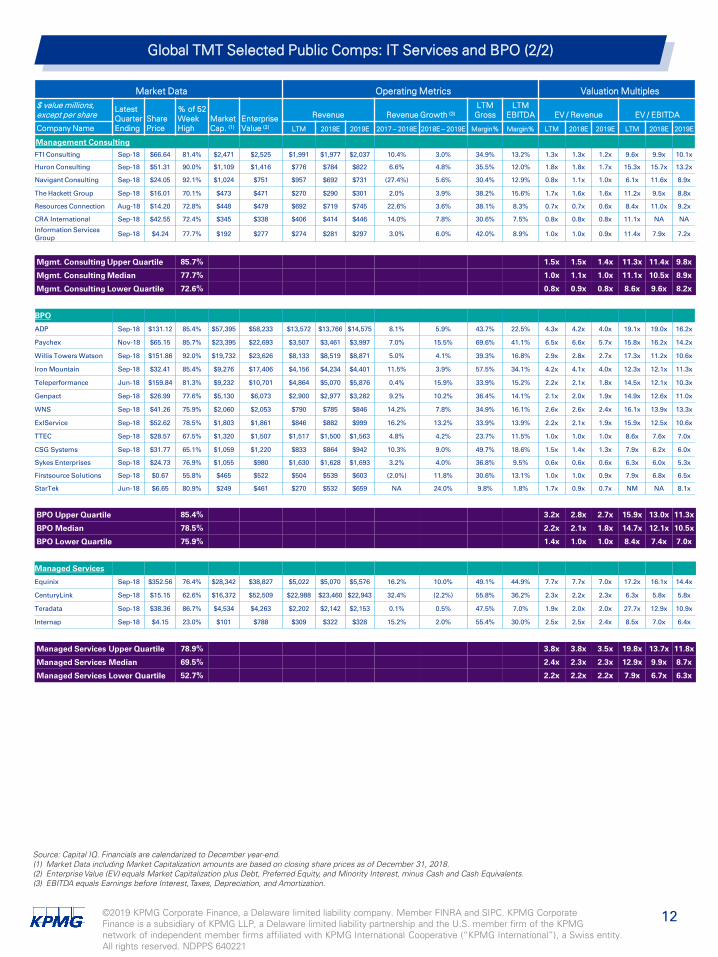
12
Global TMT Selected Public Comps: IT Services and BPO (2/2)
Market Data Operating Metrics Valuation Multiples$ value millions, except per share
LatestQuarterEnding
SharePrice
% of 52Week High
Market Cap. (1)
EnterpriseValue (2)
Revenue Revenue Growth (3)LTM
GrossLTM
EBITDA EV / Revenue EV / EBITDA
Company Name LTM 2018E 2019E 2017 – 2018E 2018E – 2019E Margin% Margin% LTM 2018E 2019E LTM 2018E 2019E
Management ConsultingFTI Consulting Sep-18 $66.64 81.4% $2,471 $2,525 $1,991 $1,977 $2,037 10.4% 3.0% 34.9% 13.2% 1.3x 1.3x 1.2x 9.6x 9.9x 10.1x
Huron Consulting Sep-18 $51.31 90.0% $1,109 $1,416 $776 $784 $822 6.6% 4.8% 35.5% 12.0% 1.8x 1.8x 1.7x 15.3x 15.7x 13.2x
Navigant Consulting Sep-18 $24.05 92.1% $1,024 $751 $957 $692 $731 (27.4%) 5.6% 30.4% 12.9% 0.8x 1.1x 1.0x 6.1x 11.6x 8.9x
The Hackett Group Sep-18 $16.01 70.1% $473 $471 $270 $290 $301 2.0% 3.9% 38.2% 15.6% 1.7x 1.6x 1.6x 11.2x 9.5x 8.8x
Resources Connection Aug-18 $14.20 72.8% $448 $479 $692 $719 $745 22.6% 3.6% 38.1% 8.3% 0.7x 0.7x 0.6x 8.4x 11.0x 9.2x
CRA International Sep-18 $42.55 72.4% $345 $338 $406 $414 $446 14.0% 7.8% 30.6% 7.5% 0.8x 0.8x 0.8x 11.1x NA NA
Information Services Group Sep-18 $4.24 77.7% $192 $277 $274 $281 $297 3.0% 6.0% 42.0% 8.9% 1.0x 1.0x 0.9x 11.4x 7.9x 7.2x
Mgmt. Consulting Upper Quartile 85.7% 1.5x 1.5x 1.4x 11.3x 11.4x 9.8x
Mgmt. Consulting Median 77.7% 1.0x 1.1x 1.0x 11.1x 10.5x 8.9x
Mgmt. Consulting Lower Quartile 72.6% 0.8x 0.9x 0.8x 8.6x 9.6x 8.2x
BPO
ADP Sep-18 $131.12 85.4% $57,395 $58,233 $13,572 $13,766 $14,575 8.1% 5.9% 43.7% 22.5% 4.3x 4.2x 4.0x 19.1x 19.0x 16.2x
Paychex Nov-18 $65.15 85.7% $23,395 $22,693 $3,507 $3,461 $3,997 7.0% 15.5% 69.6% 41.1% 6.5x 6.6x 5.7x 15.8x 16.2x 14.2x
Willis Towers Watson Sep-18 $151.86 92.0% $19,732 $23,626 $8,133 $8,519 $8,871 5.0% 4.1% 39.3% 16.8% 2.9x 2.8x 2.7x 17.3x 11.2x 10.6x
Iron Mountain Sep-18 $32.41 85.4% $9,276 $17,406 $4,156 $4,234 $4,401 11.5% 3.9% 57.5% 34.1% 4.2x 4.1x 4.0x 12.3x 12.1x 11.3x
Teleperformance Jun-18 $159.84 81.3% $9,232 $10,701 $4,864 $5,070 $5,876 0.4% 15.9% 33.9% 15.2% 2.2x 2.1x 1.8x 14.5x 12.1x 10.3x
Genpact Sep-18 $26.99 77.6% $5,130 $6,073 $2,900 $2,977 $3,282 9.2% 10.2% 36.4% 14.1% 2.1x 2.0x 1.9x 14.9x 12.6x 11.0x
WNS Sep-18 $41.26 75.9% $2,060 $2,053 $790 $785 $846 14.2% 7.8% 34.9% 16.1% 2.6x 2.6x 2.4x 16.1x 13.9x 13.3x
ExlService Sep-18 $52.62 78.5% $1,803 $1,861 $846 $882 $999 16.2% 13.2% 33.9% 13.9% 2.2x 2.1x 1.9x 15.9x 12.5x 10.6x
TTEC Sep-18 $28.57 67.5% $1,320 $1,507 $1,517 $1,500 $1,563 4.8% 4.2% 23.7% 11.5% 1.0x 1.0x 1.0x 8.6x 7.6x 7.0x
CSG Systems Sep-18 $31.77 65.1% $1,059 $1,220 $833 $864 $942 10.3% 9.0% 49.7% 18.6% 1.5x 1.4x 1.3x 7.9x 6.2x 6.0x
Sykes Enterprises Sep-18 $24.73 76.9% $1,055 $980 $1,630 $1,628 $1,693 3.2% 4.0% 36.8% 9.5% 0.6x 0.6x 0.6x 6.3x 6.0x 5.3x
Firstsource Solutions Sep-18 $0.67 55.8% $465 $522 $504 $539 $603 (2.0%) 11.8% 30.6% 13.1% 1.0x 1.0x 0.9x 7.9x 6.8x 6.5x
StarTek Jun-18 $6.65 80.9% $249 $461 $270 $532 $659 NA 24.0% 9.8% 1.8% 1.7x 0.9x 0.7x NM NA 8.1x
BPO Upper Quartile 85.4% 3.2x 2.8x 2.7x 15.9x 13.0x 11.3x
BPO Median 78.5% 2.2x 2.1x 1.8x 14.7x 12.1x 10.5x
BPO Lower Quartile 75.9% 1.4x 1.0x 1.0x 8.4x 7.4x 7.0x
Managed Services
Equinix Sep-18 $352.56 76.4% $28,342 $38,827 $5,022 $5,070 $5,576 16.2% 10.0% 49.1% 44.9% 7.7x 7.7x 7.0x 17.2x 16.1x 14.4x
CenturyLink Sep-18 $15.15 62.6% $16,372 $52,509 $22,988 $23,460 $22,943 32.4% (2.2%) 55.8% 36.2% 2.3x 2.2x 2.3x 6.3x 5.8x 5.8x
Teradata Sep-18 $38.36 86.7% $4,534 $4,263 $2,202 $2,142 $2,153 0.1% 0.5% 47.5% 7.0% 1.9x 2.0x 2.0x 27.7x 12.9x 10.9x
Internap Sep-18 $4.15 23.0% $101 $788 $309 $322 $328 15.2% 2.0% 55.4% 30.0% 2.5x 2.5x 2.4x 8.5x 7.0x 6.4x
Managed Services Upper Quartile 78.9% 3.8x 3.8x 3.5x 19.8x 13.7x 11.8x
Managed Services Median 69.5% 2.4x 2.3x 2.3x 12.9x 9.9x 8.7x
Managed Services Lower Quartile 52.7% 2.2x 2.2x 2.2x 7.9x 6.7x 6.3x
Source: Capital IQ. Financials are calendarized to December year-end.(1) Market Data including Market Capitalization amounts are based on closing share prices as of December 31, 2018.(2) Enterprise Value (EV) equals Market Capitalization plus Debt, Preferred Equity, and Minority Interest, minus Cash and Cash Equivalents.(3) EBITDA equals Earnings before Interest,Taxes, Depreciation, and Amortization.

©2019 KPMG Corporate Finance, a Delaware limited liability company. Member FINRA and SIPC. KPMG CorporateFinance is a subsidiary of KPMG LLP, a Delaware limited liability partnership and the U.S. member firm of the KPMGnetwork of independent member firms affiliated with KPMG International Cooperative (“KPMG International”), a Swiss entity.All rights reserved. NDPPS 640221
13
Global TMT Selected Transactions (1): IT Services and BPO
Source: 451research.
Announced Date Target Name Target Country Acquirer Name Deal Value
($ mm)EV /
RevenueEV /
EBITDA
27-Dec-2018 KMD A/S [Advent International] Denmark NEC Corporation $1,221 1.4x -
18-Dec-2018 Orbis Education Services U.S. Grand Canyon Education Inc. $363 - -
18-Dec-2018 4Degrees Colocation Inc.[Quebecor] Canada
Vantage Data Centers [Digital Bridge Holdings / PSP Investments/ TIAA Investments]
$193 - -
11-Dec-2018 intive S.A. [Enterprise Investors] Germany Mid Europa Partners $114 1.2x -
26-Nov-2018 Oasis Outsourcing [MBO] U.S. Paychex Inc. $1,200 0.1x -
09-Nov-2018 MC Assembly Holdings Inc. U.S. SMTC Corporation $65 0.4x 6.2x
08-Nov-2018 PlumChoice Inc. U.S. Allstate Corporation $30 - -
08-Nov-2018 Stelligent Systems LLC [Hosting.com] U.S. MphasiS Ltd. [Blackstone Group] $25 - -
06-Nov-2018 ConvergeOne Holdings Inc. U.S. CVC Capital Partners Limited $1,800 1.3x 21.2x
22-Oct-2018 JetPay Corp. U.S. NCR Corp. $184 2.4x 30.8x
22-Oct-2018 Symphony Ventures Limited U.K. Sykes Enterprises Inc. $69 - -
10-Oct-2018 Impakt Holdings LLC [Graycliff Partners] U.S. Celestica Inc. $329 - -
09-Oct-2018 Learning House Inc., The [Weld North] U.S. John Wiley & Sons Inc. $200 - -
09-Oct-2018 General Dynamics Information Technology Inc. U.S. MAXIMUS Inc. $400 - -
04-Oct-2018 Softvision Consulting [Tower Arch Capital] U.S. Cognizant Technology Solutions $550 3.7x -
01-Oct-2018 COR Clearing LLC U.S. Axos Financial Inc. $85 - -
01-Oct-2018 FusionStorm U.S. Computacenter (UK) Ltd. $70 - -
Upper Quartile 1.9x 26.0x
Median 1.3x 21.2x
Lower Quartile 0.8x 13.7x
(1) Top M&A transactions on the basis of disclosed deal value in Q4’18.

©2019 KPMG Corporate Finance, a Delaware limited liability company. Member FINRA and SIPC. KPMG CorporateFinance is a subsidiary of KPMG LLP, a Delaware limited liability partnership and the U.S. member firm of the KPMGnetwork of independent member firms affiliated with KPMG International Cooperative (“KPMG International”), a Swiss entity.All rights reserved. NDPPS 640221
14
Global TMT Selected Public Comps: Internet and Media
Source: Capital IQ. Financials are calendarized to December year-end.(1) Market Data including Market Capitalization amounts are based on closing share prices as of December 31, 2018.(2) Enterprise Value (EV) equals Market Capitalization plus Debt, Preferred Equity, and Minority Interest, minus Cash and Cash Equivalents.(3) EBITDA equals Earnings before Interest,Taxes, Depreciation, and Amortization.
Market Data Operating Metrics Valuation Multiples$ value millions, except per share
LatestQuarterEnding
SharePrice
% of 52Week High
Market Cap. (1)
EnterpriseValue (2)
Revenue Revenue Growth (3)LTM
GrossLTM
EBITDA EV / Revenue EV / EBITDA
Company Name LTM 2018E 2019E 2017 – 2018E 2018E – 2019E Margin% Margin% LTM 2018E 2019E LTM 2018E 2019E
Internet
Amazon.com Sep-18 $1,501.97 73.2% $734,416 $751,870 $220,957 $232,378 $280,755 31.0% 20.8% 39.9% 11.3% 3.4x 3.2x 2.7x 30.2x 22.7x 17.9x
Alphabet Inc. Sep-18 $1,044.96 80.9% $723,465 $621,035 $129,866 $136,476 $160,678 23.9% 17.7% 57.0% 30.3% 4.8x 4.6x 3.9x 15.8x 12.4x 10.4x
Tencent Sep-18 $40.10 65.9% $379,116 $387,514 $42,829 $45,514 $59,022 23.4% 29.7% 47.1% 37.5% 9.0x 8.5x 6.6x 24.1x 22.6x 19.8x
Facebook Sep-18 $131.09 60.0% $376,725 $335,589 $51,896 $55,353 $68,809 37.5% 24.3% 84.3% 54.7% 6.5x 6.1x 4.9x 11.8x 10.1x 9.1x
Alibaba Sep-18 $137.07 64.7% $352,534 $356,970 $45,281 $50,452 $70,638 46.7% 40.0% 49.4% 26.9% 7.9x 7.1x 5.1x 29.3x 21.4x 16.7x
Baidu Sep-18 $158.60 55.8% $55,282 $49,155 $14,418 $14,673 $17,140 13.2% 16.8% 58.2% 34.3% 3.4x 3.4x 2.9x 9.9x 12.7x 11.6x
eBay Sep-18 $28.07 59.7% $27,027 $31,437 $10,216 $10,735 $11,286 12.2% 5.1% 76.9% 29.2% 3.1x 2.9x 2.8x 10.5x 8.7x 8.2x
Twitter Sep-18 $28.74 60.1% $21,806 $18,558 $2,865 $3,001 $3,404 25.3% 13.4% 68.1% 23.5% 6.5x 6.2x 5.5x 27.5x 16.2x 14.2x
Snap Sep-18 $5.51 26.0% $7,135 $5,721 $1,076 $1,165 $1,534 47.1% 31.7% 31.5% (118.3%) 5.3x 4.9x 3.7x NM NM NM
Etsy Sep-18 $47.57 81.6% $5,730 $5,426 $540 $598 $777 36.8% 29.8% 67.1% 15.9% NM 9.1x 7.0x NM 39.6x 28.0x
Internet Upper Quartile 71.4% 6.5x 6.9x 5.3x 28.0x 22.6x 17.9x
Internet Median 62.4% 5.3x 5.5x 4.4x 20.0x 16.2x 14.2x
Internet Lower Quartile 59.8% 3.4x 3.6x 3.1x 11.5x 12.4x 10.3x
Media
Walt Disney Sep-18 $109.65 91.2% $163,233 $185,139 $59,434 $59,352 $62,780 6.3% 5.8% 44.9% 30.0% 3.1x 3.1x 2.9x 10.4x 10.7x 9.7x
Comcast Corporation Sep-18 $34.05 77.4% $154,911 $219,318 $88,233 $94,280 $110,765 11.7% 17.5% 69.0% 32.7% 2.5x 2.3x 2.0x 7.6x 7.2x 6.4x
Twenty-First Century Fox Sep-18 $48.12 96.0% $89,015 $102,960 $30,575 $31,043 $32,272 6.1% 4.0% 35.1% 22.9% 3.4x 3.3x 3.2x 14.7x 14.5x 13.6x
CBS Sep-18 $43.72 71.0% $16,365 $26,036 $14,411 $14,667 $15,668 8.8% 6.8% 37.5% 21.8% 1.8x 1.8x 1.7x 8.3x 7.9x 7.4x
REA Group Jun-18 $52.14 78.6% $6,868 $7,091 $642 $612 $704 6.6% 15.1% 72.6% 49.7% NM NM NM 22.3x 20.1x 17.2x
News Corp. Sep-18 $11.35 65.6% $6,680 $7,799 $9,490 $9,946 $10,292 20.6% 3.5% 46.3% 10.7% 0.8x 0.8x 0.8x 7.7x 6.3x 5.9x
Lagardère Jun-18 $25.21 81.0% $3,231 $5,060 $8,546 $8,233 $8,558 (2.8%) 4.0% 46.9% 8.6% 0.6x 0.6x 0.6x 6.9x 6.8x 6.5x
Singapore Press Nov-18 $1.72 80.5% $2,783 $4,170 $708 $707 $727 (4.5%) 2.9% 49.2% 32.1% 5.9x 5.9x 5.7x 18.3x 18.6x 18.4x
DMGT Sep-18 $7.33 73.6% $2,596 $2,298 $1,861 $1,798 $1,776 (25.2%) (1.2%) 38.6% 10.7% 1.2x 1.3x 1.3x 11.6x 8.7x 9.3x
Media Upper Quartile 81.0% 3.2x 3.2x 3.0x 14.7x 14.5x 13.7x
Media Median 78.6% 2.1x 2.1x 1.8x 10.4x 8.7x 9.3x
Media Lower Quartile 73.6% 1.1x 1.2x 1.2x 7.7x 7.2x 6.5x
Information Services
S&P Global Sep-18 $169.94 78.2% $42,638 $45,679 $6,309 $6,334 $6,646 6.0% 4.9% 72.4% 49.9% 7.2x 7.2x 6.9x 14.5x 14.6x 13.8x
Moody's Sep-18 $140.04 74.5% $26,833 $30,862 $4,548 $4,515 $4,712 9.7% 4.4% 71.7% 47.3% 6.8x 6.8x 6.5x 14.3x 14.3x 13.7x
Thomson Reuters Sep-18 $48.32 92.2% $24,398 $31,356 $11,432 $5,512 $5,943 (51.3%) 7.8% 27.6% 20.9% 2.7x 5.7x 5.3x 13.1x 24.3x 22.3x
Experian Sep-18 $24.28 95.5% $21,804 $25,165 $4,819 $4,843 $4,980 12.6% 2.8% 42.3% 30.5% 5.2x 5.2x 5.1x 17.1x 15.2x 14.7x
Pearson Jun-18 $11.96 95.6% $9,270 $10,361 $5,715 $5,349 $5,415 (13.7%) 1.2% 54.2% 13.1% 1.8x 1.9x 1.9x 13.8x 11.9x 10.8x
Information Services Upper Quartile 95.5% 6.8x 6.8x 6.5x 14.5x 15.2x 14.7x
Information Services Median 92.2% 5.2x 5.7x 5.3x 14.3x 14.6x 13.8x
Information Services Lower Quartile 78.2% 2.7x 5.2x 5.1x 13.8x 14.3x 13.7x

©2019 KPMG Corporate Finance, a Delaware limited liability company. Member FINRA and SIPC. KPMG CorporateFinance is a subsidiary of KPMG LLP, a Delaware limited liability partnership and the U.S. member firm of the KPMGnetwork of independent member firms affiliated with KPMG International Cooperative (“KPMG International”), a Swiss entity.All rights reserved. NDPPS 640221
15
Global TMT Selected Transactions (1): Internet and Media
Announced Date Target Name Target Country Acquirer Name Deal Value
($ mm)EV /
RevenueEV /
EBITDA
21-Dec-2018 Value Holding Inc. U.S. LendingTree Inc. $105 6.3x 8.8x
21-Dec-2018 Delivery Hero S.E. Germany Takeaway.com N.V. $1,060 8.9x -
19-Dec-2018 Ourgame International Holdings Ltd. China Black Ridge Oil & Gas Inc. $118 8.0x -
14-Dec-2018 Communisis PLC U.K. Output Services Group Inc.[Aquiline Capital Partners] $201 - -
12-Dec-2018 Stadium Goods U.S. Farfetch UK Limited $250 - -
12-Dec-2018 Bite Squad LLC U.S. Waitr Holdings Inc. $321 - -
05-Dec-2018 Verimatrix, Inc. U.S. Inside Secure S.A. $140 1.8x 9.7x
05-Dec-2018 The Deal LLC [TheStreet.com] U.S. Euromoney Institutional Investor $87 3.7x 52.8x
04-Dec-2018 MightyHive Inc. U.S. S4 Capital Limited $150 3.7x 13.5x
03-Dec-2018 Tribune Media Company U.S. Nexstar Media Group, Inc. $6,222 3.2x 8.6x
28-Nov-2018 CarsOnTheWeb NV Belgium KAR Auction Services Inc. $103 - -
27-Nov-2018 Periscope Inc. U.S. Quad/Graphics Inc. $133 1.6x -
27-Nov-2018 SiriusDecisions Inc. U.S. Forrester Research Inc. $245 2.8x 30.6x
21-Nov-2018 Trade Me Group Limited New Zealand Apax Partners $1,800 10.5x 18.5x
08-Nov-2018 Cozy Services Ltd U.S. CoStar Group Inc. $68 - -
08-Nov-2018 EZbuy Holding Co. Ltd. Singapore LightInTheBox Holding Co. Ltd. $86 1.8x -
04-Nov-2018 Destinations of the World JLT [Gulf Capital] UAE Webjet Marketing Pty. Ltd. $173 - 10.5x
01-Nov-2018 Flywheel Digital LLC U.S. Ascential PLC $60 2.5x 12.0x
31-Oct-2018 Mr Green & Co. AB Sweden William Hill PLC $309 - -
29-Oct-2018 eHarmony Inc. U.S. PARSHIP ELITE Group [NuCom Group] $74 - -
22-Oct-2018 Alliance Trust Savings Ltd U.K. Interactive Investor Ltd $52 - -
04-Oct-2018 QuoteWizard.com LLC U.S. LendingTree Inc. $300 2.4x -
Upper Quartile 6.3x 18.5x
Median 3.2x 12.0x
Lower Quartile 2.4x 9.7x
Source: 451research.
(1) Top M&A transactions on the basis of disclosed deal value in Q4’18.

©2019 KPMG Corporate Finance, a Delaware limited liability company. Member FINRA and SIPC. KPMG CorporateFinance is a subsidiary of KPMG LLP, a Delaware limited liability partnership and the U.S. member firm of the KPMGnetwork of independent member firms affiliated with KPMG International Cooperative (“KPMG International”), a Swiss entity.All rights reserved. NDPPS 640221
16
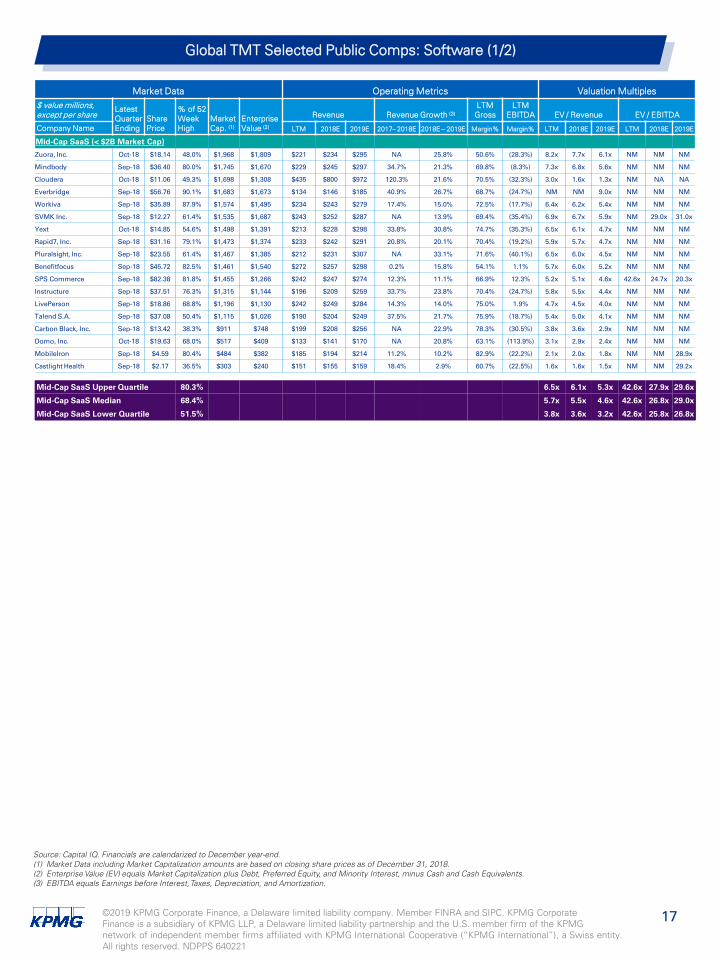
Global TMT Selected Public Comps: Software (1/2)
Market Data Operating Metrics Valuation Multiples$ value millions, except per share
LatestQuarterEnding
SharePrice
% of 52Week High
Market Cap. (1)
EnterpriseValue (2)
Revenue Revenue Growth (3)LTM
GrossLTM
EBITDA EV / Revenue EV / EBITDA
Company Name LTM 2018E 2019E 2017– 2018E 2018E – 2019E Margin% Margin% LTM 2018E 2019E LTM 2018E 2019E
Diversified SoftwareMicrosoft Sep-18 $101.57 87.4% $779,805 $731,962 $114,906 $118,467 $130,480 17.0% 10.1% 65.2% 41.4% 6.4x 6.2x 5.6x 15.4x 14.7x 13.2x
Alphabet Inc. Sep-18 $1,044.96 80.9% $723,465 $621,035 $129,866 $136,639 $160,008 24.0% 17.1% 57.0% 30.3% 4.8x 4.5x 3.9x 15.8x 12.4x 10.3x
Cisco Systems Oct-18 $43.33 87.6% $194,810 $177,862 $50,266 $50,803 $52,303 5.8% 3.0% 62.2% 30.0% 3.5x 3.5x 3.4x 11.8x 9.9x 9.6x
Oracle Nov-18 $45.15 84.4% $162,040 $171,425 $39,893 $39,758 $40,016 2.0% 0.6% 79.6% 39.9% 4.3x 4.3x 4.3x 10.8x 9.2x 9.3x
SAP Sep-18 $99.83 80.4% $119,155 $122,564 $27,983 $28,103 $30,663 (0.5%) 9.1% 69.6% 25.9% 4.4x 4.4x 4.0x 16.9x 13.3x 12.0x
Adobe Systems Nov-18 $226.24 81.5% $110,435 $111,331 $9,030 $9,001 $11,157 24.2% 23.9% 86.8% 35.0% NM NM 10.0x 35.2x NA 22.6x
Salesforce.com Oct-18 $136.97 85.0% $104,782 $105,723 $12,484 $13,243 $15,991 26.8% 20.7% 74.0% 9.4% 8.5x 8.0x 6.6x NM 33.3x 26.8x
IBM Sep-18 $113.67 66.4% $103,303 $136,019 $80,373 $79,752 $79,291 1.4% (0.6%) 45.5% 21.1% 1.7x 1.7x 1.7x 8.0x 7.3x 6.9x
Diversified Software Upper Quartile 85.6% 5.6x 5.4x 5.9x 16.3x 14.0x 15.5x
Diversified Software Median 83.0% 4.4x 4.4x 4.1x 15.4x 12.4x 11.1x
Diversified Software Lower Quartile 80.8% 3.9x 3.9x 3.8x 11.3x 9.6x 9.5x
Large-Cap SaaS (> $2B Market Cap)
Salesforce.com Oct-18 $136.97 85.0% $104,782 $105,723 $12,484 $13,243 $15,991 26.8% 20.7% 74.0% 9.4% 8.5x 8.0x 6.6x NM 33.3x 26.8x
Workday Oct-18 $159.68 92.5% $35,130 $34,738 $2,616 $2,810 $3,515 31.6% 25.1% 70.5% (8.6%) NM NM 9.9x NM NM NM
ServiceNow Sep-18 $178.05 86.3% $31,925 $31,114 $2,457 $2,609 $3,371 36.2% 29.2% 76.0% 2.4% NM NM 9.2x NM 45.9x 33.2x
Atlassian Sep-18 $88.98 90.6% $21,190 $20,223 $946 $1,018 $1,326 38.9% 30.2% 81.2% 2.3% NM NM NM NM NM NM
Shopify Sep-18 $138.45 78.4% $15,276 $13,697 $952 $1,057 $1,473 60.0% 39.3% 55.8% (7.0%) NM NM 9.3x NM NM NM
Veeva Systems Oct-18 $89.32 81.9% $12,978 $11,926 $811 $857 $1,019 25.9% 18.9% 70.4% 25.3% NM NM NM NM 38.4x 32.8x
Tableau Software Sep-18 $120.00 91.0% $10,028 $9,071 $1,068 $992 $1,363 14.3% 37.3% 87.6% (8.6%) 8.5x 9.1x 6.7x NM NM 42.5x
Twilio Sep-18 $89.30 88.9% $8,828 $8,511 $561 $630 $831 62.2% 31.8% 53.7% (13.5%) NM NM NM NM NM NM
Dropbox, Inc. Sep-18 $20.43 47.0% $8,305 $7,432 $1,321 $1,386 $1,604 NA 15.7% 70.3% (26.9%) 5.6x 5.4x 4.6x NM 22.7x 19.9x
The Ultimate Software Group Sep-18 $244.87 73.7% $7,657 $7,532 $1,087 $1,136 $1,363 21.7% 19.9% 62.3% 10.7% 6.9x 6.6x 5.5x NM 27.5x 23.2x
Okta Oct-18 $63.80 84.5% $7,046 $6,768 $364 $392 $518 51.0% 32.2% 71.3% (31.6%) NM NM NM NM NM NM
DocuSign, Inc. Oct-18 $40.08 58.6% $6,623 $5,962 $650 $694 $856 NA 23.3% 73.7% (51.7%) 9.2x 8.6x 7.0x NM NM NM
RingCentral Sep-18 $82.44 84.0% $6,623 $6,411 $624 $666 $823 33.7% 23.6% 76.5% (1.9%) NM 9.6x 7.8x NM NM NM
Zendesk Sep-18 $58.37 80.2% $6,248 $6,249 $549 $592 $779 38.8% 31.6% 69.9% (19.4%) NM NM 8.0x NM NM NM
Elastic N.V. Oct-18 $71.48 85.3% $5,073 $4,752 $211 $233 $324 NA 39.0% 72.3% (33.2%) NM NM NM NM NA NM
HubSpot Sep-18 $125.73 77.5% $4,933 $4,685 $475 $506 $635 36.5% 25.4% 80.2% (7.8%) 9.9x 9.3x 7.4x NM NM NM
New Relic Sep-18 $80.97 70.5% $4,612 $4,280 $413 $442 $559 34.9% 26.5% 83.7% (1.4%) NM 9.7x 7.7x NM NM NM
Proofpoint Sep-18 $83.81 64.3% $4,580 $4,390 $661 $711 $876 39.5% 23.3% 71.4% (5.9%) 6.6x 6.2x 5.0x NM 41.1x 33.8x
Wix.com Ltd. Sep-18 $90.34 74.4% $4,368 $3,986 $558 $602 $763 41.9% 26.9% 80.3% (4.6%) 7.1x 6.6x 5.2x NM 35.2x 22.6x
RealPage Sep-18 $48.19 72.7% $4,362 $4,679 $830 $873 $1,003 29.8% 15.0% 60.9% 17.0% 5.6x 5.4x 4.7x 33.1x 20.3x 16.4x
Pivotal Software, Inc. Nov-18 $16.35 52.3% $4,291 $3,627 $622 $659 $814 NA 23.6% 61.5% (20.8%) 5.8x 5.5x 4.5x NM NM NM
LogMeIn Sep-18 $81.57 60.5% $4,173 $4,206 $1,170 $1,204 $1,256 18.7% 4.4% 77.5% 29.3% 3.6x 3.5x 3.3x 12.3x 9.5x 8.9x
Xero Limited Sep-18 $29.62 79.9% $4,139 $4,376 $315 $348 $467 28.5% 34.3% 82.5% (1.2%) NM NM 9.4x NM NM 47.5x
Medidata Solutions Sep-18 $67.42 75.9% $4,126 $4,022 $611 $637 $750 16.8% 17.8% 75.7% 14.6% 6.6x 6.3x 5.4x 45.0x 26.6x 21.7x
Coupa Software Oct-18 $62.86 74.4% $3,737 $3,502 $239 $253 $314 39.5% 23.8% 68.7% (14.4%) NM NM NM NM NM NM
Alteryx Sep-18 $59.47 88.2% $3,650 $3,493 $182 $201 $272 56.8% 35.2% 87.8% (6.8%) NM NM NM NM NM NM
Paylocity Holding Corporation Sep-18 $60.21 68.1% $3,179 $3,094 $397 $415 $498 24.7% 20.0% 62.1% 9.1% 7.8x 7.5x 6.2x NM 31.3x 21.5x
Cornerstone OnDemand Sep-18 $50.43 85.2% $2,956 $2,853 $532 $529 $567 9.6% 7.1% 72.3% 0.1% 5.4x 5.4x 5.0x NM 31.3x 22.1x
Qualys Sep-18 $74.74 76.0% $2,943 $2,617 $268 $279 $331 21.3% 18.8% 76.4% 28.3% 9.8x 9.4x 7.9x 34.5x 23.4x 20.8x
2U Sep-18 $49.72 50.4% $2,880 $2,437 $383 $412 $547 44.3% 32.9% 78.1% (5.3%) 6.4x 5.9x 4.5x NM NM NM
Smartsheet Inc. Oct-18 $24.86 73.2% $2,579 $2,373 $159 $175 $244 NA 39.1% 80.9% (27.9%) NM NM 9.7x NM NM NM
Five9, Inc. Sep-18 $43.72 88.3% $2,570 $2,497 $241 $252 $296 27.8% 17.4% 59.3% 4.5% NM 9.9x 8.4x NM NM 49.5x
Box Oct-18 $16.88 56.7% $2,421 $2,319 $581 $609 $733 20.3% 20.4% 72.2% (17.1%) 4.0x 3.8x 3.2x NM NM 44.2x
BlackLine Sep-18 $40.95 70.5% $2,238 $2,113 $217 $227 $279 30.2% 22.9% 77.9% (4.8%) 9.7x 9.3x 7.6x NM NM NM
Ellie Mae, Inc. Sep-18 $62.83 53.7% $2,189 $1,917 $477 $480 $510 16.2% 6.4% 58.3% 14.2% 4.0x 4.0x 3.8x 28.2x 15.0x 13.3x
Q2 Holdings, Inc. Sep-18 $49.55 73.8% $2,149 $2,031 $226 $241 $306 24.1% 27.3% 49.9% (5.3%) 9.0x 8.4x 6.6x NM NM NM
AppFolio Sep-18 $59.22 64.7% $2,028 $1,983 $178 $188 $238 32.4% 26.6% 62.2% 13.7% NM NM 8.3x NM 44.8x 31.1x
Mimecast Sep-18 $33.63 71.8% $2,020 $2,053 $301 $319 $382 33.6% 19.9% 73.2% 6.5% 6.8x 6.4x 5.4x NM 47.5x 31.4x
Large-Cap SaaS Upper Quartile 84.9% 8.5x 9.2x 8.0x 34.5x 39.0x 33.4x
Large-Cap SaaS Median 75.1% 6.8x 6.6x 6.6x 33.1x 31.3x 25.0x
Large-Cap SaaS Lower Quartile 68.7% 5.6x 5.5x 5.0x 28.2x 23.3x 21.3x
Source: Capital IQ. Financials are calendarized to December year-end.(1) Market Data including Market Capitalization amounts are based on closing share prices as of December 31, 2018.(2) Enterprise Value (EV) equals Market Capitalization plus Debt, Preferred Equity, and Minority Interest, minus Cash and Cash Equivalents.(3) EBITDA equals Earnings before Interest,Taxes, Depreciation, and Amortization.
©2019 KPMG Corporate Finance, a Delaware limited liability company. Member FINRA and SIPC. KPMG CorporateFinance is a subsidiary of KPMG LLP, a Delaware limited liability partnership and the U.S. member firm of the KPMGnetwork of independent member firms affiliated with KPMG International Cooperative (“KPMG International”), a Swiss entity.All rights reserved. NDPPS 640221
17
Global TMT Selected Public Comps: Software (1/2)
Market Data Operating Metrics Valuation Multiples$ value millions, except per share
LatestQuarterEnding
SharePrice
% of 52Week High
Market Cap. (1)
EnterpriseValue (2)
Revenue Revenue Growth (3)LTM
GrossLTM
EBITDA EV / Revenue EV / EBITDA
Company Name LTM 2018E 2019E 2017– 2018E 2018E – 2019E Margin% Margin% LTM 2018E 2019E LTM 2018E 2019E
Mid-Cap SaaS (< $2B Market Cap)
Zuora, Inc. Oct-18 $18.14 48.0% $1,968 $1,809 $221 $234 $295 NA 25.8% 50.6% (28.3%) 8.2x 7.7x 6.1x NM NM NM
Mindbody Sep-18 $36.40 80.0% $1,745 $1,670 $229 $245 $297 34.7% 21.3% 69.8% (8.3%) 7.3x 6.8x 5.6x NM NM NM
Cloudera Oct-18 $11.06 49.3% $1,698 $1,308 $435 $800 $972 120.3% 21.6% 70.5% (32.3%) 3.0x 1.6x 1.3x NM NA NA
Everbridge Sep-18 $56.76 90.1% $1,683 $1,673 $134 $146 $185 40.9% 26.7% 68.7% (24.7%) NM NM 9.0x NM NM NM
Workiva Sep-18 $35.89 87.9% $1,574 $1,495 $234 $243 $279 17.4% 15.0% 72.5% (17.7%) 6.4x 6.2x 5.4x NM NM NM
SVMK Inc. Sep-18 $12.27 61.4% $1,535 $1,687 $243 $252 $287 NA 13.9% 69.4% (35.4%) 6.9x 6.7x 5.9x NM 29.0x 31.0x
Yext Oct-18 $14.85 54.6% $1,498 $1,391 $213 $228 $298 33.8% 30.8% 74.7% (35.3%) 6.5x 6.1x 4.7x NM NM NM
Rapid7, Inc. Sep-18 $31.16 79.1% $1,473 $1,374 $233 $242 $291 20.8% 20.1% 70.4% (19.2%) 5.9x 5.7x 4.7x NM NM NM
Pluralsight, Inc. Sep-18 $23.55 61.4% $1,467 $1,385 $212 $231 $307 NA 33.1% 71.6% (40.1%) 6.5x 6.0x 4.5x NM NM NM
Benefitfocus Sep-18 $45.72 82.5% $1,461 $1,540 $272 $257 $298 0.2% 15.8% 54.1% 1.1% 5.7x 6.0x 5.2x NM NM NM
SPS Commerce Sep-18 $82.38 81.8% $1,455 $1,266 $242 $247 $274 12.3% 11.1% 66.9% 12.3% 5.2x 5.1x 4.6x 42.6x 24.7x 20.3x
Instructure Sep-18 $37.51 76.3% $1,315 $1,144 $196 $209 $259 33.7% 23.8% 70.4% (24.7%) 5.8x 5.5x 4.4x NM NM NM
LivePerson Sep-18 $18.86 68.8% $1,196 $1,130 $242 $249 $284 14.3% 14.0% 75.0% 1.9% 4.7x 4.5x 4.0x NM NM NM
Talend S.A. Sep-18 $37.08 50.4% $1,115 $1,026 $190 $204 $249 37.5% 21.7% 75.9% (18.7%) 5.4x 5.0x 4.1x NM NM NM
Carbon Black, Inc. Sep-18 $13.42 38.3% $911 $748 $199 $208 $256 NA 22.9% 78.3% (30.5%) 3.8x 3.6x 2.9x NM NM NM
Domo, Inc. Oct-18 $19.63 68.0% $517 $409 $133 $141 $170 NA 20.8% 63.1% (113.9%) 3.1x 2.9x 2.4x NM NM NM
MobileIron Sep-18 $4.59 80.4% $484 $382 $185 $194 $214 11.2% 10.2% 82.9% (22.2%) 2.1x 2.0x 1.8x NM NM 28.9x
Castlight Health Sep-18 $2.17 36.5% $303 $240 $151 $155 $159 18.4% 2.9% 60.7% (22.5%) 1.6x 1.6x 1.5x NM NM 29.2x
Mid-Cap SaaS Upper Quartile 80.3% 6.5x 6.1x 5.3x 42.6x 27.9x 29.6x
Mid-Cap SaaS Median 68.4% 5.7x 5.5x 4.6x 42.6x 26.8x 29.0x
Mid-Cap SaaS Lower Quartile 51.5% 3.8x 3.6x 3.2x 42.6x 25.8x 26.8x
Source: Capital IQ. Financials are calendarized to December year-end.(1) Market Data including Market Capitalization amounts are based on closing share prices as of December 31, 2018.(2) Enterprise Value (EV) equals Market Capitalization plus Debt, Preferred Equity, and Minority Interest, minus Cash and Cash Equivalents.(3) EBITDA equals Earnings before Interest,Taxes, Depreciation, and Amortization.

©2019 KPMG Corporate Finance, a Delaware limited liability company. Member FINRA and SIPC. KPMG CorporateFinance is a subsidiary of KPMG LLP, a Delaware limited liability partnership and the U.S. member firm of the KPMGnetwork of independent member firms affiliated with KPMG International Cooperative (“KPMG International”), a Swiss entity.All rights reserved. NDPPS 640221
18
Global TMT Selected Transactions (1): Software
Source: 451research.
Announced Date Target Name Target Country Acquirer Name Deal Value
($ mm)EV /
RevenueEV /
EBITDA
24-Dec-2018 MINDBODY Inc. U.S. Vista Equity Partners Management $1,750 8.1x -
20-Dec-2018 BuildingConnected Inc. U.S. Autodesk Inc. $275 - -
19-Dec-2018 M*Modal [One Equity] U.S. 3M Company $1,000 5.0x -
13-Dec-2018 Adestra Ltd. U.K. Upland Software Inc. $60 3.3x -
12-Dec-2018 Avoka Technologies Pty Ltd. U.S. Temenos AG $245 6.4x -
11-Dec-2018 IQMS Inc. U.S. Dassault Systemes S.A. $425 7.6x -
10-Dec-2018 Compuscan Pty Ltd South Africa Experian plc $262 7.6x -
10-Dec-2018 Netsmart Technologies Inc. [Allscripts / GI Partners] U.S. GI Partners/TA Associates $525 1.5x -
10-Dec-2018 Travelport LP U.K. Siris Capital/Evergreen Coast $4,400 2.5x 10.5x
30-Nov-2018 PEC Safety Operations LLC U.S. Thoma Bravo LLC $225 9.0x 28.1x
27-Nov-2018 Spectro Scientific Inc. U.S. AMETEK Inc. $190 3.8x -
20-Nov-2018 PlanGrid Inc. U.S. Autodesk Inc. $875 - -
16-Nov-2018 Cylance Inc. U.S. BlackBerry Limited $1,500 11.5x -
14-Nov-2018 Farelogix Inc. U.S. Sabre Corporation $360 - -
12-Nov-2018 athenahealth Inc. U.S. Veritas Capital/Evergreen Coast $5,700 4.1x 17.3x
11-Nov-2018 Apptio, Inc. U.S. Vista Equity Partners $2,122 8.3x NM
11-Nov-2018 Qualtrics International Inc. U.S. SAP SE $8,000 NM -
06-Nov-2018 Investment Technology Group U.S. Virtu Financial $1,000 1.5x 15.9x
05-Nov-2018 Datawatch Corp. U.S. Altair Engineering Inc. $176 4.0x -
30-Oct-2018 eVision Industry Software Netherlands Wolters Kluwer Legal & Regulatory Solutions
$145 7.2x -
28-Oct-2018 Red Hat U.S. IBM $3,360 10.7x 56.4x
22-Oct-2018 Symbility Solutions Inc. Canada CoreLogic Inc. $122 3.5x 40.2x
17-Oct-2018 Triton Digital Inc. [Vector Capital] U.S. E. W. Scripps Company $150 3.7x -
15-Oct-2018 SendGrid U.S. Twilio Inc. $1,739 12.3x NM
15-Oct-2018 tCell.io Inc. U.S. Rapid7 Inc. - - -
15-Oct-2018 Cambium Learning Group U.S. Veritas Capital $685 4.7x 18.6x
10-Oct-2018 Imperva Inc. U.S. Thoma Bravo $2,119 5.2x NM
09-Oct-2018 FNZ UK Ltd. [HIG Private Equity] [General Atlantic] U.K. Caisse de depot et placement du
Quebec$1,450 - -
08-Oct-2018 Rocket Software U.S. Bain Capital Private Equity $2,000 4.4x -
03-Oct-2018 Hortonworks, Inc. U.S. Cloudera, Inc. $2,107 6.1x NM
01-Oct-2018 Lumesse [HgCapital] U.K. Saba Software [Vector Capital] $100 1.3x 20.0x
Upper Quartile 7.6x 31.1x
Median 5.0x 19.3x
Lower Quartile 3.7x 17.0x
(1) Top M&A transactions on the basis of disclosed deal value in Q4’18.

©2019 KPMG Corporate Finance, a Delaware limited liability company. Member FINRA and SIPC. KPMG CorporateFinance is a subsidiary of KPMG LLP, a Delaware limited liability partnership and the U.S. member firm of the KPMGnetwork of independent member firms affiliated with KPMG International Cooperative (“KPMG International”), a Swiss entity.All rights reserved. NDPPS 640221
19
Global TMT Coverage TeamGlobal Coverage. Industry Knowledge. Middle-Market Focus.
The Corporate Finance practices of KPMG International’s network of independent member firms (KPMG) have been ranked collectively as the number one global mid-market advisor based on total deal volume announced from 2014 to 2018, according to Thomson Reuters SDC. KPMG firms operate in 155 countries with over 2,600 professionals who are able to meet the needs of clients across the globe.
Global
U.S. and Canada
Cyrus LamManaging DirectorNew York, U.S.T: +1-212-872-5540E: [email protected]
JP DittyManaging DirectorSanta Clara, U.S.T: +1-408-367-3826E: [email protected]
Mihir JobaliaManaging DirectorSanta Clara, U.S.T: +1-408-367-2850E: [email protected]
Neil C BlairManaging DirectorToronto, CanadaT: +1-416-777-8657E: [email protected]
Joseph RadeckiManaging DirectorChicago, U.S.T: +1-312-665-4401E: [email protected]
Roderick H MoonManaging DirectorNew York, U.S.T: +1-212-954-5834E: [email protected]
David R CreamerManaging DirectorSanta Clara, U.S.T: +1-408-367-5764E: [email protected]
Patrick CoadyPartnerOttawa, CanadaT: +1-613-212-2841E: [email protected]
Alexander M AldenManaging DirectorSan Francisco, U.S.T: +1-415-963-5511E: [email protected]
Hillel SchusterPartnerTel Aviv, IsraelT: +972-3-684-8000 E: [email protected]
Maurizio NitratiPartnerRome, ItalyT: +39-06-809-711E: [email protected]
Amir ShaniPrincipalTel Aviv, IsraelT: +972-3-684-8661E: [email protected]
Mark ZuidemaPartnerAmsterdam, NetherlandsT: +31-206-568-276E:[email protected]
Robert VartevanianPartnerMoscow, RussiaT: +7-495-937-4444 (x11777)E:[email protected]
Paolo MascarettiPartnerMilan, ItalyT: +39-02-676-431E: [email protected]
Khalid BakkaliPartnerAmsterdam, NetherlandsT: +31-206-567-507E: [email protected]
João Sousa LealPartnerLisbon, PortugalT: +351-210-110-049E: [email protected]
Michele ConnollyPartnerDublin, IrelandT: +35-314-101-546E: [email protected]
Maximilian Peter FianiPartnerMilan, ItalyT: +39-02-676-431E: [email protected]
Michael JiangPartnerBeijing, ChinaT: +86-108-508-7077E: [email protected]
Jayant KumaarPartnerNew Delhi, IndiaT: +91-124-334-5115E: [email protected]
Takeshi MoriyaPartnerTokyo, JapanT: +81-335-485-171E:[email protected]
Eric LauPartnerHong KongT: +85-229-132-576E: [email protected]
Sung-Won ParkPartnerSeoul, South KoreaT: +82-221-127-090E:[email protected]
Sumit PunwaniPartnerSingaporeT: +65-621-32-922E: [email protected]
Jesse C.S. ChenPartnerTaipei, TaiwanT: +886281016666 (x13372)E: [email protected]
Philip NgPartnerShenzhen, ChinaT: +86-755-254-73-308E: [email protected]
Takeo TakanashiPartnerTokyo, JapanT: +81-335-485-178E:[email protected]
Latin America
Luis MottaPartnerSão Paulo, BrazilT: +55-113-940-8314E: [email protected]
Saul VillaPartnerMexico City, MexicoT: +52-555-246-8449E: [email protected]
Jorn De NevePartnerBrussels, BelgiumT: +32-2-708-4778E: [email protected]
Eric Bots-BjerreDirectorCopenhagen, DenmarkT: +45-24-84-42-01E: [email protected]
Mark WyattPartnerParis, FranceT: +33-155-689-300E: [email protected]
Tom NymanPartnerHelsinki, FinlandT: +358-207-603-372E: [email protected]
Guillaume CauchoixPartnerParis, FranceT: +33-155-688-611E: [email protected]
Florian FreiPartnerFrankfurt/Main, Germany T: +49-699-587-2834 E: [email protected]
Harri RasanenPartnerHelsinki, FinlandT: +358-207-603-215E: [email protected]
EMEA
Asia Pacific
Nigel RousePartnerStockholm, SwedenT: +46-8-723-9706E: [email protected]
Bjorn HallinPartnerStockholm, SwedenT: +46-070-548-9626E: [email protected]
Brendan LarsenPartnerBrisbane, AustraliaT: +61-7-3233-9373E: [email protected]
Christian MayoPartnerLeeds, U.K.T: +44-113-231-3179E: [email protected]
David J ElmsPartnerLondon, U.K.T: +44-20-731-18568E: [email protected]
Peter TurnerPartnerMelbourne, AustraliaT: +61-3-9288-6022E: [email protected]
Eloy Serrano BufalaPartnerMadrid, SpainT: +34-91-456-3870E: [email protected]
Patrick KerlerPartnerZürich, SwitzerlandT: +41-58-249-42-02E: [email protected]
Graham PearceU.K. Head TMTLeeds, U.K.T: +44-113-231-3855E: [email protected]

©2019 KPMG Corporate Finance, a Delaware limited liability company. Member FINRA and SIPC. KPMG CorporateFinance is a subsidiary of KPMG LLP, a Delaware limited liability partnership and the U.S. member firm of the KPMGnetwork of independent member firms affiliated with KPMG International Cooperative (“KPMG International”), a Swiss entity.All rights reserved. NDPPS 640221
Important NoticeThe information contained herein is of a general nature and is not intended toaddress the circumstances of any particular individual or entity. Although weendeavor to provide accurate and timely information, there can be no guaranteethat such information is accurate as of the date it is received or that it will continueto be accurate in the future. No one should act upon such information withoutappropriate professional advice after a thorough examination of the particularsituation. The information contained in this communication may not berepresentative of the experience of other clients and does not constitute arecommendation, offer, or solicitation to buy, sell or hold any security of any issuer.Past performance does not guarantee future results.