global trends in responsible business conduct
DESCRIPTION
Global Trends in Responsible Business Conduct. Caroline Twigg, WBCSD 21 April 2011, Delhi. What is the WBCSD?. Market capitalization: $8,000 billion, 13 million employees Supplies products and services to half of the world’s population every day. Key moments in our recent history …. - PowerPoint PPT PresentationTRANSCRIPT

Global Trends in Responsible Business
ConductCaroline Twigg, WBCSD
21 April 2011, Delhi

What is the WBCSD?
• Market capitalization: $8,000 billion, 13 million employees
Supplies products and services to half of the world’s
population every day

3

1960 1980 20001970 1990 2010
Rio 2012
Financial crisis
Silent Spring
published
FoE established Limits to
Growth published
Stockholm Conference
Rio World SummitWBCSD
established
WSSDJohannesburg
Corporate scandals &
SOX
China becomes largest GHG
emitter
Inconvenient truth
Our Common
Future
Exxon Valdez3 mile
island
1st satellite image of
earth
Oil Crisis
Chernobyl
WTO established
Famine in Africa
Berlin Wall
collapse
Nike child
labour
Battle of Seattle
Stern Review
Kyoto
Bhopal
Prius to market
Montreal Protocol
Key moments in our recent history …

shaped our world today
2929
Business’ role in society

Increased stakeholder interest

The 21st Century NGO SustainAbility
Founding dates of key NGOs
Increased stakeholder activity

Institutional investors: increasingly factoring ‘social’ issues into investment decisions
Increased investor scrutiny

Increased resource constraints
0
20
40
60
80
100
120
140
160
If the world consumes at today's rate
If the world consumes at half USconsumption rates
Source: Earth's natural wealth: an audit, the New Scientist, 2007

Business: increased efficiencies
South Africa Energy Efficiency AccordCheap electricity blackouts
2005: Minister for Energy and Minerals + CEOs of 24 major energy users + seven industry associations
Eg Eskom: 1 billion kWh savings
Implementation: • Tools, expertise and peer support: collaboration• Business-govt partnership
Advantages:• Business savings: costs, CDM revenues• Whole economy: competitiveness• Environmental sustainability• Meet government targets

Business: increased opportunities
92% of UK business leaders think green growth represents an opportunity for their business (Carbon Trust)
2010: USA solar market 67% growth
Green buildings (USA study):
– 1.8% more cost to design and construct
– 20% cost saving over lifetime
Business: increased measurement and monitoring
www.ghgprotocol.org

Increasing numbers of corporate sustainability reports with GRI
Demonstrated transparency public accountability
Business: increased reporting and accountability

Source: Annual Review (2007) United Nations Global Compact
United Nations Global Compact (2000): >4,000 signatories, 100 countries
Business: increased global, voluntary actions
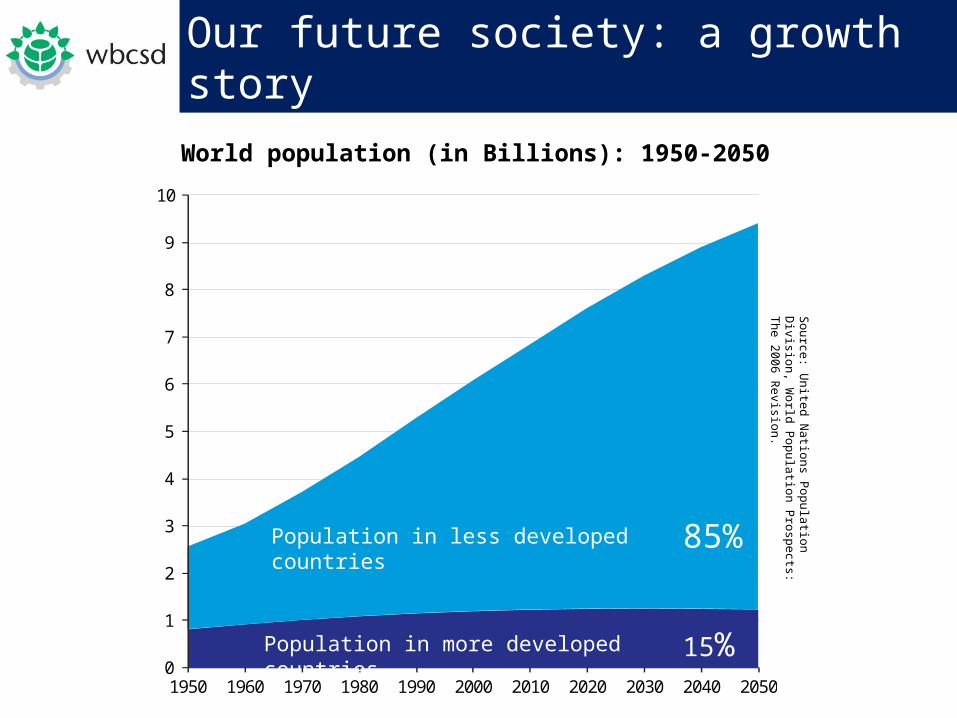
Our future society: a growth story
0
1
2
3
4
5
6
7
8
9
10
1950 1960 1970 1980 1990 2000 2010 2020 2030 2040 2050
Sou
rce: U
nite
d Na
tions P
opu
lation
Divisio
n, W
orld
P
opu
latio
n Pro
spe
cts: Th
e 20
06
Re
vision.
World population (in Billions): 1950-2050
85%
15%
Population in less developed countries
Population in more developed countries
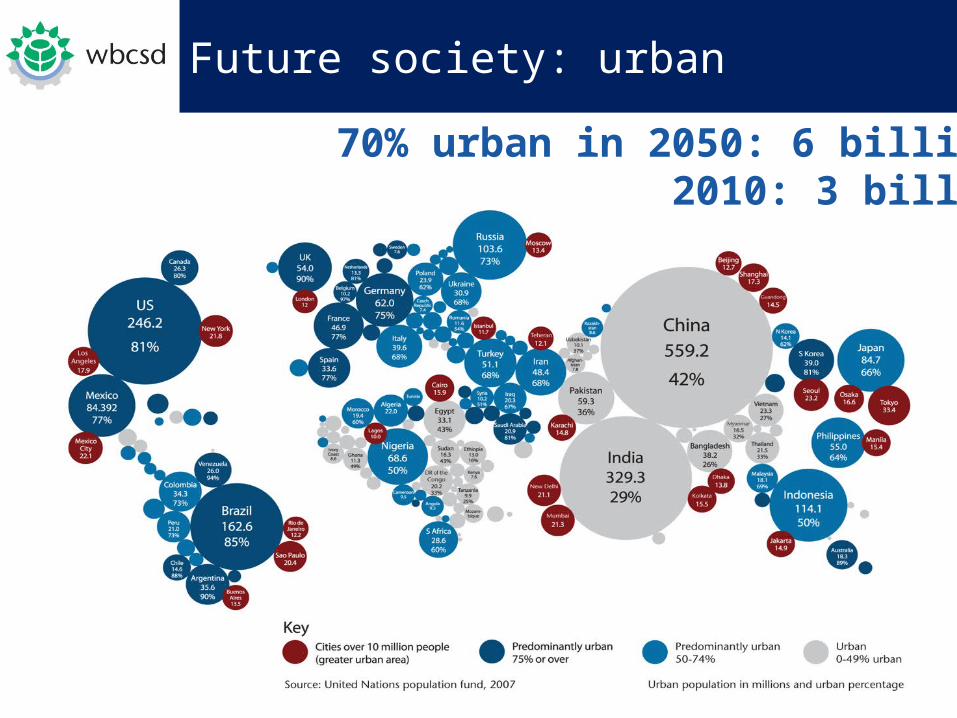
Future society: urban
1616
70% urban in 2050: 6 billion 2010: 3 billion

Human Development Index (HDI)
Future society: key challengesS
ource: GF
N / U
ND
P
Eco
log
ica
l Fo
otp
rint
(Glo
ba
l He
cta
res
pe
r P
ers
on
)

Transition to sustainability: consequences for business
Input into public policy-making and PPPs Competition for resources Environmental protection: competitive Pressure to measure/report ecosystems impacts Business cannot succeed in a society that fails
Solutions provider Growth opportunity: infrastructure, products and services
Green Economy
Global Governance of Sustainable Development

… to transform to low carbon economies and lead the supply of resource efficient technologies & solutions
EU – Market leader on green tech exports (40% mkt share)– 300% increase in green tech R&D (2009)– Transformation of internal market?
USA – Mobilizing the US innovation capability?– Transformation of home market?
Japan– Most energy efficient economy– Good technology platform for green solutions
‘The Green Race’ is on
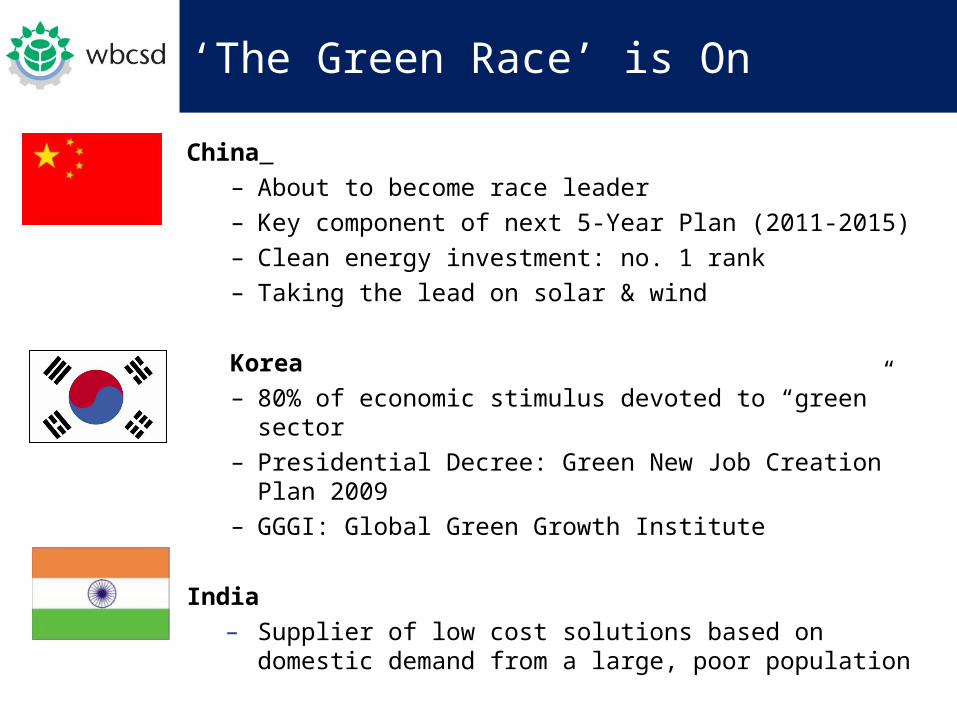
‘The Green Race’ is On
China – About to become race leader– Key component of next 5-Year Plan (2011-2015)– Clean energy investment: no. 1 rank– Taking the lead on solar & wind
Korea– 80% of economic stimulus devoted to “green” sector – Presidential Decree: Green New Job Creation Plan 2009– GGGI: Global Green Growth Institute
India– Supplier of low cost solutions based on domestic demand
from a large, poor population

Protect Reducing risk Strengthening the license to operate Increasing brand value / reputation
Manage Reducing costs Enhancing productivity Raising the quality of people
Grow Improving access to / cost of capital Promoting revenue growth Improving market access Stimulating innovation
Opportunities for responsible businesses … role of business

WBCSD Vision 2050
Platform for dialogue
about the business role in a
resource & carbon
constrained world
