global value of gm rice matty demont a and alexander j. stein b a africa rice center (africarice),...
TRANSCRIPT
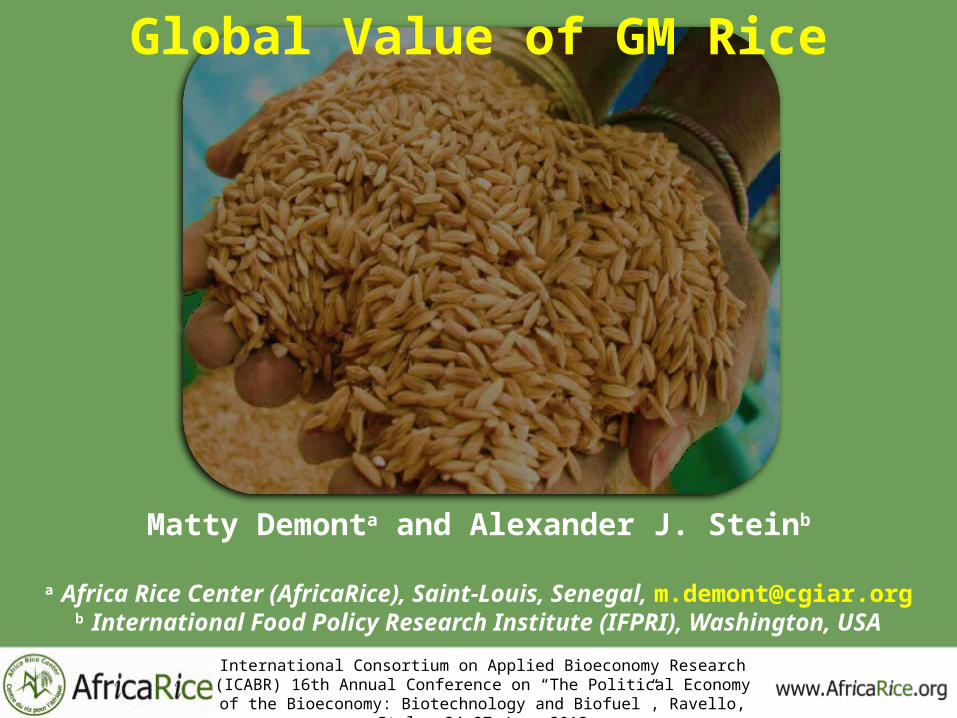
Global Value of GM Rice
Matty Demonta and Alexander J. Steinb
a Africa Rice Center (AfricaRice), Saint-Louis, Senegal, [email protected] International Food Policy Research Institute (IFPRI), Washington, USA
International Consortium on Applied Bioeconomy Research (ICABR) 16th Annual Conference on “The Political Economy of the Bioeconomy:
Biotechnology and Biofuel”, Ravello, Italy, 24–27 June 2012
Outline
1. Introduction
2. Methods
3. Metrics
4. Critical assessment
International Consortium on Applied Bioeconomy Research (ICABR) 16th Annual Conference on “The Political Economy of the Bioeconomy:
Biotechnology and Biofuel”, Ravello, Italy, 24–27 June 2012
1. Introduction
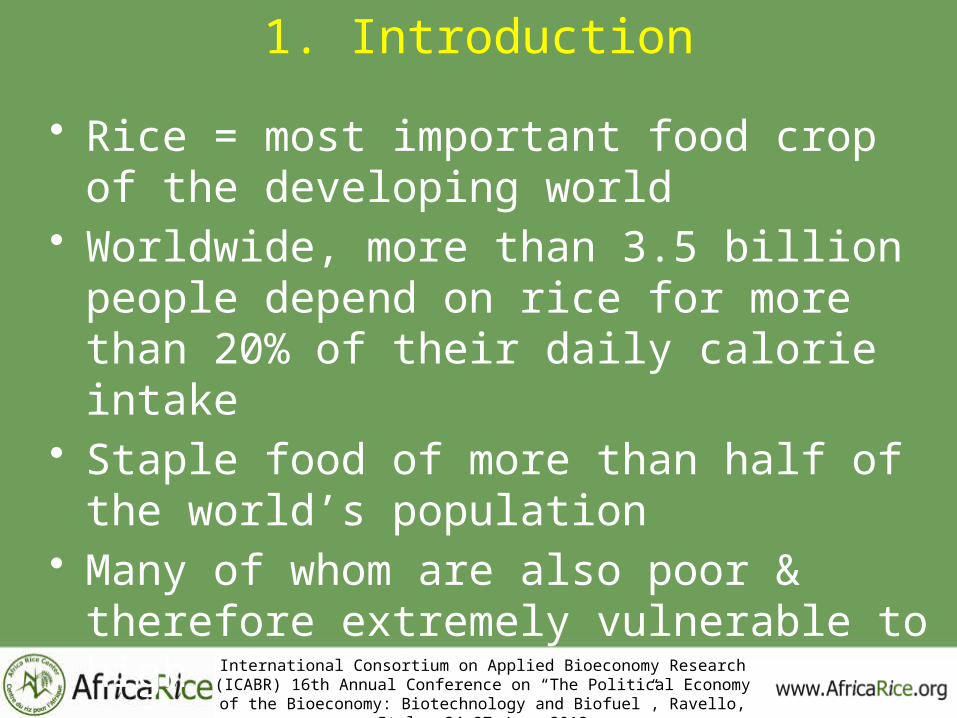
• Rice = most important food crop of the developing world
• Worldwide, more than 3.5 billion people depend on rice for more than 20% of their daily calorie intake
• Staple food of more than half of the world’s population
• Many of whom are also poor & therefore extremely vulnerable to high rice prices
International Consortium on Applied Bioeconomy Research (ICABR) 16th Annual Conference on “The Political Economy of the Bioeconomy:
Biotechnology and Biofuel”, Ravello, Italy, 24–27 June 2012

1. Introduction
• Rice world market = thin, fragmented, inelastic domestic demand, low world stockholdings unstable
• GM rice may have substantial implications• For alleviation of poverty, hunger, and
malnutrition in rice growing & consuming countries (James, 2005)
• For global acceptance of GM crops (Brookes & Barfoot, 2003)
International Consortium on Applied Bioeconomy Research (ICABR) 16th Annual Conference on “The Political Economy of the Bioeconomy:
Biotechnology and Biofuel”, Ravello, Italy, 24–27 June 2012

1. Introduction
International Consortium on Applied Bioeconomy Research (ICABR) 16th Annual Conference on “The Political Economy of the Bioeconomy:
Biotechnology and Biofuel”, Ravello, Italy, 24–27 June 2012
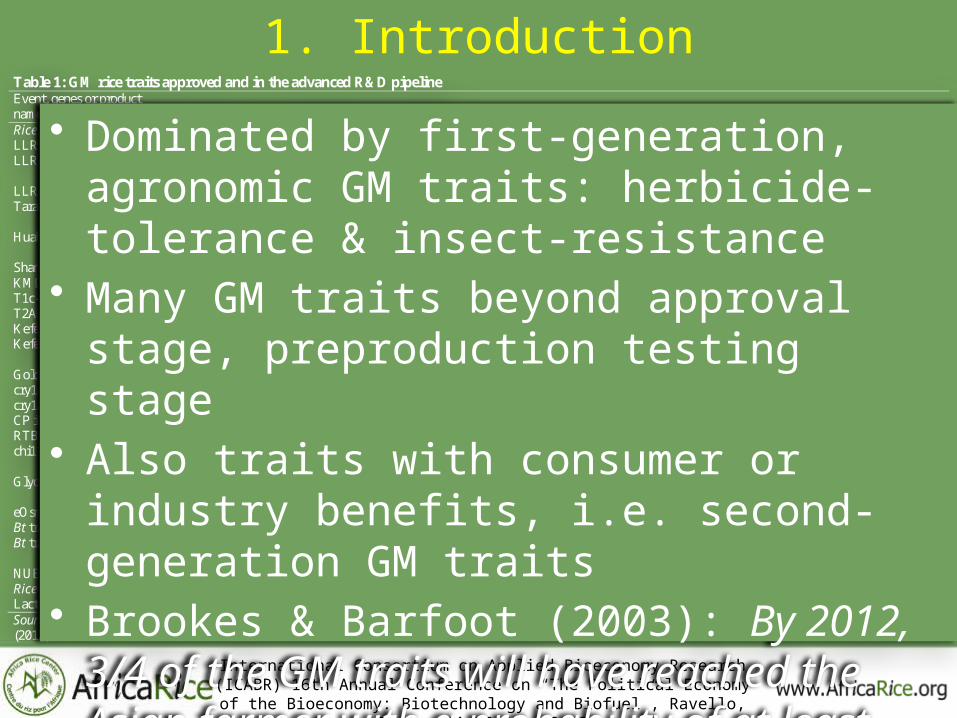
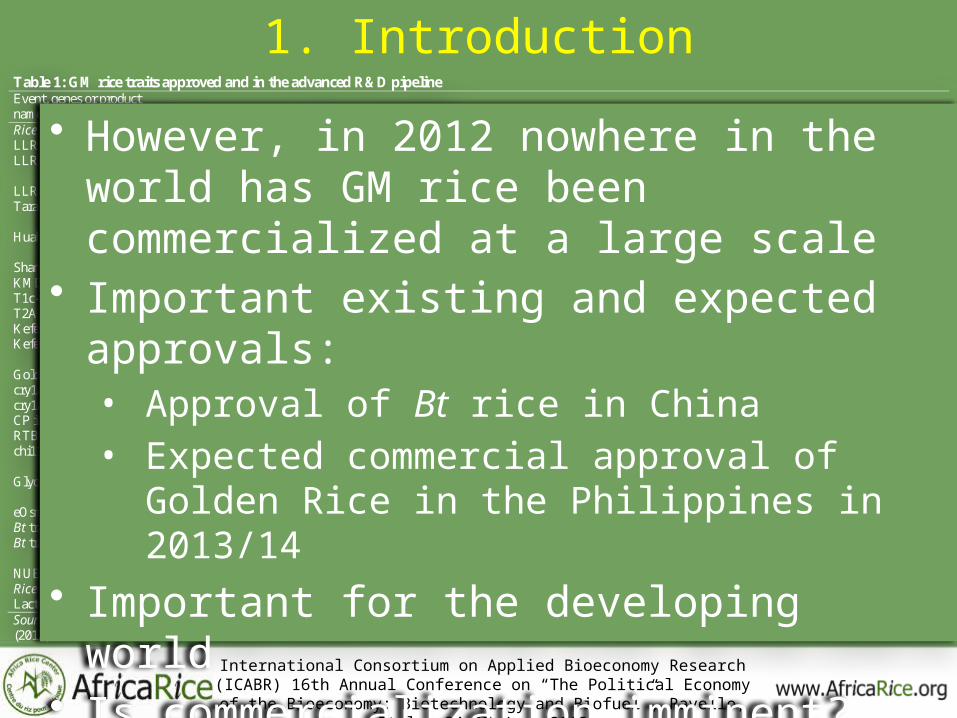
Table 1: GM rice traits approved and in the advanced R&D pipeline Event, genes or product name Trait Developer First approval or development stage Rice with agronomic or nutritional traits
LLRICE62 Herbicide-tolerance Bayer CropScience, Germany Fully deregulated in the United States in 2000 a
LLRICE06 Herbicide-tolerance Bayer CropScience, Germany Fully deregulated in the United States in 2000 b
LLRICE601 Herbicide-tolerance Bayer CropScience, Germany Environmental approval in the United States in 2006, approval for food and feed in Columbia in 2008 b
Tararikhteh B827 Insect-resistance Iran Approved by the Agriculture Ministry in Iran in 2005, then revoked again a
Huahui 1 Insect-resistance Huazhong Agricultural University, China Biosafety certificate for commercial production issued in China in 2009 c, d
Shanyou 63 Insect-resistance Huazhong Agricultural University, China Biosafety certificate for commercial production issued in China in 2009 c, d
KMD1 Insect-resistance China Stage of preproduction testing passed in China in 2009 c
T1c-9 Insect-resistance China Stage of preproduction testing passed in China in 2009 c
T2A-1 Insect-resistance China Stage of preproduction testing passed in China in 2009 c
Kefeng 6 Insect-resistance China Stage of preproduction testing passed in China in 2009 c
Kefeng 8 Insect-resistance China Stage of preproduction testing passed in China in 2009 c
Golden Rice (GR2) Beta-carotene content International Rice Research Institute, Philippines
Preparation of safety information for submission to regulators in the Philippines in 2013 e
cry1Ac Insect-resistance India Advanced R&D in India a
cry1Ab, cry1C & bar Insect-resistance India Advanced R&D in India a
CP iORF-IV Virus-resistance India Advanced R&D in India a
RTBV-ODs2 Virus-resistance India Advanced R&D in India a
chi11 tlp Disease-resistance India Advanced R&D in India a
Glyoxalase I & II Abiotic stress-tolerance India Advanced R&D in India a
eOsmotin Abiotic stress-tolerance India Advanced R&D in India a
Bt traits Insect-resistance Pakistan Advanced R&D in Pakistan a
Bt traits Insect-resistance Indonesia Advanced R&D in Indonesia a
NUE Nitrogen-use efficiency Arcadia Biosciences, United States Advanced R&D in the United States f
Rice with pharmaceutical or medical traits Lactoferrin Lactoferrin content Ventria Bioscience, United States Clinical trials in the United States g
Sources: a Stein & Rodriguez-Cerezo (2009), as complemented by Barry (2011); b ISAAA (2011); c Chen et al. (2011) ; d Lu (2010); e IRRI (2012); f Arcadia (2012); g Ventria (2012)
1. Introduction
International Consortium on Applied Bioeconomy Research (ICABR) 16th Annual Conference on “The Political Economy of the Bioeconomy:
Biotechnology and Biofuel”, Ravello, Italy, 24–27 June 2012
Table 1: GM rice traits approved and in the advanced R&D pipeline Event, genes or product name Trait Developer First approval or development stage Rice with agronomic or nutritional traits
LLRICE62 Herbicide-tolerance Bayer CropScience, Germany Fully deregulated in the United States in 2000 a
LLRICE06 Herbicide-tolerance Bayer CropScience, Germany Fully deregulated in the United States in 2000 b
LLRICE601 Herbicide-tolerance Bayer CropScience, Germany Environmental approval in the United States in 2006, approval for food and feed in Columbia in 2008 b
Tararikhteh B827 Insect-resistance Iran Approved by the Agriculture Ministry in Iran in 2005, then revoked again a
Huahui 1 Insect-resistance Huazhong Agricultural University, China Biosafety certificate for commercial production issued in China in 2009 c, d
Shanyou 63 Insect-resistance Huazhong Agricultural University, China Biosafety certificate for commercial production issued in China in 2009 c, d
KMD1 Insect-resistance China Stage of preproduction testing passed in China in 2009 c
T1c-9 Insect-resistance China Stage of preproduction testing passed in China in 2009 c
T2A-1 Insect-resistance China Stage of preproduction testing passed in China in 2009 c
Kefeng 6 Insect-resistance China Stage of preproduction testing passed in China in 2009 c
Kefeng 8 Insect-resistance China Stage of preproduction testing passed in China in 2009 c
Golden Rice (GR2) Beta-carotene content International Rice Research Institute, Philippines
Preparation of safety information for submission to regulators in the Philippines in 2013 e
cry1Ac Insect-resistance India Advanced R&D in India a
cry1Ab, cry1C & bar Insect-resistance India Advanced R&D in India a
CP iORF-IV Virus-resistance India Advanced R&D in India a
RTBV-ODs2 Virus-resistance India Advanced R&D in India a
chi11 tlp Disease-resistance India Advanced R&D in India a
Glyoxalase I & II Abiotic stress-tolerance India Advanced R&D in India a
eOsmotin Abiotic stress-tolerance India Advanced R&D in India a
Bt traits Insect-resistance Pakistan Advanced R&D in Pakistan a
Bt traits Insect-resistance Indonesia Advanced R&D in Indonesia a
NUE Nitrogen-use efficiency Arcadia Biosciences, United States Advanced R&D in the United States f
Rice with pharmaceutical or medical traits Lactoferrin Lactoferrin content Ventria Bioscience, United States Clinical trials in the United States g
Sources: a Stein & Rodriguez-Cerezo (2009), as complemented by Barry (2011); b ISAAA (2011); c Chen et al. (2011) ; d Lu (2010); e IRRI (2012); f Arcadia (2012); g Ventria (2012)
• Dominated by first-generation, agronomic GM traits: herbicide-tolerance & insect-resistance
• Many GM traits beyond approval stage, preproduction testing stage
• Also traits with consumer or industry benefits, i.e. second-generation GM traits
• Brookes & Barfoot (2003): By 2012, 3/4 of the GM traits will have reached the Asian farmer with a probability of at least 80%
1. Introduction
International Consortium on Applied Bioeconomy Research (ICABR) 16th Annual Conference on “The Political Economy of the Bioeconomy:
Biotechnology and Biofuel”, Ravello, Italy, 24–27 June 2012
Table 1: GM rice traits approved and in the advanced R&D pipeline Event, genes or product name Trait Developer First approval or development stage Rice with agronomic or nutritional traits
LLRICE62 Herbicide-tolerance Bayer CropScience, Germany Fully deregulated in the United States in 2000 a
LLRICE06 Herbicide-tolerance Bayer CropScience, Germany Fully deregulated in the United States in 2000 b
LLRICE601 Herbicide-tolerance Bayer CropScience, Germany Environmental approval in the United States in 2006, approval for food and feed in Columbia in 2008 b
Tararikhteh B827 Insect-resistance Iran Approved by the Agriculture Ministry in Iran in 2005, then revoked again a
Huahui 1 Insect-resistance Huazhong Agricultural University, China Biosafety certificate for commercial production issued in China in 2009 c, d
Shanyou 63 Insect-resistance Huazhong Agricultural University, China Biosafety certificate for commercial production issued in China in 2009 c, d
KMD1 Insect-resistance China Stage of preproduction testing passed in China in 2009 c
T1c-9 Insect-resistance China Stage of preproduction testing passed in China in 2009 c
T2A-1 Insect-resistance China Stage of preproduction testing passed in China in 2009 c
Kefeng 6 Insect-resistance China Stage of preproduction testing passed in China in 2009 c
Kefeng 8 Insect-resistance China Stage of preproduction testing passed in China in 2009 c
Golden Rice (GR2) Beta-carotene content International Rice Research Institute, Philippines
Preparation of safety information for submission to regulators in the Philippines in 2013 e
cry1Ac Insect-resistance India Advanced R&D in India a
cry1Ab, cry1C & bar Insect-resistance India Advanced R&D in India a
CP iORF-IV Virus-resistance India Advanced R&D in India a
RTBV-ODs2 Virus-resistance India Advanced R&D in India a
chi11 tlp Disease-resistance India Advanced R&D in India a
Glyoxalase I & II Abiotic stress-tolerance India Advanced R&D in India a
eOsmotin Abiotic stress-tolerance India Advanced R&D in India a
Bt traits Insect-resistance Pakistan Advanced R&D in Pakistan a
Bt traits Insect-resistance Indonesia Advanced R&D in Indonesia a
NUE Nitrogen-use efficiency Arcadia Biosciences, United States Advanced R&D in the United States f
Rice with pharmaceutical or medical traits Lactoferrin Lactoferrin content Ventria Bioscience, United States Clinical trials in the United States g
Sources: a Stein & Rodriguez-Cerezo (2009), as complemented by Barry (2011); b ISAAA (2011); c Chen et al. (2011) ; d Lu (2010); e IRRI (2012); f Arcadia (2012); g Ventria (2012)
• However, in 2012 nowhere in the world has GM rice been commercialized at a large scale
• Important existing and expected approvals:• Approval of Bt rice in China• Expected commercial approval of Golden Rice
in the Philippines in 2013/14 • Important for the developing world• Is commercialization imminent?• Review evidence on global value of GM rice

2. Methods
• Almost no ex-post evidence ex-ante• Field trials vs. on-farm trials• ANOVA, (stochastic) partial budgeting vs.
econometric techniques• Assumptions (e.g. technology licensing fee)• Exogenous vs. endogenous technology fee• Partial equilibrium models vs. CGE• Disability-adjusted life years (DALYs)
approach
International Consortium on Applied Bioeconomy Research (ICABR) 16th Annual Conference on “The Political Economy of the Bioeconomy:
Biotechnology and Biofuel”, Ravello, Italy, 24–27 June 2012
3. Metrics
International Consortium on Applied Bioeconomy Research (ICABR) 16th Annual Conference on “The Political Economy of the Bioeconomy:
Biotechnology and Biofuel”, Ravello, Italy, 24–27 June 2012
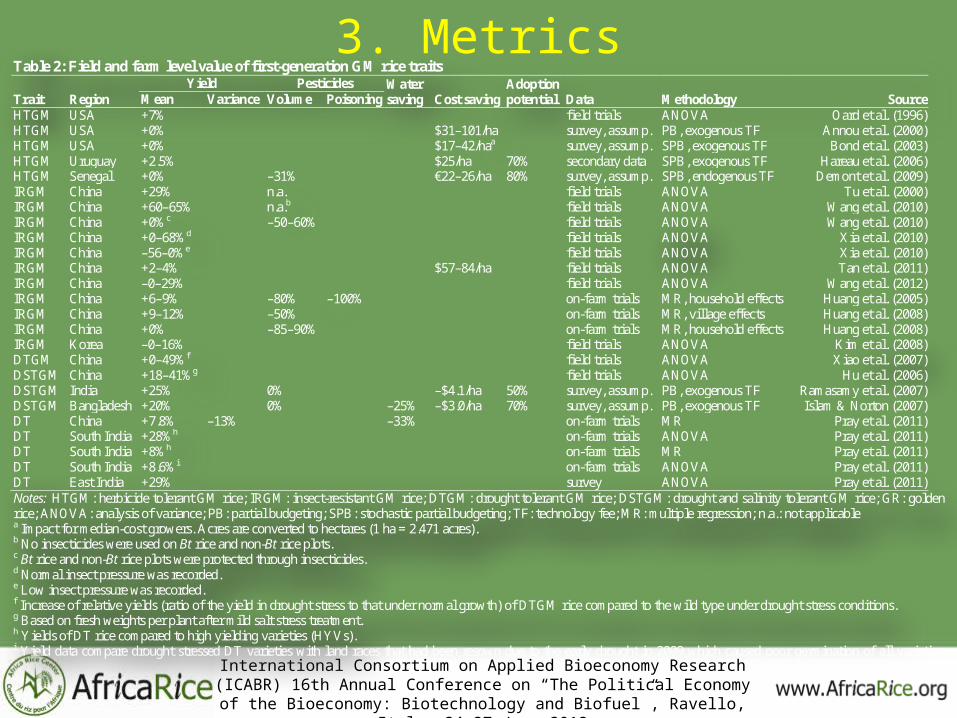
Table 2: Field and farm level value of first-generation GM rice traits
Trait Region Yield Pesticides Water
saving Cost saving Adoption potential Data Methodology Source Mean Variance Volume Poisoning
HTGM USA +7% field trials ANOVA Oard et al. (1996) HTGM USA +0% $31–101/ha survey, assump. PB, exogenous TF Annou et al. (2000) HTGM USA +0% $17–42/haa survey, assump. SPB, exogenous TF Bond et al. (2003) HTGM Uruguay +2.5% $25/ha 70% secondary data SPB, exogenous TF Hareau et al. (2006) HTGM Senegal +0% –31% €22–26/ha 80% survey, assump. SPB, endogenous TF Demont et al. (2009) IRGM China +29% n.a. field trials ANOVA Tu et al. (2000) IRGM China +60–65% n.a.b field trials ANOVA Wang et al. (2010) IRGM China +0%c –50–60% field trials ANOVA Wang et al. (2010) IRGM China +0–68%d field trials ANOVA Xia et al. (2010) IRGM China –56–0%e field trials ANOVA Xia et al. (2010) IRGM China +2–4% $57–84/ha field trials ANOVA Tan et al. (2011) IRGM China –0–29% field trials ANOVA Wang et al. (2012) IRGM China +6–9% –80% –100% on-farm trials MR, household effects Huang et al. (2005) IRGM China +9–12% –50% on-farm trials MR, village effects Huang et al. (2008) IRGM China +0% –85–90% on-farm trials MR, household effects Huang et al. (2008) IRGM Korea –0–16% field trials ANOVA Kim et al. (2008) DTGM China +0–49%f field trials ANOVA Xiao et al. (2007) DSTGM China +18–41%g field trials ANOVA Hu et al. (2006) DSTGM India +25% 0% –$4.1/ha 50% survey, assump. PB, exogenous TF Ramasamy et al. (2007) DSTGM Bangladesh +20% 0% –25% –$3.0/ha 70% survey, assump. PB, exogenous TF Islam & Norton (2007) DT China +7.8% –13% –33% on-farm trials MR Pray et al. (2011) DT South India +28%h on-farm trials ANOVA Pray et al. (2011) DT South India +8%h on-farm trials MR Pray et al. (2011) DT South India +8.6%i on-farm trials ANOVA Pray et al. (2011) DT East India +29% survey ANOVA Pray et al. (2011) Notes: HTGM: herbicide tolerant GM rice; IRGM: insect-resistant GM rice; DTGM: drought tolerant GM rice; DSTGM: drought and salinity tolerant GM rice; GR: golden rice; ANOVA: analysis of variance; PB: partial budgeting; SPB: stochastic partial budgeting; TF: technology fee; MR: multiple regression; n.a.: not applicable a Impact for median-cost growers. Acres are converted to hectares (1 ha = 2.471 acres). b No insecticides were used on Bt rice and non-Bt rice plots. c Bt rice and non-Bt rice plots were protected through insecticides. d Normal insect pressure was recorded. e Low insect pressure was recorded. f Increase of relative yields (ratio of the yield in drought stress to that under normal growth) of DTGM rice compared to the wild type under drought stress conditions. g Based on fresh weights per plant after mild salt stress treatment. h Yields of DT rice compared to high yielding varieties (HYVs). i Yield data compare drought stressed DT varieties with land races that had been resown due to the early drought in 2009 which caused poor germination of all varieties.

3. Metrics
International Consortium on Applied Bioeconomy Research (ICABR) 16th Annual Conference on “The Political Economy of the Bioeconomy:
Biotechnology and Biofuel”, Ravello, Italy, 24–27 June 2012
Table 2: Field and farm level value of first-generation GM rice traits
Trait Region Yield Pesticides Water
saving Cost saving Adoption potential Data Methodology Source Mean Variance Volume Poisoning
HTGM USA +7% field trials ANOVA Oard et al. (1996) HTGM USA +0% $31–101/ha survey, assump. PB, exogenous TF Annou et al. (2000) HTGM USA +0% $17–42/haa survey, assump. SPB, exogenous TF Bond et al. (2003) HTGM Uruguay +2.5% $25/ha 70% secondary data SPB, exogenous TF Hareau et al. (2006) HTGM Senegal +0% –31% €22–26/ha 80% survey, assump. SPB, endogenous TF Demont et al. (2009) IRGM China +29% n.a. field trials ANOVA Tu et al. (2000) IRGM China +60–65% n.a.b field trials ANOVA Wang et al. (2010) IRGM China +0%c –50–60% field trials ANOVA Wang et al. (2010) IRGM China +0–68%d field trials ANOVA Xia et al. (2010) IRGM China –56–0%e field trials ANOVA Xia et al. (2010) IRGM China +2–4% $57–84/ha field trials ANOVA Tan et al. (2011) IRGM China –0–29% field trials ANOVA Wang et al. (2012) IRGM China +6–9% –80% –100% on-farm trials MR, household effects Huang et al. (2005) IRGM China +9–12% –50% on-farm trials MR, village effects Huang et al. (2008) IRGM China +0% –85–90% on-farm trials MR, household effects Huang et al. (2008) IRGM Korea –0–16% field trials ANOVA Kim et al. (2008) DTGM China +0–49%f field trials ANOVA Xiao et al. (2007) DSTGM China +18–41%g field trials ANOVA Hu et al. (2006) DSTGM India +25% 0% –$4.1/ha 50% survey, assump. PB, exogenous TF Ramasamy et al. (2007) DSTGM Bangladesh +20% 0% –25% –$3.0/ha 70% survey, assump. PB, exogenous TF Islam & Norton (2007) DT China +7.8% –13% –33% on-farm trials MR Pray et al. (2011) DT South India +28%h on-farm trials ANOVA Pray et al. (2011) DT South India +8%h on-farm trials MR Pray et al. (2011) DT South India +8.6%i on-farm trials ANOVA Pray et al. (2011) DT East India +29% survey ANOVA Pray et al. (2011) Notes: HTGM: herbicide tolerant GM rice; IRGM: insect-resistant GM rice; DTGM: drought tolerant GM rice; DSTGM: drought and salinity tolerant GM rice; GR: golden rice; ANOVA: analysis of variance; PB: partial budgeting; SPB: stochastic partial budgeting; TF: technology fee; MR: multiple regression; n.a.: not applicable a Impact for median-cost growers. Acres are converted to hectares (1 ha = 2.471 acres). b No insecticides were used on Bt rice and non-Bt rice plots. c Bt rice and non-Bt rice plots were protected through insecticides. d Normal insect pressure was recorded. e Low insect pressure was recorded. f Increase of relative yields (ratio of the yield in drought stress to that under normal growth) of DTGM rice compared to the wild type under drought stress conditions. g Based on fresh weights per plant after mild salt stress treatment. h Yields of DT rice compared to high yielding varieties (HYVs). i Yield data compare drought stressed DT varieties with land races that had been resown due to the early drought in 2009 which caused poor germination of all varieties.
1. Anticipated impacts are in line with classic examples of commercialized first-generation GM crops• Impact of stress-resistant GM traits = f(stress
incidence/severity & use of damage control inputs, e.g. herbicides, insecticides, water)
• Impact of Bt rice in China ranges from +0–12% yield advantage to –50–90% insecticide use
• DT rice in China: –13% yield variance, –33% water
3. Metrics
International Consortium on Applied Bioeconomy Research (ICABR) 16th Annual Conference on “The Political Economy of the Bioeconomy:
Biotechnology and Biofuel”, Ravello, Italy, 24–27 June 2012
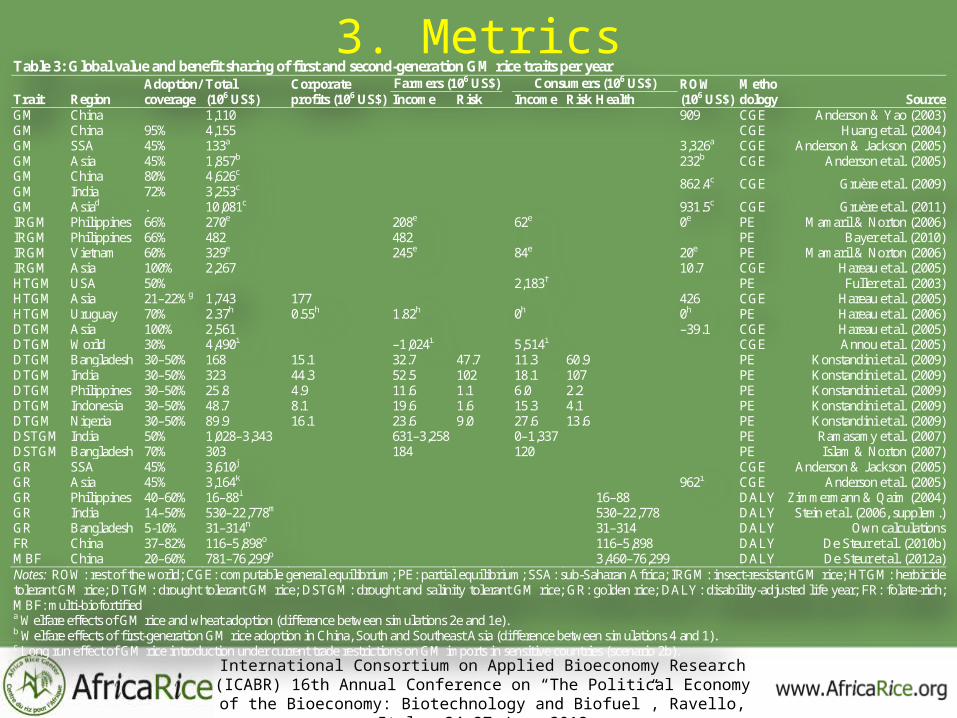
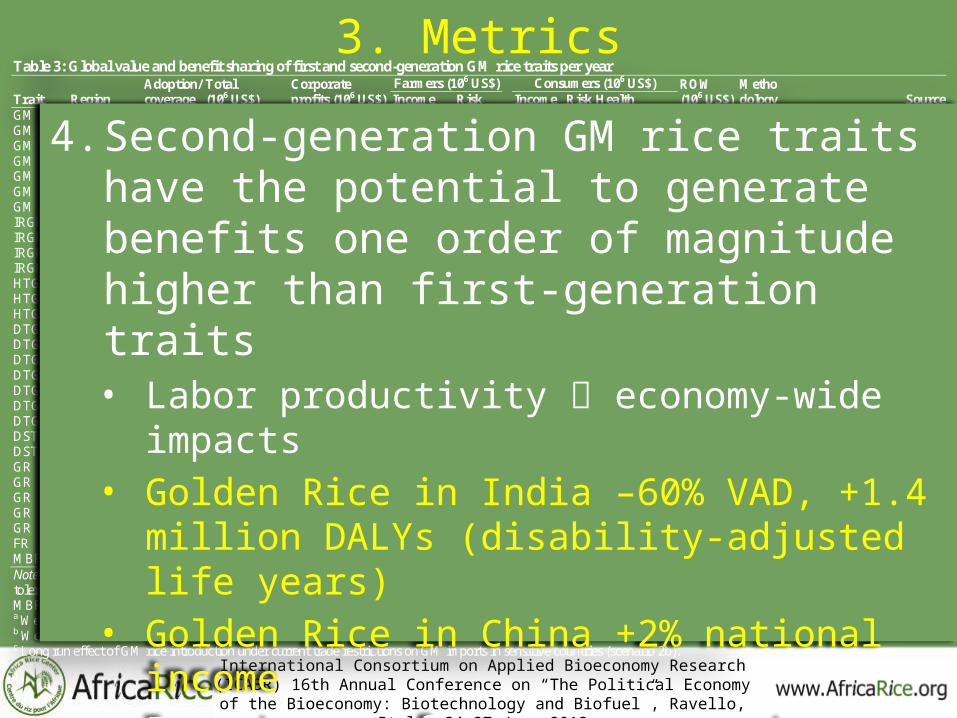
Table 3: Global value and benefit sharing of first and second-generation GM rice traits per year
Trait Region Adoption/coverage
Total (106 US$)
Corporate profits (106 US$)
Farmers (106 US$) Consumers (106 US$) ROW (106 US$)
Methodology Source Income Risk Income Risk Health
GM China 1,110 909 CGE Anderson & Yao (2003) GM China 95% 4,155 CGE Huang et al. (2004) GM SSA 45% 133a 3,326a CGE Anderson & Jackson (2005) GM Asia 45% 1,857b 232b CGE Anderson et al. (2005) GM China 80% 4,626c
862.4c CGE Gruère et al. (2009) GM India 72% 3,253c GM Asiad . 10,081c 931.5c CGE Gruère et al. (2011) IRGM Philippines 66% 270e 208e 62e 0e PE Mamaril & Norton (2006) IRGM Philippines 66% 482 482 PE Bayer et al. (2010) IRGM Vietnam 60% 329e 245e 84e 20e PE Mamaril & Norton (2006) IRGM Asia 100% 2,267 10.7 CGE Hareau et al. (2005) HTGM USA 50% 2,183f PE Fuller et al. (2003) HTGM Asia 21–22%g 1,743 177 426 CGE Hareau et al. (2005) HTGM Uruguay 70% 2.37h 0.55h 1.82h 0h 0h PE Hareau et al. (2006) DTGM Asia 100% 2,561 –39.1 CGE Hareau et al. (2005) DTGM World 30% 4,490i –1,024i 5,514i CGE Annou et al. (2005) DTGM Bangladesh 30–50% 168 15.1 32.7 47.7 11.3 60.9 PE Konstandini et al. (2009) DTGM India 30–50% 323 44.3 52.5 102 18.1 107 PE Konstandini et al. (2009) DTGM Philippines 30–50% 25.8 4.9 11.6 1.1 6.0 2.2 PE Konstandini et al. (2009) DTGM Indonesia 30–50% 48.7 8.1 19.6 1.6 15.3 4.1 PE Konstandini et al. (2009) DTGM Nigeria 30–50% 89.9 16.1 23.6 9.0 27.6 13.6 PE Konstandini et al. (2009) DSTGM India 50% 1,028–3,343 631–3,258 0–1,337 PE Ramasamy et al. (2007) DSTGM Bangladesh 70% 303 184 120 PE Islam & Norton (2007) GR SSA 45% 3,610j CGE Anderson & Jackson (2005) GR Asia 45% 3,164k 962i CGE Anderson et al. (2005) GR Philippines 40–60% 16–88l 16–88 DALY Zimmermann & Qaim (2004) GR India 14–50% 530–22,778m 530–22,778 DALY Stein et al. (2006, supplem.) GR Bangladesh 5-10% 31–314n 31–314 DALY Own calculations FR China 37–82% 116–5,898o 116–5,898 DALY De Steur et al. (2010b) MBF China 20–60% 781–76,299p 3,460–76,299 DALY De Steur et al. (2012a) Notes: ROW: rest of the world; CGE: computable general equilibrium; PE: partial equilibrium; SSA: sub-Saharan Africa; IRGM: insect-resistant GM rice; HTGM: herbicide tolerant GM rice; DTGM: drought tolerant GM rice; DSTGM: drought and salinity tolerant GM rice; GR: golden rice; DALY: disability-adjusted life year; FR: folate-rich; MBF: multi-biofortified a Welfare effects of GM rice and wheat adoption (difference between simulations 2e and 1e). b Welfare effects of first-generation GM rice adoption in China, South and Southeast Asia (difference between simulations 4 and 1). c Long run effect of GM rice introduction under current trade restrictions on GM imports in sensitive countries (scenario 2b).

3. Metrics
International Consortium on Applied Bioeconomy Research (ICABR) 16th Annual Conference on “The Political Economy of the Bioeconomy:
Biotechnology and Biofuel”, Ravello, Italy, 24–27 June 2012
Table 3: Global value and benefit sharing of first and second-generation GM rice traits per year
Trait Region Adoption/coverage
Total (106 US$)
Corporate profits (106 US$)
Farmers (106 US$) Consumers (106 US$) ROW (106 US$)
Methodology Source Income Risk Income Risk Health
GM China 1,110 909 CGE Anderson & Yao (2003) GM China 95% 4,155 CGE Huang et al. (2004) GM SSA 45% 133a 3,326a CGE Anderson & Jackson (2005) GM Asia 45% 1,857b 232b CGE Anderson et al. (2005) GM China 80% 4,626c
862.4c CGE Gruère et al. (2009) GM India 72% 3,253c GM Asiad . 10,081c 931.5c CGE Gruère et al. (2011) IRGM Philippines 66% 270e 208e 62e 0e PE Mamaril & Norton (2006) IRGM Philippines 66% 482 482 PE Bayer et al. (2010) IRGM Vietnam 60% 329e 245e 84e 20e PE Mamaril & Norton (2006) IRGM Asia 100% 2,267 10.7 CGE Hareau et al. (2005) HTGM USA 50% 2,183f PE Fuller et al. (2003) HTGM Asia 21–22%g 1,743 177 426 CGE Hareau et al. (2005) HTGM Uruguay 70% 2.37h 0.55h 1.82h 0h 0h PE Hareau et al. (2006) DTGM Asia 100% 2,561 –39.1 CGE Hareau et al. (2005) DTGM World 30% 4,490i –1,024i 5,514i CGE Annou et al. (2005) DTGM Bangladesh 30–50% 168 15.1 32.7 47.7 11.3 60.9 PE Konstandini et al. (2009) DTGM India 30–50% 323 44.3 52.5 102 18.1 107 PE Konstandini et al. (2009) DTGM Philippines 30–50% 25.8 4.9 11.6 1.1 6.0 2.2 PE Konstandini et al. (2009) DTGM Indonesia 30–50% 48.7 8.1 19.6 1.6 15.3 4.1 PE Konstandini et al. (2009) DTGM Nigeria 30–50% 89.9 16.1 23.6 9.0 27.6 13.6 PE Konstandini et al. (2009) DSTGM India 50% 1,028–3,343 631–3,258 0–1,337 PE Ramasamy et al. (2007) DSTGM Bangladesh 70% 303 184 120 PE Islam & Norton (2007) GR SSA 45% 3,610j CGE Anderson & Jackson (2005) GR Asia 45% 3,164k 962i CGE Anderson et al. (2005) GR Philippines 40–60% 16–88l 16–88 DALY Zimmermann & Qaim (2004) GR India 14–50% 530–22,778m 530–22,778 DALY Stein et al. (2006, supplem.) GR Bangladesh 5-10% 31–314n 31–314 DALY Own calculations FR China 37–82% 116–5,898o 116–5,898 DALY De Steur et al. (2010b) MBF China 20–60% 781–76,299p 3,460–76,299 DALY De Steur et al. (2012a) Notes: ROW: rest of the world; CGE: computable general equilibrium; PE: partial equilibrium; SSA: sub-Saharan Africa; IRGM: insect-resistant GM rice; HTGM: herbicide tolerant GM rice; DTGM: drought tolerant GM rice; DSTGM: drought and salinity tolerant GM rice; GR: golden rice; DALY: disability-adjusted life year; FR: folate-rich; MBF: multi-biofortified a Welfare effects of GM rice and wheat adoption (difference between simulations 2e and 1e). b Welfare effects of first-generation GM rice adoption in China, South and Southeast Asia (difference between simulations 4 and 1). c Long run effect of GM rice introduction under current trade restrictions on GM imports in sensitive countries (scenario 2b).
2. Rice demand = relatively inelastic large impact on food prices and poverty• Impact of GM rice in China = +$4 billion• Rice price China –12%• Domestic demand +1.4%• Increase income & demand in other sectors
3. World market = thin (small share is traded) most gains are captured domestically Independent of GM-unfriendly trade policies
3. Metrics
International Consortium on Applied Bioeconomy Research (ICABR) 16th Annual Conference on “The Political Economy of the Bioeconomy:
Biotechnology and Biofuel”, Ravello, Italy, 24–27 June 2012
Table 3: Global value and benefit sharing of first and second-generation GM rice traits per year
Trait Region Adoption/coverage
Total (106 US$)
Corporate profits (106 US$)
Farmers (106 US$) Consumers (106 US$) ROW (106 US$)
Methodology Source Income Risk Income Risk Health
GM China 1,110 909 CGE Anderson & Yao (2003) GM China 95% 4,155 CGE Huang et al. (2004) GM SSA 45% 133a 3,326a CGE Anderson & Jackson (2005) GM Asia 45% 1,857b 232b CGE Anderson et al. (2005) GM China 80% 4,626c
862.4c CGE Gruère et al. (2009) GM India 72% 3,253c GM Asiad . 10,081c 931.5c CGE Gruère et al. (2011) IRGM Philippines 66% 270e 208e 62e 0e PE Mamaril & Norton (2006) IRGM Philippines 66% 482 482 PE Bayer et al. (2010) IRGM Vietnam 60% 329e 245e 84e 20e PE Mamaril & Norton (2006) IRGM Asia 100% 2,267 10.7 CGE Hareau et al. (2005) HTGM USA 50% 2,183f PE Fuller et al. (2003) HTGM Asia 21–22%g 1,743 177 426 CGE Hareau et al. (2005) HTGM Uruguay 70% 2.37h 0.55h 1.82h 0h 0h PE Hareau et al. (2006) DTGM Asia 100% 2,561 –39.1 CGE Hareau et al. (2005) DTGM World 30% 4,490i –1,024i 5,514i CGE Annou et al. (2005) DTGM Bangladesh 30–50% 168 15.1 32.7 47.7 11.3 60.9 PE Konstandini et al. (2009) DTGM India 30–50% 323 44.3 52.5 102 18.1 107 PE Konstandini et al. (2009) DTGM Philippines 30–50% 25.8 4.9 11.6 1.1 6.0 2.2 PE Konstandini et al. (2009) DTGM Indonesia 30–50% 48.7 8.1 19.6 1.6 15.3 4.1 PE Konstandini et al. (2009) DTGM Nigeria 30–50% 89.9 16.1 23.6 9.0 27.6 13.6 PE Konstandini et al. (2009) DSTGM India 50% 1,028–3,343 631–3,258 0–1,337 PE Ramasamy et al. (2007) DSTGM Bangladesh 70% 303 184 120 PE Islam & Norton (2007) GR SSA 45% 3,610j CGE Anderson & Jackson (2005) GR Asia 45% 3,164k 962i CGE Anderson et al. (2005) GR Philippines 40–60% 16–88l 16–88 DALY Zimmermann & Qaim (2004) GR India 14–50% 530–22,778m 530–22,778 DALY Stein et al. (2006, supplem.) GR Bangladesh 5-10% 31–314n 31–314 DALY Own calculations FR China 37–82% 116–5,898o 116–5,898 DALY De Steur et al. (2010b) MBF China 20–60% 781–76,299p 3,460–76,299 DALY De Steur et al. (2012a) Notes: ROW: rest of the world; CGE: computable general equilibrium; PE: partial equilibrium; SSA: sub-Saharan Africa; IRGM: insect-resistant GM rice; HTGM: herbicide tolerant GM rice; DTGM: drought tolerant GM rice; DSTGM: drought and salinity tolerant GM rice; GR: golden rice; DALY: disability-adjusted life year; FR: folate-rich; MBF: multi-biofortified a Welfare effects of GM rice and wheat adoption (difference between simulations 2e and 1e). b Welfare effects of first-generation GM rice adoption in China, South and Southeast Asia (difference between simulations 4 and 1). c Long run effect of GM rice introduction under current trade restrictions on GM imports in sensitive countries (scenario 2b).
4. Second-generation GM rice traits have the potential to generate benefits one order of magnitude higher than first-generation traits• Labor productivity economy-wide impacts• Golden Rice in India –60% VAD, +1.4 million
DALYs (disability-adjusted life years)• Golden Rice in China +2% national income• Importance of consumer acceptance

4. Critical Assessment
Four limitations:
1. Proprietary seed technologies• Monopolistic rent extraction• Endogeneize technology licensing fee
(Demont et al., 2009; Dillen et al., 2009; Konstandini et al., 2009)
2. Focus on first-order statistics (e.g. of yields)• DT rice: yield variance reductions• Represents 40% of the total benefits in Asia
(Konstandini et al, 2009)
International Consortium on Applied Bioeconomy Research (ICABR) 16th Annual Conference on “The Political Economy of the Bioeconomy:
Biotechnology and Biofuel”, Ravello, Italy, 24–27 June 2012

4. Critical Assessment
Four limitations:
3. Modeling strategies• Hicks-neutral productivity shocks• Ex-post evidence shows shocks = factor-biased• Consider trade effects, restrictions
4. Challenge of transforming DALYs $ values• What is the value of a DALY? $500, $1000,
GDP, GNI?• CGE captures economy-wide impacts
(Anderson et al., 2005a, 2005b)International Consortium on Applied Bioeconomy Research (ICABR) 16th
Annual Conference on “The Political Economy of the Bioeconomy: Biotechnology and Biofuel”, Ravello, Italy, 24–27 June 2012
Thank you! Grazie!
Center of Excellence for Rice Research
International Consortium on Applied Bioeconomy Research (ICABR) 16th Annual Conference on “The Political Economy of the Bioeconomy:
Biotechnology and Biofuel”, Ravello, Italy, 24–27 June 2012