global variation of soil microbial carbon-use efficiency
TRANSCRIPT

1Scientific RepoRts | (2019) 9:5621 | https://doi.org/10.1038/s41598-019-42145-6
www.nature.com/scientificreports
Global variation of soil microbial carbon-use efficiency in relation to growth temperature and substrate supplyYang Qiao1, Jing Wang1, Guopeng Liang2, Zhenggang Du1, Jian Zhou1, Chen Zhu1, Kun Huang1, Xuhui Zhou 1, Yiqi Luo2, Liming Yan 1 & Jianyang Xia 1
Soil microbial carbon-use efficiency (CUE), which is defined as the ratio of growth over C uptake, is commonly assumed as a constant or estimated by a temperature-dependent function in current microbial-explicit soil carbon (C) models. The temperature-dependent function (i.e., CUE = CUE0 + m × (T − 20)) simulates the dynamic CUE based on the specific CUE at a given reference temperature (i.e., CUE0) and a temperature response coefficient (i.e., m). Here, based on 780 observations from 98 sites, we showed a divergent spatial distribution of the soil microbial CUE (0.5 ± 0.25; mean ± SD) at the global scale. Then, the key parameters CUE0 and m in the above equation were estimated as 0.475 and −0.016, respectively, based on the observations with the Markov chain Monte Carlo technique. We also found a strong dependence of microbial CUE on the type of C substrate. The multiple regression analysis showed that glucose influences the variation of measured CUE associated with the environmental factors. Overall, this study confirms the global divergence of soil microbial CUE and calls for the incorporation of C substrate beside temperature in estimating the microbial CUE in different biomes.
Soil microbial dynamic is a key regulator of ecosystem carbon (C) cycling because of its important role in decom-position and stabilization of soil organic carbon (SOC)1–3. The mechanistic understanding of soil microbial dynamics has been rapidly improved in recent decades4, but their numeric representation in the Earth system models (ESMs) has lagged behind5. Recent studies have reported that it might be reasonable to incorporate micro-bial processes into global C model5–9. For example, the simulated global SOC by the Community Land Model (CLM) has been more accurate with the implementation of microbial dynamics7–9. In those microbial-explicit SOC models, the soil microbial carbon-use efficiency (CUE; i.e., the ratio of growth over C uptake) is a key parameter. However, there is a lack of consensus on the CUE estimate among different models10. Synthesis based on observations has shown that the natural variation in soil microbial CUE is larger than aquatic, coastal and estuarine ecosystems11. Thus, a better understanding of the microbial CUE variability in the soil is critical for improving the simulation accuracy of the microbial-explicit SOC models.
Because CUE represents the ratio of growth to assimilation rates, differences in the temperature sensitivity of these two components causes the variations in CUE as a function of temperature change. Generally, respiration increases more than growth as a function of temperature, so CUE tends to decrease with temperature in both soil and aquatic systems6,12–17. This pattern has already been represented in many microbial-explicit SOC models as a linear temperature sensitivity function5,9,10,18–20:
= + –CUE CUE m T T( ) (1)0 0
where CUE0 is the CUE at reference temperature, m is the temperature response coefficient (i.e., the change in CUE per °C temperature change) and T0 is the reference temperature (usually set as 20 °C). However, the
1Zhejiang tiantong forest ecosystem national Observation and Research Station, center for Global change and ecological forecasting, School of ecological and environmental Sciences, east china normal University, Shanghai, 200062, China. 2Center for Ecosystem Science and Society, Northern Arizona University, Arizona, Flagstaff, AZ, 86011, USA. Correspondence and requests for materials should be addressed to L.Y. (email: [email protected]) or J.X. (email: [email protected])
Received: 9 August 2018
Accepted: 25 March 2019
Published: xx xx xxxx
opeN
2Scientific RepoRts | (2019) 9:5621 | https://doi.org/10.1038/s41598-019-42145-6
www.nature.com/scientificreportswww.nature.com/scientificreports/
parameters in this equation are usually determined from a few observations or experiments9,18. Thus, it remains unclear whether the parameters of the Eq. (1) can be well constrained by the observations of CUE at the global scale.
In contrast to temperature, substrate quality and accessibility are other key factors which affect the soil micro-bial CUE11,21. As summarized by Manzoni et al.11, substrate quality regulates CUE variation through two different approaches. First, substrates with different chemical structures have to undergo different metabolic pathways to be completely decomposed. For example, substrates consist of more degradable compounds such as carbohy-drates and protein could result in higher CUE than those contains more recalcitrant compounds, e.g., aliphatic, aromatic and lignin11,22–25. Second, microbial CUE is higher for the C substrate with a high degree of reduction (γS), i.e., a measure of the chemical energy per unit mole of C11,22,26,27. The value of γS ranges from 1 (e.g., oxa-late) to 8 (e.g., methane) and is approximately equal to 4.2 in the microbial biomass11,27. Hence, the microbial CUE is mainly limited by energy when the γS of substrate is <4.2, but reaches the maximum for substrates with γS > 4.211,27. Both of these two approaches highlight that substrate quality is critical in affecting the microbial CUE variability in the soil. Besides the substrate quality, microbial growth is strongly related to the substrate accessibil-ity which is collectively affected by environmental and soil conditions such as water availability28 and aggregates29.
The objective of this study is to examine the impacts of temperature and substrate type on soil microbial CUE based on observations at the global scale. A data-assimilation approach based on the Markov chain Monte Carlo (MCMC) technique is applied to constrain the parameters in the Eq. (1). Specifically, the aims of this study are to: ① constrain the key parameters in the Eq. (1) based on observations; and ② explore the dependence of soil microbial CUE upon substrate type.
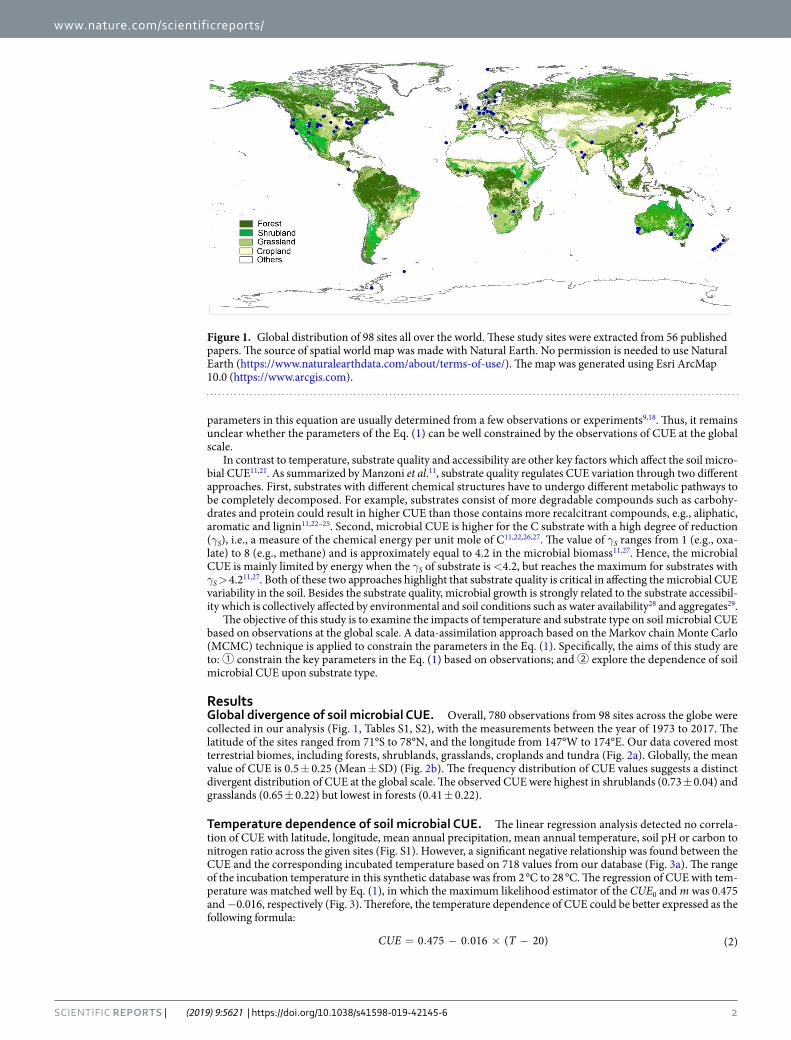
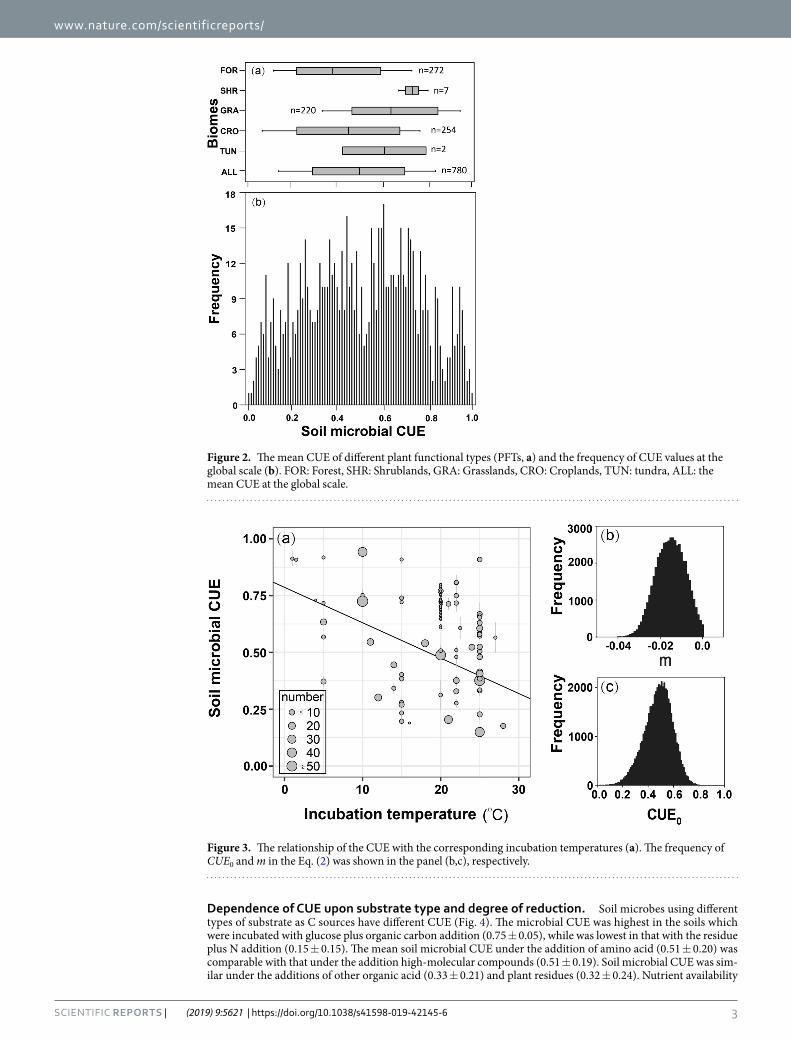
ResultsGlobal divergence of soil microbial CUE. Overall, 780 observations from 98 sites across the globe were collected in our analysis (Fig. 1, Tables S1, S2), with the measurements between the year of 1973 to 2017. The latitude of the sites ranged from 71°S to 78°N, and the longitude from 147°W to 174°E. Our data covered most terrestrial biomes, including forests, shrublands, grasslands, croplands and tundra (Fig. 2a). Globally, the mean value of CUE is 0.5 ± 0.25 (Mean ± SD) (Fig. 2b). The frequency distribution of CUE values suggests a distinct divergent distribution of CUE at the global scale. The observed CUE were highest in shrublands (0.73 ± 0.04) and grasslands (0.65 ± 0.22) but lowest in forests (0.41 ± 0.22).
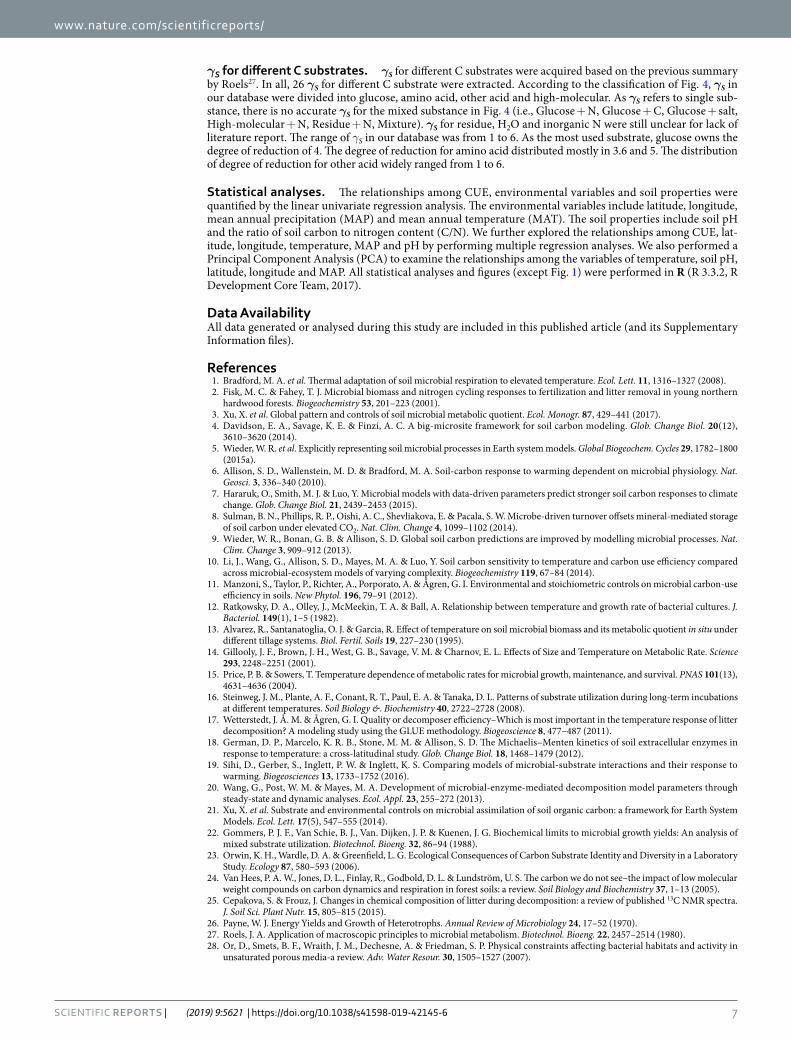
Temperature dependence of soil microbial CUE. The linear regression analysis detected no correla-tion of CUE with latitude, longitude, mean annual precipitation, mean annual temperature, soil pH or carbon to nitrogen ratio across the given sites (Fig. S1). However, a significant negative relationship was found between the CUE and the corresponding incubated temperature based on 718 values from our database (Fig. 3a). The range of the incubation temperature in this synthetic database was from 2 °C to 28 °C. The regression of CUE with tem-perature was matched well by Eq. (1), in which the maximum likelihood estimator of the CUE0 and m was 0.475 and −0.016, respectively (Fig. 3). Therefore, the temperature dependence of CUE could be better expressed as the following formula:
= . − . × −CUE T0 475 0 016 ( 20) (2)
Figure 1. Global distribution of 98 sites all over the world. These study sites were extracted from 56 published papers. The source of spatial world map was made with Natural Earth. No permission is needed to use Natural Earth (https://www.naturalearthdata.com/about/terms-of-use/). The map was generated using Esri ArcMap 10.0 (https://www.arcgis.com).
3Scientific RepoRts | (2019) 9:5621 | https://doi.org/10.1038/s41598-019-42145-6
www.nature.com/scientificreportswww.nature.com/scientificreports/
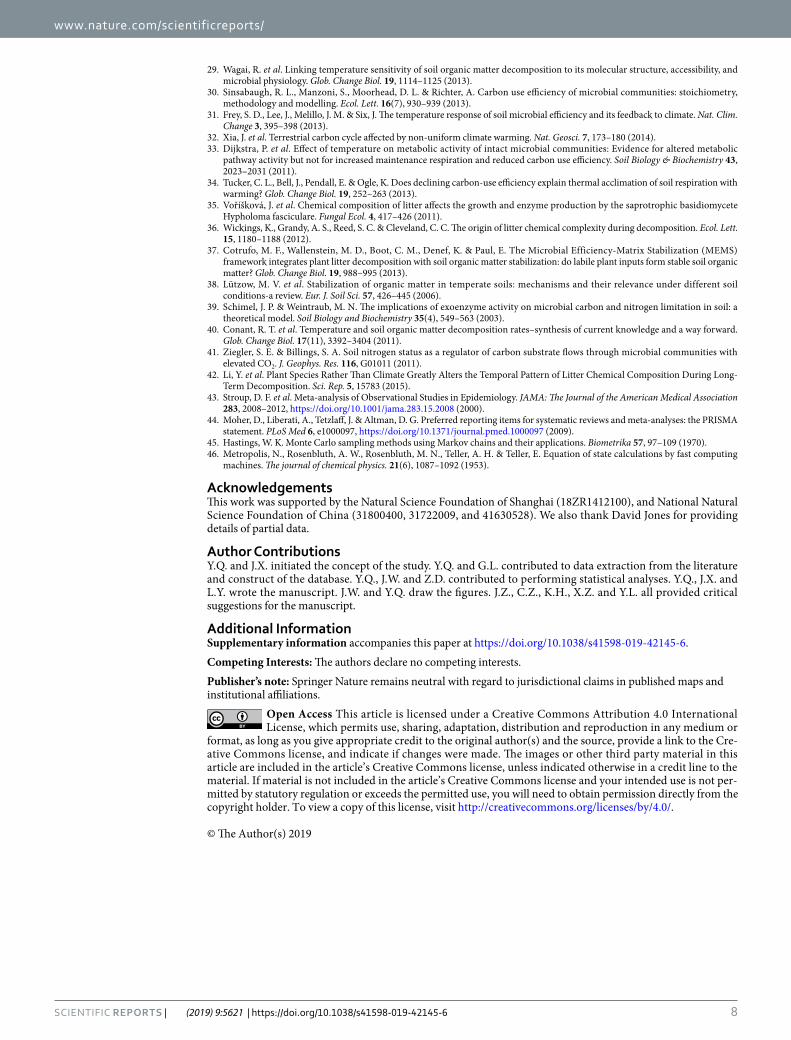
Dependence of CUE upon substrate type and degree of reduction. Soil microbes using different types of substrate as C sources have different CUE (Fig. 4). The microbial CUE was highest in the soils which were incubated with glucose plus organic carbon addition (0.75 ± 0.05), while was lowest in that with the residue plus N addition (0.15 ± 0.15). The mean soil microbial CUE under the addition of amino acid (0.51 ± 0.20) was comparable with that under the addition high-molecular compounds (0.51 ± 0.19). Soil microbial CUE was sim-ilar under the additions of other organic acid (0.33 ± 0.21) and plant residues (0.32 ± 0.24). Nutrient availability
Figure 2. The mean CUE of different plant functional types (PFTs, a) and the frequency of CUE values at the global scale (b). FOR: Forest, SHR: Shrublands, GRA: Grasslands, CRO: Croplands, TUN: tundra, ALL: the mean CUE at the global scale.
Figure 3. The relationship of the CUE with the corresponding incubation temperatures (a). The frequency of CUE0 and m in the Eq. (2) was shown in the panel (b,c), respectively.

4Scientific RepoRts | (2019) 9:5621 | https://doi.org/10.1038/s41598-019-42145-6
www.nature.com/scientificreportswww.nature.com/scientificreports/
plays an important role in regulating microbial CUE. For example, the microbial CUE was high in soils which were incubated with glucose plus N solution (0.60 ± 0.16) or mixed inorganic solution (0.41 ± 0.17). However, for those soils with glucose addition, no positive impact of N addition on microbial CUE was detected. On the contrary, adding N lead to 51% and 53% declines of CUE under the incubation of high-molecular compounds and plant residue, respectively (Fig. 4). Based on the 462 observations of CUE with according substrate type, soil microbial CUE also varied with the γS of different substrate (Turkey test, P < 0.05; Fig. 5).
DiscussionSoil microbial CUE is a commonly used parameter to quantify how soil carbon (C) is partitioned between micro-bial growth and respiration. The global mean CUE in our analysis (0.5) is comparable to the result of a former data-analysis across the world, where soil CUE was about 0.5511. These values are close to the thermodynamic
Figure 4. The mean CUE of main five different substrate types. (1) The substrate of glucose including glucose, sugar with inorganic N (glucose + N), glucose with other organic C (glucose + C), and glucose with inorganic salt (glucose + salt); (2) the substrate of organic acid dividing into amino acid and other acid; (3) The substrate of high-molecular including high-molecular substrate (protein, cellulose, cellobiose, plant cell walls, microbial cell walls, tri-palmitoyl-glycerol synthesis, polyhydroxybutyrate synthesis), high-molecular with inorganic N (high-molecular + N); (4) the substrate of plant residue including plant residue (a whole plant residue or plant parts (roots, leaves, stems)), plant residue with inorganic N (residue + N); (5) inorganic substrate dividing into H2O, inorganic N and the mixture.
Figure 5. The relationship of CUE with the degree of reduction for corresponding substrate (γs). Different lowercase letters represent significant difference among different substrate types (Turkey test, P < 0.05).

5Scientific RepoRts | (2019) 9:5621 | https://doi.org/10.1038/s41598-019-42145-6
www.nature.com/scientificreportswww.nature.com/scientificreports/
maximum of metabolic efficiency (0.6)26,27, but is much higher than the CUE value of 0.3, which has been rec-ommended for large-scale models by Sinsabaugh et al.30. Furthermore, the global divergence of microbial CUE with a wide range (i.e., 0.002 to 0.993) in our analysis implies that a constant CUE in biogeochemical models is inappropriate. For example, the mean CUE of soil microbes in the shrublands (0.73) is much higher than that in grasslands (0.65) or forests (0.41). The great variability of CUE at global and ecosystem-level scale emphasizes the importance of understanding the mechanisms underlying the microbial CUE variation.
Several recent modelling studies have used the Eq. (1) to simulate the variation of microbial CUE5,31. Among these models, however, the CUE0 is not identical and the parameter m ranges largely from -0.016 to 010,18. In this study, we recommend an equation of CUE = 0.475 − 0.016 × (T − 20) by assimilating the observations to the Eq. (1) with the Markov chain Monte Carlo (MCMC) technique. The temperature response coefficient m in this formula is not 0 as in some previous studies10,18. Thus, the CUE is not a constant value but must changes with temperature in biogeochemical models according to this amended function. Because the rate of climate warming is faster at high than low latitudes32, the CUE could reduce quicker in cold than warm regions. Thus, it remains unclear how future soil C cycling in global land models will be affected if they incorporate the temperature dependent of CUE. However, it should be noted that numerous studies have shown a lack of temperature effect on CUE in the short term33 and a weakening temperature dependence of CUE with thermal acclimation31,34. Besides, the equation of CUE we recommend (i.e., CUE = 0.475 − 0.016 × (T − 20)) might not perfectly reflect the CUE value without considering other environmental factors. We further explored the CUE equation with including other environmental factors (i.e., Latitude, Substrate type, Longitude, MAP, and pH) through the multiple the stepwise regression analysis. Based on the results of multiple stepwise regression analysis (Table S3), we provided the CUE formula with all environmental factors (i.e., Temperature, Latitude, Substrate type, Longitude, MAP, and pH) included:
= . − . × − + . × − . ×− . × + . × + . × .
T Glucose LatitudeLongitude MAP pH
CUE 0 319 0 025 ( 20) 0 172 0 0060 001 0 0002 0 032
The selection of glucose rather than other types of C substrate suggests that glucose has a large impact on the global variation of measured CUE. We further compared the two fitted equations between data of two substrate categories (i.e., glucose and others) (Table S4). We found that the CUE0 was higher with adding glucose (0.491) than other types of substrate (0.319). This study also found that latitude is another important factor influencing microbial CUE. The percentage contribution of latitude reaches 22.31% when all factors (Latitude, Longitude, Temperature, Substrate type, MAP, pH) are included in the multiple stepwise regression analysis for explaining the CUE variation (Fig. 6), though there is no significant relationship between latitude and CUE in the univar-iate regression analysis (Fig. S1(a)). We also assessed all the environmental factors (i.e., Latitude, Longitude, Temperature, MAP, and pH) with a Principal Component Analysis (PCA) (Fig. S2).
Numerous laboratory studies and field investigations have found strong dependence of CUE upon substrate type and nutrient condition35–37. In this study, the soil microbes have higher CUE with the easily degradable (such as glucose, amino acid and high-molecular organic matter) than the recalcitrant (plant residues) substrates (Fig. 4). This could be due to the greater activation energies are consumed for enzyme production and excretion during the decomposition of the recalcitrant than easily degradable compounds11. Another potential mechanism is that the substrate accessibility of plant residues is lower than others, e.g., glucose, because of the occlusion of organic matters by aggregation38. Increasing nutrient availability is assumed to enhance microbial CUE mainly because of its negative effect on microbial respiration39–41. This assumption is partially supported by our analysis, which shows greater CUE after adding inorganic N or mixed inorganic solution than only adding water (Fig. 4). However, adding N leads to no changes and even reductions of microbial CUE in the soils which were incubated with glucose and high-molecular compounds or plant residue, respectively. The variation of microbial CUE also depends on the γS of different substrate. Our study also suggests that more degradable compounds (such as glu-cose) with high γS owns higher microbial CUE than the recalcitrant compounds (such as oxalate) with low γS (Figs 4 and 5). Also, because the chemical compound of litter differs greatly among plant species42, the substrate
Figure 6. Relative influence of single factor (Latitude, Longitude, Temperature, Substrate type, MAP, pH) on CUE based on multiple stepwise regression analysis.

6Scientific RepoRts | (2019) 9:5621 | https://doi.org/10.1038/s41598-019-42145-6
www.nature.com/scientificreportswww.nature.com/scientificreports/
type must be considered to estimate the soil microbial CUE in different regions of the globe. Thus, more research efforts are still needed to explore the differences in substrate type among vegetation types and their roles in regu-lating the dynamics of soil microbial CUE.
In summary, this study used a data assimilation approach to constrain the temperature dependence of soil microbial CUE based on the existing observations at the global scale. The observed CUE shows a diver-gent distribution globally, suggesting that the parameterization of CUE is still one key challenge for the microbial-explicit soil C models. We recommend to use the constraint parameters in the Eq. (2) (i.e., CUE = 0.475 − 0.016 × (T − 20)) if soil microbial CUE is used in future global land models. However, it should be noted that tremendous additional efforts are still needed before we can correctly simulate the variations of microbial CUE in the soil. For example, as shown in this study, it is clear that the type of substrate (especially glucose) affects the simulation of soil microbial CUE. Besides, the random sampling of data has been one major challenge for almost all meta-analysis studies, because the observations of almost all variables are distributed in three hotspot regions (i.e., North America, West Europe, and China). In our study, most observations were from forest, grassland and cropland. So the data set cannot perfectly represent the distributions of global biome type and soil community in the real Earth system. We also call for more observations in other biomes such as shrubland, tundra and desert. Overall, this study highlights that the predictive ability of microbial-explicit soil C models can be enhanced by an improved understanding on the impacts of temperature and substrate type on microbial CUE.
MethodsData collection. Peer-reviewed literatures related to soil microbial CUE published before July 2017 were searched using the Web of Science, according to the PRISMA (preferred reporting items for systematic reviews and meta-analyses) guidelines43,44 (Fig. S3). There are different methods to quantify the soil microbial CUE, so the selected studies must directly have reported the CUE or provided at least one of the following information: (1) microbial C uptake and substrate C consumption; (2) microbial C uptake and cumulative C respiration; and (3) microbial C uptake, respiration rate and the length of experiment time. The following Eqs (3–5) in this study has shown the methods for CUE calculation based on these data. Ancillary information such as latitude, longitude, mean annual temperature, mean annual precipitation, pH, C:N ratios, and substrate type were also extracted from the papers or cited papers or, in the case that it was not reported, extracted from the database at http://www.worldclim.org/ using the location information (e.g., latitude and longitude).
Methods for data conversion. Soil microbial CUE was not directly reported but can be calculated based on its definition in many literatures. If one study reported the microbial C accumulation (ΔMBC) and the C sub-strate consumption (ΔCsubstrate), then the CUE can be calculated as:
=Δ
ΔCCUE MBC
(3)substrate
If both the microbial C accumulation (ΔMBC) and cumulative microbial respiration (Rcumulative) were reported, we calculated the CUE by using the following formula:
=Δ
Δ +CUE MBC
MBC R (4)cumulative
In some studies, the cumulative microbial respiration can be obtained from the rate of respiration (R) over a given incubation time (t), so the CUE was calculated as:
=Δ
Δ + ×CUE MBC
MBC R t (5)
Bayesian framework to determine CUE dependence on temperature. The Eq. (1) commonly rep-resents the temperature dependence of CUE in most microbial-explicit SOC models5,9,18. The parameterization of the Eq. (1) (i.e., CUE0 and m) is usually arbitrary in soil enzyme driven models. For example, the CUE0 has been fixed as 0.31, 0.5 or 0.63 and parameter m ranges from −0.016 to 0 in previous studies10,18. This study employed the Bayesian probability inversion and a Markov chain Monte Carlo (MCMC) technique to evaluate the CUE0 and m. To get the maximum likelihood estimators of the CUE0 and m, we specified them as the uniform distri-bution over a set of intervals, which were set as (0, 1) and (−0.1, 0), respectively. The collected CUE values and the corresponding incubation temperatures were used as inversing data to constrain the two parameters. We formally made five parallel runs using the Metropolis-Hastings (M-H) algorithm45,46 as the MCMC sampler with 100,000 simulations for each run. Each run started from a random initial point in their respective parameter intervals to eliminate the effect of the initial condition on stochastic sampling. The acceptance rates for the five runs ranged from 5% to 10% which tested by the Gelman-Rubin (G-R) diagnostic method. The initial samples (approximately 1,000 for each run) were discarded after the running means and standard deviations (SDs) were stabilized (regarded as the burn-in period). All the accepted samples from five runs after the burn-in periods (approximately 20,000 samples in total) were used to construct maximum likelihood estimators of both the CUE0 and m (inset of Fig. 3). The evaluation of CUE0 and m were conducted with MATLAB 2016b (The Mathworks, Natick, MA, USA).
7Scientific RepoRts | (2019) 9:5621 | https://doi.org/10.1038/s41598-019-42145-6
www.nature.com/scientificreportswww.nature.com/scientificreports/
γS for different C substrates. γS for different C substrates were acquired based on the previous summary by Roels27. In all, 26 γS for different C substrate were extracted. According to the classification of Fig. 4, γS in our database were divided into glucose, amino acid, other acid and high-molecular. As γS refers to single sub-stance, there is no accurate γS for the mixed substance in Fig. 4 (i.e., Glucose + N, Glucose + C, Glucose + salt, High-molecular + N, Residue + N, Mixture). γS for residue, H2O and inorganic N were still unclear for lack of literature report. The range of γS in our database was from 1 to 6. As the most used substrate, glucose owns the degree of reduction of 4. The degree of reduction for amino acid distributed mostly in 3.6 and 5. The distribution of degree of reduction for other acid widely ranged from 1 to 6.
Statistical analyses. The relationships among CUE, environmental variables and soil properties were quantified by the linear univariate regression analysis. The environmental variables include latitude, longitude, mean annual precipitation (MAP) and mean annual temperature (MAT). The soil properties include soil pH and the ratio of soil carbon to nitrogen content (C/N). We further explored the relationships among CUE, lat-itude, longitude, temperature, MAP and pH by performing multiple regression analyses. We also performed a Principal Component Analysis (PCA) to examine the relationships among the variables of temperature, soil pH, latitude, longitude and MAP. All statistical analyses and figures (except Fig. 1) were performed in R (R 3.3.2, R Development Core Team, 2017).
Data AvailabilityAll data generated or analysed during this study are included in this published article (and its Supplementary Information files).
References 1. Bradford, M. A. et al. Thermal adaptation of soil microbial respiration to elevated temperature. Ecol. Lett. 11, 1316–1327 (2008). 2. Fisk, M. C. & Fahey, T. J. Microbial biomass and nitrogen cycling responses to fertilization and litter removal in young northern
hardwood forests. Biogeochemistry 53, 201–223 (2001). 3. Xu, X. et al. Global pattern and controls of soil microbial metabolic quotient. Ecol. Monogr. 87, 429–441 (2017). 4. Davidson, E. A., Savage, K. E. & Finzi, A. C. A big-microsite framework for soil carbon modeling. Glob. Change Biol. 20(12),
3610–3620 (2014). 5. Wieder, W. R. et al. Explicitly representing soil microbial processes in Earth system models. Global Biogeochem. Cycles 29, 1782–1800
(2015a). 6. Allison, S. D., Wallenstein, M. D. & Bradford, M. A. Soil-carbon response to warming dependent on microbial physiology. Nat.
Geosci. 3, 336–340 (2010). 7. Hararuk, O., Smith, M. J. & Luo, Y. Microbial models with data‐driven parameters predict stronger soil carbon responses to climate
change. Glob. Change Biol. 21, 2439–2453 (2015). 8. Sulman, B. N., Phillips, R. P., Oishi, A. C., Shevliakova, E. & Pacala, S. W. Microbe-driven turnover offsets mineral-mediated storage
of soil carbon under elevated CO2. Nat. Clim. Change 4, 1099–1102 (2014). 9. Wieder, W. R., Bonan, G. B. & Allison, S. D. Global soil carbon predictions are improved by modelling microbial processes. Nat.
Clim. Change 3, 909–912 (2013). 10. Li, J., Wang, G., Allison, S. D., Mayes, M. A. & Luo, Y. Soil carbon sensitivity to temperature and carbon use efficiency compared
across microbial-ecosystem models of varying complexity. Biogeochemistry 119, 67–84 (2014). 11. Manzoni, S., Taylor, P., Richter, A., Porporato, A. & Ågren, G. I. Environmental and stoichiometric controls on microbial carbon-use
efficiency in soils. New Phytol. 196, 79–91 (2012). 12. Ratkowsky, D. A., Olley, J., McMeekin, T. A. & Ball, A. Relationship between temperature and growth rate of bacterial cultures. J.
Bacteriol. 149(1), 1–5 (1982). 13. Alvarez, R., Santanatoglia, O. J. & Garcia, R. Effect of temperature on soil microbial biomass and its metabolic quotient in situ under
different tillage systems. Biol. Fertil. Soils 19, 227–230 (1995). 14. Gillooly, J. F., Brown, J. H., West, G. B., Savage, V. M. & Charnov, E. L. Effects of Size and Temperature on Metabolic Rate. Science
293, 2248–2251 (2001). 15. Price, P. B. & Sowers, T. Temperature dependence of metabolic rates for microbial growth, maintenance, and survival. PNAS 101(13),
4631–4636 (2004). 16. Steinweg, J. M., Plante, A. F., Conant, R. T., Paul, E. A. & Tanaka, D. L. Patterns of substrate utilization during long-term incubations
at different temperatures. Soil Biology &. Biochemistry 40, 2722–2728 (2008). 17. Wetterstedt, J. Å. M. & Ågren, G. I. Quality or decomposer efficiency–Which is most important in the temperature response of litter
decomposition? A modeling study using the GLUE methodology. Biogeoscience 8, 477–487 (2011). 18. German, D. P., Marcelo, K. R. B., Stone, M. M. & Allison, S. D. The Michaelis–Menten kinetics of soil extracellular enzymes in
response to temperature: a cross-latitudinal study. Glob. Change Biol. 18, 1468–1479 (2012). 19. Sihi, D., Gerber, S., Inglett, P. W. & Inglett, K. S. Comparing models of microbial-substrate interactions and their response to
warming. Biogeosciences 13, 1733–1752 (2016). 20. Wang, G., Post, W. M. & Mayes, M. A. Development of microbial-enzyme-mediated decomposition model parameters through
steady-state and dynamic analyses. Ecol. Appl. 23, 255–272 (2013). 21. Xu, X. et al. Substrate and environmental controls on microbial assimilation of soil organic carbon: a framework for Earth System
Models. Ecol. Lett. 17(5), 547–555 (2014). 22. Gommers, P. J. F., Van Schie, B. J., Van. Dijken, J. P. & Kuenen, J. G. Biochemical limits to microbial growth yields: An analysis of
mixed substrate utilization. Biotechnol. Bioeng. 32, 86–94 (1988). 23. Orwin, K. H., Wardle, D. A. & Greenfield, L. G. Ecological Consequences of Carbon Substrate Identity and Diversity in a Laboratory
Study. Ecology 87, 580–593 (2006). 24. Van Hees, P. A. W., Jones, D. L., Finlay, R., Godbold, D. L. & Lundström, U. S. The carbon we do not see–the impact of low molecular
weight compounds on carbon dynamics and respiration in forest soils: a review. Soil Biology and Biochemistry 37, 1–13 (2005). 25. Cepakova, S. & Frouz, J. Changes in chemical composition of litter during decomposition: a review of published 13C NMR spectra.
J. Soil Sci. Plant Nutr. 15, 805–815 (2015). 26. Payne, W. J. Energy Yields and Growth of Heterotrophs. Annual Review of Microbiology 24, 17–52 (1970). 27. Roels, J. A. Application of macroscopic principles to microbial metabolism. Biotechnol. Bioeng. 22, 2457–2514 (1980). 28. Or, D., Smets, B. F., Wraith, J. M., Dechesne, A. & Friedman, S. P. Physical constraints affecting bacterial habitats and activity in
unsaturated porous media-a review. Adv. Water Resour. 30, 1505–1527 (2007).
8Scientific RepoRts | (2019) 9:5621 | https://doi.org/10.1038/s41598-019-42145-6
www.nature.com/scientificreportswww.nature.com/scientificreports/
29. Wagai, R. et al. Linking temperature sensitivity of soil organic matter decomposition to its molecular structure, accessibility, and microbial physiology. Glob. Change Biol. 19, 1114–1125 (2013).
30. Sinsabaugh, R. L., Manzoni, S., Moorhead, D. L. & Richter, A. Carbon use efficiency of microbial communities: stoichiometry, methodology and modelling. Ecol. Lett. 16(7), 930–939 (2013).
31. Frey, S. D., Lee, J., Melillo, J. M. & Six, J. The temperature response of soil microbial efficiency and its feedback to climate. Nat. Clim. Change 3, 395–398 (2013).
32. Xia, J. et al. Terrestrial carbon cycle affected by non-uniform climate warming. Nat. Geosci. 7, 173–180 (2014). 33. Dijkstra, P. et al. Effect of temperature on metabolic activity of intact microbial communities: Evidence for altered metabolic
pathway activity but not for increased maintenance respiration and reduced carbon use efficiency. Soil Biology & Biochemistry 43, 2023–2031 (2011).
34. Tucker, C. L., Bell, J., Pendall, E. & Ogle, K. Does declining carbon-use efficiency explain thermal acclimation of soil respiration with warming? Glob. Change Biol. 19, 252–263 (2013).
35. Voříšková, J. et al. Chemical composition of litter affects the growth and enzyme production by the saprotrophic basidiomycete Hypholoma fasciculare. Fungal Ecol. 4, 417–426 (2011).
36. Wickings, K., Grandy, A. S., Reed, S. C. & Cleveland, C. C. The origin of litter chemical complexity during decomposition. Ecol. Lett. 15, 1180–1188 (2012).
37. Cotrufo, M. F., Wallenstein, M. D., Boot, C. M., Denef, K. & Paul, E. The Microbial Efficiency-Matrix Stabilization (MEMS) framework integrates plant litter decomposition with soil organic matter stabilization: do labile plant inputs form stable soil organic matter? Glob. Change Biol. 19, 988–995 (2013).
38. Lützow, M. V. et al. Stabilization of organic matter in temperate soils: mechanisms and their relevance under different soil conditions-a review. Eur. J. Soil Sci. 57, 426–445 (2006).
39. Schimel, J. P. & Weintraub, M. N. The implications of exoenzyme activity on microbial carbon and nitrogen limitation in soil: a theoretical model. Soil Biology and Biochemistry 35(4), 549–563 (2003).
40. Conant, R. T. et al. Temperature and soil organic matter decomposition rates–synthesis of current knowledge and a way forward. Glob. Change Biol. 17(11), 3392–3404 (2011).
41. Ziegler, S. E. & Billings, S. A. Soil nitrogen status as a regulator of carbon substrate flows through microbial communities with elevated CO2. J. Geophys. Res. 116, G01011 (2011).
42. Li, Y. et al. Plant Species Rather Than Climate Greatly Alters the Temporal Pattern of Litter Chemical Composition During Long-Term Decomposition. Sci. Rep. 5, 15783 (2015).
43. Stroup, D. F. et al. Meta-analysis of Observational Studies in Epidemiology. JAMA: The Journal of the American Medical Association 283, 2008–2012, https://doi.org/10.1001/jama.283.15.2008 (2000).
44. Moher, D., Liberati, A., Tetzlaff, J. & Altman, D. G. Preferred reporting items for systematic reviews and meta-analyses: the PRISMA statement. PLoS Med 6, e1000097, https://doi.org/10.1371/journal.pmed.1000097 (2009).
45. Hastings, W. K. Monte Carlo sampling methods using Markov chains and their applications. Biometrika 57, 97–109 (1970). 46. Metropolis, N., Rosenbluth, A. W., Rosenbluth, M. N., Teller, A. H. & Teller, E. Equation of state calculations by fast computing
machines. The journal of chemical physics. 21(6), 1087–1092 (1953).
AcknowledgementsThis work was supported by the Natural Science Foundation of Shanghai (18ZR1412100), and National Natural Science Foundation of China (31800400, 31722009, and 41630528). We also thank David Jones for providing details of partial data.
Author ContributionsY.Q. and J.X. initiated the concept of the study. Y.Q. and G.L. contributed to data extraction from the literature and construct of the database. Y.Q., J.W. and Z.D. contributed to performing statistical analyses. Y.Q., J.X. and L.Y. wrote the manuscript. J.W. and Y.Q. draw the figures. J.Z., C.Z., K.H., X.Z. and Y.L. all provided critical suggestions for the manuscript.
Additional InformationSupplementary information accompanies this paper at https://doi.org/10.1038/s41598-019-42145-6.Competing Interests: The authors declare no competing interests.Publisher’s note: Springer Nature remains neutral with regard to jurisdictional claims in published maps and institutional affiliations.
Open Access This article is licensed under a Creative Commons Attribution 4.0 International License, which permits use, sharing, adaptation, distribution and reproduction in any medium or
format, as long as you give appropriate credit to the original author(s) and the source, provide a link to the Cre-ative Commons license, and indicate if changes were made. The images or other third party material in this article are included in the article’s Creative Commons license, unless indicated otherwise in a credit line to the material. If material is not included in the article’s Creative Commons license and your intended use is not per-mitted by statutory regulation or exceeds the permitted use, you will need to obtain permission directly from the copyright holder. To view a copy of this license, visit http://creativecommons.org/licenses/by/4.0/. © The Author(s) 2019