global warming cause for concern. cause for concern? what is the effect of increased levels of...
TRANSCRIPT
Global Warming
Cause for Concern
Cause for Concern?
What is the effect of increased levels of carbon dioxide in the Earth’s atmosphere?
Nobody knows for sure
Cause for Concern?
Scientists are concerned for three reasons:1. Climate models predict climate change
2. There are observed changes in climate
3. Pre-historic studies show a correlation between atmospheric CO2 levels and global climate
What is Climate?
3. Cause for Concern?
Climate models
Climate Models
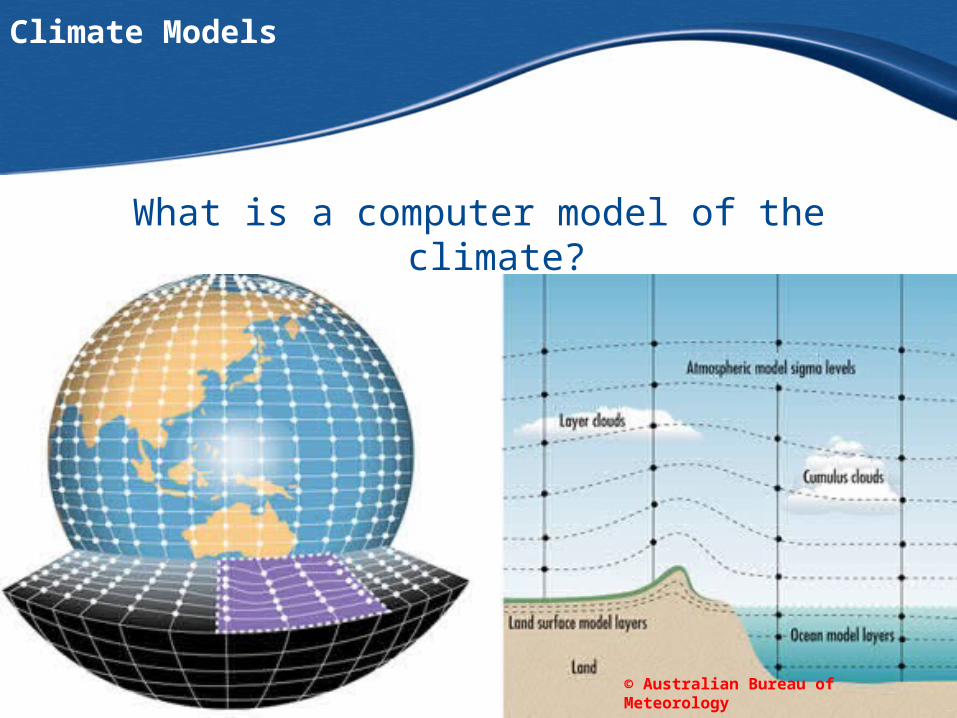
What is a computer model of the climate?
© Australian Bureau of Meteorology

Greenhouse gases (2.5 Wm-2)
Emitted IR radiation
Natural greenhouse heating
Input solar radiation (100 %)
Reflected by clouds, atmosphere (~23%)
Reflected from surface (~8%) Absorbed by
ground (~49%)
Measured absorption(25%) ~80 Wm-2 ??
Absorbed by atmosphere (20%) ~60 Wm-2
Climate Models
Climate Models
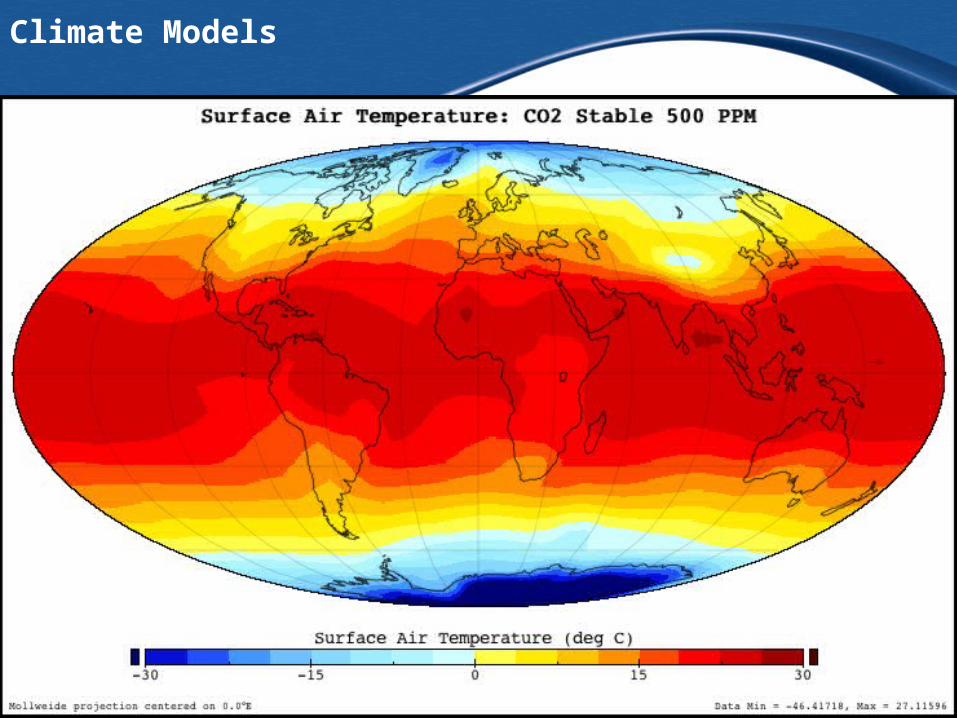
What is the output of a climate model?
Cause for Concern?
Observed Changes in Climate

Observed Changes
Average surface temperature is difficult to measure

Observed changesIt is difficult to detect small changes in a long series of data?

Observed changesBest estimates
-0.6
-0.4
-0.2
0
0.2
0.4
0.6
1860 1880 1900 1920 1940 1960 1980 2000
Ano
mal
y (o C
)
Year
Other observationsUEA December Press Release 2005
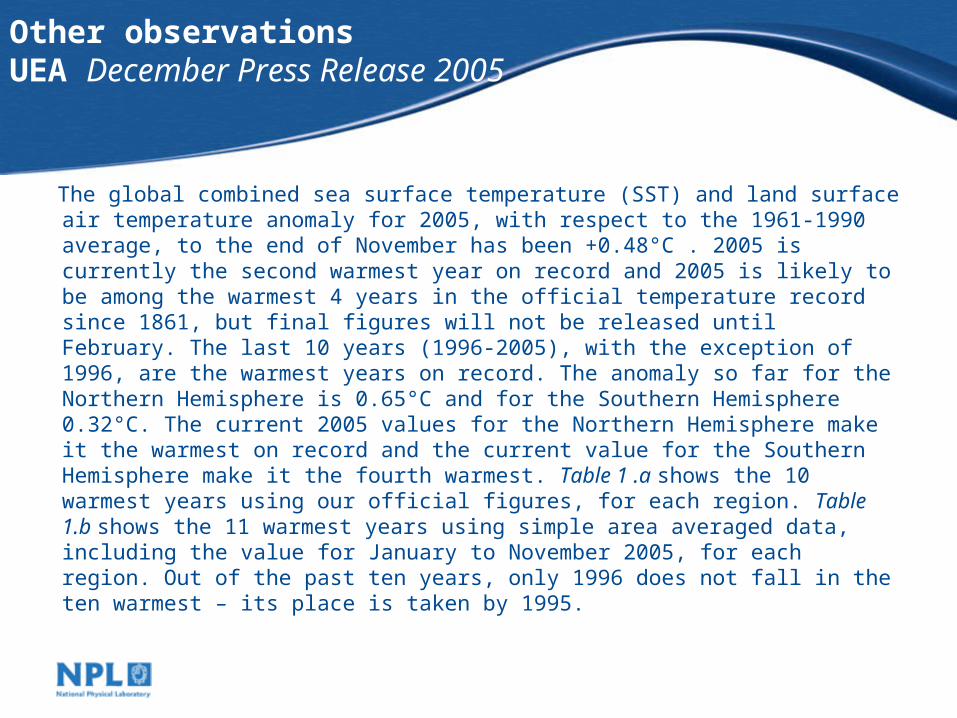
The global combined sea surface temperature (SST) and land surface air temperature anomaly for 2005, with respect to the 1961-1990 average, to the end of November has been +0.48°C . 2005 is currently the second warmest year on record and 2005 is likely to be among the warmest 4 years in the official temperature record since 1861, but final figures will not be released until February. The last 10 years (1996-2005), with the exception of 1996, are the warmest years on record. The anomaly so far for the Northern Hemisphere is 0.65°C and for the Southern Hemisphere 0.32°C. The current 2005 values for the Northern Hemisphere make it the warmest on record and the current value for the Southern Hemisphere make it the fourth warmest. Table 1 .a shows the 10 warmest years using our official figures, for each region. Table 1.b shows the 11 warmest years using simple area averaged data, including the value for January to November 2005, for each region. Out of the past ten years, only 1996 does not fall in the ten warmest – its place is taken by 1995.
Other observationsUEA December Press Release 2005
The global combined sea surface temperature (SST) and land surface air temperature anomaly for 2005, with respect to the 1961-1990 average, to the end of November has been +0.48°C . 2005 is currently the second warmest year on record and 2005 is likely to be among the warmest 4 years in the official temperature record since 1861, but final figures will not be released until February. The last 10 years (1996-2005), with the exception of 1996, are the warmest years on record. The anomaly so far for the Northern Hemisphere is 0.65°C and for the Southern Hemisphere 0.32°C. The current 2005 values for the Northern Hemisphere make it the warmest on record and the current value for the Southern Hemisphere make it the fourth warmest. Table 1 .a shows the 10 warmest years using our official figures, for each region. Table 1.b shows the 11 warmest years using simple area averaged data, including the value for January to November 2005, for each region. Out of the past ten years, only 1996 does not fall in the ten warmest – its place is taken by 1995.

Other observationsUEA December Press Release 2005

Other observations
• Germany

Other observations
• Argentina

Cause for Concern?
Prehistoric Studies

Pre-Historic studiesBubbles in Artic Ice
0
50
100
150
200
250
300
350
400
050100150200250300350400
CO
2 (p
pmv)
Thousands of years before the present
Minimum Value
180 ppm
Maximum Value
300 ppm
Ice Ages
0
50
100
150
200
250
300
350
400
1700 1750 1800 1850 1900 1950 2000
CO
2 Con
cent
ratio
n (P
PM
)
Year
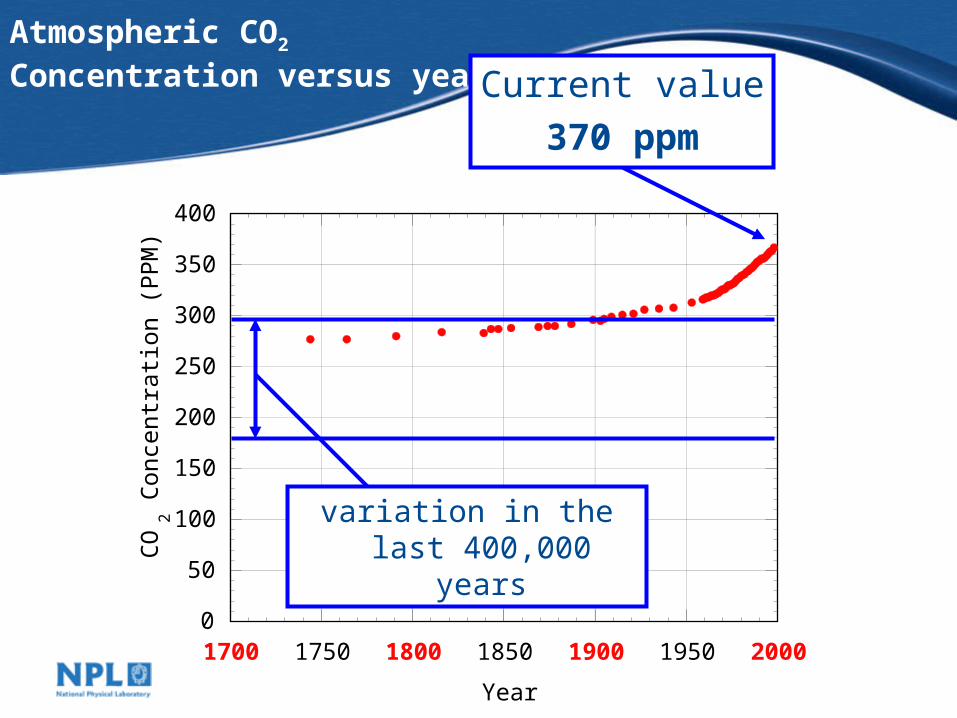
Atmospheric CO2 Concentration versus year Current value
370 ppm
variation in the last 400,000 years
Causes for concern
• Climate models • Observed changes • Pre-historic climate studies
Carbon dioxide
Can we be completely sure that the climate changes we observe are caused by
anthropogenic emissions of carbon dioxide?
But it is likely:
Not completely sure
Climate ModelsPredictions
What do climate models lead us to expect?

Climate ModelsWhat is the current effect of CO2
• A net extra ‘forcing’ of around 2 watts per square metre…
Average 240 W/m2
On Average 390 W/m2
150 W/m2
Average240 W/m2
+ 2 W/m2
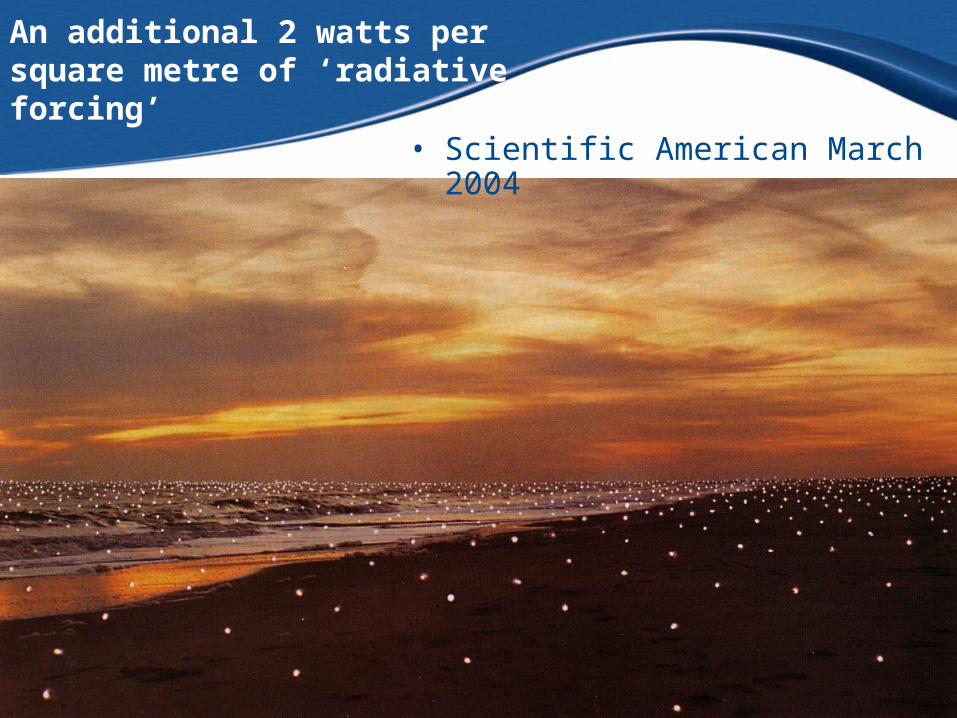
An additional 2 watts per square metre of ‘radiative forcing’
• Scientific American March 2004
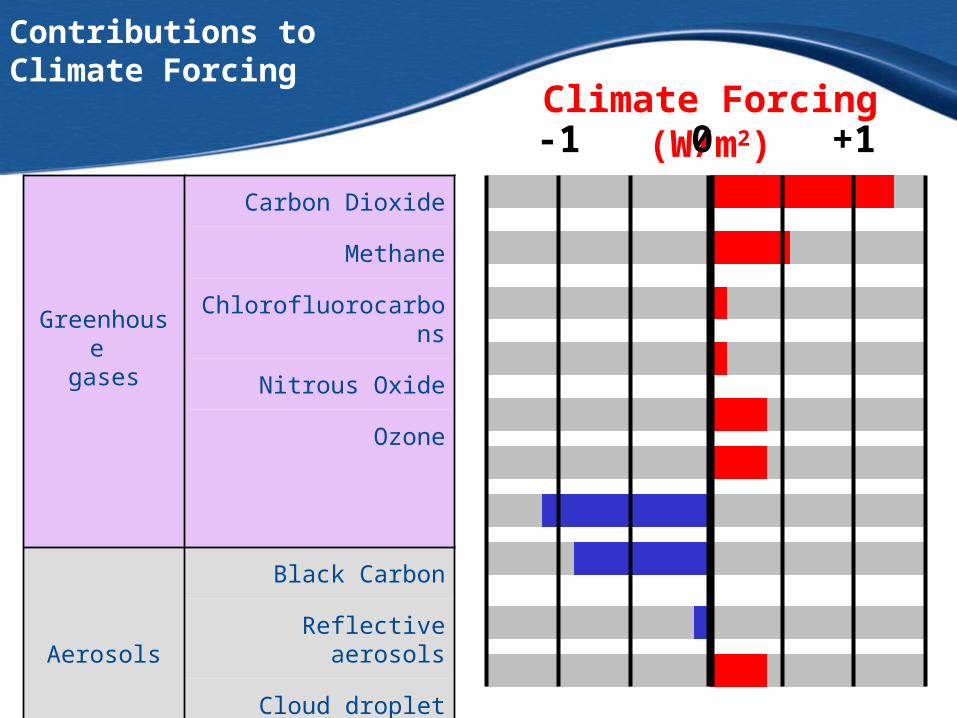
Contributions toClimate Forcing
Greenhouse gases
Carbon Dioxide
Methane
Chlorofluorocarbons
Nitrous Oxide
Ozone
Aerosols
Black Carbon
Reflective aerosols
Cloud droplet changes
Land cover changes
Sun
Climate Forcing (W/m2)0 +1-1
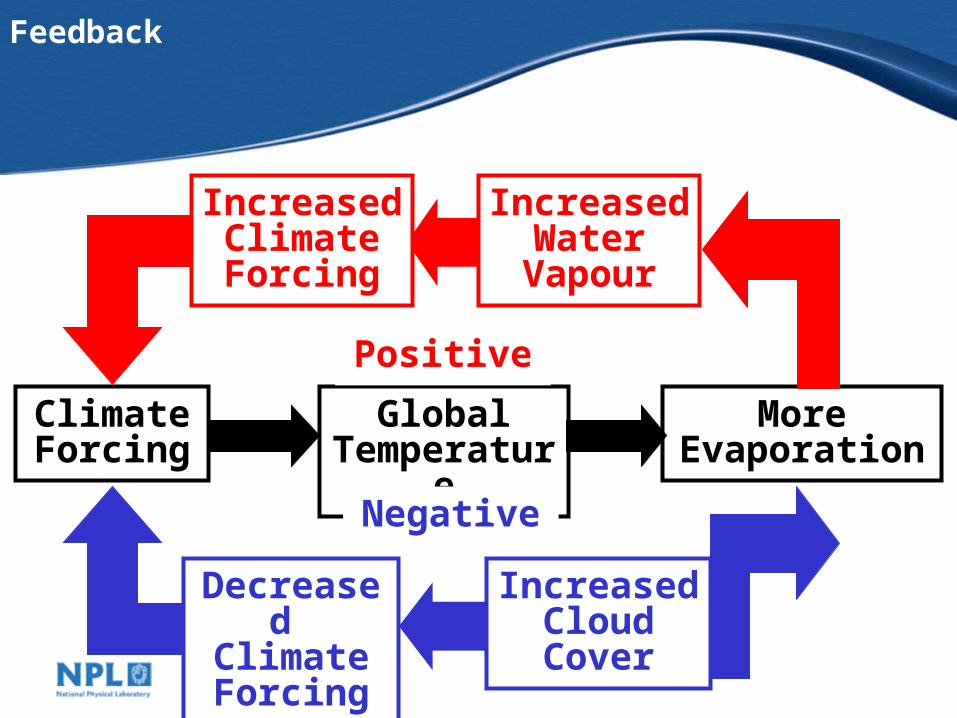
Feedback
GlobalTemperature
More Evaporation
Climate Forcing
Increased Climate Forcing
Increased Water
Vapour
Increased Cloud Cover
Decreased Climate Forcing
Negative
Positive
The Future…
CO2 levels will rise
• Very roughly,– If we make a 50% cut in GLOBAL emissions
– CO2 will stabilise at twice historical levels
• Probably the best we can hope for in the next century.
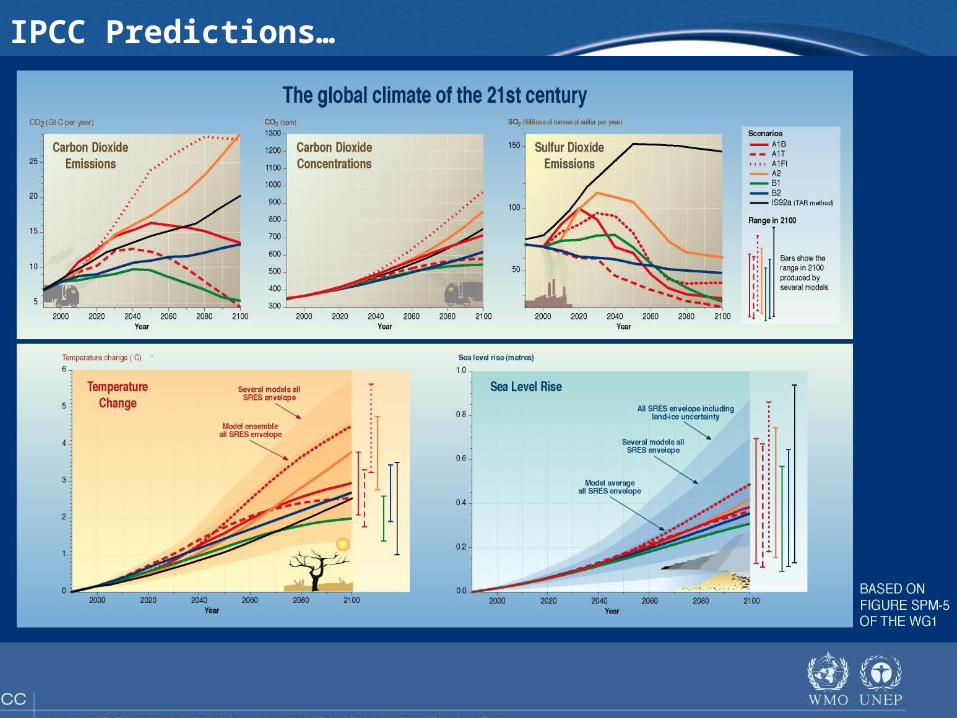
IPCC Predictions…