global warming, commitment to the kyoto protocol, and accounting disclosures by the largest global...
TRANSCRIPT

40 (2005) 215–232
Global warming, commitment to the Kyoto protocol,
and accounting disclosures by the largest global
public firms from polluting industries
Martin Freedman a,*, Bikki Jaggi b,1
aDepartment of Accounting, College of Business and Economics, Towson University, 8000 York Rd.,
Towson, MD 21252, USAbDepartment of Accounting, School of Business, Rutgers University-New Brunswick, 94 Rockefeller Rd.,
Piscataway, NJ 08854-8054, USA
Abstract
This study evaluates disclosures on pollution and greenhouse gases by firms domiciled in
countries that have ratified the Kyoto Protocol compared to others. The study is based on disclosures
made in the annual reports, environmental reports, and websites of 120 of the largest (in terms of
revenues) public firms from the chemical, oil and gas, energy, and motor vehicles and casualty
insurance industries. The study uses content analysis to construct weighted and unweighted
disclosure indices.
The results show that firms from countries that ratified the Protocol have higher disclosure
indexes as compared to firms in other countries. Additionally, larger firms disclose more detailed
pollution information. Multinational firms that operate in countries that ratified the Protocol but have
their home offices in countries that did not are associated with lower disclosures. This lack of
consistency in disclosure is not likely to be helpful in informing shareholders about the social
responsibility of their investments.
D 2005 University of Illinois. All rights reserved.
Keywords: Kyoto Protocol; Greenhouse gas emissions; Environmental accounting; Global warming; Social
accounting; Environmental disclosure
0020-7063/$3
doi:10.1016/j.
* Correspon
E-mail add1 Tel.: +1 73
The International Journal of Accounting
0.00 D 2005 University of Illinois. All rights reserved.
intacc.2005.06.004
ding author. Tel.: +1 410 704 4143.
resses: [email protected] (M. Freedman), [email protected] (B. Jaggi).
2 445 3539.

M. Freedman, B. Jaggi / The International Journal of Accounting 40 (2005) 215–232216
1. Introduction
With Russia’s ratification of the Kyoto Protocol (hereafter, referred to as the Protocol) in
2004, the Protocol went into effect in February 2005. There are still nine nations (including
the United States, Switzerland, and Australia) that are resisting ratification of the Protocol.
Countries that ratify the Protocol are obligated to enact regulations incorporating the
Protocol’s provisions on disclosures related to greenhouse gases, i.e., carbon dioxide,
methane, and nitrous oxides. A key aspect of this Protocol is that greenhouse gases emitted
by vehicles, power plants, and certain types of industrial operations need to be brought to
acceptable levels in order to control their global warming effect.
In this paper, we evaluate whether firms from industries that are severely impacted by the
Protocol are disclosing information related to the emission of greenhouse gases and how
these firms plan to reduce these emissions to the desired levels. We conduct a comparative
analysis of the greenhouse gas disclosures made by large firms, generally multinationals,
from countries that have ratified the Protocol against disclosures by firms from countries that
did not ratify the Protocol but are operating in the ratifying countries.
Multinational firms from countries ratifying the Protocol are expected to be more
forthcoming in making detailed disclosures on their greenhouse gas emissions and on their
plans to meet the Protocol requirements because they would be evaluated on how well
they meet their country’s disclosure requirements. Thus, they would have an incentive to
keep their investors better informed on their pollution performance. On the other hand,
non-ratifying foreign multinationals operating in countries ratifying the Protocol would be
likely to take advantage of the unsettled political situation and meet only the minimum
disclosure requirements. We conjecture that disclosure policies of these firms are more
influenced by the regulations of their home country rather than by the country in which
they operate. Our expectation is that firms from countries ratifying the Protocol make
significantly more disclosures about their plans to deal with the problem of greenhouse gas
emissions compared to firms from countries that have not ratified the Protocol but are
operating in the Protocol ratifying countries.
In addition to comparing the Protocol-related total pollution disclosures of firms from the
Protocol ratifying and non-ratifying countries, we also evaluate the disclosures on carbon
dioxide emissions (CO2) that are especially emphasized by the Protocol. In particular, we
examine whether the association between CO2 emissions and pollution disclosures is
stronger for multinationals from the Protocol ratifying countries compared to other
multinationals. Furthermore, we evaluate the impact of firm-specific factors (e.g., return
on assets, firm size, and debt–equity structure) on pollution disclosures because these factors
may have significant influence on disclosure-related managerial decisions.
The analyses are based on the greenhouse gas disclosures included in the annual reports
from 2000 through 2002, environmental reports, and websites of the 120 largest (in terms
of revenues) public companies in the world belonging to the chemical, oil and gas, energy,
and motor vehicle and casualty insurance industries. We use content analysis to develop
the disclosure index and conduct regression analyses to evaluate the association between
the disclosure index and an indicator variable for the firms from Protocol ratifying and
non-ratifying countries. The analyses are conducted by controlling for the impact of the
legal system and the regulatory enforcement level of a country as well as for industry and

M. Freedman, B. Jaggi / The International Journal of Accounting 40 (2005) 215–232 217
country effects on the association between the disclosure index and the independent test
variables.
The results indicate that there is a significantly positive association between the
disclosure index and firms from countries ratifying the Protocol. This finding confirms the
expectation that the firms from Protocol ratifying countries are more forthcoming in
making disclosures on greenhouse gas pollution emissions and their detailed plans to deal
with the global warming problem. The CO2 emission disclosures are especially higher for
firms from the Protocol ratifying countries. These firms are motivated to keep their
shareholders informed about their efforts to meet the Protocol’s guidelines and to provide
higher disclosures. On the other hand, firms from countries that have not ratified the
Protocol do not disclose detailed information on global warming even though they operate
in the Protocol ratifying countries.
The results with regard to the firm-specific characteristics show that the greenhouse
pollution disclosures are positively associated with firm size; larger firms are making more
extensive disclosures compared to smaller firms. The coefficients on ROA (return on assets)
and debt / equity show no significant impact of these characteristics on the greenhouse
pollution disclosures. We also detect no significant difference in the disclosures among the
firms belonging to the different industry groups covered in the study.
The remainder of the paper is organized as follows: In part two, we provide background
and the theoretical rationale for the study. The research design, including sample selection,
data collection, hypotheses, and research methodology, is discussed in part three. The
results are presented in part four, and the conclusion is contained in part five.
2. Background and rationale for pollution disclosures
2.1. Background
As of June 2003, the completion date of this study, 84 nations had ratified the Kyoto
Protocol including the European Union (EU), Japan, and Canada. The United States and
Russia, the first and third largest pollution emitters, respectively, of carbon dioxide (a
key greenhouse gas) had not ratified the treaty (French, 2002). The countries ratifying
the Protocol are committing to reduce greenhouse gases by 5% by the year 2012 from
their 1990 level (Revkin, 2001). Because the United States has so far decided not to
ratify the Protocol and has not made any commitment to reduce greenhouse gases, it is
not clear how U.S. multinationals will react to the Protocol’s requirements.
We expect the Protocol’s requirements to have a significant impact on fossil-burning
electric utilities (the major industrial producer of carbon dioxide), chemicals, and oil and
gas companies, which are required to reduce emissions by 5% before the year 2012. We
also expect an effect on firms from industries that create the products that cause greenhouse
gas emissions; these include the manufacturers of motor vehicles, farm equipment,
airplanes, and the parts for these products. In order to modify the products so as to reduce
emissions, these firms will require creative thinking, planning, retooling and redesigning of
their manufacturing processes. Therefore, reducing emissions caused by these products will
involve substantial costs and may take longer to achieve. In addition, insurance companies
are also likely to be affected by the Protocol because global warming is expected to result in

M. Freedman, B. Jaggi / The International Journal of Accounting 40 (2005) 215–232218
a number of ecological disasters. Insurance companies that write policies for casualty or
business liability insurance will have to pay off claims for many of these disasters. Munich
Re, a German insurer, estimates that global warming could cost $300 billion annually by the
year 2050 (Cortese, 2002a). Disclosure of cost information will require the insurance
companies to estimate losses from agricultural damage, flooding, drought, and other
environmental impacts.
Earlier studies concerning environmental disclosures show that disclosures vary among
firms from different countries. Buhr and Freedman (2001) report that Canadian firms
provide more extensive environmental disclosure than U.S. firms, whereas Guthrie and
Parker (1990) find that U.S. firms are associated with greater environmental disclosures
compared to Australian or U.K. firms. Gamble, Hsu, Jackson, and Tollerson (1996) also find
that U.S. firms provide more extensive environmental disclosures compared to firms from
27 other nations. They also report that firms using the Anglo-American model (U.S., UK,
Canada, and Australia) tend to provide more environmental disclosures compared to firms
from other countries. Fekrat, Carla Inclan, and Petroni (1996), who examined firms from 18
nations, find that Canadian firms tend to provide the most environmental disclosures and
Japanese firms the least, and they attribute this difference to the strength of capital markets.
Williams (1999), examined disclosures by firms from seven Pacific nations, and finds that
the key variables in determining environmental disclosures relate to cultural variables of
uncertainty avoidance and masculinity, as defined by Hofstede (1980).2 He finds, however,
that the equity market is not a significant determining factor.
Most of these studies are based on the environmental information disclosed in the annual
reports from 1980s to the mid-1990s. Environmental information is now also available from
special environmental reports and company websites and these sources have not been
utilized many earlier studies. According to corporateregister.com, an on-line website
tracking social reporting, 339 separate environmental reports were issued in the U.S.A. in
1999 (Cortese, 2002b). Furthermore, the existing studies are based on data that were
disclosed before the Protocol was signed. A number of major initiatives have recently been
undertaken to encourage firms to provide environmental disclosures and environmental
reports. These initiatives include the Global Reporting Initiative, SustainAbility, and
CERES. This study utilizes environmental data disclosed in the financial statements, as well
as in the environmental reports, and on websites.
2.2. Rationale for pollution disclosures
A number of theories have been developed to explain differential environmental
disclosures by firms. Two of these theories—stakeholder theory and legitimacy theory—
provide a more convincing rationale for environmental pollution disclosures (for example,
see Gray, Kouhy, & Lavers, 1995). The stakeholder theory (Clarkson, 1995; Roberts, 1992;
2 Masculinity vs. femininity and strong vs. weak uncertainty avoidance are two of the four original societal
values that Hofstede (1980) described in his pioneering work on global culture. Masculinity refers to a society
where male characteristics like assertiveness and heroism are valued more than female characteristics like caring
and relationships. Uncertainty avoidance basically concerns the ability to deal with risk.

M. Freedman, B. Jaggi / The International Journal of Accounting 40 (2005) 215–232 219
Ullmann, 1985) posits that environmental disclosures are made in response to the
stakeholders’ demand for environmental (and social) information. Management responds
to public pressure by stakeholders by voluntarily disclosing the types of environmental (or
social) information they demand. Amajor problemwith this theory, however, is that it fails to
explain why firms from similar industries operating in the same geographic areas provide
differential disclosures.
According to legitimacy theory (Dowling & Pfeffer, 1975), social disclosure is a means
to deal with the firm’s exposure to political and social pressures (Lindblom, 1994; Patten,
2000). Firms behave in a way that is considered to be congruent with the society’s perceived
goals. By disclosing environmental information, firms attempt to convey to their
stakeholders that they are meeting the society’s environmental and social goals (even if
they are not doing it), and thereby alleviate public pressures. Thus, the firms blegitimizeQtheir performance by providing environmental (and social) disclosures (Lindblom, 1994).
Legitimacy theory has been examined in numerous empirical studies and the results of
these studies have been fairly consistent in confirming the theory. Most of the studies utilize
samples based on U.S. firms (see Patten, 1991, 1992; Walden & Schwartz, 1997). However,
one study examined firms from Western European countries (Adams, Hill, & Roberts,
1998), and two other studies focused on Australian firms (Deegan & Gordon, 1996; Deegan
& Rankin, 1996). Results of all these studies are consistent with legitimacy theory. Based on
the findings of studies on legitimacy theory, we argue that disclosure of information on
greenhouse gases fits the legitimacy model because managers of firms from the Protocol
ratifying countries appear to perceive that detailed disclosures would be important for their
public image. On the other hand, there is not likely to be strong pressure on firms from
countries that have not signed the Protocol to make detailed pollution disclosures.
3. Hypotheses
3.1. Disclosure index and firms from countries ratifying protocol
The largest firms in the world, in general, are multinationals and most of them have
manufacturing facilities and offices in several countries, including countries that have ratified
the Protocol. Therefore, it can be argued that irrespective ofwhether or not the country of their
home office has ratified the Protocol, these firms need to seriously consider the Protocol’s
implications for their future performance, especially with regard to their operations in the
countries ratifying the Protocol. Because large expenditures may be required to meet the
Protocol’s requirements, it is important that these firms provide detailed disclosures on their
efforts and achievements in reducinggreenhousegas emissions to assist investors in assessing
the trade off between risk and return. For example, if a U.S.-based firm has manufacturing
facilities in an E.U. country, it will need to make sure that the E.U.-based facility follows the
E.U. requirements developedunder theProtocol. Itwould, therefore, be important for this firm
to disclose information on its efforts and success in meeting the regulatory requirement,
including information on its future plans and projected costs of complying with regulations.
On the other hand, it can be argued that foreign multinationals operating in Protocol
ratifying countries may not have strong motivation to make detailed disclosures because
such disclosures are not required by the country of their home office. In this study, we

M. Freedman, B. Jaggi / The International Journal of Accounting 40 (2005) 215–232220
empirically test whether disclosures about greenhouse gases made by firms from Protocol
ratifying countries differ from those made by firms that have their home offices in countries
not ratifying the Protocol. We expect firms from countries that have ratified Kyoto to be
associated with higher degrees of disclosures because they are likely to disclose more than
the minimum requirement. We develop the following hypothesis to test this assumption.
H1. Firms from countries that have ratified the Kyoto Protocol make more detailed
pollution disclosures pertaining to global warming compared to firms from countries that
have not ratified the Kyoto Protocol.
3.2. Firm size and disclosure index
Environmental accounting literature argues that firm size plays an important role in a
firm’s pollution-abatement performance and pollution-emission disclosures (see, Spicer,
1978; and Roberts, 1992). This argument is based on the premise that larger firms could
more easily afford the expenditures needed to abate pollution. Moreover, according to the
political hypothesis (Watts & Zimmerman, 1986) larger firms attract greater attention from
themedia, policymakers, and regulators. Theywould be, therefore, under greater pressure to
act in a manner consistent with the Protocol than smaller firms.
However, Patten (2000) shows that firm size may not be a critical factor in pollution
performance and pollution disclosures. Despite Patten’s study, we argue that this fear for
incurring a high political cost provides the motivation for large firms to make detailed
disclosures so that their pollution performance would not be underestimated or ignored by
policy makers and regulators. The following hypothesis asserts the existence of a positive
association between pollution disclosures and firm size.
H2. There is a positive association between firm size and global warming related pollution
disclosures.
3.3. Debt / equity structure effect on pollution disclosures
According to the debt-covenant hypothesis in (Watts & Zimmerman, 1986), managers of
firms with a high debt–equity ratio are expected to choose accounting policies and methods
thatwouldhelp themavoiddebt-covenants’violations.The findingsof several studies support
this expectation (e.g., DeFond & Jiambalvo, 1994; Jaggi & Lee, 2002; Sweeney, 1994).
Consistentwith this hypothesis, it is argued that firmswithhighdebt–equity ratios are likely to
opt for an accounting policy of detailed disclosures in order to keep their investors and
creditors fully informed about their operating performance, including pollution performance.
In the absence of detailed pollution disclosures, investors and creditors would not be able to
properlyevaluate the firm’s riskofdefault, and thus theymayavoid investing in the firm.Thus,
we expect firms with a high debt–equity ratio to be more forthcoming and maintain a
comparatively higher level of disclosures, including disclosures on global warming-related
pollution emissions. We test this expectation using the following hypothesis:
H3. Firms with a higher debt–equity ratio have more extensive pollution disclosures
concerning global warming than firms with a low debt–equity ratio.
M. Freedman, B. Jaggi / The International Journal of Accounting 40 (2005) 215–232 221
3.4. Return on assets and pollution disclosures
It has been argued in the literature that firms with a better operating performance,
proxied by the return on assets, are likely to have a higher incentive to make more detailed
environmental disclosures (Roberts, 1992) because they can afford to spend more on
environmental abatement. Similarly, Porter and van der Linde (1995) posit that firms that
do a good job environmentally can be expected to perform better economically. While
these studies posit different causality, it is our interest to test the association, and not make
a causal inference. We test this expectation with the following hypothesis:
H4. There is a positive association between pollution disclosures and return on assets.
4. Research design
4.1. Sample and study period
We are focusing our study on large firms for the following reasons.We expect larger firms
that are required to report to regulatory agencies to be more concerned with disclosures,
including pollution disclosures. Larger firms are more likely to have a website that provides
corporate financial and environmental information and these sites are a source of data for this
study. Therefore, our study focuses on the largest firms in the industries affected by the
Protocol in theProtocol ratifyingcountries comparedwith firms fromnon-ratifying countries.
The selection of large global firms starts with their identification from publicly available
data bases, i.e., Fortune’s list of 500 global companies and Hoover’s directory. The 2002
edition of Fortune’s list of 500 includes firms with revenues of at least U.S. $10 billion. We
select the firms that are classified in the chemical, oil and gas, energy, motor vehicles, and
casualty insurers industries. To expand this sample, we include firms from the same
industries found in Hoover’s directory, which have revenues greater than $6 billion.
The selected firms are screened on the basis of the following criteria. First, the firms must
have a website in English to facilitate obtaining all necessary available data. Second, the
firms must have operations in a country that has ratified the Kyoto Protocol. Third, a
complete set of financial statements must be available. Firms not meeting any of these three
criteria are excluded from the sample.3 The final sample consists of 120 firms from 20
countries. The number of firms at different steps of the selection process is provided in
Table 1 and the names of firms from different countries are provided in Appendix A.
We examined the websites in May/June 2003 and obtained the latest information they
contained on pollution disclosures related to global warming.4 Although the websites
might not have been updated for some time, we assume that they were up to date, at
least as far as early 2003. Any information on global warming available on the website
was considered public information, and, we included it, if it is relevant to this study. In
4 We used a May–June 2003 window for the website to keep changes in the websites to a minimum and still be
able to capture data through 2002.
3 The one exception is with Hyundai, which has no production facilities in countries that ratified Kyoto, but
does sell cars that produce greenhouse gases in these countries.

Table 1
Sample selection
Motor vehicles Oil and gas Energy Chemicals Insurance Total
Panel A: no. of firms operating in countries that ratified Kyoto Protocola
From Fortune 500 21 38 30 14 17 120
From Hoover’s database 3 7 15 6 4 35
Total 24 45 45 20 21 155
Less:
Website under construction �2 �2
Website not in English �1 �1 �2
Website unavailable �1 �5 �2 �2 �1 �11
No operation in country that
ratified Kyoto Protocol
�2 �11 �1 �1 �15
Incomplete financial data �1 �2 �1 �1 �5
Final Sample 22 33 31 16 18 120
Panel B: no. of firms disclosing information of carbon dioxide emissions
Country
US 1 2 8 3 14
Japan 4 5 2 1 12
EU 4 6 7 4 3 24
Non-EU Europe 1 1
Canada 1 1 2
Australia 1 1
Total 9 10 21 9 5 54
a These firms are from countries that ratified the Kyoto Protocol and they also include multinational firms
belonging to countries which have not ratified the Protocol but have production facilities in countries ratifying the
Protocol, with the exception of one firm from South Korea.
M. Freedman, B. Jaggi / The International Journal of Accounting 40 (2005) 215–232222
addition to the websites, we also collected relevant information from environmental
reports, environmental statements, and annual reports. The annual reports made
available to shareholders and the 10 K forms filed with the Securities and Exchange
Commission and available on the SEC website were especially used for U.S. firms.
We used the latest available information, although some of these reports contained
information pertaining to earlier years. Because emission information after 2000 was not
available for several firms, we decided to use the emission disclosures for the year 2000 in
order to increase number of firms in the analyses.5
4.2. Measurement of dependent variables: disclosure index
We develop a disclosure index using the content-analysis technique that focuses on the
substance of what is disclosed rather than counting the lines of disclosure. This approach has
been utilized in numerous earlier environmental–accounting studies (e.g., Freedman &
Wasley, 1990; Wiseman, 1982). The disclosure indices, based on the categorical technique
used in earlier environmental studies, either relate to environmental disclosures in general
5 Carbon dioxide emission data usually was presented for a number of years. In order to maximize the sample
size, provide the most current data, and still be consistent in comparing companies we used emissions for the year
2000.

M. Freedman, B. Jaggi / The International Journal of Accounting 40 (2005) 215–232 223
(Wiseman, 1982) or to disclosures concerned with a specific regulation (Patten, 2000) as is
the case with this study.
Based on the requirements and expected consequences of the Protocol as well as on the
existing literature dealingwithperceived shareholders’ environmental needs (e.g., Freedman,
Jaggi, & Stagliano, 2004) and on the availability of information in 10 websites, we identified
relevant categories for constructing a Protocol-related disclosure index for this study. Since
our focus is on specific regulations, the number of disclosure categories is limited. We
decided to use the following five categories that are expected to capture the Protocol-related
disclosures:
1. Mention of global warming or of the Kyoto Protocol.
2. Firm’s plans to deal with global warming and the objective to control global warming.
3. Potential costs to achieve the global-warming objectives.
4. Current costs to reduce the greenhouse-gas emissions.
5. Information on the extent of greenhouse-gas emissions.
Two disclosure indexes are developed based on two weighting schemes: equal weights
and differential weights (unequal weights). The Equal Weight Index assigns a one to each
item with a maximum score of five.6 This method is simple and avoids controversies.
Justification for using the UnequalWeighted Index is the assumption that the information
conveyed by different items differ in importance. For example, a mere mention of global
warming in the reports is not likely to provide adequate information to investors in
evaluating the firm’s performance and is not likely to be as informative as the cost
information. Thus, there is a compelling argument for using differential weights for
individual items, depending on the perceived importance of each item. There are, however,
no guidelines on the weighting scheme to be used and we use the weights based on our
perception of their contribution to the evaluation of the firm’s global-warming performance.
We give higher weight to quantitative information compared to descriptive information.
Thus, the following weight scheme is developed:
Item Weight
Mention global warming 1
Firm’s plans 2
Potential costs 3
Current costs 3
Amount of emissions 3
The maximum score of the Unequal Weight Disclosure Index for a firm is 12. In order
to overcome the weaknesses of the choice of weights in the Unequal Weight Disclosure
Index, we use both Equal and Unequal Weight indices. Consistent results for both of these
indices is an indication of the robustness of the evidence.
6 The weighting scheme utilized in this study just recognizes that the last three items provide more specific
information than the first two. Although an argument can be made that each of the last three items should be
weighed differentially, we find it hard to defend specific differences in those weights.
M. Freedman, B. Jaggi / The International Journal of Accounting 40 (2005) 215–232224
4.3. Selection of independent and control variables
We use four-test variables to test the hypotheses developed in the study. The first test
variable is an indicator variable of KYOTO_DUM. It differentiates between the firms
that belong to the groups of Protocol ratifying and non-ratifying countries. The variable
is coded as one if the firm belongs to the Protocol ratifying country, otherwise zero. The
second test variable is firm size (SIZE). We use the log of total assets for 2002 for this
size variable. The third test variable is return on assets (ROA), and the fourth test
variable is the debt-to-equity (DE) ratio. (Although long-term debt is sometimes used in
the numerator, we use an overall measure of debt burden because it is considered to be
more pertinent to pollution disclosures.)
In addition to these noted, independent variables, we use control variables for the
different industry groups (IND_DUM), the Legal System of the country (LS_DUM), and
an index of the regulatory enforcement level in the country (REL). These control
variables should capture the impact of factors other than the test variables discussed
above on pollution disclosures. The following industries are captured by the IND_DUM
variables: auto, oil, energy, and chemicals. We use the legal system of the country as a
variable because disclosures are significantly influenced by the country’s legal system
(e.g., Ball, Kothari, & Ashoket, 2000). Consistent with the literature, we classify
countries into common and code law countries (La Porta, Lopez-de-Silanes, Shleifer, &
Vishny, 1997). The LS_DUM is coded as one for common law countries, otherwise
zero. In addition, we use the index of regulatory enforcement, as developed by La Porta,
Lopez-de-Silanes, Shleifer, and Vishny (unpublished working paper). This variable
controls for the effectiveness of regulatory requirements.
4.4. Statistical tests and model
We use the following regression model to test the above hypotheses:
POL DISDI
¼ �þ �1 KYOTO DUMð Þþ �2 SIZEð Þþ�3 ROAð Þþ �4 DEð Þ
þ �5 LS DUMð Þ þ �6 RELð Þ þ �7�10
X5
j¼1
IND DUMj þ " ð1Þ
where:
POL_DISDI=Disclosure Index, where subscript DI=1 and 2, (1 represents UnweightedDisclosure Index and 2 represents Weighted Disclosure Index),
KYOTO_DUM=1 when the firm belongs to a country that ratified the Kyoto Protocol,
otherwise 0
SIZE=Log of Total Assets
ROA=Return of Assets, proxy for operating performance
DE=Debt–Equity Ratio
LS_DUM=1 when from common-law country, otherwise 0
REL=Regulatory enforcement level
IND_DUM=Auto, oil, energy, chemical industry and insurance

M. Freedman, B. Jaggi / The International Journal of Accounting 40 (2005) 215–232 225
a =Constantb1–10=Coefficients
e =Residual
5. Results
5.1. Descriptive statistics
Descriptive statistics for disclosure indices and other variables are provided in Table 2.
Out of 120 firms, 68 firms belong to countries that ratified the Protocol (Kyoto firms)
and 52 to countries that have not (non-Kyoto firms).
The mean of the equally weighted disclosure index for Kyoto firms is 2.35 against
1.21 for non-Kyoto firms. The mean for weighted index for Kyoto firms is 4.69
against 2.21 for non-Kyoto firms (Table 2, Panel A). We conduct a t-test to evaluate
the significance of differences between the disclosure scores of Kyoto firms and non-
Protocol firms. The t-test results indicate that the differences are statistically
significant both for the equally weight index and the unequally weighted index at
the level of 0.001%. These results clearly indicate that firms from countries that
Table 2
Descriptive statistics
Variable Mean Median Maximum Minimum Standard deviation
Panel A: firms from countries which ratified Kyoto Protocol (N=68)
Disclosure index (equal weights) 2.35 3.00 4.00 0 1.23
Disclosure index (unequal weights) 4.69 6.00 9.00 0 2.67
Assets (in $billions) 75.76 32.25 988.4 1.00 16.89
Return of assets 0.03 0.02 .18 �0.06 0.04
Debt / equity ratio 6.78 0.73 255.9 .73 32.06
Panel B: firms from countries which have not ratified Kyoto Protocol (N=52)
Disclosure index (equal weights) 1.21 1.00 3.00 0 1.30
Disclosure index (unequal weights) 2.21 1.00 6.00 0 2.49
Assets 58.71 21.00 561.00 1.20 103.41
Return of assets �0.13 0.01 .21 �6.70
Debt / equity ratio .87 .85 �49.00 29.02 8.19
Panel C: correlation among variables for the total sample
EW UEW ROA DE Assets
Kyoto 0.415*** 0.431*** 0.133 0.118 0.059
EW 0.981*** 0.008 �0.095 0.009
UEW 0.036 �0.081 �0.028
ROA 0.010 0.034
DE �0.044
Where Kyoto=1 when the firm belongs to the country ratifying the Protocol, EW=equal weighted disclosure
index, UEW=unequal weighted disclosure index, ROA=return on assets, DE=debt/equity ratio, Assets= total
assets.
M. Freedman, B. Jaggi / The International Journal of Accounting 40 (2005) 215–232226
ratified the Kyoto Protocol provide more disclosures compared to firms from non-
ratifying countries.
In Panel B of Table 2, we provide a correlation matrix for the total sample. The
results show that the disclosure indices (equally weighted as well as unequally) are
significantly correlated with the Kyoto variable, which is equal to one for the Kyoto
firms and zero for non-Kyoto firm. There is no significant correlation among other
variables.
5.2. Regression results
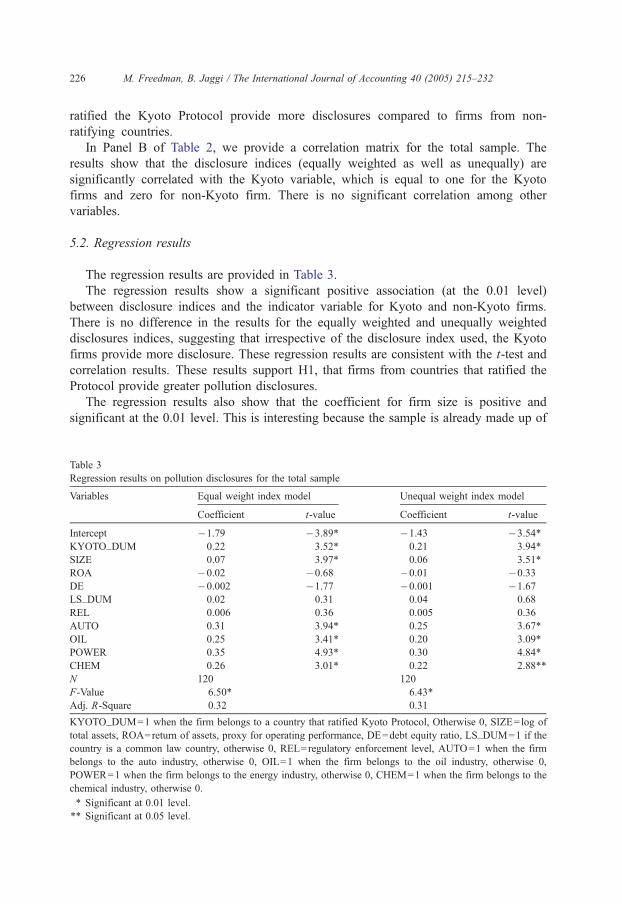
The regression results are provided in Table 3.
The regression results show a significant positive association (at the 0.01 level)
between disclosure indices and the indicator variable for Kyoto and non-Kyoto firms.
There is no difference in the results for the equally weighted and unequally weighted
disclosures indices, suggesting that irrespective of the disclosure index used, the Kyoto
firms provide more disclosure. These regression results are consistent with the t-test and
correlation results. These results support H1, that firms from countries that ratified the
Protocol provide greater pollution disclosures.
The regression results also show that the coefficient for firm size is positive and
significant at the 0.01 level. This is interesting because the sample is already made up of
Table 3
Regression results on pollution disclosures for the total sample
Variables Equal weight index model Unequal weight index model
Coefficient t-value Coefficient t-value
Intercept �1.79 �3.89* �1.43 �3.54*
KYOTO_DUM 0.22 3.52* 0.21 3.94*
SIZE 0.07 3.97* 0.06 3.51*
ROA �0.02 �0.68 �0.01 �0.33
DE �0.002 �1.77 �0.001 �1.67
LS_DUM 0.02 0.31 0.04 0.68
REL 0.006 0.36 0.005 0.36
AUTO 0.31 3.94* 0.25 3.67*
OIL 0.25 3.41* 0.20 3.09*
POWER 0.35 4.93* 0.30 4.84*
CHEM 0.26 3.01* 0.22 2.88**
N 120 120
F-Value 6.50* 6.43*
Adj. R-Square 0.32 0.31
KYOTO_DUM=1 when the firm belongs to a country that ratified Kyoto Protocol, Otherwise 0, SIZE=log of
total assets, ROA=return of assets, proxy for operating performance, DE=debt equity ratio, LS_DUM=1 if the
country is a common law country, otherwise 0, REL=regulatory enforcement level, AUTO=1 when the firm
belongs to the auto industry, otherwise 0, OIL=1 when the firm belongs to the oil industry, otherwise 0,
POWER=1 when the firm belongs to the energy industry, otherwise 0, CHEM=1 when the firm belongs to the
chemical industry, otherwise 0.
* Significant at 0.01 level.
** Significant at 0.05 level.
M. Freedman, B. Jaggi / The International Journal of Accounting 40 (2005) 215–232 227
the largest companies in the world, yet firm size plays a significant role in determining
the extent of pollution information disclosed. This finding supports H2 that the larger the
firm, the higher the extent of pollution disclosures.
The coefficients on ROA and DE are statistically insignificant, suggesting that the
operating performance, proxied by ROA, and the debt–equity ratio do not play a significant
role in pollution disclosures; that is, H3 and H4 are not supported.
The coefficients for all industry groups included in the regression model (four industry
dummies) are positive and statistically significant at the 0.01 level. This result suggests
that all industry groups that are potentially severely impacted by the Kyoto Protocol
provide relatively greater pollution disclosures.
5.3. Results on the impact of carbon dioxide emissions on disclosures
The Protocol especially focuses on carbon dioxide emissions. We, therefore,
conduct additional analyses on firms that are associated with disclosure of
information on carbon dioxide emissions. Only 54 sample firms provided that
information. The breakdown of this sub-sample by industry and region is provided in
Panel B of Table 1.
We conducted a regression analysis to determine whether carbon dioxide emissions
(CO2) would have an impact on the pollution disclosures made by Kyoto firms. In order
to examine this, we include an interaction variable between CO2 and KYOTO, where
Kyoto is coded as one for Kyoto firms and zero for non-Kyoto firms. The coefficient of
the interaction term will jointly test the association of pollution disclosures with CO2 and
whether the firms belong to Protocol ratifying or non-ratifying countries. The following
regression model is used to evaluate this association:
POL�DIS ¼ c þ d1 KYOTOTCO2ð Þ þ d2 SIZEð Þ þ d3 ROAð Þ þ d4 DEð Þ
þ d5�9
X5
j¼1
IND DUMjþ f ð2Þ
where:
CO2*Kyoto= interaction of the log of carbon dioxide emissions with the Kyoto
dummy variable (Kyoto is coded as 1 for countries ratifying the Protocol),
d1–d9=coefficients,f =residual
Other variables have been defined earlier.
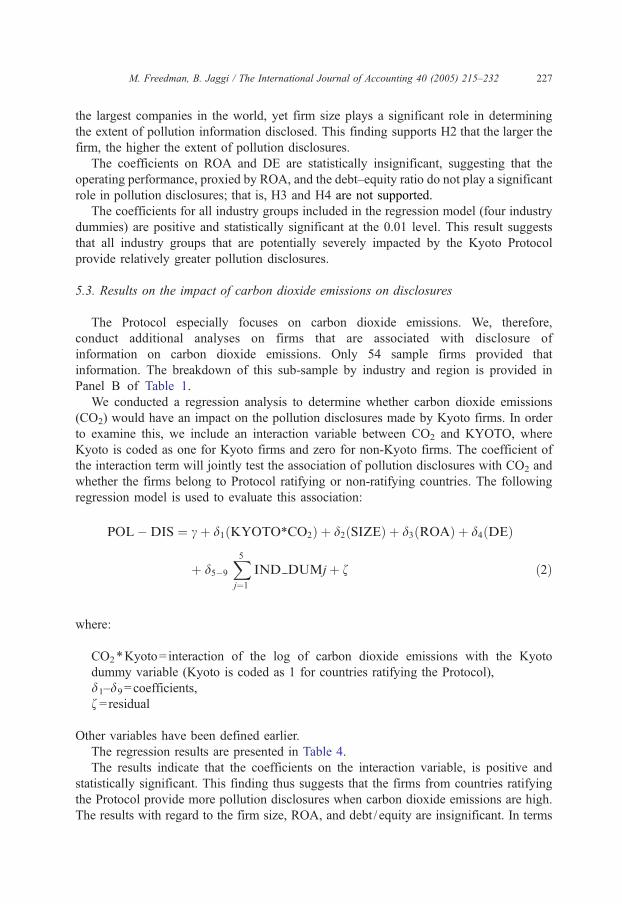
The regression results are presented in Table 4.
The results indicate that the coefficients on the interaction variable, is positive and
statistically significant. This finding thus suggests that the firms from countries ratifying
the Protocol provide more pollution disclosures when carbon dioxide emissions are high.
The results with regard to the firm size, ROA, and debt / equity are insignificant. In terms
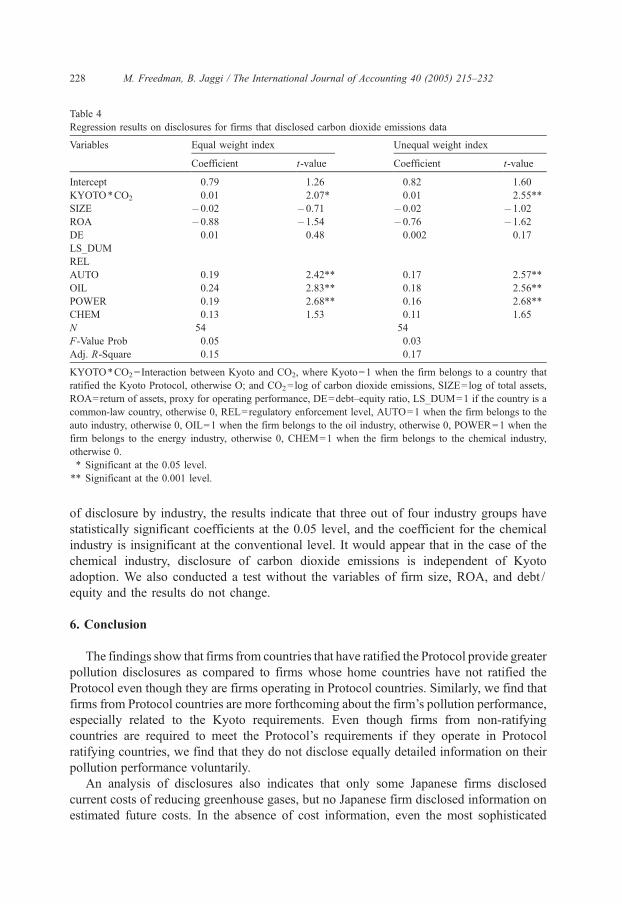
Table 4
Regression results on disclosures for firms that disclosed carbon dioxide emissions data
Variables Equal weight index Unequal weight index
Coefficient t-value Coefficient t-value
Intercept 0.79 1.26 0.82 1.60
KYOTO*CO2 0.01 2.07* 0.01 2.55**
SIZE �0.02 �0.71 �0.02 �1.02
ROA �0.88 �1.54 �0.76 �1.62
DE 0.01 0.48 0.002 0.17
LS_DUM
REL
AUTO 0.19 2.42** 0.17 2.57**
OIL 0.24 2.83** 0.18 2.56**
POWER 0.19 2.68** 0.16 2.68**
CHEM 0.13 1.53 0.11 1.65
N 54 54
F-Value Prob 0.05 0.03
Adj. R-Square 0.15 0.17
KYOTO*CO2=Interaction between Kyoto and CO2, where Kyoto=1 when the firm belongs to a country that
ratified the Kyoto Protocol, otherwise O; and CO2=log of carbon dioxide emissions, SIZE=log of total assets,
ROA=return of assets, proxy for operating performance, DE=debt–equity ratio, LS_DUM=1 if the country is a
common-law country, otherwise 0, REL=regulatory enforcement level, AUTO=1 when the firm belongs to the
auto industry, otherwise 0, OIL=1 when the firm belongs to the oil industry, otherwise 0, POWER=1 when the
firm belongs to the energy industry, otherwise 0, CHEM=1 when the firm belongs to the chemical industry,
otherwise 0.
* Significant at the 0.05 level.
** Significant at the 0.001 level.
M. Freedman, B. Jaggi / The International Journal of Accounting 40 (2005) 215–232228
of disclosure by industry, the results indicate that three out of four industry groups have
statistically significant coefficients at the 0.05 level, and the coefficient for the chemical
industry is insignificant at the conventional level. It would appear that in the case of the
chemical industry, disclosure of carbon dioxide emissions is independent of Kyoto
adoption. We also conducted a test without the variables of firm size, ROA, and debt /
equity and the results do not change.
6. Conclusion
The findings show that firms from countries that have ratified the Protocol provide greater
pollution disclosures as compared to firms whose home countries have not ratified the
Protocol even though they are firms operating in Protocol countries. Similarly, we find that
firms from Protocol countries are more forthcoming about the firm’s pollution performance,
especially related to the Kyoto requirements. Even though firms from non-ratifying
countries are required to meet the Protocol’s requirements if they operate in Protocol
ratifying countries, we find that they do not disclose equally detailed information on their
pollution performance voluntarily.
An analysis of disclosures also indicates that only some Japanese firms disclosed
current costs of reducing greenhouse gases, but no Japanese firm disclosed information on
estimated future costs. In the absence of cost information, even the most sophisticated

M. Freedman, B. Jaggi / The International Journal of Accounting 40 (2005) 215–232 229
users of financial statements are not likely to have a proper understanding of the impact of
global warming on the firm’s performance. In order to improve pollution disclosures for
investment decisions, lack of voluntarism may lead regulators to consider mandatory
disclosure requirements.
Appendix A. Names of firms from different countries by industry
Country not
ratifying
Kyoto
Protocol
Countries that ratified
Kyoto Protocol
Country that either ratified(R)
or did not ratify (N) Kyoto Protocol
U.S. Japan EU
Countries
Europe
(other
than EU
Countries)
Asia,
(other than
Japan) and
Australia
North and
South
America,
other than
USA
Panel A—motor vehicles
GM Toyota Daimler
Chrysler
Hyundai (N)
Ford Honda Volkswagen
Dana Mitsubishi Renault
Navistar Int’l Fuji Hvy
Eqpt
BMW
Paccar Denso Man
Mazda Volvo
Nissan Robert Bosch
Isuzu
Yamaha
Panel B—oil and gas
Amerada
Hess
Showa Shell ENI Lukoil (N) India Oil (R) Imperial (R)
Chevron Tex. Cosmo Oil Statoil Yukos (N) SK (N) Petrobas (N)
Conoco Japan Engy Anglo-Amer
E O G Res. Nippon-Mits BHP
Billiton(N)-
Australian
ExxonMobil Idemitsu Royal Dutch
Shell
Marathon BP
Occidental Total Fina
Phillips Pet. EON
Valero Pet.
El Paso Engy
Andarko Pet.
Plains All
AMCC
Unocal
(continued on next page)

Country not
ratifying
Kyoto
Protocol
Countries that ratified
Kyoto Protocol
Country that either ratified(R)
or did not ratify (N) Kyoto Protocol
U.S. Japan EU
Countries
Europe
(other
than EU
Countries)
Asia,
(other than
Japan) and
Australia
North and
South
America,
other than
USA
Panel C—energy
AEP Tokyo Elec Enel Korean El.
(N)
TransCanada
(R)
Duke Engy Kansai Elec Endesa
Reliant Engy Chubu Elec Gaz de
France
Aquila Tohuku Elec Scottish
Power
Mirant Kyushu Elec Iberdola
Xcel Engy Tomen National
Grid Gp.
CMS Engy RWE
Cinergy Suez
Edison Int’l
AES
Con Ed.
Public Serv
Ent.
Sempra Engy
FirstEnergy
KeySpan
Dynergy
Panel D—chemicals
Dow Marubeni Aventis
DuPont Mitsubishi
Ch
BASF
Pharmacia Sumitomo Bayer
Akzo Ch
Imperial Ch
Norsk
Hydro
Henkel
MG Tech
DSM
Solvay
Panel E—Insurance
AIG Tokyo Mne
and Fire
Allianz AG Zurich Ins
(N)
State Farm Mitui
Sumitomo
Munich RE Swiss Reins
(N)
Appendix A (continued)
M. Freedman, B. Jaggi / The International Journal of Accounting 40 (2005) 215–232230

Country not
ratifying
Kyoto
Protocol
Countries that ratified
Kyoto Protocol
Country that either ratified(R)
or did not ratify (N) Kyoto Protocol
U.S. Japan EU
Countries
Europe
(other
than EU
Countries)
Asia,
(other than
Japan) and
Australia
North and
South
America,
other than
USA
Panel E—Insurance
All State Yasuda Fire
and Mne
Royal
and Sun
Liberty
Mutual
CGN
Berkshire
Htwy
Skandia
CAN
St Paul
Chubb
Appendix A (continued)
M. Freedman, B. Jaggi / The International Journal of Accounting 40 (2005) 215–232 231
References
Adams, C. A., Hill, W.-Y., & Roberts, C. B. (1998, March). Corporate social reporting practices in Western
Europe. British Accounting Review, 30, 1–21.
Ball, R., Kothari, S. P., & Ashok, R. (2000). The effect of international institutional factors on properties of
accounting earnings. Journal of Accounting and Economics, 29, 1–51.
Buhr, N., & Freedman, M. (2001). Culture, institutional factors, and differences in environmental disclosures
between Canada and the United States. Critical Perspectives on Accounting, 12, 293–322.
Clarkson, M. (1995, January). A stakeholder framework for analyzing and evaluating corporate social
performance. Academy of Management Review, , 92–117.
Cortese, A. (2002a, August 18). As the earth warms, will companies pay? New York Times, B6.
Cortese, A. (2002b, March 24). The new accountability: Tracking social costs. New York Times, B4.
Deegan, C., & Gordon, B. (1996). A study of the environmental disclosure practices of Australian corporations.
Accounting and Business Research, 26(3), 187–199.
Deegan, C., & Rankin, M. (1996). Do Australian companies report environmental news objectively? An analysis
of environmental disclosures by firms prosecuted successfully by the Environmental Protection Authority.
Accounting Auditing and Accountability Journal, 9(2), 50–67.
DeFond, M. L., & Jiambalvo, J. (1994). Debt covenant violation and manipulation of accruals. Journal of
Accounting and Finance, 17, 145–176.
Dowling, J., & Pfeffer, J. (1975). Organizational legitimacy: Social values and organizational behavior. Pacific
Sociological Review, 18(1), 122–138.
Fekrat, M., Carla Inclan, A., & Petroni, D. (1996). Corporate environmental disclosures: competitive disclosure
hypothesis using 1991 annual report data. The International Journal of Accounting, 31, 175–195.
Freedman,M., Jaggi,B.,&Stagliano,A. J. (2004). Pollution disclosures by electric utilities:An evaluation at the start
of the first phase of 1990 Clean Air Act. Advances in Environmental Accounting and Management, 2, 59–100.
Freedman, M., & Wasley, C. (1990). The association between environmental performance and environmental
disclosures in annual reports and 10 K’s. Advances in Public Interest Accounting, 3, 163–171.
French, V. (2002, June 5). Japan ratifies global warming pact, and urges U.S. backing. New York Times, A5.
Gamble, G., Hsu, K., Jackson, C., & Tollerson, C. (1996). Environmental disclosures in annual reports: An
international perspective. Accounting Horizons, 31, 293–331.

M. Freedman, B. Jaggi / The International Journal of Accounting 40 (2005) 215–232232
Gray, R., Kouhy, R., & Lavers, S. (1995). Corporate social and environmental reporting: A review of the literature
and a longitudinal study of U.K. disclosure. Accounting Auditing and Accountability Journal, 8(2), 47–77.
Guthrie, J., & Parker, L. (1990). Corporate social disclosure practice: A comparative international analysis.
Advances in Public Interest Accounting, 3, 159–175.
Hofstede, G. (1980). Culture’s consequences. Beverly Hills, CA7 Sage Publications.
Jaggi, B., & Lee, P. (2002). Earnings management and response to debt covenant violations and debt restructuring.
Journal of Accounting, Auditing & Finance, 17, 295–324.
La Porta, R., Lopez-de-Silanes, F., Shleifer, A., & Vishny, R. (1997). Legal determinants of external finance.
Journal of Finance, 52, 1131–1150.
La Porta, R., Lopez-de-Silanes, F., Shleifer, A., & Vishny, R. (unpublished working paper). Law and finance.
Working Paper, University of Chicago.
Lindblom, C. K. (1994). The implication of organizational legitimacy for corporate social performance and
disclosure. Presented at the Critical Perspectives Conference.
Patten, D. (1991, Winter). Exposure, legitimacy and social disclosure. Journal of Accounting and Public Policy,
10, 297–308.
Patten, D. (1992). Intra-industry environmental disclosure in response to the Alaskan oil spill: A note on legitimacy
theory. Accounting, Organizations and Society, 15(5), 471–475.
Patten, D. (2000). Changing superfund disclosure and its relation to the provision of other environmental
disclosure. Advances in Environmental Accounting and Management, 1, 101–122.
Porter, M., & van der Linde, C. (1995). Toward a new conception of the environment–competitiveness
relationship. Journal of Economic Perspectives, 9(4), 97–118.
Revkin, A. (2001, November 11). Global warming impasse is broken. New York Times, 1A, 8.
Roberts, R. W. (1992). Determinants of corporate social responsibility disclosure: An application of stakeholder
theory. Accounting, Organization and Society, 17, 595–612.
Spicer, B. (1978). Investors, corporate social performance and information disclosure: An empirical study.
The Accounting Review, 53, 94–111.
Sweeney, A. P. (1994). Debt-covenant violations and managers’ accounting responses. Journal of Accounting and
Economics, 17, 281–308.
Ullmann,A. (1985). Data in search of a theory. A critical examination of the relationships among social performance,
social disclosure and economic performance of US firms. Academy of Management Review, 10(3), 540–557.
Walden, W. D, & Schwartz, B. N. (1997, Summer). Environmental disclosures and public policy pressures.
Journal of Accounting and Public Policy, 16, 125–154.
Watts, R. L., & Zimmerman, J. L. (1986). Positive accounting theory. Englewood Cliffs, New Jersey7 Prentice Hall.
Williams, S. M. (1999). Voluntary environmental and social accounting disclosure practices in the Asia–
Pacific region: An international empirical test of political economy theory. The International Journal of
Accounting, 34, 209–238.
Wiseman, J. (1982). An evaluation of environmental disclosures made in annual reports. Accounting,
Organizations and Society, 7, 553–563.