global workplace study 2020 - adp research institute
TRANSCRIPT

Dr. Mary Hayes Dr. Frances Chumney Marcus Buckingham
Global Workplace Study 2020Full Research Report

2Global Workforce Study Copyright © 2020 ADP, Inc.
Global Workplace Study 2020
1
2
3
4
5
Purpose of This Study
What We Asked
Who We Asked
What We Found
Resilience and COVID-19
COVID-19 Effect on Engagement
The Relation of Engagement and Workplace Resilience by Country
Conclusion
6
7
8
3Global Workforce Study Copyright © 2020 ADP, Inc.
1Purpose of This Study

4Global Workforce Study Copyright © 2020 ADP, Inc.
We have been measuring Engagement around the world for over a decade, developing a survey instrument, Engagement Pulse, that has given us the ability to create a truly global picture. Never before, however, have we employed this tool under such world-altering circumstances. Given the universal impact of COVID-19 at this time, it seems impossible, or at least inadvisable, to attempt to measure Engagement in isolation. The current moment presents us not just with the opportunity but with the obligation to study Engagement in relation to the impact that this health crisis has had on workers around the world.
This Global Workplace Study, for the first time, combines Engagement Pulse with a new instrument, the ADPRI Workplace Resilience Scale.
With these two instruments, we set out to examine:
• The global level of Engagement in 2020
• The global level of Workplace Resilience in 2020
• The drivers of Engagement and Workplace Resilience
• How workplaces have changed around the world, and how
likely those changes are to endure
In alignment with our previous studies, we define Engagement as a positive state of mind characterized by “vigor, dedication, and absorption” (Schaufeli & Bakker, 2004). We define Workplace Resilience as the capacity of an individual to withstand, bounce back from, and work through challenging circumstances or events at work. For details on methodology and findings, see our earlier Engagement Pulse: Team Leader Effectiveness Through the Eyes of Employees white paper and the recent ADPRI Workplace Resilience Study Full Research Report.
As we shall see, these constructs are related, but not the same. In fact, in one way, they can be seen as opposite sides of the same coin. Where measuring Engagement captures how individuals are proactive in delivering their best work, Workplace Resilience is a reactive measure, capturing how people respond when challenges arise. This study focuses on how COVID-19 has affected Engagement and Workplace Resilience — and the interplay between them — in 25 countries.
5Global Workforce Study Copyright © 2020 ADP, Inc.
2What We Asked

6Global Workforce Study Copyright © 2020 ADP, Inc.
1. I am really enthusiastic about the mission of my company.
2. At work, I clearly understand what is expected of me.
3. In my team, I am surrounded by people who share my values.
4. I have a chance to use my strengths every day at work.
5. My teammates have my back.
6. I know I will be recognized for excellent work.
7. I have great confidence in my company’s future.
8. In my work, I am always challenged to grow.
1. I have all the freedom I need to decide how to get my work done.
2. No matter what else is going on around me, I can stay focused on getting my work done.
3. In the last week, I have felt excited to work every day.
4. I always believe that things are going to work out for the best.
5. My team leader tells me what I need to know before I need to know it.
6. I trust my team leader.
7. I am encouraged to take risks.
8. Senior leaders are one step ahead of events.
9. Senior leaders always do what they say they are going to do.
10. I completely trust my company’s senior leaders.
The eight Engagement Pulse survey items are:
The ten Workplace Resilience survey items are:
7Global Workforce Study Copyright © 2020 ADP, Inc.
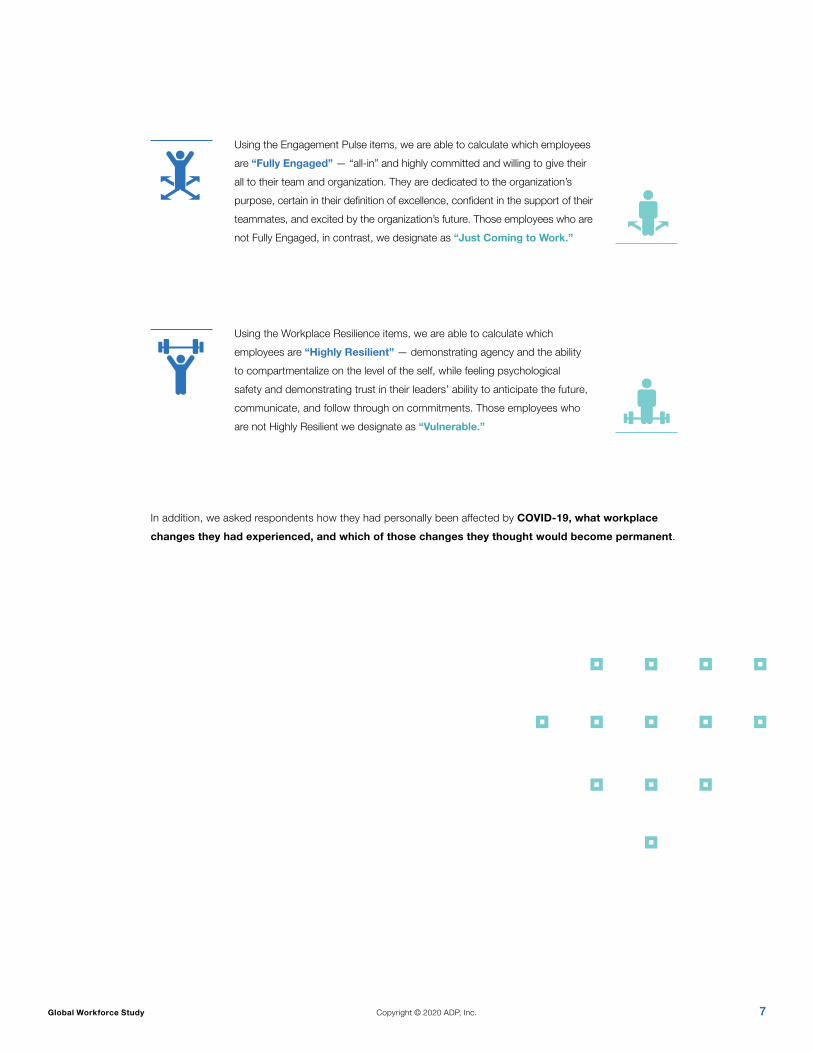
In addition, we asked respondents how they had personally been affected by COVID-19, what workplace changes they had experienced, and which of those changes they thought would become permanent.
Using the Engagement Pulse items, we are able to calculate which employees are “Fully Engaged” — “all-in” and highly committed and willing to give their all to their team and organization. They are dedicated to the organization’s purpose, certain in their definition of excellence, confident in the support of their teammates, and excited by the organization’s future. Those employees who are not Fully Engaged, in contrast, we designate as “Just Coming to Work.”
Using the Workplace Resilience items, we are able to calculate which employees are “Highly Resilient” — demonstrating agency and the ability to compartmentalize on the level of the self, while feeling psychological safety and demonstrating trust in their leaders’ ability to anticipate the future, communicate, and follow through on commitments. Those employees who are not Highly Resilient we designate as “Vulnerable.”

8Global Workforce Study Copyright © 2020 ADP, Inc.
3Who We Asked

9Global Workforce Study Copyright © 2020 ADP, Inc.
We created a stratified random sample of 26,594 participants, over 1,000 workers per country, and then surveyed them with empirically validated measures of Engagement and Workplace Resilience.
Sample
50.3% male
47.3% female
1.7% non-binary
.7% no response
50.2% Over 40 years of age
80% Some college education (some college to advanced degree)
60% Third generation residents (grandparents immigrated)
Over 1,000 per country
26,594 participants

10Global Workforce Study Copyright © 2020 ADP, Inc.
25 Countries (2020)
United States
Canada
North America
China India
Taiwan
Singapore Australia
South Korea
APAC
United Kingdom
Italy
France Sweden
Netherlands
Russia
Germany
Europe
Latin America
Argentina Brazil Mexico
Middle East/Africa
Egypt South Africa
United Arab Emirates
IsraelSaudi Arabia
Japan
Spain

11Global Workforce Study Copyright © 2020 ADP, Inc.
4What We Found

12Global Workforce Study Copyright © 2020 ADP, Inc.
Global EngagementGlobally, Engagement remains low. Compared to our earlier study in 2018, the percent of Fully Engaged employees has decreased by one percentage point. Today, 14% of workers are Fully Engaged.
The countries with the highest percentage of Fully Engaged employees are:
Saudi Arabia
India
South Africa
United Arab Emirates
United States
The countries with the lowest percentage of Fully Engaged employees are:
South Korea
Taiwan
China
Sweden
Italy
Singapore
Highest % Fully Engaged
Lowest % Fully Engaged

13Global Workforce Study Copyright © 2020 ADP, Inc.
Figure 1: Changes in Engagement Level by Country
Argentina 13% 15% 15% 0%
Australia 14% 16% 13% -3%
Brazil 16% 14% 18% 4%
Canada 15% 17% 16% -1%
China 19% 6% 8% 2%
Egypt - 15% 14% -1%
France 15% 17% 13% -4%
Germany 14% 14% 15% 1%
India 17% 22% 20% -2%
Israel - - 15% -
Italy 14% 16% 11% -5%
Japan - - 13% -
South Korea - - 6% -
Mexico 14% 13% 16% 3%
Netherlands - 10% 12% 2%
Russia - - 15% -
Saudi Arabia - 16% 21% 5%
Singapore - 20% 11% -9%
South Africa - 16% 19% 3%
Spain 13% 16% 14% -2%
Sweden - - 11% -
Taiwan - - 8% -
United Arab Emirates - 26% 19% -7%
United Kingdom 14% 15% 15% 0%
United States 19% 17% 19% 2%
Biggest Gains
Biggest Declines
20202018CountryChange
2018–20202015

14Global Workforce Study Copyright © 2020 ADP, Inc.
Global Workplace ResilienceWorkplace Resilience is also low. Only 15% of workers globally are Highly Resilient.
The countries with the highest percentage of Highly Resilient employees are:
India
Saudi Arabia
United Arab Emirates
Singapore
South Africa
Mexico
The countries with the lowest percentage of Highly Resilient employees are:
Israel
Netherlands
Sweden
Taiwan
South Korea
Highest % Highly Resilient
Lowest % Highly Resilient

15Global Workforce Study Copyright © 2020 ADP, Inc.
Figure 2: Level of Workplace Resilience by Country
India 32%
Saudi Arabia 26%
United Arab Emirates 24%
Singapore 19%
Mexico 17%
South Africa 17%
Brazil 16%
United States 16%
Canada 15%
Egypt 15%
Germany 14%
Argentina 13%
France 13%
Russia 13%
Spain 13%
Australia 12%
Japan 12%
United Kingdom 12%
China 11%
Italy 11%
Israel 10%
Netherlands 9%
South Korea 8%
Sweden 8%
Taiwan 8%
Country% Highly Resilient

16Global Workforce Study Copyright © 2020 ADP, Inc.
The Relation of Engagement and Workplace ResilienceEngagement and Workplace Resilience are positively correlated: Engagement explains 64% of Resilience. Overall, we found that 10% of workers are both Fully Engaged and Highly Resilient. And yet, each is independent of the other.
It is possible to be Fully Engaged but not Highly Resilient, and
vice versa.
10%5%
5%80%
Fully Engaged
Just Coming to Work
Highly Resilient
Vulnerable

17Global Workforce Study Copyright © 2020 ADP, Inc.
5Resilience and COVID-19

18Global Workforce Study Copyright © 2020 ADP, Inc.
We expected to find that experience of COVID-19 and its secondary effects would affect personal levels of Workplace Resilience. While that turned to be true, our original hypotheses were disproven in several ways.
Based on our threshold of Highly Resilient (a calculation based on the distribution of responses to the ten items in the ADPRI Workplace Resilience instrument), we were able to compare the percentage of Highly Resilient employees in a given country to the overall extent to which that country experienced the effects of COVID-19. Note that all COVID-19 statistics in the following pages are based on information available at the time of the study.
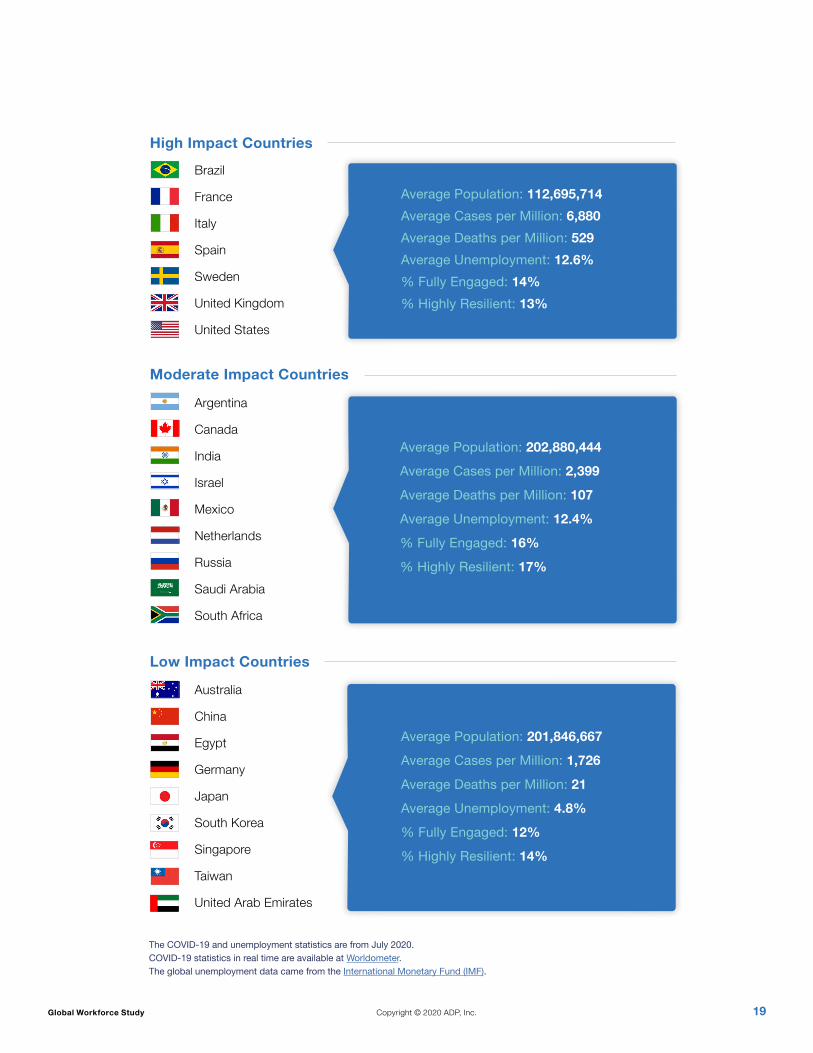
We divided countries into three groups (High Impact, Moderate Impact, and Low Impact) based on a number of COVID-19-related criteria, namely average cases per million, average deaths per million, and unemployment rate.
Country-Level Effects
Hypothesis: Countries most affected by COVID-19 will demonstrate the lowest Workplace Resilience.
Result: A country’s level of COVID-19 impact had no effect on Workplace Resilience.
19Global Workforce Study Copyright © 2020 ADP, Inc.
High Impact Countries
Moderate Impact Countries
Low Impact Countries
Average Population: 112,695,714Average Cases per Million: 6,880Average Deaths per Million: 529Average Unemployment: 12.6%% Fully Engaged: 14%% Highly Resilient: 13%
Average Population: 202,880,444
Average Cases per Million: 2,399
Average Deaths per Million: 107
Average Unemployment: 12.4%
% Fully Engaged: 16%
% Highly Resilient: 17%
Average Population: 201,846,667
Average Cases per Million: 1,726
Average Deaths per Million: 21
Average Unemployment: 4.8%
% Fully Engaged: 12%
% Highly Resilient: 14%
Brazil
France
Italy
Spain
Sweden
United Kingdom
United States
Argentina
Canada
India
Israel
Mexico
Netherlands
Russia
Saudi Arabia
South Africa
Australia
China
Egypt
Germany
Japan
South Korea
Singapore
Taiwan
United Arab Emirates
The COVID-19 and unemployment statistics are from July 2020. COVID-19 statistics in real time are available at Worldometer. The global unemployment data came from the International Monetary Fund (IMF).
20Global Workforce Study Copyright © 2020 ADP, Inc.
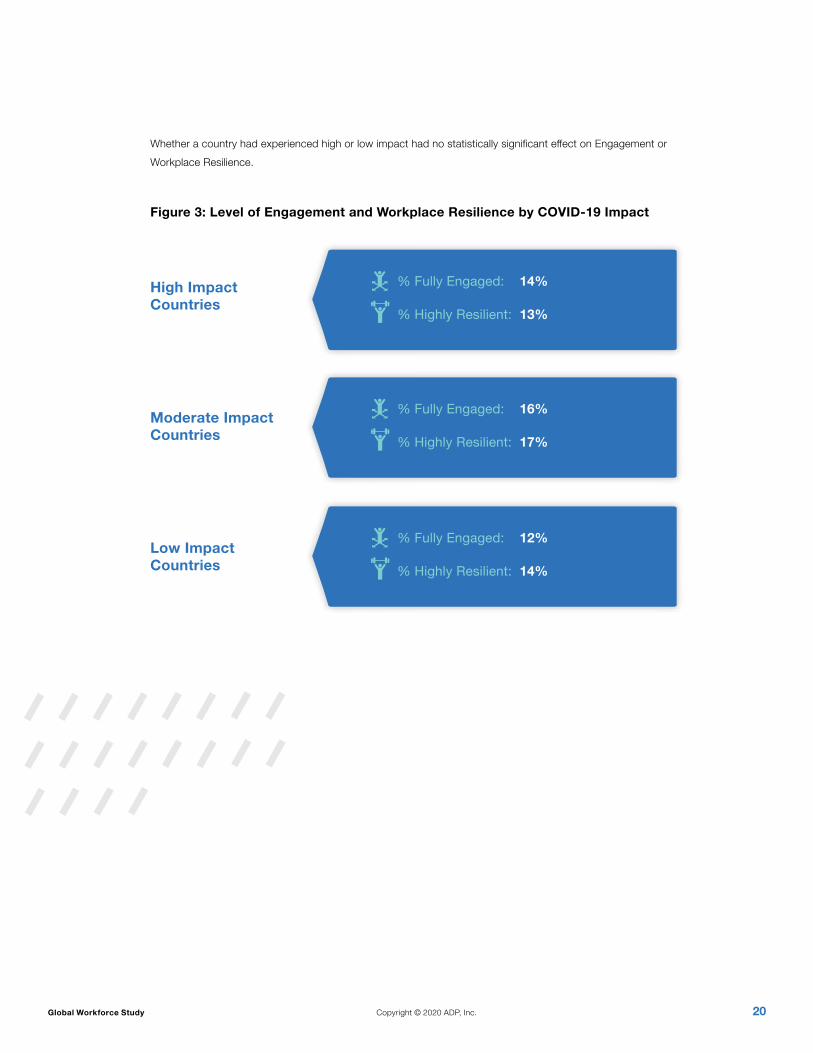
Whether a country had experienced high or low impact had no statistically significant effect on Engagement or Workplace Resilience.
Figure 3: Level of Engagement and Workplace Resilience by COVID-19 Impact
% Fully Engaged: 14%
% Highly Resilient: 13%
High Impact Countries
Moderate Impact Countries
Low Impact Countries
% Fully Engaged: 16%
% Highly Resilient: 17%
% Fully Engaged: 12%
% Highly Resilient: 14%

21Global Workforce Study Copyright © 2020 ADP, Inc.
Personal COVID-19 Experience EffectsWhile macro-level effects in countries did not affect Workplace Resilience or Engagement, micro-level effects did — but in the opposite direction of what we expected.
Hypothesis: Individuals with greater levels of personal experience of COVID-19 would demonstrate lower Workplace Resilience.
Result: Individuals with greater levels of personal experience of COVID-19 demonstrated much higher levels of Workplace Resilience.
We posed the following survey items to respondents:
• I have contracted COVID-19
• I have not contracted COVID-19 but have underlying health conditions that put me at a higher risk
• Someone else in my household has contracted COVID-19 (e.g., spouse, child, parent)
• A colleague at work has contracted COVID-19
• Someone I know outside of work has contracted COVID-19
• No one in my immediate community has been infected with COVID-19
The results indicated that 59% of workers had no direct personal experience of COVID-19, while 41% replied “yes” to one or more of the items:
• 4% had COVID-19 themselves
• 7% had a family member with COVID-19
• 12% had a work colleague with COVID-19
• 18% knew non-work acquaintance with COVID-19
Workers who answered “yes” to all of the
COVID-19 experience questions were
3.8x more likely to be Highly Resilient.

22Global Workforce Study Copyright © 2020 ADP, Inc.
Figure 4: Personal COVID-19 Experience by Country
Egypt 61.6
United Arab Emirates 58.7
Brazil 56.2
Saudi Arabia 51.5
Sweden 51.3
Singapore 51.2
Spain 45.8
Mexico 44.3
India 39.0
Netherlands 36.6
United States 33.1
United Kingdom 32.1
France 30.8
South Africa 27.1
Italy 26.7
Russia 26.6
Canada 22.8
Argentina 21.4
Israel 20.8
Germany 18.1
Australia 15.3
South Korea 12.9
China 10.1
Japan 6.3
Taiwan 5.4
Country%
COVID-19 Affected
Level of COVID-19 experience varied by country and by industry: 61% of Egyptians and 51% of Brazilians have been personally impacted, while only 6% of Japanese workers and 5% of Taiwanese workers have been affected.

23Global Workforce Study Copyright © 2020 ADP, Inc.
COVID-19 experience also varied by industry, with healthcare workers (not surprisingly) seeing the greatest exposure.
Figure 5: COVID-19 Experience by Industry
COVID-19 Affected
% Affected by Industry
0% 10% 20% 30% 40% 50% 60% 70% 80% 90%
Healthcare
Healthcare Support
App-Based Task Employment
Information
Construction & Related Trades
Finance
Education
Real Estate
Total
Technology
Leisure & Hospitality
Transportation & Warehousing
Food Service
Professional Services
Trade
Manufacturing

24Global Workforce Study Copyright © 2020 ADP, Inc.
Changes in the WorkplaceIn addition to direct effects, COVID-19 has produced many secondary effects on the economy and the workplace. We asked workers to indicate whether they had experienced any of the following changes:
• Promotions placed on hold
• Encouraged to take vacation time
• Onetime payment from workplace to help with unexpected hardships
• Layoffs (termination of employment)
• Employees have been furloughed (a temporary layoff from work)
• Increased use of technology
• More work hours
• Fewer work hours
• Job changed to be mostly virtual
• Physical office space closed
• Sheltered in place due to governmental restrictions
Overall, 97% of workers had experienced one or more of these
changes, and no single country fell below 90% of its workers
experiencing change as a result of COVID-19.

25Global Workforce Study Copyright © 2020 ADP, Inc.
While the number of people who experienced change did not show much variance, the number of changes each person encountered did vary by country.
Figure 6: Number of Changes Workers Experienced, by Country
Level of Disruption
Average Changes by Country
0.00 0.50 1.00 1.50 2.00 2.50 3.00
India
Brazil
Argentina
Mexico
South Africa
United Arab Emirates
Spain
Saudi Arabia
Israel
Singapore
Egypt
Canada
Total
France
Australia
United States
China
Italy
United Kingdom
Sweden
Russia
Germany
Netherlands
Taiwan
South Korea
Japan

26Global Workforce Study Copyright © 2020 ADP, Inc.
Hypothesis: The more changes individuals experienced, the less Workplace Resilience they would demonstrate.
Result: The more workplace changes workers experienced, the more resilient they felt.
Workers who experienced at least five
changes at work were 13.2x more likely
to be Highly Resilient.
27Global Workforce Study Copyright © 2020 ADP, Inc.
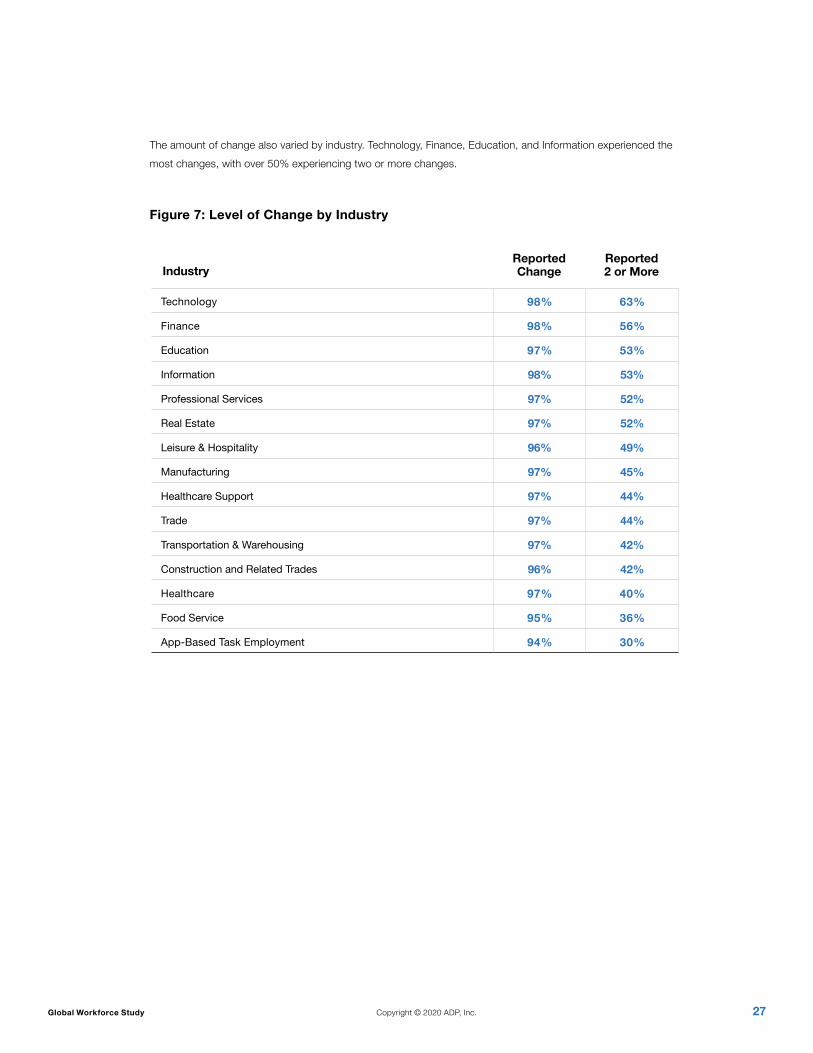
The amount of change also varied by industry. Technology, Finance, Education, and Information experienced the most changes, with over 50% experiencing two or more changes.
Figure 7: Level of Change by Industry
Technology 98% 63%
Finance 98% 56%
Education 97% 53%
Information 98% 53%
Professional Services 97% 52%
Real Estate 97% 52%
Leisure & Hospitality 96% 49%
Manufacturing 97% 45%
Healthcare Support 97% 44%
Trade 97% 44%
Transportation & Warehousing 97% 42%
Construction and Related Trades 96% 42%
Healthcare 97% 40%
Food Service 95% 36%
App-Based Task Employment 94% 30%
Reported Change
Reported 2 or MoreIndustry
28Global Workforce Study Copyright © 2020 ADP, Inc.
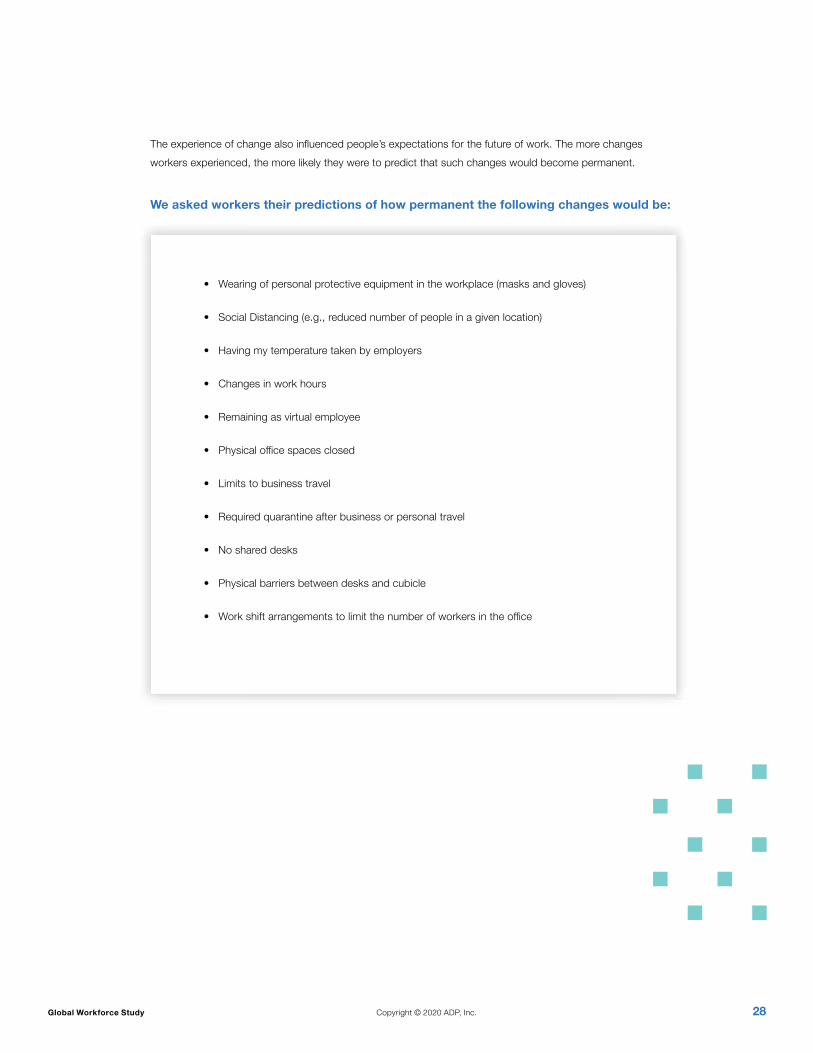
The experience of change also influenced people’s expectations for the future of work. The more changes workers experienced, the more likely they were to predict that such changes would become permanent.
We asked workers their predictions of how permanent the following changes would be:
• Wearing of personal protective equipment in the workplace (masks and gloves)
• Social Distancing (e.g., reduced number of people in a given location)
• Having my temperature taken by employers
• Changes in work hours
• Remaining as virtual employee
• Physical office spaces closed
• Limits to business travel
• Required quarantine after business or personal travel
• No shared desks
• Physical barriers between desks and cubicle
• Work shift arrangements to limit the number of workers in the office

29Global Workforce Study Copyright © 2020 ADP, Inc.
Figure 8 below indicates the number of changes predicted to be permanent.
Figure 8: Predicted Future Disruptions
People in countries where workers experienced a higher average number of changes (represented by lighter colored blue bars above) were more likely to expect such changes to be long-lasting. Workers in countries with a lower average number of changes (dark blue bars) had less expectation that change would be permanent.
Mean Future Disruptions
Number of Changes Predicted to be Permanent
0.00 1.00 2.00 3.00 4.00 5.00
South Africa
Argentina
Mexico
India
Saudi Arabia
Spain
Brazil
Egypt
Canada
Italy
United Kingdom
United Arab Emirates
Total
United States
Israel
Australia
Singapore
China
Russia
France
South Korea
Taiwan
Japan
Germany
Netherlands
Sweden

30Global Workforce Study Copyright © 2020 ADP, Inc.
Loving Your Work Influences Resilience One expectation that our research (specifically, our study of Workplace Resilience in the United States) proved true is the hypothesis based on strengths.
Hypothesis: Individuals who love what they do at work would demonstrate higher Workplace Resilience.
Result: Individuals who love what they do at work demonstrated much higher levels of Workplace Resilience.
Figure 9: Relation of Workplace Resilience to Loving Work
Things you love to do and are great at doing. 23%
Things you love but have to work at to do well. 25%
Things you do not love but are great at doing. 9%
Things you do not love and have to work at to do well. 6%
As it does in so many other areas, playing to one’s strengths — those activities one loves to do — has a positive effect on Workplace Resilience. While this finding is based initially on workers in the United States, we will expand the scope to other countries in future research.
% HR
Those who love what they do — regardless of
whether they consider themselves good at doing it —
were 3.9x more likely to be Highly Resilient.

31Global Workforce Study Copyright © 2020 ADP, Inc.
6COVID-19 Effect on Engagement

32Global Workforce Study Copyright © 2020 ADP, Inc.
What Has Stayed the Same Since 2018As we saw earlier, the global level of Engagement has not changed much from our previous study in 2018. The percent of Fully Engaged employees has decreased by one percentage point since then, meaning that today, 14% of workers are Fully Engaged.
In contrast to Workplace Resilience, Engagement overall does not show much relation to experience of COVID-19.
Figure 10: Relationship of COVID-19 Experience to % Fully Engaged
Egypt 61.6% 14%
United Arab Emirates 58.7% 19%Brazil 56.2% 18%
Saudi Arabia 51.5% 21%
Sweden 51.3% 11%
Singapore 51.2% 11%Spain 45.8% 14%
Mexico 44.3% 16%
India 39.0% 20%Netherlands 36.6% 12%
United States 33.1% 19%United Kingdom 32.1% 15%
France 30.8% 13%
South Africa 27.1% 19%
Italy 26.7% 11%Russia 26.6% 15%
Canada 22.8% 16%
Argentina 21.4% 15%
Israel 20.8% 15%
Germany 18.1% 15%
Australia 15.3% 13%
South Korea 12.9% 6%
China 10.1% 8%Japan 6.3% 13%
Taiwan 5.4% 8%
Highest % Fully Engaged
Lowest % Fully Engaged
Country
% Affected by COVID-19
% Fully
Engaged

33Global Workforce Study Copyright © 2020 ADP, Inc.
We saw no major changes in level of Engagement overall, and the drivers of Engagement remain the same. In fact, these driver patterns have strengthened since the start of the pandemic.
You are a member of a team
You are more likely to be Fully Engaged if...
You trust your team leader
2018 2020
2.3xmore likely
2.6xmore likely
12xmore likely
14xmore likely
2.8xmore likely
3.3xmore likely
You are in upper management

34Global Workforce Study Copyright © 2020 ADP, Inc.
What Has Changed Since 2018We observed two significant changes in Engagement in the era of COVID-19.
Work status: flight to security.
In 2018, the most engaged work status was to have one full-time job and one part-time job. This has changed. In 2020, the most engaged work status is simply having one full-time job, or two full-time jobs.
Tenure: no more honeymoon effect.
Prior to 2020, a consistent finding was that workers with less than one year of tenure in a job were significantly more engaged than longer tenured employees. Newer recruits tend to be more enthusiastic. Today, this effect has disappeared.
This effect is most pronounced when people have had to take new roles specifically because of the pandemic. Likely many people are “settling” for jobs and roles that they do not find as fulfilling during this time, and the effects show up in Engagement levels. Even among those who have new jobs they secured before COVID-19 emerged, the positive effects of being new to a job have vanished.
Figure 11: Level of Engagement by Tenure
Less than one year (I secured this job before COVID-19) 14%
Less than one year (I had to find new employment due to COVID-19) 8%
1–2 Years 11%
3–4 Years 15%
5–8 Years 16%
More than 8 Years 16%
1
2
Average % FETenure
Workers who have had to take on new
roles during this pandemic were 42% less likely to be Fully Engaged than others.
People with a part-time or contingent job
were 50% less likely to be Fully Engaged
than those with only full-time jobs.

35Global Workforce Study Copyright © 2020 ADP, Inc.
7The Relation of Engagement and Workplace Resilience by Country

36Global Workforce Study Copyright © 2020 ADP, Inc.
As we have seen, Engagement and Workplace Resilience are highly correlated: 64% of the variance in Engagement is explained by Workplace Resilience, and 65% of the variance in Workplace Resilience is explained by Engagement.
While they are correlated, however, they are independent constructs and they can vary from each other by individual, and by average within a country.
We found that some countries, such as Singapore and China, demonstrated higher Workplace Resilience than Engagement.
Such a pattern suggests that workers in these countries are able
to withstand challenging times, but are not set up to contribute
their very best. Workers who are Highly Resilient but not Fully
Engaged might be described as stoic. They can withstand challenges
without breaking. They’re not brittle. But they’re not positioned to be
the best version of themselves or bring their best to work.
Singapore has almost
twice as many Highly
Resilient as Fully Engaged
workers (19% vs 11%).
China has a third more
Highly Resilient than
Fully Engaged workers
(11% vs 8%).

37Global Workforce Study Copyright © 2020 ADP, Inc.
Conversely, we observed that some countries demonstrated higher Engagement than Workplace Resilience.
This pattern suggests that although workers might well be
set up for productivity today, they are more vulnerable should
further setbacks occur in the future. Workers who are Fully
Engaged but not Highly Resilient are more reactive, more sensitive
to challenges or threats — any disruption may derail them. They are
operating at a high level — but they’re walking a tightrope. If they fall,
they may fall a long way.
Israel
United Kingdom
United States
Sweden

38Global Workforce Study Copyright © 2020 ADP, Inc.
8Conclusion

39Global Workforce Study Copyright © 2020 ADP, Inc.
The study of Engagement takes on new dimensions and new importance during a time of greatly enhanced global stress such as the current COVID-19 pandemic.
This study had four primary objectives:
1. Determine the global level of Engagement in 2020
2. Establish the global level of Workplace Resilience in 2020
3. Understand the drivers of Engagement and Workplace Resilience
4. Capture how workplaces have changed around the world, and how likely those changes are to endure
We found that workers’ levels of Engagement remain low but have held steady, and that levels of Workplace Resilience are also low. These phenomena are highly related, but independent. Most surprisingly, individuals’ Workplace Resilience increases with direct experience of COVID-19.
This finding has profound implications for senior leaders. If it is true that we demonstrate more Workplace Resilience the more “up close and personal” we get to the reality of COVID-19, we can conclude that sugar-coating that reality is not helpful for anyone. People need facts, not blithe reassurance. Personal experience of the reality of the problem seems to help build Workplace Resilience, to help people overcome fear and access their capacity. Their wellbeing is preserved, not diminished, when they can see the reality of the situation and respond to it, rather than when it is hidden from them or unknown.

40Global Workforce Study Copyright © 2020 ADP, Inc.
Appendix ASurvey and Respondents

41Global Workforce Study Copyright © 2020 ADP, Inc.
We began studying Engagement globally in 2015, including thirteen countries in our survey. In 2018, we increased the scope to 19 countries to expand our knowledge of Engagement globally. This year, we included 25 countries.
We surveyed a random sample of approximately 1,000 full-time and part-time workers in each country and analyzed 26,594 responses.
Employment Status of Respondents
The employment status of the sample is shown in the chart below.
63%Full-Time Employees
2%Multiple Jobs
6%Gig Workers
6%Gig and Traditional Workers
23%Part-Time Employees

42Global Workforce Study Copyright © 2020 ADP, Inc.
Fifteen industries were represented across all 25 countries. The highest proportion represented came from the Professional Services and Education industries.
0.0 2.0 4.0 6.0 8.0 10.0 12.0
Professional Services
Education
Manufacturing
Technology
Trade
Construction & Related Trades
Healthcare
Finance
Leisure & Hospitality
Healthcare Support
Transportation & Warehousing
Information
Food Service
Real Estate
App-Based Task Employment

43Global Workforce Study Copyright © 2020 ADP, Inc.
Fully Engaged by IndustryDifferences in Engagement are noticeable across industries. The highest Engagement occurs in Technology and Finance. During this turbulent time, as the world shifted from office-based work to primarily remote work, technology stepped up to lead the way for Engagement.
0% 5% 10% 15% 20%
Technology
Finance
Professional Services
Construction & Related Trades
Leisure & Hospitality
Information
Real Estate
Trade
Healthcare Support
Healthcare
Food Service
Education
Transportation & Warehousing
App-Based Task Employment
Manufacturing

44Global Workforce Study Copyright © 2020 ADP, Inc.
Organization Size
The percent Fully Engaged within companies of varying sizes is not remarkably different. When we examine Workplace Resilience within this same context, it appears that larger organizations might insulate individuals to increase Workplace Resilience.
1–49 13% 12%
50–249 12% 13%
250–999 16% 18%
1,000+ 16% 16%
Total 14% 15%
% FE % HRCompany Size
EducationWe see an upward trend the more education a person has achieved. The highest Engagement and Workplace Resilience across countries and industries occurs with those who have a professional or advanced degree.
Those who have no education are two times less likely to be Fully Engaged and Highly Resilient.
Professional or Advanced Degree 19% 19%
4-Year Degree 15% 16%
Some College, No Degree 12% 11%
High School Diploma/GED 12% 12%
2-Year Degree 11% 12%
None of the Above 10% 12%
% FE % HREducation

45Global Workforce Study Copyright © 2020 ADP, Inc.
Position in OrganizationEngagement and Workplace Resilience occur at higher levels in those who are ranked higher in organizations. Those at the top are over three times more likely to be Fully Engaged compared to the individual contributor, and four times more likely to be Highly Resilient.
Upper Management 27% 30%
Middle Management 16% 17%
Frontline Management 11% 12%
Individual Contributor 10% 9%
Intern/Temporary Employee 10% 11%
Employment StatusThe story this year closely resembles the 2018 findings, with gig workers being highly engaged. But this year there is a twist: those with a full-time job working for an organization and a full-time side gig are the most Fully Engaged and Highly Resilient.
1 Full-time job & am self-employed Full-time as a contingent worker 19% 26%
I am self-employed Full-time as a contingent worker 19% 18%
2 Full-time jobs for different companies 19% 17%
1 Full-time job 15% 15%
1 Full-time job & 1 Part-time job for different companies 13% 13%
I am self-employed Part-time as a contingent worker 11% 13%
1 Part-time job 12% 13%
1 Full-time job & am self-employed Part-time as a contingent worker. 14% 12%
2 or more Part-time jobs for different companies 10% 12%
1 Part-time job & am self-employed Full-time as a contingent worker. 12% 11%
1 Part-time job & am self-employed Part-time as a contingent worker. 9% 10%
% FE % HRLevel
% FE % HREmployment Status
46Global Workforce Study Copyright © 2020 ADP, Inc.
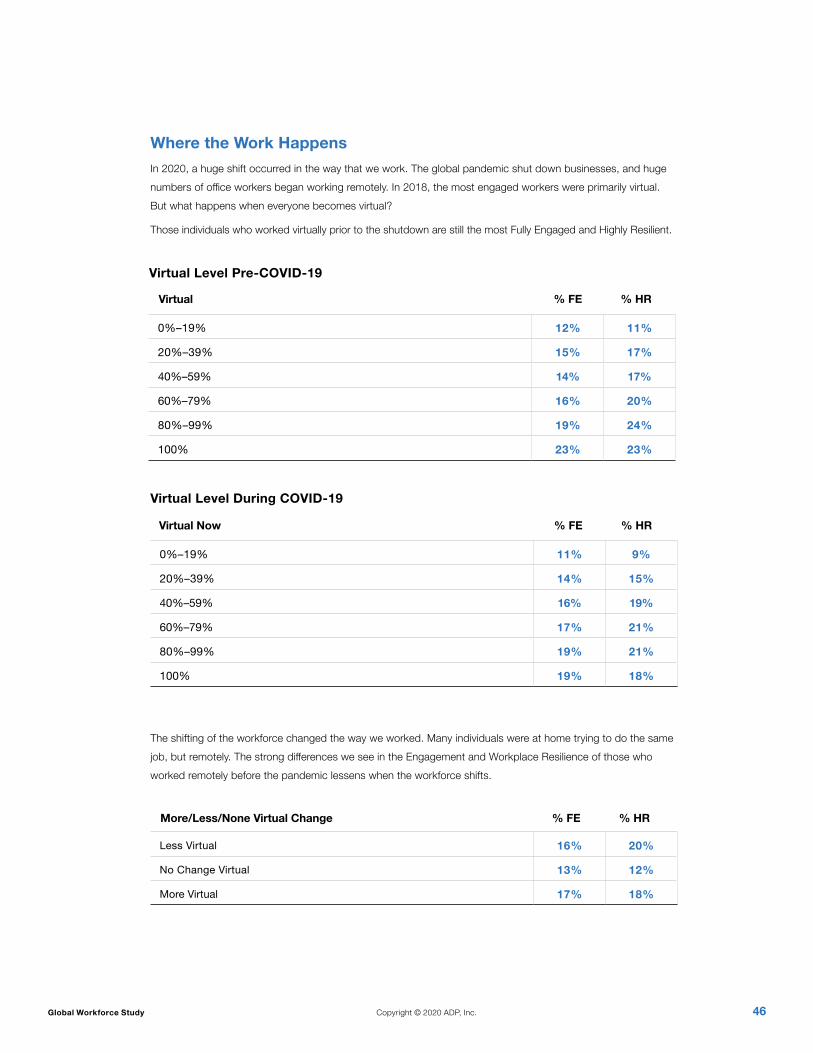
Where the Work HappensIn 2020, a huge shift occurred in the way that we work. The global pandemic shut down businesses, and huge numbers of office workers began working remotely. In 2018, the most engaged workers were primarily virtual. But what happens when everyone becomes virtual?
Those individuals who worked virtually prior to the shutdown are still the most Fully Engaged and Highly Resilient.
0%–19% 12% 11%
20%–39% 15% 17%
40%–59% 14% 17%
60%–79% 16% 20%
80%–99% 19% 24%
100% 23% 23%
Virtual Level Pre-COVID-19
The shifting of the workforce changed the way we worked. Many individuals were at home trying to do the same job, but remotely. The strong differences we see in the Engagement and Workplace Resilience of those who worked remotely before the pandemic lessens when the workforce shifts.
0%–19% 11% 9%
20%–39% 14% 15%
40%–59% 16% 19%
60%–79% 17% 21%
80%–99% 19% 21%
100% 19% 18%
Less Virtual 16% 20%
No Change Virtual 13% 12%
More Virtual 17% 18%
Virtual Level During COVID-19
% FE % HRVirtual
% FE % HRVirtual Now
More/Less/None Virtual Change % FE % HR
47Global Workforce Study Copyright © 2020 ADP, Inc.
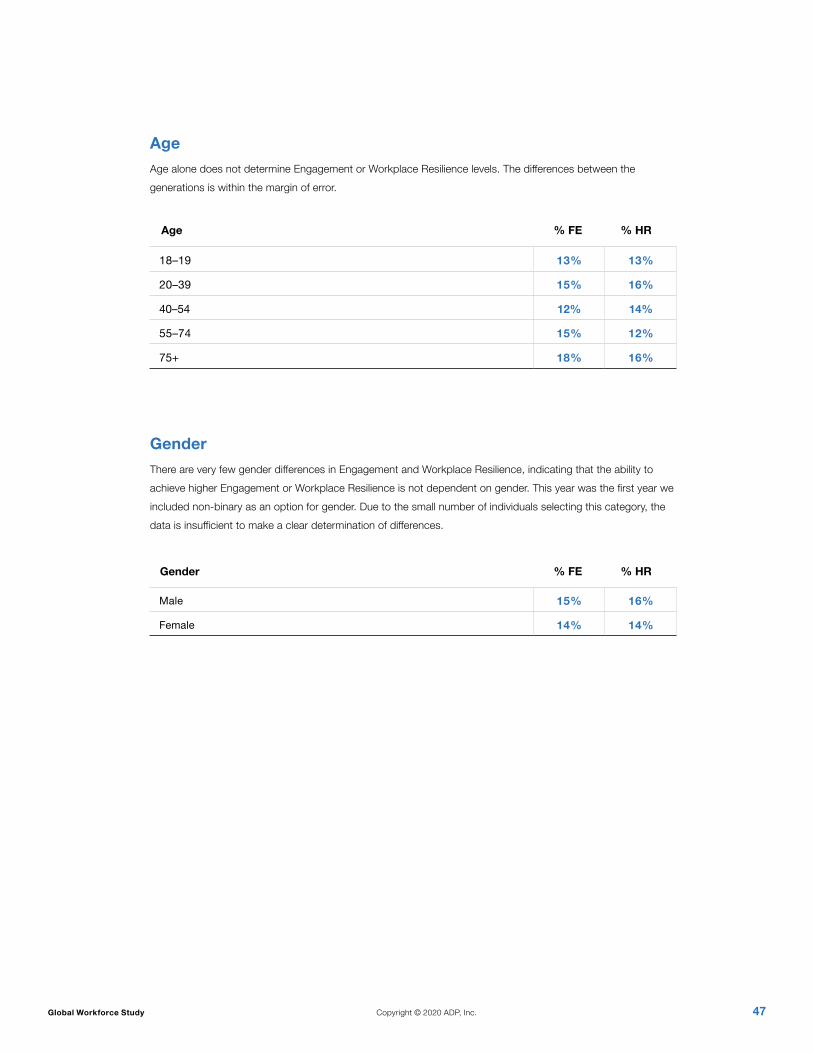
AgeAge alone does not determine Engagement or Workplace Resilience levels. The differences between the generations is within the margin of error.
GenderThere are very few gender differences in Engagement and Workplace Resilience, indicating that the ability to achieve higher Engagement or Workplace Resilience is not dependent on gender. This year was the first year we included non-binary as an option for gender. Due to the small number of individuals selecting this category, the data is insufficient to make a clear determination of differences.
18–19 13% 13%
20–39 15% 16%
40–54 12% 14%
55–74 15% 12%
75+ 18% 16%
Male 15% 16%
Female 14% 14%
% FE % HRAge
% FE % HRGender

48Global Workforce Study Copyright © 2020 ADP, Inc.
TeamAs we found in the 2018 Global Study of Engagement, being a member of a team increases one’s likelihood of being Fully Engaged.
Workers who say they are on a team are 2.6 times more likely to be Fully Engaged.
Virtual teams are reported as the smallest proportion of the types of team, but this might be because most workers who are currently working remotely do not consider this type permanent for their teams.
Dynamic teams are still the most frequently occurring type of team.
Yes, I am a member of one team 15%
Yes, I am a member of two or more teams 14%
No, I am not a member of a team 6%
Static/consistent over time 27.9 16%
Dynamic/changing over time 32.7 19%
Visible on an organizational chart 25.9 19%
Disconnected from organizational hierarchy 10.5 15%
Cross-departmental/cross-functional 24.0 19%
Inclusive of employees and external contractors/vendors 21.0 20%
Virtual 5.6 23%
% FE
% FEFrequency
Team
Team Type

49Global Workforce Study Copyright © 2020 ADP, Inc.
Global Team MembershipApproximately 90% of all respondents are members of teams. China tops the list for the most team-centric country at 97%, and Japan is at the lowest, with only 70% of the respondents being on a team.
China 97% 8%
Saudi Arabia 96% 22%
India 96% 20%
United Arab Emirates 96% 19%
Egypt 95% 14%
Brazil 95% 19%
Mexico 94% 16%
South Korea 94% 6%
Argentina 93% 16%
Singapore 92% 12%
South Africa 92% 20%
Taiwan 92% 8%
Russia 90% 17%
Total 90% 15%
Sweden 90% 12%
Australia 89% 13%
Canada 89% 17%
United Kingdom 88% 16%
Spain 88% 15%
Germany 86% 17%
United States 86% 20%
Israel 86% 16%
France 85% 14%
Italy 85% 12%
Netherlands 81% 13%
Japan 70% 16%
% FEPart of a TeamCountry
50Global Workforce Study Copyright © 2020 ADP, Inc.
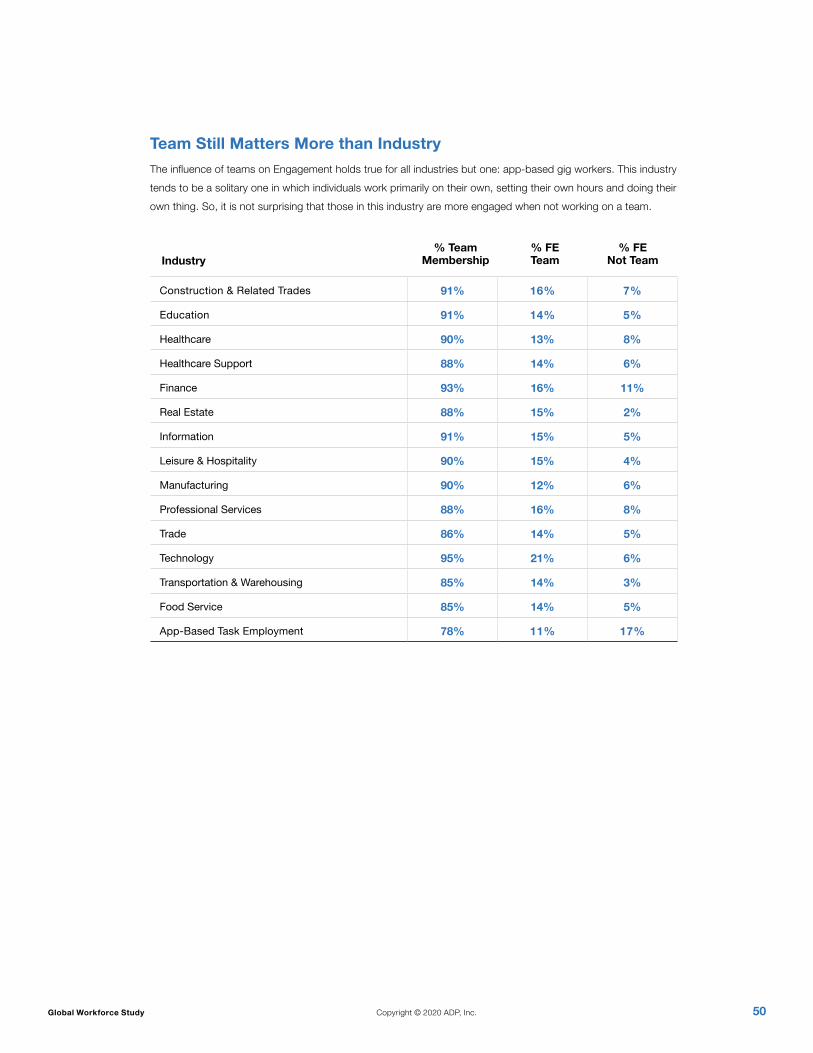
Team Still Matters More than Industry The influence of teams on Engagement holds true for all industries but one: app-based gig workers. This industry tends to be a solitary one in which individuals work primarily on their own, setting their own hours and doing their own thing. So, it is not surprising that those in this industry are more engaged when not working on a team.
Construction & Related Trades 91% 16% 7%
Education 91% 14% 5%
Healthcare 90% 13% 8%
Healthcare Support 88% 14% 6%
Finance 93% 16% 11%
Real Estate 88% 15% 2%
Information 91% 15% 5%
Leisure & Hospitality 90% 15% 4%
Manufacturing 90% 12% 6%
Professional Services 88% 16% 8%
Trade 86% 14% 5%
Technology 95% 21% 6%
Transportation & Warehousing 85% 14% 3%
Food Service 85% 14% 5%
App-Based Task Employment 78% 11% 17%
% FE Team
% FE Not Team
% Team MembershipIndustry

51Global Workforce Study Copyright © 2020 ADP, Inc.
Appendix BSurvey Items

52Global Workforce Study Copyright © 2020 ADP, Inc.
Which of the following best describes your employment status? If you have more than one job, please describe your primary employment.
• 1 Part-time job
• 2 or more Part-time jobs for different companies
• I am self-employed Part-time as a contingent worker (a.k.a. independent contractor, consultant, or freelancer), and I do not work for anyone else
• 1 Full-time job
• I am self-employed Full-time as a contingent worker (a.k.a. independent contractor, consultant, or freelancer), and I do not work for anyone else
• 2 Full-time jobs for different companies
• 1 Full-time job & 1 Part-time job for different companies
• 1 Part-time job & am self-employed Part-time as a contingent worker (a.k.a. independent contractor, consultant, or freelancer).
• 1 Part-time job & am self-employed Full-time as a contingent worker (a.k.a. independent contractor, consultant, or freelancer).
• 1 Full-time job & am self-employed part time as a contingent worker (a.k.a. independent contractor, consultant, or freelancer).
• 1 Full-time job & am self-employed full time as a contingent worker (a.k.a. independent contractor, consultant, or freelancer).
• I am not currently employed. (Drop from survey)
How many employees work for your primary company? Please consider all employees globally, not just your specific location.
• 1–49
• 50–249
• 250–999
• 1000+

53Global Workforce Study Copyright © 2020 ADP, Inc.
In which industry are you currently employed for your primary work?
• Construction and related trades (contractors, project managers, etc.)
• Education (primary, secondary, higher education, technical, daycare)
• Healthcare (in and outpatient, healthcare professionals)
• Healthcare support (family services/patient advocacy, pharmaceuticals, medical devices)
• Finance (banking, insurance, exchanges, brokerages)
• Real estate (including rentals, leasing, etc.)
• Information (publishing, radio, television, telecommunications, motion picture, data processing, hosting, and related services)
• Leisure & hospitality (accommodations/hotels, restaurants/food services, amusement or cultural sites [park, camp, casino, museum, historic, sports], artists/athletes or agents/managers)
• Manufacturing (apparel, beverage, chemical, machinery, textiles, wood, paper, etc.)
• Professional services (advertising/public relations, consulting, business/travel/facilities services, legal, accounting, architectural, engineering, computer systems design, research/scientific/technical services)
• Trade (retail or wholesale — apparel, home/furnishings, home improvement, automotive, office supplies/equipment, electronics/appliances, etc.)
• Technology (including information, ICT, development, administration, support, robotics, data security, automation, AI, applications, devices, e-commerce, database management, operations, etc.)
• Transportation & warehousing (air/rail/water, courier, storage, etc.)
• Food service (servers, cooking staff, delivery drivers, waiters)
• App-based task employment (Uber, Lyft, Door Dash, Shipt, Task Rabbit, etc.)
Which of the following best describes your level within your primary company?
• Upper Management
• Middle Management
• Frontline Management
• Individual Contributor
• Intern/Temporary Employee

54Global Workforce Study Copyright © 2020 ADP, Inc.
Ethnicity Which of the following best describes your family history in the country where you live?
• I am a non-resident alien, immigrant, or visitor.
• My parents immigrated to this country.
• My parents were born in this country, but my grandparents were born somewhere else.
• My grandparents were born in this country.
Gender
• Male
• Female
• Non-binary
• Prefer not to answer
Age
• 18–19
• 20–39
• 40–54
• 55–74
• 75+
What is the highest level of education that you have completed?
• High School diploma/GED
• Some college, no degree
• 2-year degree
• 4-year degree
• Professional or advanced degree
• None of the above

55Global Workforce Study Copyright © 2020 ADP, Inc.
Which, if any, of the following apply to you? (check all that apply)
• Married/Living with partner
• Have child(ren) ages 5 and under
• Have child(ren) ages 6–17
• Have children 18+ living at home
• Have children 18+ who do not live at home
• Caregiver to parents or other adults
• Have a pet
• Volunteer in personal time
• I do not wish to answer
• None of these
How long have you held your current job?
• 0–1 Year (I secured this job before COVID-19)
• 0–1 Year (I had to find new employment due to COVID-19)
• 1–2 Years
• 2–4 Years
• 5–8 Years
• More than 8 Years
What percent of the work you do for your employer is done virtually?
• 0%–19%
• 20%–39%
• 40%–59%
• 60%–79%
• 80%–99%
• 100%

56Global Workforce Study Copyright © 2020 ADP, Inc.
What percent of the work you do for your employer was done virtually before the COVID-19 crisis caused companies to change how work gets done?
• 0%–19%
• 20%–39%
• 40%–59%
• 60%–79%
• 80%–99%
• 100%
Engagement Scale
• I am really enthusiastic about the mission of my company.
• At work, I clearly understand what is expected of me.
• In my team, I am surrounded by people who share my values.
• I have the chance to use my strengths every day at work.
• My teammates have my back.
• I know I will be recognized for excellent work.
• I have great confidence in my company’s future.
• In my work I am always challenged to grow.
Calibration Scale
• My workload is manageable.
• The work I do is important to the success of the company.
• At work, I am satisfied with my job responsibilities.
• I am provided opportunities for growth and development.

57Global Workforce Study Copyright © 2020 ADP, Inc.
Resilience Scale
• I have all the freedom I need to decide how to get my work done.
• No matter what else is going on around me, I can stay focused on getting my work done.
• In the last week, I have felt excited to work every day.
• I always believe that things are going to work out for the best.
• My team leader tells me what I need to know before I need to know it.
• I trust my team leader.
• I am encouraged to take risks.
• Senior leaders are one step ahead of events.
• Senior leaders always do what they say they are going to do.
• I completely trust my company’s senior leaders.
Would you say you are a member of a team at work?
• Yes, I am a member of a team
• Yes, I am a member of two or more teams
• No, I am not a member of a team
How would you describe the team(s) of which you are a part? (check all that apply)
• Static/consistent over time
• Dynamic/changing over time
• Visible on an organizational chart
• Disconnected from organizational hierarchy
• Cross-departmental/cross-functional
• Inclusive of employees and external contractors/vendors
• Virtual

58Global Workforce Study Copyright © 2020 ADP, Inc.
Have you or someone in your immediate community been infected with COVID-19?
• I have contracted COVID-19
• I have not contracted COVID-19 but have underlying health conditions that put me at a higher risk
• Someone else in my household has contracted COVID-19 (e.g., spouse, child, parent)
• A colleague at work has contracted COVID-19
• Someone I know outside of work has contracted COVID-19
• No one in my immediate community has been infected with COVID-19
What type of work do you do? What best describes a typical day at work for you?
• I have a level of freedom to use my expertise to create something new.
• I use a level of expertise to solve similar problems each day.
• I do similar repetitive tasks each day.
When do you think you will feel safe returning to work after COVID-19?
• I continue to go to work as normal during the crisis.
• I have already returned to work.
• I feel safe returning to work now
• I think I will feel safe returning to work in a couple of weeks
• I think I will feel safe returning to work in a month or two
• I will feel safe when my government says it is safe
• I may never feel safe returning to work.
Team Trust
• I can trust my teammates to do what they say they are going to do.
Outside Resilience
• The work I do is important to my sense of purpose in life.
• My workplace is somewhere I feel that I belong.
• The work I do is consistent with my personal values and beliefs.

59Global Workforce Study Copyright © 2020 ADP, Inc.
Team Cohesion
• My teammates always share information.
• We learn from each other on my team.
• I believe everyone on my team values my opinion.
• When my team collaborates, we always create something great.
Trust (Gender)
• My direct supervisor is the same gender as I am.
What changes have occurred for you and your work due to the COVID-19 pandemic? (Select all that apply)
• Sheltered in place due to governmental restrictions
• Physical office space closed
• Job changed to be mostly virtual
• Fewer work hours
• More work hours
• Increased use of technology
• Employees have been furloughed (a temporary layoff from work)
• Layoffs (termination of employment)
• One-time payment from workplace to help with unexpected hardships
• Encouraged to take vacation time
• Promotions placed on hold
60Global Workforce Study Copyright © 2020 ADP, Inc.
What changes do you anticipate will become permanent after the COVID-19 pandemic? (Select all that apply)
• Wearing of personal protective equipment in the workplace (masks and gloves)
• Social Distancing (e.g., reduced number of people in a given location)
• Having my temperature taken by employers
• Changes in work hours
• Remaining as virtual employee
• Physical office spaces closed
• Limits to business travel
• Required quarantine after business or personal travel
• No shared desks
• Physical barriers between desks and cubicle
• Work shift arrangements to limit the number of workers in the office
About ADPPowerful technology plus a human touch. Companies of all types and sizes around the world rely on ADP’s cloud software and expert insights to help unlock the potential of their people. HR. Talent. Benefits. Payroll. Compliance. Working together to build a better workforce. For more information, visit ADP.com.
About the ADP Research Institute®
The ADP Research Institute provides insights to leaders in both the private and public sectors regarding issues in human capital management, employment trends, and workforce strategy. ADPRI.org