glossary reader’s guide reader’s guide corporate … · coo chief operating officer cpg...
TRANSCRIPT

Indicators and use of symbolsWhere relevant, we have used our own company indicators to give a complete and accurate picture of our performance. These are all prefixed “ST”. Also, we have identified a number of Key Performance Indicators (KPIs), which are shown as X.
A detailed table on the inside back cover page provides a summary of the results of all KPIs for the current year.
We have used a few symbols to illustrate:
• thelevelofachievementof our objectives
In progress
Target achieved
No progress
High level objectives are all spe-cified on page 4 and are detailed in sub-level objectives in each section of the report;
• referencestotheweb5• referencestoanotherpagein the report itself M• referencestoourEnvironment, Health and Safety Decalogue j
The ST Corporate Responsibility Report 2008 is printed on paper produced by factories whose environmental management system is ISO 14001 certified.The paper used is entirely chlorine free, and the high recyclability and renewability of the raw material, together with production processes, are optimized for maximum reduction of impact on the environment.
Furthermore the paper used is certified with the ProgramofEndorsementforForestCertification(PEFC),meaningthatthewoodusedtoproduceit (minimum 30%) has come from forests that are well managed according to strict environmental, social and economic standards. The forests of origin have been independently inspected and evaluated according to the principles and criteria that have been agreedandapprovedbyPEFC.
This book is printed on Creator Silk 350g/m2
(cover pages) and 135g/m2 (inside pages) IQnet and AEONOR certify that the organisation Torraspapel, S.A. (Motril) as implemented and maintains an ISO 14001 Environmental Management System.
Certificate Chain of custody of forest Based products N°: PEFC/14-33-00002-B www.pefc.org
APG Automotive Product GroupAPM Analog,PowerandMEMSASD Application Specific DiscreteASIC Application Specific Integrated CircuitbeStick Internal self-assessment toolCCI Computer & Communication InfrastructureCDP Cassa Depositi e PrestitiCEA Commissariatàl’EnergieAtomiqueCEC CorporateEthicsCommitteeCEO ChiefExecutiveOfficerCMOS Complementary MOS (Metal Oxide Semiconductor)CMR Carcinogenic, Mutagenic, toxic for ReproductionCOD Chemical Oxygen DemandCOO ChiefOperatingOfficerCPG Computer Peripherals GroupCR Corporate ResponsibilityCVD-PVD Chemical Vapor Deposition-Physical Vapor DepositionDART Days Away from work, job Restriction, job TransferDNA Deoxyribonucleic acidEcopack® Lead-freelabellingforRoHS- compliance(theEUDirectiveon RestrictiononUseofHazardous Substances)EFQM EuropeanFoundationofQuality ManagementEFTA EuropeanFreeTradeAssociationEICC ElectronicsIndustryCodeofConductEHS Environmental,Health&SafetyEMAS CommunityEco-Managementand Audit SchemeEMS ElectronicManufacturingServices providersePA Online performance appraisal toolEWS ElectricalWaferSortGeSI Global e-Sustainability InitiativeGHG Greenhouse GasesGRI Global Reporting InitiativeHED HomeEntertainment&DisplayHPC Home, Personal and Communication (ST Product Group)HR Human ResourcesH&S Health & SafetyIC Integrated CircuitICB Informatics & Computer BasicsICT Information and Communication- TechnologiesILO InternationalLaborOrganizationIMS Industrial & Multisegment SectorIn-Check™ STLab-on-ChipplatformIP Intellectual PropertyIPAD Integrated Passive and Active DevicesISO International Organization for StandardizationKPI Key Performance IndicatorLOP LocalOperatingProceduresMEMS Micro-Electro-MechanicalSystems
MMS Microcontrolers, Memories & SmartcardsMOSFET MetalOxideSemiconductorField EffectTransistorMPG Memory Products GroupMTCE MetricTonsofCarbonEquivalentNAND Not AndNGO Non-Governmental OrganizationNOR Not OrNOX Nitrogen OxidesODM Original Design ManufacturersODS Ozone depleting SubstancesOEM OriginalEquipmentManufacturersOHS Occupational Health & SafetyOHSAS Occupational Health & Safety Assessment Series (OHSAS 18001)OSHA Occupational Safety & Health AdministrationintheUnitedStatesPFCs Perfluorinated CompoundsPFOs Perfluoro-octane SulfonateR&D Research & DevelopmentR11 ChloroFluoroCarbon (CFC) and is also called CFC 11. It is an Ozone Depleting Substance. Its chemical name is Trichlorofluoromethane.RC Recordable case rateREACH Registration,Evaluationand Authorization of ChemicalsRoHS Restriction of Hazardous SubstancesSAM Serviceable Available MarketSE SustainableExcellenceSIA Semiconductor Industry AssociationSoC System-on-ChipSOP Standard Operating ProceduresSOX Sulfur OxidesSR Severity RateSRI Socially Responsible InvestmentSTU STUniversityTCE TonsofCarbonEquivalentTQM TotalQualityManagementUSAs UnvestedStockAwardsUSGAAP USGenerallyAcceptedAccounting PrinciplesUWEEI UnitedWorkersofElectronicand ElectricalIndustriesVOCs Volatile Organic CompoundsWBCSC World Business Council for Sustainable DevelopmentWEEE WasteofElectricalandElectronic EquipmentWSC World Semiconductor Council20-F Annual report filed with the SecuritiesandExchangeCommission
GRI indicator prefixesEC EconomicImpactEN EnvironmentHR Human RightsLA EmploymentPR Product ResponsibilitySO Society
ST indicator prefixesST CompanySTE EconomicsSTEV EnvironmentSTHR Human RightsSTHS Health & SafetySTS SocialSTSC Supply ChainSTSO CompanySTPR Product Responsibility
Reader’sguideReader’sguideGlossary
Report scope and profileThis is a report of how responsibly we have performed as a company in the calendar year 2008.ItcoversallSTMicroelectronicsNV’sactivitiesandsites,unlessotherwisestated.YoucanfinddetailsaboutST’s structure and countries of operation in the chart on page 1. For other information you can access reports from previous years at http://www.st.com/stonline/company/cr/reports/index.htm.ThenameofourglobalorganizationhaschangedfromTotalQualityandCorporateResponsibility(TQCR)toQuality,EducationandSustainableDevelopment(QES).TheCorporateResponsibilitydepartmentispartofthisorganization.
AccessibilityThis printed Corporate Responsibility Report details STMicroelectronics Corporate Responsibility performance and shows how ourcompanyintegratesSustainableExcellenceinitsstrategyanddailyactivity.As with previous reports, we have presented some concrete examples from sites, regions, product groups and central organiza-tions to illustrate not just our performance but also the challenges we face, and the growing company-wide awareness of corporate responsibility this reflects.These lessons and experience gained from these examples are relevant not just to the sole country or site explicitly detailed. Often, there is a company strategy and each year, we select some specific examples to illustrate it and involve ST sites and organizations. ThereportispublishedinEnglishonly.This report is printed and is also accessible on the web and can be downloaded in PDF format at http://www.st.com/stonline/company/cr/reports/index.htm. Our website has been significantly updated, providing new information about our Corporate Responsibility strategy and performance.
MaterialityIn order to define material issues of most relevance and interest for our audience, for the past two years we have organized specific sessions to get feedback from our stakeholders:• wetookintoaccountspontaneousfeedback(email,webrequests);• weorganized11phoneinterviewswithexternalstakeholders(includingcustomers,businesspartners,academics, SRI analysts, government, the Corporate Responsibility community and major companies); • wehaveconductedregularfollow-upsessionsonrulesandregulations;• wehaveconductedhigh-levelbenchmarking;• wehaveinterviewedST’sVicePresidentsinvolvedinthekeyissueslinkedtoSustainableExcellence;• wehavelaunchedasuccessfulinternalsurvey,witharound228managersgivingustheirfeedback;• wehavekepttrackof,andtriedtoanticipate,therulesandregulationsbeingputinplaceatworldwidelevel.For more clarity, we have decided to publish a special focus to show how we have defined our material issues (pages 4 and 5).
We are aware that the Disclosure on Management Approach for each section is very important to help you understand how we manage material issues and potential risks. As our management approach is very stable and does not need an annual update, we have decided to publish it, in some detail, on the web only. 5 See more on www.st.com/stonline/company/sd/index.htm
AssuranceAsinpreviousyears,BureauVeritasCertificationhasprovidedassuranceservicestous,includingverifyingallourSocial,Envi-ronment Health and Safety indicators.Auditing by Bureau Veritas Certification takes place at two levels in the company. First, the auditing team verifies data collection andconsolidationprocessesbycheckingcorporateleveldata.Secondthesefiguresareverifiedatagivenlocalsite.Eachyearwechooseadifferentsite,andin2008theTourssite,France,wasaudited.This is a good method for us to check the relevancy and accuracy of processes in place and so to guarantee data integrity.
M You can find details of our verification processes on page 64
Adherence to GRI and the UN Global CompactThis report is prepared and presented in accordance with the 2006 Global Reporting (GRI) G3 Guidelines, with an A+ self-declared rating checked and confirmed by GRI. If G3 indicators are not applicable or relevant to us we explain why we do not report on them either in the text and/or in the indicator index in the html version of this report. We use our
ownindicatorstorespondtoortosupplementGRIindicators(seebelow).WealsoendorsetheprinciplesoftheUnitedNationsGlobal Compact. This report describes actions we have taken to implement these principles, and serves as our Communication on Progress.On the back cover flap, there is an index that links GRI, Global Compact and ST indicators to related information in this report.
Give us your feedbackWe are committed to improving both our Corporate Responsibi-lity Performance and the ways we communicate with our stakeholders. We encourage contributions and debate from all stakeholders and welcome feedback on the content and presentation of this report – as well as suggestions for next year.
In order to get your feedback, we have developed an online form, available at http://www.st.com/stonline/company/sd/contact.htm, please do not hesitate to use this for any comments.
Of course, you can also contact us directly at [email protected] or contact:
Kate Rigge
STMicroelectronics CorporateHeadquarters 39, Chemin du Champ-des-Filles – C.P. 21 CH-1228Geneva–Plan-Les-Ouates Switzerland
Corporate Responsibility Report A culture of Sustainable Excellence
STM
icro
elec
tron
ics
Corp
orat
e Re
spon
sibi
lity
Repo
rt 2
008
A C
ultu
re o
f Sus
tain
able
Exc
elle
nce
Report on:1.1 2.1 - 2.103.1 - 3.8, 3.10 - 3.124.1 - 4.4, 4.14 - 4.15
Report on criteria listed for Level C plus: 1.23,9, 3,134.5 - 4.13, 4.16 - 4.17
Same as requirement for Level B
Not Required Management Approach Disclosures for each Indicator Category
Management Approach Disclosures for each Indicator Category
Report on a minimum of 10 Performance Indicators, including at least one from each of: Economic, Social and Environmental.
Report on a minimum of 20 Performance Indicators, at least one from each of Economic, Environmental, Human Rights, Labor, Society, Product Responsibility.
Report on each core G3 and Sector Supplement* Indicatorwith due regard to the Material- ity Principle by either: a)report- ing on the Indicator or b) explaining the reason for its omission.
ReportæApplicationæ Level C C+ B B+ A A+
Repo
rtæEx
terna
llyæA
ssure
d
Repo
rtæEx
terna
llyæA
ssure
d
Repo
rtæEx
terna
llyæA
ssure
d
OU
TPU
TO
UTP
UT
OU
TPU
T
G3 Profile Disclosures
G3 Management Approach
Disclosure
G3 Performance Indicators &
Sector Supplement Performance Indicators
Stand
ardæD
isclos
ures
5 For more detail, see the html version of the report
STMicroelectronics

Indicators and use of symbolsWhere relevant, we have used our own company indicators to give a complete and accurate picture of our performance. These are all prefixed “ST”. Also, we have identified a number of Key Performance Indicators (KPIs), which are shown as X.
A detailed table on the inside back cover page provides a summary of the results of all KPIs for the current year.
We have used a few symbols to illustrate:
• thelevelofachievementof our objectives
In progress
Target achieved
No progress
High level objectives are all spe-cified on page 4 and are detailed in sub-level objectives in each section of the report;
• referencestotheweb5• referencestoanotherpagein the report itself M• referencestoourEnvironment, Health and Safety Decalogue j
The ST Corporate Responsibility Report 2008 is printed on paper produced by factories whose environmental management system is ISO 14001 certified.The paper used is entirely chlorine free, and the high recyclability and renewability of the raw material, together with production processes, are optimized for maximum reduction of impact on the environment.
Furthermore the paper used is certified with the ProgramofEndorsementforForestCertification(PEFC),meaningthatthewoodusedtoproduceit (minimum 30%) has come from forests that are well managed according to strict environmental, social and economic standards. The forests of origin have been independently inspected and evaluated according to the principles and criteria that have been agreedandapprovedbyPEFC.
This book is printed on Creator Silk 350g/m2
(cover pages) and 135g/m2 (inside pages) IQnet and AEONOR certify that the organisation Torraspapel, S.A. (Motril) as implemented and maintains an ISO 14001 Environmental Management System.
Certificate Chain of custody of forest Based products N°: PEFC/14-33-00002-B www.pefc.org
APG Automotive Product GroupAPM Analog,PowerandMEMSASD Application Specific DiscreteASIC Application Specific Integrated CircuitbeStick Internal self-assessment toolCCI Computer & Communication InfrastructureCDP Cassa Depositi e PrestitiCEA Commissariatàl’EnergieAtomiqueCEC CorporateEthicsCommitteeCEO ChiefExecutiveOfficerCMOS Complementary MOS (Metal Oxide Semiconductor)CMR Carcinogenic, Mutagenic, toxic for ReproductionCOD Chemical Oxygen DemandCOO ChiefOperatingOfficerCPG Computer Peripherals GroupCR Corporate ResponsibilityCVD-PVD Chemical Vapor Deposition-Physical Vapor DepositionDART Days Away from work, job Restriction, job TransferDNA Deoxyribonucleic acidEcopack® Lead-freelabellingforRoHS- compliance(theEUDirectiveon RestrictiononUseofHazardous Substances)EFQM EuropeanFoundationofQuality ManagementEFTA EuropeanFreeTradeAssociationEICC ElectronicsIndustryCodeofConductEHS Environmental,Health&SafetyEMAS CommunityEco-Managementand Audit SchemeEMS ElectronicManufacturingServices providersePA Online performance appraisal toolEWS ElectricalWaferSortGeSI Global e-Sustainability InitiativeGHG Greenhouse GasesGRI Global Reporting InitiativeHED HomeEntertainment&DisplayHPC Home, Personal and Communication (ST Product Group)HR Human ResourcesH&S Health & SafetyIC Integrated CircuitICB Informatics & Computer BasicsICT Information and Communication- TechnologiesILO InternationalLaborOrganizationIMS Industrial & Multisegment SectorIn-Check™ STLab-on-ChipplatformIP Intellectual PropertyIPAD Integrated Passive and Active DevicesISO International Organization for StandardizationKPI Key Performance IndicatorLOP LocalOperatingProceduresMEMS Micro-Electro-MechanicalSystems
MMS Microcontrolers, Memories & SmartcardsMOSFET MetalOxideSemiconductorField EffectTransistorMPG Memory Products GroupMTCE MetricTonsofCarbonEquivalentNAND Not AndNGO Non-Governmental OrganizationNOR Not OrNOX Nitrogen OxidesODM Original Design ManufacturersODS Ozone depleting SubstancesOEM OriginalEquipmentManufacturersOHS Occupational Health & SafetyOHSAS Occupational Health & Safety Assessment Series (OHSAS 18001)OSHA Occupational Safety & Health AdministrationintheUnitedStatesPFCs Perfluorinated CompoundsPFOs Perfluoro-octane SulfonateR&D Research & DevelopmentR11 ChloroFluoroCarbon (CFC) and is also called CFC 11. It is an Ozone Depleting Substance. Its chemical name is Trichlorofluoromethane.RC Recordable case rateREACH Registration,Evaluationand Authorization of ChemicalsRoHS Restriction of Hazardous SubstancesSAM Serviceable Available MarketSE SustainableExcellenceSIA Semiconductor Industry AssociationSoC System-on-ChipSOP Standard Operating ProceduresSOX Sulfur OxidesSR Severity RateSRI Socially Responsible InvestmentSTU STUniversityTCE TonsofCarbonEquivalentTQM TotalQualityManagementUSAs UnvestedStockAwardsUSGAAP USGenerallyAcceptedAccounting PrinciplesUWEEI UnitedWorkersofElectronicand ElectricalIndustriesVOCs Volatile Organic CompoundsWBCSC World Business Council for Sustainable DevelopmentWEEE WasteofElectricalandElectronic EquipmentWSC World Semiconductor Council20-F Annual report filed with the SecuritiesandExchangeCommission
GRI indicator prefixesEC EconomicImpactEN EnvironmentHR Human RightsLA EmploymentPR Product ResponsibilitySO Society
ST indicator prefixesST CompanySTE EconomicsSTEV EnvironmentSTHR Human RightsSTHS Health & SafetySTS SocialSTSC Supply ChainSTSO CompanySTPR Product Responsibility
Reader’sguideReader’sguideGlossary
Report scope and profileThis is a report of how responsibly we have performed as a company in the calendar year 2008.ItcoversallSTMicroelectronicsNV’sactivitiesandsites,unlessotherwisestated.YoucanfinddetailsaboutST’s structure and countries of operation in the chart on page 1. For other information you can access reports from previous years at http://www.st.com/stonline/company/cr/reports/index.htm.ThenameofourglobalorganizationhaschangedfromTotalQualityandCorporateResponsibility(TQCR)toQuality,EducationandSustainableDevelopment(QES).TheCorporateResponsibilitydepartmentispartofthisorganization.
AccessibilityThis printed Corporate Responsibility Report details STMicroelectronics Corporate Responsibility performance and shows how ourcompanyintegratesSustainableExcellenceinitsstrategyanddailyactivity.As with previous reports, we have presented some concrete examples from sites, regions, product groups and central organiza-tions to illustrate not just our performance but also the challenges we face, and the growing company-wide awareness of corporate responsibility this reflects.These lessons and experience gained from these examples are relevant not just to the sole country or site explicitly detailed. Often, there is a company strategy and each year, we select some specific examples to illustrate it and involve ST sites and organizations. ThereportispublishedinEnglishonly.This report is printed and is also accessible on the web and can be downloaded in PDF format at http://www.st.com/stonline/company/cr/reports/index.htm. Our website has been significantly updated, providing new information about our Corporate Responsibility strategy and performance.
MaterialityIn order to define material issues of most relevance and interest for our audience, for the past two years we have organized specific sessions to get feedback from our stakeholders:• wetookintoaccountspontaneousfeedback(email,webrequests);• weorganized11phoneinterviewswithexternalstakeholders(includingcustomers,businesspartners,academics, SRI analysts, government, the Corporate Responsibility community and major companies); • wehaveconductedregularfollow-upsessionsonrulesandregulations;• wehaveconductedhigh-levelbenchmarking;• wehaveinterviewedST’sVicePresidentsinvolvedinthekeyissueslinkedtoSustainableExcellence;• wehavelaunchedasuccessfulinternalsurvey,witharound228managersgivingustheirfeedback;• wehavekepttrackof,andtriedtoanticipate,therulesandregulationsbeingputinplaceatworldwidelevel.For more clarity, we have decided to publish a special focus to show how we have defined our material issues (pages 4 and 5).
We are aware that the Disclosure on Management Approach for each section is very important to help you understand how we manage material issues and potential risks. As our management approach is very stable and does not need an annual update, we have decided to publish it, in some detail, on the web only. 5 See more on www.st.com/stonline/company/sd/index.htm
AssuranceAsinpreviousyears,BureauVeritasCertificationhasprovidedassuranceservicestous,includingverifyingallourSocial,Envi-ronment Health and Safety indicators.Auditing by Bureau Veritas Certification takes place at two levels in the company. First, the auditing team verifies data collection andconsolidationprocessesbycheckingcorporateleveldata.Secondthesefiguresareverifiedatagivenlocalsite.Eachyearwechooseadifferentsite,andin2008theTourssite,France,wasaudited.This is a good method for us to check the relevancy and accuracy of processes in place and so to guarantee data integrity.
M You can find details of our verification processes on page 64
Adherence to GRI and the UN Global CompactThis report is prepared and presented in accordance with the 2006 Global Reporting (GRI) G3 Guidelines, with an A+ self-declared rating checked and confirmed by GRI. If G3 indicators are not applicable or relevant to us we explain why we do not report on them either in the text and/or in the indicator index in the html version of this report. We use our
ownindicatorstorespondtoortosupplementGRIindicators(seebelow).WealsoendorsetheprinciplesoftheUnitedNationsGlobal Compact. This report describes actions we have taken to implement these principles, and serves as our Communication on Progress.On the back cover flap, there is an index that links GRI, Global Compact and ST indicators to related information in this report.
Give us your feedbackWe are committed to improving both our Corporate Responsibi-lity Performance and the ways we communicate with our stakeholders. We encourage contributions and debate from all stakeholders and welcome feedback on the content and presentation of this report – as well as suggestions for next year.
In order to get your feedback, we have developed an online form, available at http://www.st.com/stonline/company/sd/contact.htm, please do not hesitate to use this for any comments.
Of course, you can also contact us directly at [email protected] or contact:
Kate Rigge
STMicroelectronics CorporateHeadquarters 39, Chemin du Champ-des-Filles – C.P. 21 CH-1228Geneva–Plan-Les-Ouates Switzerland
STMicroelectronics
Corporate Responsibility Report A culture of Sustainable Excellence
STM
icro
elec
tron
ics
Corp
orat
e Re
spon
sibi
lity
Repo
rt 2
008
A C
ultu
re o
f Sus
tain
able
Exc
elle
nce
Report on:1.1 2.1 - 2.103.1 - 3.8, 3.10 - 3.124.1 - 4.4, 4.14 - 4.15
Report on criteria listed for Level C plus: 1.23,9, 3,134.5 - 4.13, 4.16 - 4.17
Same as requirement for Level B
Not Required Management Approach Disclosures for each Indicator Category
Management Approach Disclosures for each Indicator Category
Report on a minimum of 10 Performance Indicators, including at least one from each of: Economic, Social and Environmental.
Report on a minimum of 20 Performance Indicators, at least one from each of Economic, Environmental, Human Rights, Labor, Society, Product Responsibility.
Report on each core G3 and Sector Supplement* Indicatorwith due regard to the Material- ity Principle by either: a)report- ing on the Indicator or b) explaining the reason for its omission.
Report¾Application¾ Level C C+ B B+ A A+
Repo
rt¾Ex
terna
lly¾A
ssure
d
Repo
rt¾Ex
terna
lly¾A
ssure
d
Repo
rt¾Ex
terna
lly¾A
ssure
d
OU
TPU
TO
UTP
UT
OU
TPU
T
G3 Profile Disclosures
G3 Management Approach
Disclosure
G3 Performance Indicators &
Sector Supplement Performance Indicators
Stand
ard¾D
isclos
ures
5 For more detail, see the html version of the report

This index shows where to find full or partial information relating to the Global Reporting Initiative (GRI) core elements and indicators in this report. GRI indicators are shown in the color of the section in which they belong. This index also shows where to find information relating to ST’s own performance indicators. These are all prefixed ‘ST’ and shown in black print. ST has identified a number of Key Performance Indicators (KPIs), which are shown as X. All KPIs have been verified and validated by Bureau Veritas Certification, France.
Information about the Global Compact principles can be found in the html version of this report.
Performance indicators (Social, H&S, Environment) found in this report are verified by Bureau Veritas Certification France.
2008 Key Performance IndicatorsST’s indicators 2006 2007 2008
Company
Percentage of eligible employees who signed the Business Conduct and Ethics Policy (%) STS01 NA 88 92
Economic
Net revenues (US$m) ST1 9,854 10,001 9,842
Net earnings (US$m) ST2 782 (477) (786)
Gross profit (US$m) ST3 3,523 3,536 3,560
Earnings per share (diluted) (US$) ST4 0.83 (0.53) (0.88)
Gross profit as a percentage of sales (%) ST5 35.80 35.40 36.20
Market share versus SAM (Serviceable Available Market) (%) ST6 5.70 5.70 6.10
R&D expenditures (US$m) STE4 1,668 1,802 2,152
R&D overall headcount evolution STE5 10,300 10,341 11,162
R&D engineers and technicians STE5 7,195 10,253 11,084
ST patent applications filed by region STE6 607 497 485
Social
Rate of employee turnover ST12 8.79 8.81 10.12
Job creation / hires by job type ST12 7,554 6,212 11,889
People recognized STS26 77,390 50,171 38,805
Accepted suggestions which were implemented (%) STS34 39 62 61
Average number of meetings in each organization or site during which management presents company/organization/site results to all employees allowing time for open discussion
STS34a 9 10 10
Average training hours for professionals STS15 30 35 27
Employee having received > 35 hrs training/year STS18 37 48 36
Professionals by gender (Men / Women) STS10 80/20 79/21 78/22
Number of partnerships with universities, colleges, schools STS44 236 335 437
Total cash donated to charitable associations STS39 271 444 463
Health & Safety
Recordable case rate STHS1 0.59 0.49 0.39
Severity rate STHS2 8.6 6.7 5.5
Environment
Consumption of electricity (per unit of production): normalized values (kWh) STEV31 54.3 52.3 49.7
Consumption of water (per unit of production): normalized values (m3) STEV56 31.3 29.5 27.3
Landfill waste (m3 /production unit) STEV71 4.8 5.5 3.6
CO² emission (PFC+energy+transportation) (kTons) STEV47 2,009 1,668 1,453
Product Responsibility
Customer complaints (per million units shipped) (baseline 100 in 2004) STPR2 71.6 64.2 82.6
Cycle time to process failure analysis (in days) (baseline 100 in 2004) STPR3 62.6 71.9 62.2
Customer returns (as a percentage of billings) (baseline 100 in 2004) STPR4 38.3 40.0 33.7
Supply Chain
Suppliers environmental performance (% of suppliers certified) STSC4b 74.1 79.9 84.1
Indicator reference Content PagesCompany1.1 Chief executive statement 3, 4
1.2 Key impacts, risks and opportunities 3, 4, 5, 9
2 Organizational profile Reader’s guide, 1, 11, 18, 24-25,30,35,41,43
3.1-3.4 Report profile Reader’s guide
3.5-3.11 Report scope and boundary Reader’s guide, inside front cover, 1, 4-5, 18-21, 22-24, 30-35, 46-51, 57, 61-63
3.12 GRI content index Inside flap
3.13 Assurance 64
4.1-4.3, 4.6, 4.8, 4.9 Governance 10-13, 58
4.12-4.13 Commitments to external initiatives 5, 58
4.14-4.17 Stakeholder engagement Reader’s guide, 4-5, 16, 28-29, 58-63
S01 Community 24-25, 28-29, 35, 39, 47
S02, S03, S04, HR4, X STS01 Corruption 10-13
S05, SO8, HR3 Public Policy and compliance 26-27, 36, 58-59, 63
EconomicEC1, STE7, STE8, STE9, STE11 Economic performance 19-20, 37
EC2 Financial implication and other risks and opportunities due to climate change
46, 52-53, 57
EC6, X STE1, STE10 Market presence 20, 59, 62-63,
EC8, EC9, X STS39, STS39a, STS43 Indirect economic impacts 15, 20, 28-29, 37
STE3, X STS44, X STE4, X STE5, X STE6 Sustainable Innovation 21, 35
SocialLA1, LA2, ST12, STS6 Employment 31
LA4, STHR4, STHR5, STHR6, X STS36, STHR7, X STS34a, STS38 Labor and management relations 34
LA6, LA7, LA8, X STHS1, X STHS2, STH6, STHS 11, STHS12, STSHS13, STEV67, STEV68, j 9.1, 9.3
Occupational Health & Safety 37-39
LA10, LA11, LA12, X STS15, STS16, STS17, X STS18, STS21a, STS21b Training and Education 23, 25, 33
X STS26, STS28, X STS28a, STS28b, X STS34, STS47 Employee empowerment and engagement 32
LA13, STS8, STS9, X STS10, STS11, STS12, STS12a, STS12b Diversity and equal opportunity 31
EnvironmentEN1, EN3, EN4, EN5, EN7, EN8, EN10, EN30, STEV6, STEV8, X STEV31,STEV35, STEV37, X STEV56, STEV58, STEV64, j 2.1, 2.2, 2.3, 3.1, 5.1
Material, energy, water; expenditure and investment
42-43, 44-45, 46-51
EN12, EN16, EN17, EN18, EN19, EN20, EN21, EN22, EN23, EN24, EN28, EN29, EN30, STEV19, STEV21, STEV27, STEV40 STEV46, X STEV47, STEV48, STEV52, X STEV71, STEV72, j 3.3, 3.4, 4.1, 4.3, 4.4, 8.1, 10.3, 10.4
Emissions, effluents and waste; Compliance; Transport
44-45, 46, 48-51
EN6, EN26, STPR1 Products and service 41, 54-55, 57
Product ResponsibilityEN27, PR1, PR3, PR5, STEV78, STEV79, X STPR2, X STPR3, X STPR4 Customer Health & Safety; product and
service labeling41, 57, 60, 62
Supply chainHR2, X STSC1, STSC2, STSC9 Supply chain management 61-63
This report is in accordance with the 2006 Global Reporting Initiative (GRI) G3 Guidelines, with an A+ self-declared rating checked and confirmed by GRI.
supply chain
Change in ST scope
in 2008
MarchSTMicroelectronics, Intel and Francisco Partners create Numonyx in Flash memory segment.
Number of ST employees involved: 4,132 Countries where employees are based: Italy, Singapore and Malaysia
Final application of our products
Communication
Computer
JanuaryST acquires Genesis Microchip, strengthening its position as a semiconductor technology leader in the consumer electronics market.
Number of Genesis employees involved: 663
Countries where employees are based: US, Canada, India, Singapore, China, Korea, Taiwan, Japan
JulySTMicroelectronics and NXP merge wireless businesses to expand product breadth and boost innovation.
Number of ST employees involved: 2,681
Countries where employees are based: Belgium, Brazil, Canada, China, Czech Republic, Finland, France, Germany, India, Ireland, Italy, Japan, Korea, Malaysia, Mexico, Morocco, Netherlands, Norway, Philippines, Portugal, Singapore, Sweden, Switzerland, Taiwan, Turkey, UK and USA
Silicon ingot
Assembly & test
ChipWafer processing
SuppliersManufacturing Front-end
R&D Conception Design
Assembly line & final test Back-end
Business customer
We have built strong partnerships with many suppliers and subcontractors from whom we purchase raw materials, equipment, energy, gas, chemicals and services.
New products conception is the result of several steps, the design of the architecture and electrical layout, electrical and logical simulations, drawing of components and generation of reticles (circuit drawings).
The manufacturing of chips is a process of around 400 separate stages in several workshops. Starting with a plain silicon wafer, the Front-end manufacturing results in the etching of several hundreds to thousands dice, depending on the end product and the used technology.
The dice are cut from the silicon wafer before being assembled in a package. The chips are then tested prior to delivery to the customer.
how do we create a chip
Maskcreation
We offer a broad range of products and we serve a wide range of custo-mers that are leading companies in the fields of communications, consumer goods, automobile manufacture, computers and other industry sectors.
ST R&D and Manufacturing
Consumer
Automotive
Industrial
ST’s sales are well balanced between the industry’s five major high-growth sectors:
Company performance I Key performance indicators Company performance I Indicator index
5 The html Indicator Index gives more detailed information with: •additionalreferencestotheseindicators(htmlreport,20-F,www.st.com) •referencestoadditionalSTandGRIindicators •explanationwhenGRIindicatorsarenotreportedon.
5 FormoreinformationontheGRIApplicationlevels,see:www.globalreporting.org/ GRIReports/ApplicationLevels/

This index shows where to find full or partial information relating to the Global Reporting Initiative (GRI) core elements and indicators in this report. GRIindicatorsareshowninthecolorofthesectioninwhichtheybelong.ThisindexalsoshowswheretofindinformationrelatingtoST’sownperformanceindicators.Theseareallprefixed‘ST’andshowninblackprint. ST has identified a number of Key Performance Indicators (KPIs), which are shown as X. All KPIs have been verified and validated by Bureau Veritas Certification, France.
Information about the Global Compact principles can be found in the html version of this report.
Performanceindicators(Social,H&S,Environment)foundinthisreportareverifiedbyBureauVeritasCertificationFrance.
2008 Key Performance IndicatorsST’s indicators 2006 2007 2008
Company
PercentageofeligibleemployeeswhosignedtheBusinessConductandEthicsPolicy(%) STS01 NA 88 92
Economic
Netrevenues(US$m) ST1 9,854 10,001 9,842
Netearnings(US$m) ST2 782 (477) (786)
Grossprofit(US$m) ST3 3,523 3,536 3,560
Earningspershare(diluted)(US$) ST4 0.83 (0.53) (0.88)
Gross profit as a percentage of sales (%) ST5 35.80 35.40 36.20
Market share versus SAM (Serviceable Available Market) (%) ST6 5.70 5.70 6.10
R&Dexpenditures(US$m) STE4 1,668 1,802 2,152
R&D overall headcount evolution STE5 10,300 10,341 11,162
R&D engineers and technicians STE5 7,195 10,253 11,084
ST patent applications filed by region STE6 607 497 485
Social
Rate of employee turnover ST12 8.79 8.81 10.12
Job creation / hires by job type ST12 7,554 6,212 11,889
People recognized STS26 77,390 50,171 38,805
Accepted suggestions which were implemented (%) STS34 39 62 61
Average number of meetings in each organization or site during which management presents company/organization/site results to all employees allowing time for open discussion
STS34a 9 10 10
Average training hours for professionals STS15 30 35 27
Employeehavingreceived>35hrstraining/year STS18 37 48 36
Professionals by gender (Men / Women) STS10 80/20 79/21 78/22
Number of partnerships with universities, colleges, schools STS44 236 335 437
Total cash donated to charitable associations STS39 271 444 463
Health & Safety
Recordable case rate STHS1 0.59 0.49 0.39
Severity rate STHS2 8.6 6.7 5.5
Environment
Consumption of electricity (per unit of production): normalized values (kWh) STEV31 54.3 52.3 49.7
Consumption of water (per unit of production): normalized values (m3) STEV56 31.3 29.5 27.3
Landfillwaste(m3 /production unit) STEV71 4.8 5.5 3.6
CO² emission (PFC+energy+transportation) (kTons) STEV47 2,009 1,668 1,453
Product Responsibility
Customer complaints (per million units shipped) (baseline 100 in 2004) STPR2 71.6 64.2 82.6
Cycle time to process failure analysis (in days) (baseline 100 in 2004) STPR3 62.6 71.9 62.2
Customer returns (as a percentage of billings) (baseline 100 in 2004) STPR4 38.3 40.0 33.7
Supply Chain
Suppliers environmental performance (% of suppliers certified) STSC4b 74.1 79.9 84.1
Indicator reference Content PagesCompany1.1 Chief executive statement 3, 4
1.2 Key impacts, risks and opportunities 3, 4, 5, 9
2 Organizational profile Reader’sguide,1,11,18, 24-25,30,35,41,43
3.1-3.4 Report profile Reader’sguide
3.5-3.11 Report scope and boundary Reader’sguide,insidefrontcover, 1, 4-5, 18-21, 22-24, 30-35, 46-51, 57, 61-63
3.12 GRI content index Inside flap
3.13 Assurance 64
4.1-4.3, 4.6, 4.8, 4.9 Governance 10-13, 58
4.12-4.13 Commitments to external initiatives 5, 58
4.14-4.17 Stakeholder engagement Reader’sguide,4-5,16, 28-29, 58-63
S01 Community 24-25, 28-29, 35, 39, 47
S02, S03, S04, HR4, X STS01 Corruption 10-13
S05, SO8, HR3 Public Policy and compliance 26-27, 36, 58-59, 63
EconomicEC1, STE7, STE8, STE9, STE11 Economicperformance 19-20, 37
EC2 Financial implication and other risks and opportunities due to climate change
46, 52-53, 57
EC6, X STE1, STE10 Market presence 20, 59, 62-63,
EC8, EC9, X STS39, STS39a, STS43 Indirect economic impacts 15, 20, 28-29, 37
STE3, X STS44, X STE4, X STE5, X STE6 Sustainable Innovation 21, 35
SocialLA1, LA2, ST12, STS6 Employment 31
LA4, STHR4, STHR5, STHR6, X STS36, STHR7, X STS34a, STS38 Laborandmanagementrelations 34
LA6, LA7, LA8, X STHS1, X STHS2, STH6, STHS 11, STHS12, STSHS13, STEV67, STEV68, j 9.1, 9.3
Occupational Health & Safety 37-39
LA10, LA11, LA12, X STS15, STS16, STS17, X STS18, STS21a, STS21b TrainingandEducation 23, 25, 33
X STS26, STS28, X STS28a, STS28b, X STS34, STS47 Employeeempowermentandengagement 32
LA13, STS8, STS9, X STS10, STS11, STS12, STS12a, STS12b Diversityandequalopportunity 31
EnvironmentEN1, EN3, EN4, EN5, EN7, EN8, EN10, EN30, STEV6, STEV8, X STEV31,STEV35, STEV37, X STEV56, STEV58, STEV64, j 2.1, 2.2, 2.3, 3.1, 5.1
Material, energy, water; expenditure and investment
42-43, 44-45, 46-51
EN12, EN16, EN17, EN18, EN19, EN20, EN21, EN22, EN23, EN24, EN28, EN29, EN30, STEV19, STEV21, STEV27, STEV40 STEV46, X STEV47, STEV48, STEV52, X STEV71, STEV72, j 3.3, 3.4, 4.1, 4.3, 4.4, 8.1, 10.3, 10.4
Emissions,effluentsandwaste;Compliance;Transport
44-45, 46, 48-51
EN6, EN26, STPR1 Products and service 41, 54-55, 57
Product ResponsibilityEN27, PR1, PR3, PR5, STEV78, STEV79, X STPR2, X STPR3, X STPR4 Customer Health & Safety; product and
service labeling41, 57, 60, 62
Supply chainHR2, X STSC1, STSC2, STSC9 Supply chain management 61-63
This report is in accordance with the 2006 Global Reporting Initiative (GRI) G3 Guidelines, with an A+ self-declared rating checked and confirmed by GRI.
supply chain
Change in ST scope
in 2008
MarchSTMicroelectronics, Intel and Francisco Partners create Numonyx in Flash memory segment.
Number of ST employees involved: 4,132 Countries where employees are based: Italy, Singapore and Malaysia
Final application of our products
Communication
Computer
JanuarySTacquiresGenesisMicrochip,strengtheningitsposition as a semiconductor technology leader in the consumer electronics market.
Number of Genesis employees involved: 663
Countries where employees are based: US,Canada,India,Singapore,China,Korea,Taiwan, Japan
JulySTMicroelectronics and NXP merge wireless businesses to expand product breadth and boost innovation.
Number of ST employees involved: 2,681
Countries where employees are based: Belgium, Brazil, Canada, China, Czech Republic, Finland, France, Germany, India, Ireland, Italy, Japan, Korea, Malaysia, Mexico, Morocco, Netherlands, Norway, Philippines, Portugal, Singapore, Sweden, Switzerland, Taiwan,Turkey,UKandUSA
Silicon ingot
Assembly & test
ChipWafer processing
SuppliersManufacturing Front-end
R&D Conception Design
Assembly line & final test Back-end
Business customer
We have built strong partnerships with many suppliers and subcontractors from whom we purchase raw materials,equipment,energy, gas, chemicals and services.
New products conception is the result of several steps, the design of the architecture and electrical layout, electrical and logical simulations, drawing of components and generation of reticles (circuit drawings).
The manufacturing of chips is a process of around 400 separate stages in several workshops. Starting with a plain silicon wafer, the Front-end manufacturing results in the etching of several hundreds to thousands dice, depending on the end product and the used technology.
The dice are cut from the silicon wafer before being assembled in a package. The chips are then tested prior to delivery to the customer.
how do we create a chip
Maskcreation
Weofferabroadrange of products and we serve a wide range of custo-mers that are leading companies in the fields of communications, consumer goods, automobile manufacture, computers and other industry sectors.
ST R&D and Manufacturing
Consumer
Automotive
Industrial
ST’s sales are well balanced between the industry’s five major high-growth sectors:
Company performance I Key performance indicators Company performance I Indicator index
5 The html Indicator Index gives more detailed information with: •additionalreferencestotheseindicators(htmlreport,20-F,www.st.com) •referencestoadditionalSTandGRIindicators •explanationwhenGRIindicatorsarenotreportedon.
5 FormoreinformationontheGRIApplicationlevels,see:www.globalreporting.org/ GRIReports/ApplicationLevels/
CR08 couv.indd 2 11/06/09 11:42

1
Although reasonable efforts have been made to ensure the consistency of the summary financial information for the year 2008 in this report with ST’s financial reporting, reliance should only be placed upon the complete financial reporting contained in ST’s Annual Report on Form 20-F for the year ended December 31, 2008, as filed with the SEC on May 13, 2009, which can be found at www.sec.gov.Some of the statements contained in this report that are not historical facts are statements of future expectations and other forward-looking statements (within the meaning of Section 27A of the Securities Act of 1933 or Section 21E of the Securities Exchange Act of 1934, each as amended) based on management’s current views and assumptions and involve known and unknown risks and uncertainties that could cause actual results, performance or events to differ materially from those in such statements. Certain such forward-looking statements can be identified by the use of forward-looking terminology such as “believes”, “may”, “will”, “should”, “would be” or “anticipates” or similar expressions or the negative thereof or other variations thereof or comparable terminology, or by discussions of strategy, plans or intentions. Some of the relevant risk factors are described in “Item 3. Key Information – Risk Factors” included in our Annual Report on Form 20-F for the year ended December 31, 2008. We do not intend, and do not assume any obligation, to update any information or forward-looking statements set forth in this report to reflect subsequent events or circumstances.
ST at a glanceST has two kinds of manufacturing sites: Front-end and Back-end
Approximately 50,000 employees
16 advanced research and development units
14 main manufacturing sites
78 sales offices in 36 countries
39 design and application centers
Greater China
Japan
Asia Paci�c
Europe
North America
Greater China
Japan
Asia Paci�c
Europe
North America
Greater China
Japan
Asia Paci�c
Europe
North America
Greater China
Japan
Asia Paci�c
Europe
North America
Greater China
Japan
Asia Paci�c
Europe
North America
JapanDesign and application centers • Sales • Warehouse
Asia Pacific• Australia • India • Indonesia • Korea • Malaysia • New Zealand • Pakistan • Philippines • Singapore • Thailand • Vietnam
Front-end • Back-end • Design and application centers • Advanced R&D centers • Sales • Warehouse
Europe, Middle East & Africa • Austria • The Republic of Belarus • Belgium • Bulgaria • Czech Republic • Egypt • Estonia • Finland • France • Germany • Greece • Hungary • Ireland • Israel • Italy • Latvia • Lithuania • Malta • Morocco • The Netherlands • Norway • Poland • Portugal • Romania • Russia • Slovakia • Slovenia • Republic of South Africa • Spain • Sweden • Switzerland • Tunisia • Turkey • Ukraine • United Arab Emirates • United-Kingdom
Front-end • Back-end • Design and application centers • Advanced R&D centers • Sales • Warehouse
Greater China• Beijing • Hongkong • Suzhou • Shanghai• Shenzhen • Taipei
Back-end • Design and application centers • Sales
Americas• Argentina • Brazil • Canada • Mexico • Puerto Rico • United-States of America • Venezuela
Front-end • Sales • Design and application centers • Advanced R&D centers • Warehouse
The Front-end sites produce transistors and integrated circuits on silicon ‘ wafers’ through a series of complex processes that enable the silicon to control and elaborate electronic signals. The thin slices of silicon range from 5 to 12 inches in diameter, with more advanced technology being required to produce the larger diameters.
Back-end sites perform assembly, packaging and testing functions. The individual silicon ‘die’ or rectangles are cut from the wafers and the die are then sealed with wire connections into the ‘package’ or box that connects the chips to an electronic device. The chips are then tested to ensure quality and proper performance.
5 For more information on ST’s company profile, see www.st.com/stonline/company/index.htm

CR Report 2008 I Table of contents
2
Supporting Sustainable Excellence in STGeorges Auguste, Executive Vice President, Quality Education and Sustainable Development
Kate Rigge, Corporate Responsibility Director and her team: Karen Duhart, Mélanie Salagnat, Charlotte Yvard
This report has been prepared by:Director: Kate Rigge
Editors in chief: Mélanie Salagnat, Charlotte Yvard
Editorial Services: Ian Welsh
Photographer: Gero Cacciatore, Stéphanie Joubert Designer: Diane Ollivier
Printer: Siris
The cover pages of this report use an extract of a design from Gehrke, Hildmann und Schirmer, Munich done for ST for the Electronica Exhibition, Munich (November 2008).
The article “Around the world of transport initiatives” (pp. 44-45) uses a computer graphics done by Stéphane Jungers.
Special thanks to: Georges Auguste, Monica Bianchi, Bernard Boulet, Bill Boyce, Pa-trice Chastagner, Alain Denielle, Karen Duhart, Alisia Grenville, Pierre Jacquemier, Bianca Guarino, Philippe Levavasseur, Otto Kosgalwies, Giulia Mancini , Laurence Maricot, Pierre Ollivier, Carlo Ottaviani, Robert Sangy, Carla de Sousa and Damien Tisserand.
We also thank: Jacqueline Arasanz, Patricia Aissaoui, Cecile Avazeri, Jane Bentley, Catherine Baudru, Claude Boumendil, Pascale Cartier, Patrick Cogez, Claire Co-henny, Enrique Diaz, Kim Dinh, Nada Elgraoui, Corinne Gascon-Ruiz, Peter Gysin, Peter Han, Frédéric Jatropou-los, Michel Lauféron, Phyllis Lim, Xiao Jun Luan, Gérard Mangin, Laurent Marguerit, Jean-Marc Marquant, Pascale Poblet, Maria-Grazia Prestini, Anne Prunier, Christine Romand-Charnay, Qionji Qionji, Jean-Pierre Rabouin, Harold Rolle, Ingrid Rebout, Stephan Riwan, Richard Stockdill, François Suquet, Tristan Tieche, Stacia Vigne and Dustie Yang.
Copyright ©STMicroelectronics - June 2009 All rights reserved.
The STMicroelectronics corporate logo is a registe-red trademark of the STMicroelectronics group of companies.
All other names are the property of their respective owners.
All commissioned photography Copyright ©STMicroelectronics Photo credits Gero Cacciatore©iStockphoto.com/Matjaz Boncina/Foto-Fine-Art/Macroworld/dem10 ©Fotolia.com/Julien Eichinger/Albachiaraa
Company Performance 3 Vision and strategy
10 Corporate gouvernance
Product Responsibility53 Responsible products design
56 Quality excellence
57 Performance Overview
Economic Impact15 Business strategy
16 SRI indices
17 Innovation and R&D
18 Performance Overview
Supply Chain Management59 Suppliers and subcontractors management
60 Customer management
61 Performance Overview
Social Performance23 Training
24 Restructuring activities
26 Diversity
28 Local community
30 Performance Overview
64 Independent verification statement
65 Key Performance indicators
inside flap Indicator index
outside flap Glossary
Health & Safety37 Local actions
38 Performance Overview
Environmental Performance41 Chemical management
42 Waste management
44 Climate change
46 Performance Overview

Vision and strategy I Company performance
3
Over the last couple of years, we have resha-ped the company into a leaner, faster, more innovative and powerful competitor in the world’s semiconductor arena. Growing sales and becoming a member of the $10bn club was quite an achievement for 2007; but the more recent business and strategic initiatives are even more important:• thedivestitureofourFlashmemoriesactivities and the creation of Numonyx; • theagreementsignedwithNokiainthefield of 3G technology; • theagreementsignedwithIBMtocollaborate on 32 and 22 nanometers CMOS technologies; • thebroadeningofourexpertiseinthedigital consumer area with the acquisition of Genesis; • thejointventurewithNXP,tobefollowedby the merger of ST-NXP Wireless with Ericsson Mobile Platforms, creating a new powerful leader in the field of Wireless technology.
We are proud of these achievements, but we have a clear understanding of the forces which are reshaping the microelectronics industry, and most importantly we know that we are facing an unprecedented financial and economic storm. In this turbulent period we will maintain a course and strategy based on four axes:• developmarketsharethroughinnovativenew products and new market segments – our target is to grow faster than the market, which is what we did in the last few quarters, reaching our record level of 4.3% at the end of 2008;
• developandre-focusourproductportfolio, including through selected acquisitions and divestitures, as we have done in the last couple of years; • simplifyourmanufacturingstructureand evolve towards an asset-lighter configuration; • improveouroperationalandfinancial performance, with a strong focus on cash-flow generation.
In the sustainability area, we are also proud of our achievements in 2008:• wehavedecreasedourenergyconsumption per unit of production by 5% compared to 2007, and this consumption now represents less than 49% of its 1994 level – the energy we save each year is equivalent to the consump- tion of a town of 400,000 people; •wehavemadeoutstandingprogressinthe reduction of our CO2 emissions, which now represent only 68% of what they used to be in 2005, in absolute value, while our pro- duction volume increased by 4% over the same period; • wehaveagainimprovedoursafetyperfor mance, with a 21% decrease of the number of incidents compared to 2007, and of course no fatalities – this represents a 61% improvement since 2002, and we are now at the top level in the industry;
•ourhealthplanisnowfullyimplemented and offers to each and every ST employee, everywhere in the world, the same complete medical cover – over 17,000 people had at least one medical examination in 2008, brin- ging the total to more than 41,000 people in the last two years.
Today, in the midst of the worst economic crisis in decades, we believe that the financial and economic world needs stronger governance; we believe that a longer-term vision is an absolute must to support robust economic growth. Sus-tainable capitalism cannot be based on short-term strategies and unrealistic expectations. We at ST, have a long-term vision, through our unwavering commitment to Sustainable Excel-lence. We deploy, at all levels of the organization, hundreds of programs for sustainable deve-lopment, quality improvement, cost reduction, innovation, market share, health and safety, and many more; but we know that, at the end of the day, the heart of our performance lies in our people, in their engagement and in the sharing of our company values: Integrity, People and Excellence. They are the common framework which gives consistency to all our actions, the key enablers that will allow ST to emerge from the current economic turmoil stronger than ever.
Carlo Bozotti President and CEO of STMicroelectronics
Foreword by Carlo Bozotti, President
and Chief Executive Officer
This report has been prepared following the GRI G3 Guidelines. It represents a balanced and reasonable presentation of our organization’s economic, environmental and social performance. And it demonstrates our commitment to the UN Global Compact, to which we have been a signatory since 2000.
2008 was another milestone year for STMicroelectronics.

Company performance I Vision and strategy
4
Our approach to materialitySTMicroelectronics has always been strongly committed to Corporate Responsibility, and in the early 1990s was one of the first multi-national companies to implement a policy of environmental responsibility. ST has published its Environmental Health & Safety Decalogue, which sets targets far beyond any legal requi-rements. The company’s progress in meeting these targets is closely monitored.
Our vision of stakeholders’ engagementSustainable Excellence is ST’s vision of creating sustainable value for stakeholders – customers, employees, shareholders, local communities and society at large – over the long term while respecting its fundamental principles. This includes economic, ethical and social factors, as well as environment, health and safety, and product responsibility.
Internal conviction is crucial but to define our key Corporate Responsibility issues we pay particular attention to our stakeholders:
• whatdotheyexpectfromus?
• howdoweimpactthem?
• howdotheyimpactus?
This approach is key for ST’s global performance in the context of continuous improvement and to contributing to sustainable development at a global level.
Our Principles for Sustainable Excellence, laun-ched in 2006, fully support the implementation of this approach within the whole company. This code of conduct refers to all our stake-holders and requires all people working in ST, without exception, to consider business ethics, respect of human rights, a sense of responsi-bility towards all our stakeholders and respect of the environment as matters of personal integrity.
To address Corporate Responsibility issues, ST’s Quality Education and Sustainable Develop-ment (QES) organization maintains contact throughout the year with ST’s stakeholders, internal and external. Through this process, sta-keholders can give their thoughts and feedback on the company’s CR performance, and we engage and communicate with ST employees on CR issues. It provides the company with an opportunity to respond to stakeholders’ general expectations of ST’s strategy.
On an annual basis, through ST’s Corporate Responsibility Report, our objective is to com-municate ST’s stance on key CR issues and share performance and results.
How do we engage with our internal stakeholders?The Corporate Responsibility team works in close collaboration with a network of Sustai-nable Excellence (SE) Contacts responsible for overseeing implementation of the SE strategy at a local level. These contacts and other SE sponsors in organizations and from major sites are also invited to attend quarterly SE Council meetings to share performance data and participate in discussions about developing corporate and local programs. These meetings provide the opportunity to collect feedback from the field, to provide support when needed and to share examples of good practices.
Each year, following the publication of the Cor-porate Responsibility Report the CR department also carries out an e-survey, accessible to all ST employees, via our SE Contacts. The e-survey includes questions about the content and format of the report, asking for comments and suggestions. The results of this survey are then shared during the SE Council meetings.
The CR department also collaborates closely with the Environmental Health and Safety, Purchasing, Sourcing, , Human Resources, Sales, Finance and Compliance departments and product groups to provide support, guidelines and information on a wide range of issues and to work together on strategic projects.
Our key CR issues
Health & Safety• Employeehealthandsafety
Environment
• Climatechange
• Managementofhazardoussubstances
• Consumptionofresources
• Pollution
Product responsibility
• STproducts’contributiontoenergysavings
• STproducts’contributiontosocialissues(health,privacy, quality of life)
• Ensurehighqualityproducts
Supply chain management
• Monitor/ensureCRstandards(followingEICCstandards)withinour supply chain
• Responsetocustomersrequirements
Company
• Responsiblecorporategovernanceandfinance
• Businessethicsandcompliance
• CoherentinternaldeploymentofCRprograms
Economic• Inclusioninextra-financialindices
Social
• Humanrights
• Diversityandequalopportunities
• Employeeengagementandemployability
• Employeewell-being
ST is committed to act as a responsible and ethical company.

5
Employees
Shareholders
Customers Suppliers
Corporate Responsibility
and Environmental Communities
Non Governmental Organization
Local Communities
Business Community
Government Organizations
Employee representatives
Laboratories and Academic
Community
Financial and Extra-Financial Communities
Media
How do we engage with our external stakeholders?
The QES organization, including the CR de-partment, maintains links with many external stakeholders, keeping them informed about relevant matters of interest, in a number of different ways:
• participationinconferences,participation in industry organizations, and meetings with governmental authorities, NGOs, etc;
• STmembershipinassociationsand organizations;
M For more details, see text-box
• responsetocustomerrequirements;
M For more details, see page 61
• tradeshows;
• extra-financialassessmentsandcontactwith rating agencies;
• investorrelationsandroadshows;
• externalinterviewswithapanelofrepresen- tatives of all of our stakeholders, once a year, to get their feedback on the CR report and ST’s CR activities;
• onlinefeedbackformabouttheCRreport and ST’s CR activities;
• regularbenchmarkanalysesonspecific issues and one annual global benchmark analysis on CR in general;
• externalaudits(ISO14001,OHSAS18001, ISO/TS 16949 and CR data reporting);
• monitoringofregulationsandexternal standards.
Information from this dialogue is used to:
• identifykeytrendsandupcomingissues;
• benchmarkourCRperformance;
• defineanddesignnewprograms,and improve existing ones;
• makesuggestionstointernalorganizations and sites for new short-, mid-or long-term CR programs and targets;
• communicatebetterwithourstakeholders, keeping them informed about ST’s initiatives and results.
• SyndicatdesIndustriesdeTubes
Electroniques et Semiconducteurs
(SITELESC micro & nanoélectronique)
• EuropeanSemiconductorIndustry
Association (ESIA)
• WorldSemiconductorCouncil(WSC)
• EuropeanRoundTableof
Industrialists(ERT)
• ElectronicIndustryCitizenship
Coalition (EICC), (board member)
• EntreprisespourlesDroitsde
l’Homme(EDH)
• EuropeanFoundationforQuality
Management(EFQM)
• CSREurope
ST membership in associations and organizations I 4.13 I
ST key stakeholders who are in daily direct contact with the company
Other stakeholders who can also affect or be affected by company’s actions and decisions
A closer look at our stakeholders

Company performance I Vision and strategy
6
Performance versus objectives in 2008
Target achieved In progress No progress
Company • Maintain awareness of Corporate Responsibility throughout the company p. 4-5, 22, 44
• Ensure company values and Principles in our strategic decisions p. 8
• Ensure compliance of management population with rules for Integrity p. 10
• Ensure a robust link between corporate and local governance structures p. 10
Economic • Satisfy shareholder expectations through financial and non-financial performance p. 18-19
• Create economic value for stakeholders p. 20
• Create the conditions for sustainable innovation p. 21
Social • Support the company in adapting to its surrounding dynamic context p. 24, 30
• Ensure dynamic career progression, life-long learning and employability to meet employee and company needs
p. 23, 33
• Ensure employee empowerment and engagement p. 27, 32
• Ensure diversity and equal opportunities p. 36, 31
• Proceed to deeper integration of human rights issues in and beyond ST p. 34
• Engage proactively with local community and society to create mutual value p. 28-29, 35
Health & Safety • Ensure a safe and healthy workplace p. 39
• Give all employees access to the same level of medical care p. 39
Environment • Maintain top class management systems for environment p. 46
• Contribute to company efficiency and financial performance p. 46
• Continuously improve our eco-footprint according to our Decalogue targets p. 48-50
• Progressively achieve carbon neutrality p. 44-45, 50
• Anticipate and respond to customer and legislative requirements for the environment p. 41, 46, 61
Product Responsibility
• Comply with our Principles and values to develop responsible products that contribute to society p. 52-57
• Proactively comply with environmental regulations and customer requests when managing chemical product and process quality p. 41, 57
• Continuously reinforce our product and process quality p. 56-57
• Focus on designing eco-efficient products p. 54-55, 57
Supply chain • Continuously aim to satisfy and exceed our customers’ Corporate Responsibility requirements p. 61
• Achieve efficient and socially and environmentally beneficial partnerships with our suppliers and subcontractors p. 62
• Actively contribute to the EICC initiative by supporting our suppliers and subcontractors in reaching compliance p. 59, 63
M You will find further details on these objectives in each specific section of the report in the performance overview part. Each objective is detailed in sub-level objectives with the results and level of performance achieved.
Vision and strategy I Company performance
7
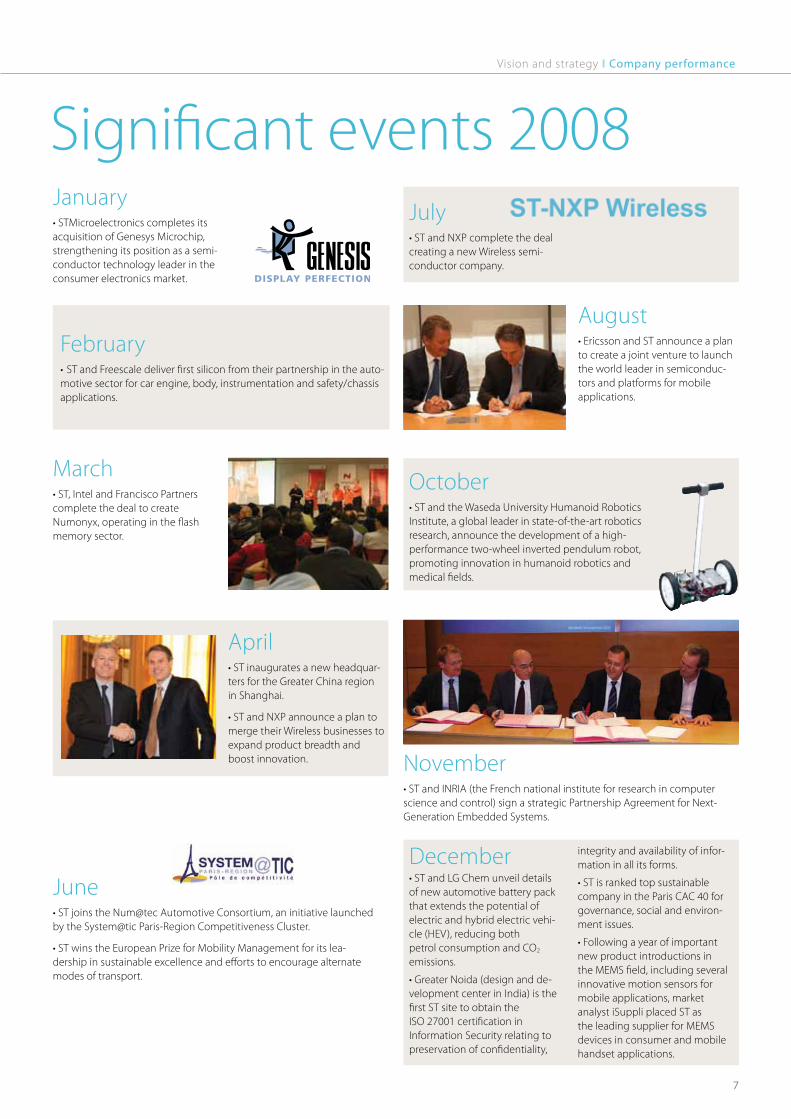
Significant events 2008January•STMicroelectronicscompletesits acquisition of Genesys Microchip, strengthening its position as a semi-conductor technology leader in the consumer electronics market.
February•STandFreescaledeliverfirstsiliconfromtheirpartnershipintheauto-motive sector for car engine, body, instrumentation and safety/chassis applications.
March•ST,IntelandFranciscoPartnerscomplete the deal to create Numonyx, operating in the flash memory sector.
April•STinauguratesanewheadquar-ters for the Greater China region in Shanghai.
•STandNXPannounceaplantomerge their Wireless businesses to expand product breadth and boost innovation.
June•STjoinstheNum@tecAutomotiveConsortium,aninitiativelaunchedbytheSystem@ticParis-RegionCompetitivenessCluster.
•STwinstheEuropeanPrizeforMobilityManagementforitslea-dership in sustainable excellence and efforts to encourage alternate modes of transport.
July•STandNXPcompletethedealcreating a new Wireless semi-conductor company.
August•EricssonandSTannounceaplanto create a joint venture to launch the world leader in semiconduc-tors and platforms for mobile applications.
October•STandtheWasedaUniversityHumanoidRoboticsInstitute, a global leader in state-of-the-art robotics research, announce the development of a high-performance two-wheel inverted pendulum robot, promoting innovation in humanoid robotics and medical fields.
November•STandINRIA(theFrenchnationalinstituteforresearchincomputerscience and control) sign a strategic Partnership Agreement for Next-Generation Embedded Systems.
December•STandLGChemunveildetailsof new automotive battery pack that extends the potential of electric and hybrid electric vehi-cle (HEV), reducing both petrol consumption and CO2 emissions.
•GreaterNoida(designandde-velopment center in India) is the first ST site to obtain the ISO 27001 certification in Information Security relating to preservation of confidentiality,
integrity and availability of infor-mation in all its forms.
•STisrankedtopsustainablecompany in the Paris CAC 40 for governance, social and environ-ment issues.
•Followingayearofimportantnew product introductions in the MEMS field, including several innovative motion sensors for mobile applications, market analyst iSuppli placed ST as the leading supplier for MEMS devices in consumer and mobile handset applications.

Company performance I Vision and strategy
2008, a rich year for mergers and acquisitions
STMicroelectronics’ strategy hasn’t changed. It remains committed to fully own and run its business, aiming at leadership in multimedia convergence and power applications. This being said, we have recognized that leadership in some key market segments requires a level of sales that we could not achieve organically as the industry matures and its long-term growth rate decreases. Hence the transforming ventures the company has recently completed in Flash and Wireless, which give to those busi-nesses the size and the technology leadership they require to successfully compete while remaining part of the ST group. Those have been pragmatic answers to strategic challenges and not an altering of strategy.
Executing such transactions is an in-depth and rather lengthy process. The Flash memory spin-off and the Wireless joint venture each took the ST management team more than two years from the initial strategic diagnosis, the explora-tion and the assessment of the options to the selection of an actionable strategy and then its execution. And beyond business, finance and legal considerations, the management team clearly had Corporate Responsibility in mind when evaluating their options.
Building on its long history of alliances with strategic customers, ST has developed a strong capability in also partnering with competitors to build mutual competitive advantages. This capability has been instrumental when concei-ving and executing new ventures.
For each, we had to share a common vision with our partner, understand and accept each other’s boundary conditions, develop a plan to combine as efficiently as possible our respec-tive human and technological assets and, not least, to agree on a joint system of corporate governance.
It is easy to underestimate the enormous and complex task the establishment of those ventures represents in term of infrastructure and financial reporting. Our teams, on top of their usual duties, have done an outstanding job here in enabling the new companies to be operating competitively on time.
How did this activity take place and what are the business perspectives?
• On25January2008, ST announced that it has performed all necessary steps to complete its acquisition of Genesis Microchip Inc. and had therefore concluded the acquisition.
Through this acquisition, ST expects to expand its leadership in the US$1.5bn digital TV market, one of the fastest growing segments in consu-mer semiconductors. Genesis Microchip will enhance ST’s technological capabilities for the transition to fully digital solutions in this seg-ment and strengthen its product and intellec-tual-property portfolio.
• AttheendofMarch2008, ST, along with Intel and Francisco Partners, announced the esta-blishment of the Numonyx joint venture.
Numonyx will be the industry’s largest supplier of NOR flash memory and a leader in non-vola-tile memory solutions with a substantial patent portfolio. Intel, Francisco Partners and ST intend for Numonyx to hit the ground running, with an energized and independent work force, substantial intellectual property, modern and well-equipped manufacturing facilities, and a broad and diverse customer base.
ST participation in the joint venture: 48.6%
• On28July2008, NXP – the independent semiconductor company founded by Philips – and ST completed a deal bringing together key Wireless operations of both companies into ST-NXP Wireless.
The joint venture started operations on 2 August. Launched as a solid top-three indus-try player with a complete Wireless product and technology portfolio, it is a leading supplier to major handset manufacturers who together ship more than 80% of all handsets. ST-NXP Wireless will be among the few companies with the Research and Development scale and ex-pertise to meet customer needs in 2G, 2.5G, 3G, multimedia, connectivity and all future Wireless technologies.
ST participation in the joint venture: 80% • On20August2008,ST and Ericsson announced an agreement to merge Ericsson Mobile Platforms and ST-NXP Wireless into a joint venture.
The joint venture has the industry’s stron-gest product offering in semiconductors and platforms for mobile applications and will be an important supplier to Nokia, Samsung, Sony Ericsson, LG and Sharp. The fabless joint venture (without any production unit) will employ almost 8,000 people with pro-forma 2007 sales of US$3.6bn. ST exercised its option to buy NXP’s 20% stake in ST-NXP Wireless before closing the transaction.
ST participation in the joint venture: 50%
Interview with Loïc Lietar, Corporate Vice President, Corporate Business Development
Taking advantage of period of consolidation in the semiconductor industry, in 2008, ST has conducted a very rich activity in terms of merger and acquisition. What does thismeanforourstrategyandbusinessperspectives?
8

9
A time for partnerships, mergers and acquisitions
ST has considerably evolved, through carefully selected divestments, acquisitions, agreements and partnerships. These include:
• mergerofourFlashmemoriesactivitieswith Intel’s in Numonyx;
• finalizinganagreementwithNokiaregarding 3G Wireless modem technology;
• collaborationwithIBMonon32and 22 nanometers CMOS manufacturing processes and other related technologies;
• developingexpertiseinthedigitalconsumer marketplace with the acquisition of Genesis Microchip;
• establishinganewpositionasaleading player in Wireless technology by first creating a joint venture with NXP and then, in 2009, to form ST-Ericsson, a 50/50 joint venture with Ericsson.
These are milestones that truly mark the evolution of ST.
Major challenges
At a global level, we are facing considerable challenges. Some have been around for the past few years, but others are new and need to be adapted to quickly.
• Aslow-downinthelong-termstructural growth of the semiconductor market, which has declined from double-digit average to single-digit average over last few years.
• Strongdevelopmentofnewapplicationsin areas such as Wireless communications, solid- state storage, digital TV, video products and medical applications.
• ConvergencebetweenWireless,consumer and computer applications.
• Evolutionofthecustomerbasefromoriginal equipment manufacturers (OEM) to a mix of OEM, electronic manufacturing services pro- viders (EMS) and original design manufactu- rers (ODM).
• ThegrowingimportanceoftheAsia-Pacific region, including China and other emerging countries. They are the fastest growing markets, but also countries where social or human rights issues are of concern.
• Uncertaintyintheglobalfinancialmarkets and the economic recession in several major countries, which makes it extremely difficult to accurately forecast product demand.
• TheUSdollarexchangerate,whichhasbeen improving lately, but still represents a serious vulnerability for ST, as most of our product prices are quoted in US dollar while a big portion of our costs is denominated in euro.
• Climatechangeissuesarenowoneveryone’s agenda, but the implementation of appro- priate corrective actions/programs may not be so straightforward.
Our company vision is unchanged: our aim is to be the undisputed leader in both multimedia convergence and power applications.
Our strengths
• WeareapioneerandleaderinSystem-on- Chip solutions and we have a very diverse portfolio focusing on high-growth applica- tions and market segments. We enjoy a very solid customer base having built strong par- tnerships over the past 20 years. Additionally, we continue to develop strategic alliances with new world-class customers.
• Wehaveleadingtechnologies,powerful intellectual property and a wide-ranging patent portfolio.
• Ourfinancialpositionisverystrong.
• Ourmanagementteamisexperienced,moti- vated and cohesive.
• Wehavedevelopedawinningcorporate culture committed to Sustainable Excellence.
Our strategy
ST’s strategy can be summarized very simply: increase our sales, optimize our manufacturing infrastructure, be a technology leader, control our costs, provide innovative and top quality products, act responsibly through our commit-ment to sustainable development and invest in our people to prepare the future.
The key elements of our strategy are:
• broadandbalancedmarketexposure;
• productinnovation;
• customer-driveninitiatives;
• integratedpresenceinkeyregionalmarkets;
• manufacturinginfrastructure;
• researchanddevelopmentpartnerships;
• productqualityexcellence;
• sustainabledevelopment;
• education.
Our short-term priorities
We have four key priorities for 2009:
• improveourcompetitivenessasweexecute our plan concerning the Wireless joint venture with Ericsson Mobile Platforms;
• reduceourcostsbyoverUS$700mfromour fourth quarter 2008 cost base;
• advanceourassetlighterstrategyfocusedon careful management of capital investments;
• provideinnovativeproductsthatwillsupport our momentum to gain market share.
In the last couple of years, there have been many challenges for the world economy and for ST.
Looking forward to 2009…and beyond

Company performance I Corporate Governance
10
Corporate governance statement
Our company’s policies and procedures are upheld by internal controls that are regularly audited and reviewed to ensure their effectiveness.
Good governance principles
Our Supervisory Board supports the Principles for Sustainable Excellence, which also serve as the company’s Code of Conduct. The Princi-ples are communicated to all employees at ST
and we are committed to ensuring that high standards of corporate governance are imple-mented and maintained throughout in order to enhance both shareholder value in the short term and the long-term value of the company.
These Principles and practices, supported by existing internal controls processes, are regu-larly audited and reviewed, to ensure trans-parency and accountability. The Supervisory Board Charter, as adopted by the Supervisory Board, spells out clearly the key business prac-tices and authority that govern the way the company conducts its business. The Principles have remained consistent ever since, because the core values on which they were originally based have endured: excellence, integrity and respect for people.
ST also firmly believes in the fundamental im-portance of the promotion of trust, openness, teamwork and professionalism and pride in what it does. These underlying corporate values determine the company’s Principles. These
Principles apply to all transactions, large or small, and describe the behavior expected of every employee in the company in the conduct of its business. In turn, the application of these Principles is underpinned by procedures within the company, which are designed to ensure that our employees understand the Principles and that they act in accordance with them. The company recognizes that it is vital that its behavior matches its intentions.
All the elements of this structure – values, principles and the accompanying procedures – are necessary. It is ST’s firm belief that maintai-ning the trust and confidence of shareholders, employees, customers and other people with whom the company does business, as well as the communities in which our sites are situated, is crucial to its continued growth and success. The company intends to merit this trust by conducting itself according to the standards set out in these Principles. The Principles have served our company well for several years now.
STMicroelectronics is committed to implemen-ting high and commercially accepted standards of corporate governance at all levels.

11
It is the responsibility of management to ensure that all employees are aware of these Principles, and behave in accordance with their spirit as well as their letter.
In early 2007, the Principles of Sustainable Excellence were launched with the expectation that all employees would carry out their duty in accordance with them. The thrust of the Code of Conduct is premised on both legal and ethical compliance.
Supervisory Board composition
The Supervisory Board currently consists of nine members, all of whom are non-executi-ves of which three are fully independent. The Supervisory Board members play important roles through exercising judgment and taking objective participation in the proceedings and decision-making processes of the Supervisory Board.
The Supervisory Board has overall responsi-bility for corporate governance and strategic
direction of the company and is entrusted to exercise reasonable and proper care in utilizing the company’s resources for the best interests of its shareholders and to safeguard its assets. The President and CEO, who is the sole member of the Managing Board, is responsible for the day-to-day operations of the company. In addition, the Managing Board has the principal responsibility of reporting, clarifying and communicating matters relating to day-to-day operations of the company to the Supervisory Board.
Independence and statutory authoritiesSTMicroelectronics is a Dutch company, formed in 1987 from the combination of SGS Microelet-tronica and the non-military business of Thom-son Semiconducteurs. Legally, the company is based in Amsterdam, the Netherlands, and our headquarters are in Geneva, Switzerland. Our historical shareholder STMicrolectronics Holding II BV owns 27.5% of the company’s shares as of March 2009. This holding is indi-
rectly wholly owned on a 50/50 basis by two groups of shareholders: a consortium of Italian shareholders (made up of CDP and Finmecca-nica) and a group of French shareholders (made up of Areva and CEA).
ST is listed on three stock markets – New York Stock Exchange, Euronext Paris and Milan Borsa Italiana – and therefore must comply with several regulatory systems.
Each year, we publish firstly a financial report, the FORM 20-F, and secondly governance, inter-nal control and statutory financial statements in the form of our statutory annual report.
From the highest levels of the company, com-mittees have been appointed to guarantee the independence and control of our management systems and activities as outlined in the table on the next page.
CEO ST-NXPWireless
Compensation Commitee
Audit Commitee
Strategic Commitee
Nomination & Corporate Governance Commitee
Europe, Middle East & Africa
Greater China
Japan
Americas
Asia Pacific
Packaging and Test Manufacturing
Front-End Manufacuring
Technology R&D
Executive Commitee
Supervisory Board
Managing Board
COO
President & CEO
CEO
Corporate Ethics Commitee
Quality Education and Sustainable Development
Business Development
Human Resources
Company Infra-structures & Services
Communication
Chief Financial Officer
Chief Compliance Officer
General Counsel
Computer & Comm. Infrastructure (CCI)
Automotive Product group (APG)
Home Entertainment & Display (HED)
Analog, Power & MEMS (APM)
Industrial & Multisegment Sector (IMS)
Microcontrolers, Memories & Smartcards (MMS)
ST-NXP Wireless
Sales & Marketing
Manufacturing & Technology R&D
Product Group
Staff Functions

Company performance I Corporate Governance
12
Supervisory Board
Audit Committee Strategic Committee
Compensation Committee
Nomination and Corporate Committee
IndependenceMembers 9 5 5 5 5
Mandate The Supervisory Board (SB) advises the Managing Board (MB) (CEO) regarding performance of its duties, its management tasks and supervises the policies of the MB and the general course of the company’s affairs and business. In dischar-ging its duties, the SB shall be guided by the interests of the company and its business; it shall take into account the relevant interests of all those involved in the company, including its shareholders.
•Memberswith financial expertise.•Integrityoffinancial statements.•Compliancewithlaws.•Independenceand qualification of independent auditors.
•Strategicdevelop- ments in the industry.•Longtermplanning and budgeting.•Mergersand acquisitions. •MajorResearch and Development programs.
•Remuneration policy for the Managing Board submitted for share- holders’ approval.•Annualremuneration for Supervisory Board members.•Allocationofstock based compensation to executive officers and managers. •Remunerationpolicy and Executive Incentive Program for executive officers and managers.
•Selectioncriteria and appointment procedures for Managing and Supervi- sory Boards members.•Sizeandcomposition of the Supervisory Board.•Corporategovernance policies.
Remuneration Chairman: €115,000 Members: €57,500 + €1,500 per meeting or €375 per conference call
€7,500 + €1,500 per meeting or €375 per conference call
€3,500 + €1,500 per meeting or €375 per conference call
€3,500+ €1,500 per meeting or €375 per conference call
€3,500+ €1,500 per meeting or €375 per conference call
Independence and control
Members can’t be on the managing board or ST employees.Supervises the structure and management of systems of internal business controls and the financial reporting process.
Allmembersarefinan-cial experts and voting members.
Decision making
Number of meetings
15 11 3 6 3
Attendance rate 90% 45% 57% 48% 50%
Main subjects linked to Sustainable Excellence discussed
The Supervisory board has discussed several subjectslinkedtoSustai-nable Excellence: board charter, ethics, complian-ce, cases of fraud, and training programs.
The committee has sponsored various initiatives in the area of corporate ethics, inclu-ding a specific program prepared by an external consultant, considered bytheAuditCommitteeto be appropriate for the company’s employees.
Supervisory Board meetings
The Supervisory Board meets at least five times ayear,withadditionalmeetingsconvenedwhennecessary,wheretheManagingBoardand the members of the management team ta-ble and present comprehensive reports for the Supervisory Board’s information, deliberation and direction. The members of the Supervi-
sory Board have full and unrestricted access to all information pertaining to the company’s business or affairs to enable then to discharge their duties. Written reports on operational performance and profitability, human resour-ces, business plans and financial highlights are made available to its members in advance of each Supervisory Board meeting.
Minutes of each Board meeting are circulated to each Board member and then agreed at the next Board meeting.
Details of the Members attendance at meetings during2008aresummarizedabove.

13
Business ethics
We have developed an e-Signature system to have our managers, from all sites and organiza-tions, annually sign our Business Conduct and Ethics Policy. In 2008, 92% of eligible managers signed this document (approximately 15% of ST population). We are now confident in the ac-curacy of this indicator and we will then be able to disclose it on an annual basis in this report.l S03 l X STS01 l
Within ST we have put in place two channels for non-compliance reporting.
Firstly, a third-party reporting channel, for all matters linked to financial and auditing issues, is available to ST employees and managed by an external ombudsman.
Secondly, as mentioned in 2007’s report, a Corporate Ethics Committee was created. It is chaired by Alisia Grenville, Corporate Vice President and Chief Compliance Officer, with eight members from ST’s top management. The purpose of the committee is to give guidance to the Managing Board on issues regarding ethics, values and corporate behavior and to make recommendations regarding internal policies and procedures, and the training necessary to ensure that management and employees continue to live and promote the Principles for Sustainable Excellence.
The Corporate Ethics Committee meets at least six times per year, with additional meetings convened when necessary. Although the pri-mary role of the committee is to give guidance to the Managing Board, as the Chief Com-pliance Officer also reports to the Supervisory Board in her role as Executive Secretary to the Board, and Head of Internal Audit, relevant ethical issues are also taken to and discussed at Supervisory Board level via the Audit Commit-tee. All reported cases and allegations that are investigated by the Corporate Ethics Commit-tee, are, therefore, reviewed by the members of the Audit Committee and ultimately weighed in on by the Supervisory Board.
A non-compliance reporting email address ([email protected])isinplacetoallowSTemployees the opportunity to alert top mana-gement of cases of non-compliance with the Principles for Sustainable Excellence that could not be solved at the employee’s direct manage-ment, site or organization level. This is directly connected to the Corporate Ethics Committee.
In 2008, the internal audit group either inves-tigated or reviewed 14 incidents or allegations of wrong doing that were brought to the company’s attention either anonymously or through regular auditing. Of the 14 incidents or allegations, five were anonymous. Three sepa-rate allegations (which are not counted among the 14) were received through the company’s third party reporting channel. None of the three allegations were substantiated, but they were, however, reviewed by the Corporate Ethics Committee as important allegations as they pertained to “tone from the top” issues. Of the 14 incidents/allegations, six related to potential
fraud, six to potential conflicts of interest and two related to theft.
Based on the company’s own risk assessment matrix, only one of these allegations could be considered high risk. The other allegations/inci-dents were either medium or low risk events. In order to mitigate and remediate, within ST, the Compliance Organization in conjunction with Internal Controls has reviewed all the incidents/allegations and has enhanced of some the company’s policies and procedures, as well fo-cusing on ensuring that both management and employees are aware of these amendments. Where and when necessary, training will be de-veloped to ensure awareness and compliance.
RiskmanagementwithinST
To reinforce its risk management approach, in 2009 ST plans to introduce an enterprise risk management assessment process in order to identify, through a top down approach, the most critical risks of the company at the corporate level. This project and process will be driven both by internal and external experts.
Non-compliance reporting in 2008 l SO4 l HR4 l Principles for Sustainable
ExcellenceFinanceandAudit
Number of cases reported 14 -
Number of cases solved and closed 14 -
Number of cases still ongoing None -
Areas of reporting Fraud, conflicts of interests and theft
-

14
Economic
Competing in an ever more competi-
tiveenvironment,ourproductionunits
have to adapt to continually increase
output,anddoitmorequicklyand
with fewer resources. The traditional
economies of scale are no longer a
solution as our products’ life-time
decreases – because of changing
technologies – while new investment
costs increase.
The current economic situation has
enhanced this with increasing
expectationsondeliveringontime,
priceandqualityfromourcustomers.
Searching for new ways to improve our
industrialeffectiveness,andbenchmar-
kingwithotherindustries,especially
theautomotiveindustry,wehave
launched a Lean Initiatives program.
InspiredbyToyota’sproductionsystem,
it relies on one simple idea: focus on
waste elimination to improve industrial
andbusinessparameters,andtodoso,
relyonALLemployees.
This process is not new for ST as it
contains many similarities with the
previous culture of Total Quality
Management. Lean Initiatives allows us
tore-stimulateourworkingmethods,
adding new tools and methodologies
to track and reduce all wastes.
We have launched a huge cascade
trainingprogramonLeanprinciples,
including all employees involved in
production from Front-end Manufactu-
ring management to operators.
Withthisprogram,weaimtoreinforce
all our employees’ engagement to de-
livertoourcustomersthebestquality
and the best service at a better cost.
Lean manufacturing in ST +19.5%
increase of ST R&D
expenditures
437 active
partnerships with the
academic community
485 patent
applications filed at
worldwide level

15
Business development I Economic impact
WhathavebeenthemilestonesinST’sdevelopment in China?
We opened our first sales offices in China in 1984 – 25 years ago. We were one of the pio-neer multinational semiconductor companies in China. The Greater China Region now repre-sents 5,300 employees including around 4,000 in manufacturing.
From two sales offices, one each in Beijing and Taipei, today we have sites in Hong Kong and Taiwan as well as mainland China, with a strong integrated presence including sales and marketing, manufacturing, design and research operations.
To meet the growing demand for microchips tailored to the Greater China market, we established Integrated Circuit Design Centers in Shenzhen and Shanghai. These centers are capable of world-class silicon design, from spe-cification definition to volume production.
Our Competence Centers focus on multi-sys-tem, consumer and automotive electronics, and work side by side with ST Competence Centers around the world. On the manufacturing side, the Shenzhen Futian and Longgang test and assembly facilities are the largest in ST’s global Back-end manufacturing network.
From a sales perspective, Greater China repre-sents 25% of ST’s total global sales. However, if we consider the total value of products actually shipped to China (by customers based in Wes-tern countries for further integration in final applications), it is much higher, at around 33%. And, in 2007, ST was the fifth largest semicon-ductor supplier in Greater China and third in Served Available Market.
Personally, I take tremendous pride in what the teams are doing here.
WhataresomeofthekeybusinessissuesST faces in China?
Any company operating in China today, mul-tinational or domestic, will say that recruiting and retaining key talent is one of the biggest business challenges. China has grown so fast that competition for the best personnel is a very big issue for everyone including ST.
Staff turnover in China’s semiconductor sector is about 12% each year. Our turnover rate is a little lower but, frankly, that’s because we put a lot of effort into people management and benefits.
We have put in place very effective training and development programs, set clear performance goals and offer attractive compensation and benefits. Our employees enjoy challenging but rewarding careers. I think this has a very big impact on ST as we aspire to become the employer-of-choice in China.
Another important business issue is keeping in line with the Chinese government’s high-prio-rity green-energy agenda. It is essential that we align our product technology with customer and government priorities. As one example, we are achieving significant energy savings with smart lighting solutions that can cut our energy consumption for lighting by as much as 80%.
These key business issues, while seeming very different, actually work together. Our two most important stakeholders in China are govern-ments (local and national) and our people. So, by operating as a company committed to people and the environment we contribute to sustainable growth and development in China, which results in making life better for everyone.
How do you integrate Sustainable Excellence in your daily activities?
We have organized a SE Steering Committee to address Environmental, Health and Safety (EHS) issues, Corporate Responsibility, rewards and recognition programs and team management. We have an Ethics Committee to deal with non-compliance matters and ethical practices in management.
Our Corporate Responsibility program includes sponsorship of educational funds for primary schools in rural areas, and local blood donation
programs. In 2008, we contributed funds for reconstruction efforts following the devastating earthquake in Sichuan.
We have recently initiated resource conser-vation programs at all Greater China sites and have set aggressive goals to achieve signifi-cant reductions in paper, water and electricity consumption.
To ensure we retain our staff and reward them appropriately, we have key talent programs for career development and succession planning, as well as recognition programs.
Our management team continuously monitors our compliance and performance against ST’s Sustainable Excellence objectives and our employee inputs are channeled through our employee engagement survey.
We work with government institutes and major universities in China and Taiwan and sponsor joint academic research labs. We also partici-pate in China’s standard committees for key technologies.
Production quality in China has been an issue recently in the international press. How do we guarantee the quality of our products?
We apply the same quality-assurance processes in China as we do anywhere else in the world. In addition, we have established continuous im-provement programs relating to various areas such as products, processes and raw materials. All of our manufacturing sites, including regio-nal and division group locations, are certified to ISO/TS 16949 standards, and external audits in Greater China over the last two years have not found any major discrepancies.
A recent example highlighted how our quality program works here in Greater China. In De-cember 2007 we had the ground-breaking ce-remony for our latest Back-end manufacturing site at Longgang, in southern China. Construc-tion started in April 2008, and was accelerated in September. By December 2008, we achieved the targeted yield rate. Quality production at the speed of China!
This is a significant achievement demonstrating our quality commitment in China, and in our world of Sustainable Excellence.
Increasingour presence in China
Interview with Bob KrysiakCorporate Vice President and General Manager, Greater China Region

16
Economic impact I Socially Responsible Indices
STMicroelectronics has been selected for inclusion in the Ethibel PIONEER and Ethibel EXCELLENCE investment registers (see www.ethibel.org)sinceMay2004,andreconfirmedinMarch2009,andiscontinuallymonitoredregardingitsCSRprofile.
Our 2008 performance was also evaluated by the Dutch rating agency Oekom. ST’s rating of Prime means that it is among the world’s best companies within the same industry and fulfillsthesector-specificminimumrequire-mentsdefinedbyOekom’sresearchtobebestin class.
STMicroelectronics continues to be a mem-bercompanyoftheFTSE4GoodIndex,theresponsible investment index calculated by global index provider FTSE Group. Global investors are increasingly concerned with the management of environmental and social risksintheirportfolios.AsamemberoftheFTSE4GoodIndex,ourcompanyisdemonstra-ting that it has the policies and management systems in place to help address these risks.
Our activity with the extra-financial community
This is why on an annual basis we intend to give an overview of our Corporate Responsibility strategy, our achievements at company and local levels and a description of the challenges we face.
It has always been our policy that in Corporate Responsibility things are never black or white, but that there has to be a process of continuous improvement while adapting to a changing business environment.
On a regular basis, our company is evaluated by rating agencies and extra-financial analysts working with ethical indices or asset manage-ment companies, meaning that our evaluation has a direct impact on potential investors in the company.
These evaluations may take place in two diffe-rent ways, within a fixed period (from 10 days to 2 months) and based on publicly-available information:
• firstly,throughspecificquestionnairesfor which we provide detailed information. This is a method for agencies to complement the elements published in the Corporate Responsibility report.
• secondly,theratingagencymayhavealready prepared an evaluation draft of our company and send it to us for review. We provide rele- vant data and evidence when something seems incomplete, unclear or inaccurate.
Following this correspondence, the rating agency provides our final rating.
Concrete outcome of these evaluations
Such evaluations allow investors to make more informed decisions. It is also a very interesting process for our company as it helps us unders-tand where we stand and it may give us an idea of new challenges and where we should focus our efforts in the future.
In 2008, STMicroelectronics was included in five main socially responsible investment (SRI) indices:
•AdvancedSustainablePerformanceIndices Eurozone (France);
•DowJonesSustainabilityIndices(US);
• ECapitalPartnersIndices(Italy);
• EthibelSustainabilityIndex(Belgium);
• FTSE4Good(UK).
How is our Corporate Responsibility performance evaluated?
A company cannot just pretend to be responsible. We are accountable for what we do on a daily basis in our business activity but also for what we publish and communicate.
Our results in 2008

17
Innovation and R&D I Economic impact
As a high-tech company, ST’s success comes from developing state-of-the-art technologies, products and solutions, which themselves require constant innovation. Innovation is an indisputable competitive advantage and an important lever for strong and sustainable economic growth.Our Principles for Sustainable Excellence clearly state the vital aspect of innovation for ST, and many programs are already on-going within the company to encourage it in all its forms.In 2008, the Central Research and Develop-ment organization based in Rousset was looking for a program to stimulate innovation and contacted STU for support and services to help develop the right scheme.
WhydidyoustarttoworkwiththeR&Dorganization?The Central R&D organization felt that impro-vements could be made within its organization and that it needed some help to define how to do this and what might be achieved. We decided to start with an awareness training program – From Creativity to Innovation – to encourage people to nurture their creativity and make the best use of their ideas. In the meantime, we worked on a diagnosis of the or-ganization’s needs and on how to satisfy them.
How did you define their needs?We decided to organize three one and a half hour sessions, each with a panel of stakehol-ders: R&D managers, R&D teams and internal customers (i.e. people from product groups). We asked them to identify the R&D strengths and weaknesses for innovation. The results of these workshops illustrated different points of view, as well as generating numerous new ideas about innovation. Among the issues identified, we focused on informa-tion sharing, collaboration between R&D and
internal customers, and anticipation for radical innovation.The Innovation Booster program was the answer proposed by STU to respond to those needs.
Can you tell us more about this Innovation Booster?Based on the outcome of previous workshops and all the proposed ideas, we obtained 20 themes that we submitted for the approval of the Rousset R&D organization and a panel of their internal customers. Four themes were selected and groups of volunteers constituted.We then proceeded to follow three steps. Step one was to: • clarifytheinnovationsubjectsthrough divergent thinking* (with input from external guests) and convergent thinking* brainstor ming methods; • allowtheemployeestounderstandinno vation methodology (including observation of potential final users, customer value, sales strategy, internal sponsors, external partners and risk analysis);• helpthemrefinetheirteamprofiledimension (e.g. creator, advancer, refiner or executor) which will define their potential contribution to the team; • launchtheirinnovationprocessfollowingthe given methodology.During this exploration phase, we organized several informal meetings with each team to gather their feedback and see the potential challenges they were facing.Step two consisted in sessions with a consul-tant and guests to:• focusonobstaclesremoval;• definethemarketingandfinancialaspectsof the projects.
Step three took place two or three months later with the objectives to: • convertteams’experienceintovaluable knowledge; • helpthemsellinternallytheirinnovation projects. Several presentations are planned for 2009 in front of project sponsors, a committee of direc-tors and other ST employees.
Whatmakesthisprojectdifferentfromprevious ones?The major difference is that internal customers from product groups are involved from the very beginning and then throughout the process, which allows a broader consideration of their needs, constraints and expectations. We think it is very important to work in teams with diffe-rent profiles and expertise. The methodology also involved external view points and contributions with guests, consul-tants and input from potential end-users. This makes the project more objective and robust.Lastly employees volunteer to enter the pro-gram and their management fully trusts them to nurture their ideas and complete the project successfully. This is a real means of empower-ment for them. The ideal outcome of this program is to apply this innovation methodology in the normal course of business. The plan is to integrate this methodology in the innovation process of the R&D organization.
(*) Divergent thinking aims at generating a maximum of ideas linked to a theme.(**) Convergent thinking aims at organizing many ideas around one main concept.
ST stimulates innovationIn 2008, ST University launched a new program to stimulate innovation within the company. This new process involves people from across the company with new approaches.
Interview with Sylvie PheulpinSTUniversityInnovationProgramManager,Fuveausite,France
Economic Performance overview 08
18
HIGH LEvEL OBJECtIvE
Satisfyingshareholders’expectationsthroughfinancialandnon-financialperformance
In 2008, our revenues decreased 1.6% to US$9.84bn compared to US$10.0bn in 2007Our revenue growth has been impacted by two important factors: the deterioration of the market and the change in the structure of our company. The semiconductor industry was negatively impacted by the difficult conditions in the global economy, which resulted in a sharp downturn starting in the beginning of the third quarter and further accelerating in the last quarter. These deteriorating conditions caused the total available market (TAM) to decline by 2.8% com-pared to the previous year, while the serviceable available market (SAM) registered a small 2.4% growth. Excluding the Flash segment, which was deconsolidated during the first quarter, and the recently consolidated NXP Wireless business, our growth in revenues was 4.8%, which was significantly above the evolution of the TAM and the comparable SAM. This performance re-flected double-digit or high single-digit growth rates in all main market applications except for Computer, which experienced more moderate growth, and Automotive, which declined on a year-over-year basis.
Our profitability in 2008 was negatively impacted by several factors:• adownwardtrendinprices,whichwasreinfor ced by the market conditions; • impairmentandrestructuringcharges,and other related closure costs, which totaled $481m; • theweakeningoftheeffectiveUSdollar exchange rate, which was US$1.49 for €1, reflecting actual exchange rates and the impact of our currency hedging contracts, compared to US$1.35 for €1.00 in 2007, cutting our gross margin by approximately 150 basis points; • theimpairmentlossrecordedonourequity investment in Numonyx; • theone-timecostsrelatedtothepurchase accounting procedures for acquisitions.
But our financial performance was better than 2007The negative factors above were partially offset by our improved product mix, which contribu-ted to our revenue, and by the improvements in our manufacturing performance. Our gross
margin increased 80 basis points to 36.2%, and our reported operating result in 2008 was a loss of US$198m compared to a loss of US$545m in 2007. This operating result was largely impacted by impairment, restructuring charges and other costs related to sites closure and acquisitions. Excluding such factors, our operating perfor-mance would have been equivalent to a pro forma profit of US$468m. In 2007, the equivalent operating pro forma profit, also excluding one-time elements, would have been US$683m. 2008 was an important year for advancing the repositioning of our product portfolio, focusing on power applications and multimedia conver-gence through Wireless and digital consumer products. We made significant progress as we gained market share, and we will continue this momentum in 2009 as we focus on developing more innovative products. Our 2008 revenue was better than the performance of the overall market, and we believe we have approached a record level market share.We also generated net operating cash flow of US$648m for the full year, excluding payments for mergers and acquisitions transactions, and we finished 2008 with a solid financial position.
5 For more details please refer to our 20-F report
RewardingourshareholdersWe remain focused on creating value for our shareholders, which we measure in terms of return on net assets in excess of our weighted average cost of capital. In the current economic environment, we are also focused on maintai-ning our solid financial position.At the Annual General Meeting on 14 May 2008, shareholders approved the distribution of US$0.36 per share in cash dividends, payable in four equal quarterly installments. Up to 31 December 2008, payments totaled US$0.27 per share or approximately US$240m. The remaining US$0.09 per share cash dividend to be paid in the first quarter of 2009 totaled US$79m and was reported as “dividends payable to sharehol-ders” on the company’s consolidated balance sheet as at 31 December, 2008.
5 For more details please refer to our 20-F report
Our sales by market segmentFrom1January2007to2August2008, we reported our semiconductor sales and operating income in the following product segments:
• ApplicationSpecificGroups(ASG):Home Entertainment and Displays Group (HED); Mobile, Multi-media and Communications Group (MMC); Automotive Products Group (APG); and Computer Peripherals Group (CPG); • IndustrialandMulti-segmentSector(IMS): Analog, Power, and Micro-Electro-Mechanical Systems (APM); and Microcontrollers, non- Flash, non-volatile Memory and Smartcard products (MMS); • FlashMemoriesGroup(FMG).Asof31March 2008, following the creation of Numonyx Holdings B.V. in partnership with Intel and Francisco Partners, which is a new indepen dent semiconductor company from the key assets of our and Intel’s Flash memory business (FMG deconsolidation), we ceased reporting under the FMG segment.From2August2008, following the creation of ST-NXP, we reorganized our product groups. The new organization is as follows:
• Automotive,Consumer,Computerand Communication Infrastructure Product Groups(ACCI):- Home Entertainment and Displays (HED), which now includes the Imaging division;- Automotive Products Group (APG); - Computer and Communication Infrastructure (CCI), which now includes the Communication Infrastructure division.• IndustrialandMulti-segmentProducts Sector(IMS),comprised of:- Analog, Power and Micro-Electro-Mechanical Systems (APM); - Micro, non-Flash, non-volatile Memory and Smartcard products (MMS).• WirelessProductsSector (WPS), comprised of three product lines:- Wireless Multi Media (WMM);- Connectivity & Peripherals (C&P);- Cellular Systems (CS).
5 For more details please refer to our 20-F report
OurinclusioninSociallyResponsible Investment indicesIn 2008, ST confirmed its inclusion in major Socially Responsible Investment (SRI) indices. M For more information, see page 16

19
ST key figures l EC1 l
2006 2007 2008
X St1 Net revenues US$ 9,854m US$ 10,001m US$ 9,842m
X St3 Net earnings US$ 782m US$ (477)m US$ (786)m
X St2 Gross profit US$ 3,523m US$ 3,536m US$ 3,560m
X St4 Earnings per share US$ 0.83 US$ (0.53) US$ (0.88)
X St5 Gross profit as a % of sales 35.80% 35.40% 36.20%
X St6 Market share versus SAM* 5.70% 5.70% 6.10%
Dividendspaidl EC1 l US$m
2004 2005 2006 2007 2008
Dividends 107 107 107 269 240
Operating income and cash flow l EC1 l US$m
2004 2005 2006 2007 2008
Operating income 683 244 677 (545) (198)
Net operating cash flow 208 270 666 840 648*
Average daily trading volumes l STE8 lEuronext Paris/Borsa Italiana Milan/NYSE
Share price 2008, NYSE l STE8 l US$
ST sales by region l EC1 l 2.7 l STE7 l %2004 2005 2006 2007 2008
Europe 32.3 31.4 31.2 31.6 28.5
North America 15.5 14.4 12.5 11.8 11.8
Asia Pacific 21.2 20.9 21.1 18.7 22.4
Greater China 21.2 24.8 25.9 27.5 25.3
Japan 4.6 3.5 4.1 4.7 5.2
Emerging market 5.2 5 5.2 5.7 6.8
ST sales by market segment l EC1 l 2.7 l STE9 l %
2004 2005 2006 2007 2008
Automotive 15 16 15 15 13
Computer 16 17 17 16 15
Consumer 21 18 16 17 17
Industrial 16 14 14 15 17
Telecom 32 35 38 37 38
ST sales l EC1 l US$m
2004 2005 2006 2007 2008
ST sales 8,760 8,882 9,854 10,001 9,842
ST inclusion in the main sustainability indices l STE11 l
ASPI (France)
DJSI (Switzerland)
Ethibel Sustainability Index (Belgium)
ECPI (Italy)
FtSE4GOOD (United-Kingdom)
tOtAL
DJSI World
DJSI STOXX
DJSI EURO STOXX
ESI Pioneer Global
ESI Excellence
Global
ESI Excellence
Europe
Ethical Index Euro
FTSE4 GOOD Europe Index
FTSE4 GOOD Global Index
2008 a a a a a a a a a a 10
0
5
10
15
20
25
DecNovOctSeptAugJulJunMayAprMarFebJan0
5
10
15
20
25
DecNovOctSeptAugJulJunMayAprMarFebJan
Number of shares (million) High price
Low price
(*) Serviceable Available Market.
5 You can find the full disclosure on management approach in st.com/sustainable development
M For information on the indicators presented in this section, please refer to the Reader’s Guide at the beginning of this report
(*) Excluding payments for mergers and acquisitions (Genesis and NXP) which totalled US$1,694m.

Economic Performance overview 08
20
HIGH LEvEL OBJECtIvE
Create economic value for stakeholders
Economic impact on four key stakeholders I EC9 I STE10 I
Some key achievements in partnership with our customersWe have sought to develop a competitive advantage by building an integrated presence in each of the world’s economic zones that we target: Europe, China, the rest of Asia, and North and South America. An integrated presence implies having design centers as well as sales and marketing teams close to our key custo-mers in each region, in order to develop strong relationships with them.Understanding or even anticipating their needs helps us develop innovative products that will fuel our growth and secure market share. We made some key achievements in different sectors during 2008.Digital Consumer: our STDP3100 DisplayPort products were adopted by two leading LCD and plasma TV makers for full HD 120Hz TV systems, and we won two designs in Korea for home en-tertainment systems including the latest sound terminal family of devices.Computer peripherals: we achieved a major design win for a 40nm SoC (System on Chip) from a leading hard disk drive manufacturer, and another one for a 40nm ASIC for the printer and imaging market.Automotive: through cooperation with LG Chem, we developed a battery pack that signi-ficantly reduces an electric or hybrid vehicle’s fuel consumption and CO2 emissions; we were also selected by two major system makers for a telematics application in South America and a road tolling system in Europe.Wireless: we started production of a 3G cellular platform for a tier-one customer, as well as the mass production of the world’s first 3G unli-censed mobile access enabling mobile phones that can switch seamlessly from cellular to Wi-Fi networks.MEMS (Micro-Electro-Mechanical Systems): we were the top supplier of MEMS for consumer and portable handset applications according to iSuppli. We introduced a compact high-per-formance three-axis accelerometer family with reduced power consumption, and we develo-ped several new applications expanding beyond
consumer and Wireless to automotive, medical and industrial applications.Smartcards: we introduced a smartcard Inte-grated Circuit (IC) for secure identity cards that supports the latest encryption techniques and a large memory for biometric data.
Creating value for our suppliersWhile the amount paid to suppliers of tangible assets is an official and audited figure publi-shed in our 20-F report, the split of purchases between tangible assets, materials and others is based on different data sources and time-frames. It aims to give a realistic picture of the most important transactions between ST and its main supplier categories, but it should not be considered as official and audited accounting information.We use three main critical types of suppliers in our business: equipment suppliers, raw material suppliers and external subcontractors.The quality and technology of equipment used in the IC manufacturing process defines the limits of our technology. Demand for increasin-gly smaller chip structures means that semicon-ductor producers must quickly incorporate the latest advances in process technology to remain competitive. Advances in process technology cannot be brought about without commensu-rate advances in equipment technology, and equipment costs tend to increase as the equip-ment becomes more sophisticated.Our manufacturing processes use many raw materials with volatile prices. We obtain our raw materials and supplies from diverse sources on a just-in-time basis. We also use external subcontractors to out-source wafer manufacturing and assembly and testing of finished products.
Our economic contribution to societyTaxes are part of our normal economic contri-bution to society, but we operate in many jurisdictions with highly complex and varied tax regimes. Our tax rate is variable and depends on changes in the level of operating profits within various local jurisdictions, on changes in the applicable taxation rates, and on changes in estimated tax provisions.
We currently enjoy certain tax benefits in some countries, but these benefits may not be available in the future due to changes in local jurisdictions.
Other developmentsWe continue to believe that the shared R&D business model, based on cooperation and alliances for R&D, as well as manufacturing and foundry partnerships, provides us with a number of important benefits. These include: sharing of risks and costs, reductions in our own capital requirements, acquisitions of technical know-how and access to additional production capaci-ties. In addition, this R&D model contributes to the fast acceleration of semiconductor process technology development while allowing us to lower our development and manufacturing costs.Coming into effect from 1 January 2008, we signed an agreement with IBM to collaborate on the development of advanced CMOS process technology used in semiconductor develop-ment and manufacturing. The agreement inclu-des 32nm and 22nm CMOS process-technology development, design enablement and advan-ced research adapted to the manufacturing of 300mm silicon wafers. This is being developed at the IBM premises in Fishkill, NY, USA. The agreement also covers value-added deriva-tive System-on-Chip (SoC) technologies, which are to be developed at Crolles, France. Finally, the agreement with IBM includes collaboration on intellectual property development and platforms to speed the design of SoC devices in these technologies. In August 2008, we signed an agreement with Infineon Technologies and STATS ChipPAC Ltd. to jointly develop the next-generation of em-bedded Wafer-Level Ball Grid Array technology (eWLB). This is based on Infineon’s first-gene-ration technology, for use in manufacturing future-generation semiconductor packages. We believe this alliance will fully exploit the poten-tial of Infineon’s existing eWLB packaging tech-nology, which has been licensed by Infineon to us and STATS ChipPAC.
35%
2007 2008
35%
31%
34%
34%
31%
35%
Purchase expenses by category All taxes paid l EC1 l US$m
2004 2005 2006 2007 2008
Taxes paid in the year 168 122 98 64 49
Payments for purchases of tangible assets l X STE1 l US$m2004 2005 2006 2007 2008
Purchases of tangible assets 2,050 1,441 1,553 1,140 983
Outsourcing and others
Manufacturing materials
Asset purchase and maintenance
21
HIGH LEvEL OBJECtIvE
Creating the conditions for Sustainable Innovation
ResearchandDevelopmentfundingWe participate in a number of Research and Development programs established by the EU, individual countries and local authorities across Europe, principally in France and Italy. Such funding is generally provided to encourage R&D activities, industrialization and the economic development of underdeveloped regions. These programs are characterized by direct support of some R&D expenses or capital investment from low-interest financing.The main programs for R&D in which we are involved include: the Cluster for Application and Technology Research in Europe on NanoElec-tronics (CATRENE) R&D program, which is the successor of MEDEA+; EU R&D projects with FP6 and FP7 (sixth and seventh frame programs) for Information Technology; and national or regio-nal programs for R&D and industrialization in the electronics industries involving many companies and laboratories. The pan-European programs cover a period of several years, while national or regional programs in France and Italy are subject mostly to annual budgets.
5 For more details please refer to our 20-F report
R&DexpensesOur R&D expenses increased in 2008 for several reasons, such as the US$97m of one-time char-ges written off from intellectual property R&D and US$23m of amortization of acquired intan-gible assets related to the purchase accounting for the NXP Wireless business and Genesis. In addition, there were further expenses in 2008 from the expansion of our activities following the acquisition of Genesis and a 3G Wireless design team, as well as those associated with the integration of the NXP Wireless business. The
negative impact of the US dollar exchange rate also contributed to the increase. Such higher expenses, however, were partially offset by the benefits of the FMG deconsolidation (Numonyx).
5 For more details please refer to our 20-F report
R&D:criticalforsuccessOur advanced R&D centers are strategically located around the world: • France(Crolles,Grenoble,ToursandRousset); • Italy(AgrateandCatania); • US(Phoenix,CarrolltonandSanDiego); • Canada(Ottawa); • UK(BristolandEdinburgh); • Switzerland(Geneva); • India(GreaterNoidaandBangalore); • China(Beijing,ShenzhenandShanghai); • Singapore; • Netherlands(Nijmegen); • Germany(Nurnberg);and • Belgium(Zaventem).The Agrate R2 (Italy) activity encompasses prototyping, pilot and volume production of newly developed technologies with the aim of accelerating process industrialization and time-to-market for smart-power affiliation (BCD). This has been developed through a consortium with Numonyx. Future decisions by Numonyx may affect ongoing joint R&D activities in Agrate R2. Our intellectual property design center in Greater Noida (India), supports all of our major design activities worldwide and hosts our cen-tral R&D activity, which is focused on software and core libraries development, with a strong emphasis on system solutions. Our corporate technology R&D teams work in a wide variety of areas that offer opportunities to harness our deep understanding of microelectronics and
our ability to synthesize knowledge from around the world. The fundamental mission of our Advanced System Technology (AST) organization is to create system knowledge that supports our SoC development. AST’s objective is to develop the advanced architectures that will drive key strategic applications such as digital consumer, Wireless communications, computer peripherals, smartcards and emerging automotive applica-tions. We have divisional R&D centers in Castelletto, Catania and Tours to carry out more specialized work that benefits from their close relationship to their markets. For example, Castelletto pio-neered the BCD process that created the world smart-power market and has developed advan-ced MEMS technology used to build products such as inkjet printheads, accelerometers and the world’s first single chip microarray for DNA amplification and detection.The ASDTM technology developed at Tours has allowed us to bring to the market numerous products that can handle high bi-directional currents, sustain high voltages or integrate va-rious discrete elements in a single chip, such as IPADs. ASD technology has proved increasingly successful in a variety of telecom, computer and industrial applications.The Catania facility hosts a wide range of R&D activities and its major divisional R&D achieve-ments in recent years include the development of our revolutionary PowerMESHTM and STripFETTM MOSFET families.
5 For more details please refer to our 20-F report
R&Dengineersandtechniciansbyregionl X STE5 l
2006 2007 2008
Europe 4,857 6,958 7,011
Americas 352 407 702
Asia/Pacific 1,730 2,399 2,943
Others 256 489 428
total 7,195 10,253 11,084
ST patent applications filed by region l X STE6 l2004 2005 2006 2007 2008
Italy 239 253 212 152 175
France 245 310 233 204 141
Rest of Europe 75 69 59 49 36
Americas 69 39 41 33 70
Asia-Pacific 86 49 62 59 63
total 714 720 607 497 485
Partnerships with the academic community l SO1 l STE3 l X STS44 l
2005 2006 2007 2008
Partnerships with universities, colleges, schools
217 236 335 437
R&Dexpendituresl X STE4 l US$m2004 2005 2006 2007 2008
Expenditures 1,532 1,630 1,668 1,802 2,152
R&Dheadcountevolutionl X STE5 l 2004 2005 2006 2007 2008
Overall R&D headcount 9,800 9,700 10,300 10,341* 11,162
R&D engineers and technicians 6,003 6,570 7,195 10,253* 11,084
(*) 2007 figures are slightly different from the ones published in our CR Report last year, because we have reclassified our employees according to an updated job referential. The impact on total R&D population is minimal, but the split between engineers/technicians and operators has changed significantly. This new perimeter integrates also the Numonyx divestiture and the NXP Wireless integration.

22
To ensure the right deployment of our
Principles for Sustainable Excellence
in the daily practice on all ST sites at
worldwidelevel,wehaveembedded
the program into our management
systemstructure,afterQualityandEHS,
also covering Labor and Ethics.
From the Sustainable Excellence
Council at corporate level with the
participation of SE sponsors from
mainorganizationsandmajorsites,
we follow the concrete activities of the
sites through their local SE steering
committees.
Startingin2009,eachmajorsitewill:
• haveaSustainableExcellencetop
page with SE objectives and targets;
• participatetoaSEdashboardtore-
port its performance including results
onkeyperformanceindicators,self-
assessments,deploymentofStandard
OperatingProcedures(SOP),good
practices and awards received.
Having implemented such manage-
ment system approach for Labor and
Ethics will help us:
• becompliantwithEICCmembership
requirements;
• continuouslyidentifypotentialissues
and improvement path;
• keeptheseactivitiesaliveatsitelevel;
• rewardandrecognizesites’
achievements.
Sustainable Excellence in daily practice +45% increase
for integration of disabled
employees
11years is the average
career length in ST
87 local recognitions
received for excellence in
Corporate Responsibility
Social

23
Training I Social performance
ST Trains ST
The objective of ‘ST Trains ST’ is to support the deployment of courses and programs within ST by training the company’s employees to become high quality, professional part time facilitators and course developers.
How has the principle developed?
ST University (STU) has developed its teaching know-how and support services, including facilitation skills, instructional design and train the trainer courses.
Through this program, STU has developed new courses that respond to specific needs either on a corporate or local site level, and that maintain an effective information cascade in the organiza-tion. For 15 years, this program has consistently shown concrete positive results.
ST University continues to adapt its courses to fit the evolving business environment and the latest trends in teaching. STU has develo-ped fast and easy access to online tools and training opportunities, such as performance gap analysis tools and course on developing training material.
Through the ‘ST Trains ST’ process, employees become STU Associate Trainers, a certification in line with STU’s quality standards. Certified STU Associate Trainers are recognized at ST sites around the world at dedicated awards ceremonies.
The main benefits to ST of the ‘ST Trains ST’ program are:
• aneffectivemethodofanalyzingthetraining needs of the company, confirming the perfor- mance of the learning solutions available and providing indicators to measure their impact;
• developinghighqualityteachingskillsinthe design and delivery of different learning solutions;
• contributingtocosteffectivenessandtime savings, and access to high quality programs internally designed and delivered;
• disseminatingefficientlyourcompany culture;
• developinganinternalnetworkofexperts on varying subjects worldwide;
• drivingkeylearninginitiativesthroughoutthe company with a highly motivated, effective and professional team of facilitators.
Foremployees,therearenumerousbene-fits in becoming an STU Associate Trainer:
• aspartofdailyworkinglife,itopensnew opportunities, and gives visibility and recogni- tion as a subject matter expert, developing the employee’s contacts and network;
• ithelpstheemployeedevelopskills,compe tencies and expertise to facilitate training and/ or design and develop training materials;
• employeescancontributetotheirlocalsite’s training deployment in line with the needs identified through the local training needs analysis.
To sum up, even in a climate of cost reductions and restrictions on travel, in 2008 this STU program:
• trainedover11,000employeesvia1,136trai ning sessions;
• delivered17,328hoursfromSTUAssociate Trainers;
• certified56newSTUAssociateTrainersbrin ging the total number of active certified STU Associate Trainers to 626.
Now, more than ever before, the ‘ST Trains ST’ principle is a central method of our training and learning opportunities provision for our employees, especially in a period of cost reduction and travel restrictions. STU learning
solutions cover five major categories I LA11 I
• Management – representing 35.3%
of total STU training hours
• Job-specific: 31.1%
(excludes all technical training)
• Personal development: 26.2%• Masters in microelectronics: 0.6%• Tools and methodologies: 5.3%
2008 indicatorsSTU activity versus ST training activity: 2.48%STU training hours: 46,678ST training hours: 1,879,394

24
Social performance I Restructuring activities
Follow-up on our worldwide restructuring plan
For several years now, ST has been conducting several restructuring plans in various plants and countries, to sustain its competitiveness and adapt to the evolving reality of the semiconduc-tor market.
In previous Corporate Responsibility reports, we have explained this restructuring, its implemen-tation in the field, and also presented details about the employees affected and the measures taken to support them in these difficult times.
Following is an update on this restructuring activity in 2008.
Update on the US closure
As explained in the 2007 report, ST has decided to close two Front-end manufacturing sites: Phoenix (Arizona) and Carrolton (Texas).
The site management teams have been following planned workforce reductions and production decreases as originally disclosed.
All employees initially affected have received a retention package to manage activity at the sites until they are finally closed.
In 2008:
• 143employeesleftthecompany;
• allemployeeswhoweretemporarilyretained had the opportunity to attend on-site training classes in subjects such as résumé writing, interviewing skills and financial planning;
• allemployeesimpactedbytheworkforce reductions were provided access to external assistance and advice.
Due to the impact of the ongoing difficult glo-bal economic conditions, the decision was taken to cease manufacturing in Carrolton in 2009.
To ensure continuity and service to our custo-mers, our management has decided to keep a mini production line for automotive products in Phoenix, with the support of approximately 400 employees.
Restructuringwithasociallyresponsiblecommitment in Toa Payoh (Singapore)
“Thank you ST for taking care of me all these years,” said Tan Chwee Huay to management, staff and colleagues on her last day with ST after 37 years of service.
Chwee Huay was one of the 215 employees released by Packaging and Test Manufacturing (PTM) Toa Payoh during the lay-off exercise in December 2008. These employees were among those affected by Toa Payoh’s restructuring initiative, which started in 2006 to streamline its Back-end manufacturing activities. Despite the best efforts of ST’s Human Resources team, it was not possible to identify positions that match their skills within the company or to redeploy them to other job functions.
A further 580 affected employees were suc-cessfully re-trained between 2006 and 2008, under the company’s Re-skilling Program and redeployed to ST’s wafer-fab plant in Ang Mo Kio, providing them with continual employment with ST.
In order to sustain our competitiveness and mar-ket advantage, the difficult decision was taken to lay-off those employees who were not able to find a job match within the company.
However, as ST was keen to make the restruc-turing process as easy as possible for those concerned, there was a comprehensive exercise of planning and discussion with top manage-ment, operational managers, trade unions and government agencies such as the Ministry of Manpower and e2i – Employment & Employa-bility Institute. Besides an equitable redundancy package for the affected employees and a one-
year extension of medical insurance benefits, ST has also partnered with e2i to embark on an Employability Camp to help prepare staff for future job opportunities.
Such collaboration has once again demonstra-ted the strong ties and healthy tripartite labor relations between ST, trade unions and govern-ment bodies. We have been working with unions and the Workforce Development Agency (WDA) since 2006 on the Reskilling Program and have gained much national recognition.
The retrenchment exercise was conducted in five sessions over three days. During commu-nication sessions with the affected employees, Xavier Baraton, Acting Plant Manager, PTM Toa Payoh, explained the reasons behind the com-pany restructuring.
Trade union and e2i representatives were also present to explain what options were available and how the joint programs with ST may benefit employees. In addition to the training options available, a job fair was organized by e2i for workers to meet other prospective employers and find alternative employment.
Many of the affected employees were positive about their future prospects.
Abidin Laken, a Technician said: “Helping us to go for training almost immediately after we have lost our jobs gives us much hope.”
After those colleagues departure, a dedicated communication plan was organized for our retained employees. Their morale remains positive, with high levels of productivity, output and quality standards continuing to be achieved by our team.
Trade union representatives have expressed appreciation of the ST’s efforts to help our em-ployees affected by the restructuring. In a news-letter of National Trade Union Congress, NTUC Deputy Secretary-General and UWEEI Executive Secretary, Halimah Yacob, said: “Our experience with STMicroelectronics in helping to redeploy workers to higher value-added jobs and the current retrenchment exercise is a positive example of how restructuring and redundancies, if unavoidable, can be done in a manner that is less painful and disruptive to the workers.”
Xavier Baraton, expressing agreement with Ha-limah Yacob, said: “The retrenchment had to be done for the sustainable competitiveness of the company. However, we have tried to demons-trate the care and support that our employees deserved after working so many years in the company.”
Restructuring is never an easy process and this was recognized by ST’s top management in the annual presentation made to all ST employees around the world.

25
GAMAEinFrance
Following an internal investigation on jobs’ evolution in our sector and pushed by the Semi-conductor Industry context in 2008, it became clear that ST France has to adapt and prepare employees to a change in their competences. On a short term, they will have to adapt their competences to the demanding software and hardware integration applications’ field.
Consequently, on 1 July 2008, ST France signed a national agreement with trade unions represen-tatives that had two core objectives.
1. Implementing a strong company policy to anticipate and manage jobs and the deve-lopment of skills, mainly by the mean of an ambitious re-deployment plan through heavy professional training, tutoring and internal mobility programs for employees who volunteer to take part.
2. Developing alternative plans for employees wishing to orient work projects outside ST.
The agreement was named GAMAE from the French Gestion Anticipée des Métiers et Activités en Evolution, which means Anticipated Management of Evolving Jobs and Activities.
During the application period, 813 employees anonymously contacted the support center dedicated to help people build their professio-nal evolution project.
Of these, 418 decided to make an official application and 358 projects were eventually validated: • therewere29employeesredeployedtootherST jobs through processes of comprehensive professional training and tutoring. Training
courses have been defined individually in order to match each individual’s current competencies and job history with the requirements of their new jobs. To ensure a successful transition, we have established up a ‘sandwich course’ ap-proach in order to alternate theoretical knowled-ge with practical tasks. Total training programs can last up to 87 days over a 12 month period;
• 329employeesmovedtonewpositionsoutside ST. Of these, 153 set up new compa-nies, 99 moved to new external jobs and 77 undertook long-term training for a complete career change. These projects are very diverse, illustrating the breadth of people’s interests and their determination, and include the creation of equestrian center, four-years of training to become a physiotherapist or taking up a new job as teacher.
All those projects are being progressively implemented. All internal redeployment training programs have started and will continue during 2009. Employees who preferred a job evolution outside ST have been granted the ‘mobility leave’ scheme. This leave allows employees to receive ST financial support for an eight or nine month period, during which specialized support from consultants continues. Where employees are creating new companies, the support is provi-ded for an even longer period of two years.
From an ST perspective, the results of this pro-gram have positive and negative aspects.
On the one hand they demonstrate the strength of ST’s employees, who are ready to take their professional evolution into their own hands, developing their own skills in the process. Set-ting up of new small companies will also help
develop employment prospects in local regions.
On the other hand, ST recognizes the need to convince our employees of the benefits of internal job redeployment, to new core strategic areas. Learning from our experiences in this area during 2008, we will negotiate new agreements with unions in 2009 that put more emphasis on ways of supporting internal ST redeployment.
Back-end activity transfer in MoroccoTo maintain the company’s competitiveness, ST’s Top Management took the decision in 2007 to concentrate all remaining Back-end activity at a single site, at Bouskoura in Morocco. The main challenge for ST’s Morocco management team was to ensure a synchronization of the phasing down of the Ain Sebâa site and the Bouskoura site’s ramp up.The transfer of operations from the Ain-Sebâa site began at the end of 2007, with the main part taking place during 2008. The site will finally close in March 2009. The social impact of the restructuring plan was addressed by a range of actions including inter-nal mobility, promotion, outplacement and early retirement. About 2,000 people were affected by this program: 1,457 people have been transfer-red gradually to Bouskoura and about 700 have left the company. The objective was to propose a personal solution to each individual employee affected and to reduce the social impact of the company restructuring as far as possible.Our challenge was to conduct and manage these changes with efficiency and to maintain and improve our performance in terms of com-petitiveness, quality and service and to ensure the well-being of our employees.

26
Social performance I Diversity
Background to ST’s diversity program
The first steps of STMicroelectronic’s diversity program were to define the company’s position on the issue. From there, beyond statutory obligations and relevant sections of our Code of Conduct, there are other specific actions ST has taken to develop a diverse workforce.
Whatisdiversityandwhyisitso important ?
ST is convinced that diversity creates value for all stakeholders of the company – shareholders, customers, suppliers, employees and the wider society in which we operate. Diversity is a res-ponse to business because it‘s a way to:
• avoidashortageofemployeetalentbyre cruiting from a wide variety of sources;
• innovateandbeclosetothecustomer;
• improvethereputationofthecompanyand attract the best candidates;
• improvethesocialclimateofthecompany.
Each site should continually develop its own approach within the framework of the Principles for Sustainable Excellence.
ST France has made progress regarding gender diversity, with:
• anagreementsignedinJune2006by company and union representatives;
• anequalopportunitiescommitteesetupat each ST site with union representatives to follow up implementation of the agreement;
• manylocalactivitiesdeployedatsitelevel including training sessions, awareness programs and conferences.
STItaly, and more particularly the Human Re-sources department of Agrate site, also created an equal opportunities Committee at Italian le-vel with representative belonging to different ST organizations to analyze the national women’s employment context and in comparison the ST Italy data.
Based on the data analysis above mentioned, they have put in place several actions done, still ongoing or to come, such as:
• dataanalysisonmaternityleavesandbest practices proposals with the support of Bocconi University (Milan, Italy);
• revisionoftheproceduresandinternaltools with particular attention to the maternity leaves;
• thepublicationofamaternityandparental leave guide;
• creationofspecifictrainingcoursesforfemale population;
• internalcommunicationonequal opportunities’ activity; creation of an Intranet web page on CSR web site
• monitoringofthekeyperformanceindicator for women in management.
Also committed to comply with Govern-ment initiatives
In the United States an equal employment opportunity report is sent annually to the US Department of Labor detailing employee data by sex and race. Customers based in the US also require their suppliers to comply with this requirement.
To ensure awareness and adherence to the principles of equal opportunity, the Americas Region has established several complimentary governing Local Operating Policies (LOP). They include; Equal Employment Opportunity State-ment LOP, which sets the framework and Policy for the Region, Anti-Harassment LOP, which defines types of harassment including types in conflict with the Equal Opportunity Policy, and the Corrective Action LOP which outlines ac-tions including termination when in violation of the Equal Opportunity Policy. Human Resource maintains an Open Door policy with appropriate confidentiality for violation reporting.
In Singapore, tripartite guidelines on fair employment practices have been endorsed by Government (represented by Ministry of Man-power), employers (represented by Singapore National Employers’ Federation) and unions (represented by National Trade Union Congress – NTUC) detailing five principles for fair employ-ment: recruit and select employees on the basis of merit, treat employees fairly and with respect, provide employees with equal opportunity to be considered for training and development, reward employees fairly and abide by labor laws and adopt Tripartite Guidelines.
Many of those good practices are being transfer-red to other countries.
ST is convinced that diversity can create value for all stakeholders of the company (shareholders, customers, suppliers, employees, society…).

27
Employee engagement survey
We have chosen an international consultancy company to work with us and provide relevant benchmarks.
Where possible, ST’s scores have been compa-red with results from other companies where similar surveys have been conducted. The companies in the external benchmark span a variety of industries but all employ highly-skilled people, many of whom work in global organizations or for companies that are focused on technology (or both).
This external survey has highlighted various areas where we can improve. The primary objective is to develop higher employee commitment, and there are a number of easily identifiable concrete factors that cause concerns or alternatively that can generate a positive reaction:
• Abruptchangesandnewplayersinthesector have affected our way of working and how we organize ourselves internally. To better address the evolving market, including the impact of new competitors and geographical opportu- nities, we have been through a period of major restructuring. Almost all our main organiza- tions have had to adapt their workforce and activity.
• Initiatedin2007,butmainlyimplementedin 2008, ST has undertaken a major program of mergers and acquisitions.
M For more detail, see page 8
Such major changes, of course, may affect everyday working life for our employees and
generate worries, doubt, expectations and stand-by situations where employees
are not sure how they fit in to a changing organization.
To counterbalance these results, we feel that in such times it is key for a company to
confirm that its culture is understood and shared by all employees. As a positive result,
we have seen that a large majority of our employees:
•understandandsupportST’sSustainable Excellence Principles;
• feelSTisaenvironmentallyresponsible company;
• feeltheirmanagementiscommittedto products’ quality improvement.
In the last couple of years, quality has been a specific focus at ST, and our employees have noticed efforts and improvements.
Looking to the future, there are a number of relevant developments:
• EachorganizationwithinSThasreceiveda customized report detailing its specific deve- lopment opportunities that will best engage employees.
• Severalactionplanningworkshopshavebeen conducted in which the management team has spent time analyzing the survey data and planning actions to address employees’ greatest concerns.
• Feedbackismadeavailabletoeachindividual manager through a web-based resource and best practice tactics customized to their own specific development opportunities.
M For more detail, see page 32
Some key facts the survey was administered between 31 March and 30 April 2008.
45,912ST employees were invitedto participate in the survey
36,887employees responded to the survey, yielding an overall response
rate of 80%
As explained in previous reports, the employee engagement survey has replaced the employee opinion survey that was conducted for several years within STMicroelectronics.
Diversity: a source of innovation in ToursDiversity is a way to integrate people from different nationalities, ages, genders and abilities by looking only at their suitability for the job in question rather than anything else. Diversity was formalized in Tours through several agreements signed by ST and trade union representatives.
Our main actions for diversity in 2008 were as follows:• For integration of disabled people, ST Tours has - adapted workstations to help disabled people carry out their duties;- created a support and counseling services structure; - organized training for medical staff and Human Resources department to raise awareness and help them identify situations of psychological difficulties.• Different events were planned during the year to raise awareness amongst managers and employees about disability through internal newspapers, conferences and local intranet site.• New contracts have been signed with protected work- shops and disabled people from these centers have been hired for special projects.• Integration and hiring of disabled people whenever possible.
Regarding equal opportunities our major trends of development are to:• attract young women to our industry, through developing partnerships with relevant local schools and colleges, and through partnership with the Education Office of Tours and Orléans;• ensure equality of status for men and women in terms of wages policy and management of maternity and parental leaves ;• develop career path for every women by implementing: - a better structure for people reviews, with a specific focus on women who have not had any professional development for seven years;- new training plans. • ensure balance between personal and professional life by :- implementing an inter- company nursery;- proposing personal services (baby sitting, ironing, housework).
ST Tours has created a women’s network made up of 15 volun-teers from different departments and levels of management. This network aims to promote our company internally and externally (see picture on page 26).
Interview with Ingrid ReboutHuman Resources and Internal Communication Manager, Tours, France, explains the benefits of a diverse workforce.
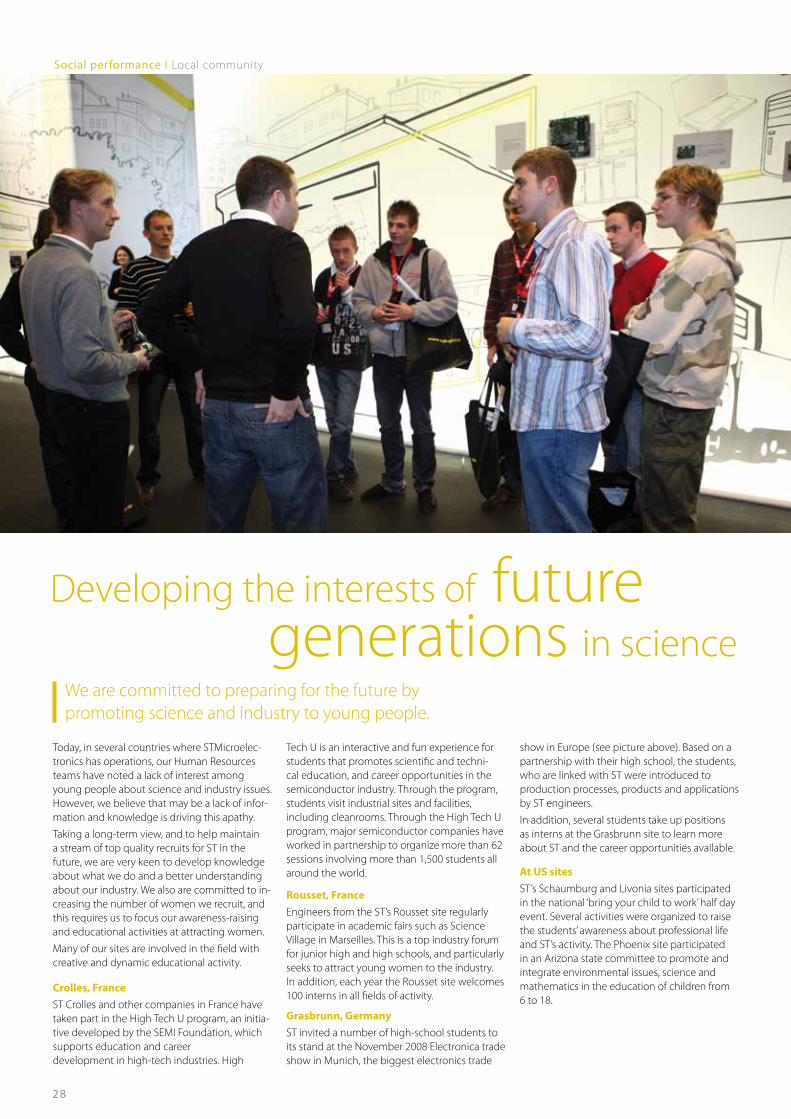
28
Social performance I Local community
Developing the interests of future generations in science
Today, in several countries where STMicroelec-tronics has operations, our Human Resources teams have noted a lack of interest among young people about science and industry issues. However, we believe that may be a lack of infor-mation and knowledge is driving this apathy.
Taking a long-term view, and to help maintain a stream of top quality recruits for ST in the future, we are very keen to develop knowledge about what we do and a better understanding about our industry. We also are committed to in-creasing the number of women we recruit, and this requires us to focus our awareness-raising and educational activities at attracting women.
Many of our sites are involved in the field with creative and dynamic educational activity.
Crolles,FranceST Crolles and other companies in France have taken part in the High Tech U program, an initia-tive developed by the SEMI Foundation, which supports education and career development in high-tech industries. High
Tech U is an interactive and fun experience for students that promotes scientific and techni-cal education, and career opportunities in the semiconductor industry. Through the program, students visit industrial sites and facilities, including cleanrooms. Through the High Tech U program, major semiconductor companies have worked in partnership to organize more than 62 sessions involving more than 1,500 students all around the world.
Rousset,FranceEngineers from the ST’s Rousset site regularly participate in academic fairs such as Science Village in Marseilles. This is a top industry forum for junior high and high schools, and particularly seeks to attract young women to the industry. In addition, each year the Rousset site welcomes 100 interns in all fields of activity.
Grasbrunn, Germany ST invited a number of high-school students to its stand at the November 2008 Electronica trade show in Munich, the biggest electronics trade
show in Europe (see picture above). Based on a partnership with their high school, the students, who are linked with ST were introduced to production processes, products and applications by ST engineers.
In addition, several students take up positions as interns at the Grasbrunn site to learn more about ST and the career opportunities available.
At US sitesST’s Schaumburg and Livonia sites participated in the national ‘bring your child to work’ half day event. Several activities were organized to raise the students’ awareness about professional life and ST’s activity. The Phoenix site participated in an Arizona state committee to promote and integrate environmental issues, science and mathematics in the education of children from 6 to 18.
We are committed to preparing for the future by promoting science and industry to young people.

29
ST Foundation
Activities and governance The ST Foundation’s governing body is its board of directors. The board takes major strategic de-cisions concerning global financial management and approval of projects. It meets three times a year – with additional sessions if required – at ST’s headquarters in Geneva, Switzerland, and reviews past activity and plans future expansion of existing initiatives.
The board is chaired by Carlo Emanuele Otta-viani, ST’s Corporate Vice President, Commu-nication, and is composed of both ST and non ST members. The board consists of Mario Arlati, André Borrel, Marc Odendall (who is also the board’s treasurer), Anny Noels and Guy-Philippe Rubeli. Pasquale Pistorio is Honorary Chairman and Michela Bottazzi is secretary of the Foun-dation.
A Geneva-based team takes care of project ma-nagement and day-to-day administration, with local support in India and Morocco to ensure a close overseeing of the many initiatives taking place in those two countries. Significant support is provided by ST volunteers participating in Digital Unify (DU) program activities.
WhatisthefutureforDigitalUnify?The Digital Unify program aims to reduce the digital divide, i.e. the gap between those who have access to modern digital technologies and those who do not.
At the beginning of 2000, before the explosion of the technology ‘bubble’ and the economic turbulence of more recent years, ST Foundation’s former President, now Honorary Chairman, Pasquale Pistorio launched an ambitious and revolutionary idea. He recommended that each medium- to large-sized company would donate up to 0.1% of their annual revenue, and up to 0.1% of their employees’ hours worked to provide technology and education required to use a computer and access the internet to those who lack this opportunity in the communities in which those companies operate.
For ST, Pistorio set a precise goal for this initiative: one million people should receive ICT training in ten years. The ST Foundation was established soon after with this long-term goal firmly in mind.ST has been working in this direction and is committed to continually supporting the ST Foundation and the Digital Unify program. Such an ambitious goal, however, was dependant on the hope that the world’s economy and the mi-croelectronics market, would continue to grow sustainably and so support such high financial and working time commitments.Unfortunately, overall economic conditions have not been as good as was hoped and ST has not been able to donate more than US$1m each year to the Foundation in addition to the initial donation. Given the current difficult market situation, the donation for 2008 has been redu-ced from previous years. The ST Foundation’s budget for the upcoming year will therefore be of US$500,000, to be complemented by any financial return from deposited capital.The ST Foundation has been working exten-sively in 2008 to ensure an ever more serious, reliable and transparent development of DU. This has been done through the introduction of reporting tools, accounting feedback forms and standardization of the DU’s main features. The program has reached over 55,000 trainees and results for 2008 have been encouraging, with over 15,000 new trainees. Because of newly approved initiatives becoming operational next year, a significant increase in the number of trainees (+50%) is expected in 2009. Should the Foundation’s budget allow for a similar growth to continue, by 2013, the tenth anniversary of DU’s launch, the total number of people having received ICT training through the program will be 350,000. Given the extent to which current conditions are different from what was originally envisaged, this represents an excellent result compared to the original target of one million trainees.
5 Find the complete article on the html version of the report
Digital Unify in Bolivia: developing a new initiativeThis example is very representative of how the voluntary network gets organized and makes real progress happen!
The idea to develop a DU project in Bolivia (see picture above) came from an American ST employee, and the initiative had been draf-ted and approved by ST Foundation’s board of directors in November 2007. During 2008 three labs in Bolivia – Cabezes, Abapo and Mora – were equipped, in partnership with the Catholic Diocese of Forth Worth in Texas. Ten ST volunteers in the US were also involved in the project.
The new team has been trained by Subodh, a former ST employee originally from India, who is currently studying in the US. Subodh has been involved in DU since its inception, and his generosity and experience have been instrumental to the success of the program just as much as the motivation of the team from the US, and their efforts in translating the Informatics and Computer Basics course into Spanish has also been very important. Nancy and Renan, are two new Spanish speaking volunteers who will be traveling to Bolivia to perform training in January 2009. As the course for future Bolivian DU trainers will also be completed at this time, the program will begin to really take off.
The STMicroelectronics Foundation was set up as an independent non profit organization in 2001, reflecting the increasing commitment of the company to social responsibility.
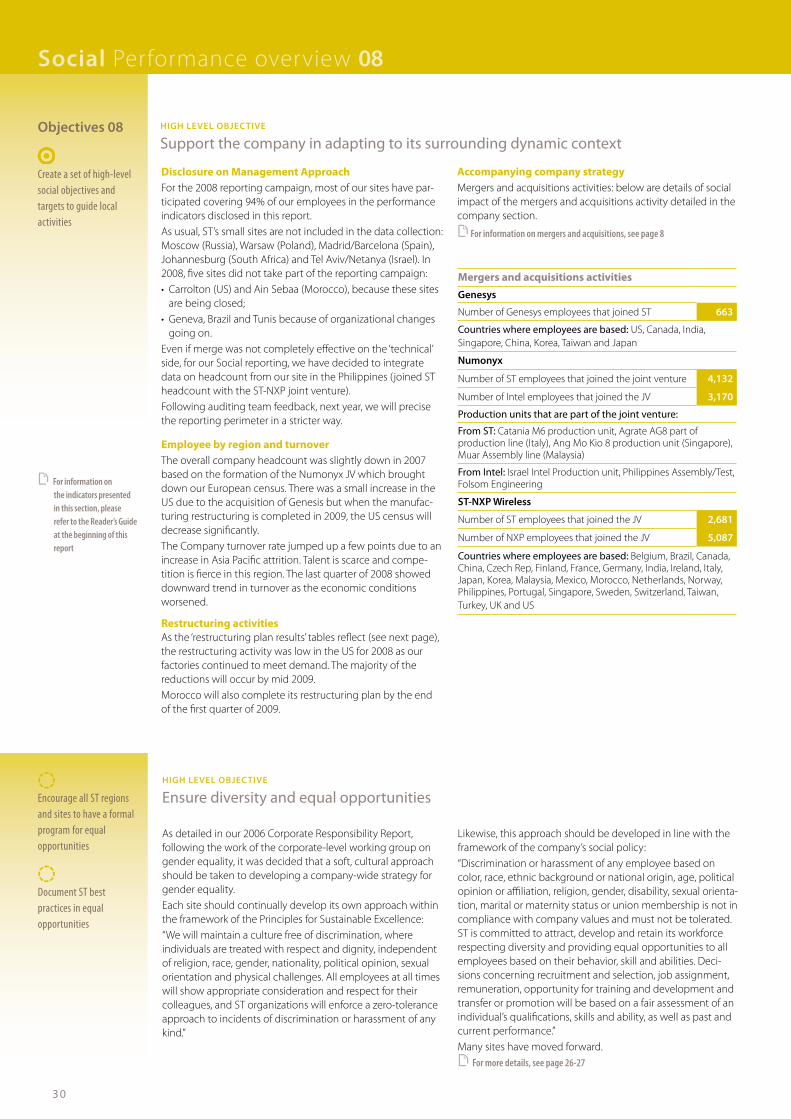
Social Performance overview 08
30
DisclosureonManagementApproachFor the 2008 reporting campaign, most of our sites have par-ticipated covering 94% of our employees in the performance indicators disclosed in this report.As usual, ST’s small sites are not included in the data collection: Moscow (Russia), Warsaw (Poland), Madrid/Barcelona (Spain), Johannesburg (South Africa) and Tel Aviv/Netanya (Israel). In 2008, five sites did not take part of the reporting campaign:• Carrolton(US)andAinSebaa(Morocco),becausethesesites are being closed;• Geneva,BrazilandTunisbecauseoforganizationalchanges going on.Even if merge was not completely effective on the ‘technical’ side, for our Social reporting, we have decided to integrate data on headcount from our site in the Philippines (joined ST headcount with the ST-NXP joint venture).Following auditing team feedback, next year, we will precise the reporting perimeter in a stricter way.
Employee by region and turnoverThe overall company headcount was slightly down in 2007 based on the formation of the Numonyx JV which brought down our European census. There was a small increase in the US due to the acquisition of Genesis but when the manufac-turing restructuring is completed in 2009, the US census will decrease significantly.The Company turnover rate jumped up a few points due to an increase in Asia Pacific attrition. Talent is scarce and compe-tition is fierce in this region. The last quarter of 2008 showed downward trend in turnover as the economic conditions worsened.
RestructuringactivitiesAs the ‘restructuring plan results’ tables reflect (see next page), the restructuring activity was low in the US for 2008 as our factories continued to meet demand. The majority of the reductions will occur by mid 2009.Morocco will also complete its restructuring plan by the end of the first quarter of 2009.
Accompanying company strategyMergers and acquisitions activities: below are details of social impact of the mergers and acquisitions activity detailed in the company section.
M For information on mergers and acquisitions, see page 8
Objectives 08
Create a set of high-level social objectives and targets to guide local activities
Encourage all ST regions and sites to have a formal program for equal opportunities
Document ST best practices in equal opportunities
HIGH LEvEL OBJECtIvE
Support the company in adapting to its surrounding dynamic context
Mergers and acquisitions activitiesGenesys
Number of Genesys employees that joined ST 663
Countries where employees are based: US, Canada, India, Singapore, China, Korea, Taiwan and Japan59
Numonyx
Number of ST employees that joined the joint venture 4,132
Number of Intel employees that joined the JV 3,170
Production units that are part of the joint venture: 77
From ST: Catania M6 production unit, Agrate AG8 part of production line (Italy), Ang Mo Kio 8 production unit (Singapore), Muar Assembly line (Malaysia)
From Intel: Israel Intel Production unit, Philippines Assembly/Test, Folsom Engineering
St-NXP Wireless
Number of ST employees that joined the JV 2,681
Number of NXP employees that joined the JV 5,087
Countries where employees are based: Belgium, Brazil, Canada, China, Czech Rep, Finland, France, Germany, India, Ireland, Italy, Japan, Korea, Malaysia, Mexico, Morocco, Netherlands, Norway, Philippines, Portugal, Singapore, Sweden, Switzerland, Taiwan, Turkey, UK and US
HIGH LEvEL OBJECtIvE
Ensurediversityandequalopportunities
As detailed in our 2006 Corporate Responsibility Report, following the work of the corporate-level working group on gender equality, it was decided that a soft, cultural approach should be taken to developing a company-wide strategy for gender equality.Each site should continually develop its own approach within the framework of the Principles for Sustainable Excellence: “We will maintain a culture free of discrimination, where individuals are treated with respect and dignity, independent of religion, race, gender, nationality, political opinion, sexual orientation and physical challenges. All employees at all times will show appropriate consideration and respect for their colleagues, and ST organizations will enforce a zero-tolerance approach to incidents of discrimination or harassment of any kind.”
Likewise, this approach should be developed in line with the framework of the company’s social policy: “Discrimination or harassment of any employee based on color, race, ethnic background or national origin, age, political opinion or affiliation, religion, gender, disability, sexual orienta-tion, marital or maternity status or union membership is not in compliance with company values and must not be tolerated. ST is committed to attract, develop and retain its workforce respecting diversity and providing equal opportunities to all employees based on their behavior, skill and abilities. Deci-sions concerning recruitment and selection, job assignment, remuneration, opportunity for training and development and transfer or promotion will be based on a fair assessment of an individual’s qualifications, skills and ability, as well as past and current performance.”Many sites have moved forward.M For more details, see page 26-27
M For information on the indicators presented in this section, please refer to the Reader’s Guide at the beginning of this report

31
Headcount evolution by region l LA1 l X ST12 l
2004 2005 2006 2007 2008
Europe 22,593 22,405 22,527 22,341 21,271
Americas 3,180 3,120 3,277 3,122 3,210
Mediterranean 7,224 6,906 7,336 6,995 5,848
Asia-Pacific 16,532 17,602 18,596 19,685 21,409
total 49,529 50,033 51,736 52,143 51,738
Hires by job type l LA1 l X ST12 l
2004 2005 2006 2007 2008
Engineers and managers 2,593 1,605 2,312 1,775 5,224*
Technicians and administrators 1,167 749 1,154 774 1,163
Operators 4,446 3,189 4,088 3,663 5,502
total 8,206 5,543 7,554 6,212 11,889
Average career length and turnover rate l LA2 l STS6 l X ST12 l
2004 2005 2006 2007 2008
LA2 Average turnover rate (%) 6.6 7.8 8.79 8.81 10.12
StS6Average career length (years)* 12 15 13 12 11
(*) This major increase in hires of engineers and managers in 2008, is mainly linked to the integration of employees from NXP.
(*) Career length is the average length of employment of people leaving ST. Thus the calculation of the career length is based on the average turnover of the 3-5 years.
Restructuringplanresults–USregion(see more on page 24)
total number of people involved 2,049
Departure with severance* package 143(*) Severance is defined by ST’s US policy. An employee gets one week of pay for every year with ST. After ten years in the company, this increases to 1.5 weeks of pay for every year.
Restructuringplanresults–Morocco(see more on page 25)
total number of people involved 2,154
Transfer to another site (Bouskoura 2) 1,454
Departures due to natural turnover or voluntary resignation 700
Gender split for professionals l LA13 l X STS10 l %
2004 2005 2006 2007 2008
Men-professional 81 80 80 79 78
Women-professional 19 20 20 21 22
Gender breakdown l LA13 l STS9 l %
2004 2005 2006 2007 2008
Men 60 60 61 61 61
Women 40 40 39 39 39
Disabledemployeesl LA13 l STS12b l %2005 2006 2007 2008
Percentage of disabled employees 0.48 0.62 0.61 0.89
Womeninmanagementl LA13 l %
2004 2005 2006 2007 2008StS11 In senior manage-
ment (Job grade 17 and above)
6.30 6.60 7.04 7.89 8.02
StS12 In executive mana-gement(Job grade 19 and above)
3.80 4.10 5.65 5.92 6.78
StS12a In staff management reporting directly to site/senior organiza-tion manager
NA 9 11.75 11.9 11
Nationalitiesincorporatestaffl LA13 l STS8 l
2006 2007 2008
Different nationalities represented in the corporate staff 7 8 9
200820072006200520042003200220012000199919981997199619950
10
20
30
40
50
Total headcount evolution l LA1 l ST12 l
In thousands
Restructuringplanresults–France(GAMAE)(see more on page 25)
Validated projects by type Crolles Crolles 2 Grenoble Paris Rousset SAS
St-Genis Pouilly
STNXP Grenoble
STNXP Paris Tours Grand
total
Company creation/trade in 26 13 12 56 2 11 1 32 153
Mobility leave 18 14 14 2 37 1 5 8 99
External reconversion training 12 14 9 1 21 2 1 17 77
Internal reconversion training 4 3 3 1 8 1 4 2 3 29
total number of people involved 60 44 38 4 122 4 22 4 60 358

Social Performance overview 08
32
Unvested stock awards l STS47 l
2005 2006 2007 2008
Number of employees rewarded 7,189 6,000 6,300 5,700
Percentage of eligible population (%) 41 34 35 33
Objective 08
Support local creation of operational action plans based on the Employee Engagement Survey results
HIGH LEvEL OBJECtIvE
Ensure employee empowerment and engagement
Recognitionl X STS26 l STS28 l X STS34 l2004 2005 2006 2007 2008
XStS26 People recognized 49,553* 41,676* 77,390* 50,171* 38,805*
StS28 Overall company recognition budget (USk$)
1,000 1,613 1,031 2,684 2,161
XStS34 Accepted sugges-tions which were implemented (%)
54 57 39 62 61
(*) Can include multiple recognition for one employee over the year
Unplanned absenteeism l STS28b l %2005 2006 2007 2008
Percentage of unplanned absenteeism* 3 3.05 2.9 3
(*) As opposed to vacations and holidays which are typically planned months in advance, unplanned absenteeism is the result of absence due to last minute emergencies or illness and therefore cannot be planned and managed.
Unvested stock awardsIn April 2008, ST’s Supervisory Board authorized the repurcha-se of up to 30m shares of common stock. These shares were to be purchased at times and prices considered appropriate by the company in open market or private-negotiated transac-tions. Repurchased shares will be held as Treasury Stock and will be used for future Employee Unvested Stock Plan program requirements. The repurchase will be funded from currently outstanding cash and cash equivalents.
RecognitionAs stated in last year’s report, our corporate recognition pro-gram, called STAR (ST Annual Recognition) now recognizes the value created and the positive impact on our stakeholders.Applicants may propose individual or collective achievements first selected by the sites and organizations, fill in a very de-tailed form showing their alignment with the overall company objectives but also explaining how they have managed to satisfy and respond to stakeholders’ expectations.Several criteria are taken into consideration:• teamefficiency; • impactonstakeholders;and• teambehavior.
For the year 2008:• 22teamsreceivedabronze,silver,goldorthehighestreco- gnition, the CEO award, out of 73 team applicants;• 29employeesreceivedABCD(AboveandBeyondtheCall of Duty) award.Despite the current crisis, our CEO, Carlo Bozotti decided to maintain the corporate recognition ceremony in Geneva. 68 participants were invited to our headquarters in Geneva, on March 25, 2009 to receive their award directly from our CEO in the presence of ST’s top management.Even in a period of strict budget and travel constraints, such event shows ST’s top management engagement and commit-ment to employee’s recognition.
Employee engagement surveyOur first bi-annual employee engagement survey was conducted in 2008 with excellent participation at 80% of the population taking part. The result indicated valuable areas for improvement by department and action plans are being put in place to improve results. Corporate initiatives will be developed in the areas of improving communication of organizations goals and objectives, employee development and identification of potential (see People Review), and better dissemination of work plans and schedules.Find below some more information on the global concept
By engagement, we mean the extent to which employees commit to something or someone in their organisation and how hard they work and how long they stay as a result of that commitment. Engagement is assessed on the basis of four dimensions: • Emotionalcommitment:extenttowhichemployeesderive pride, enjoyment, inspiration or meaning for something or someone within the organisation.• Rationalcommitment:extenttowhichemployeesfeelthat someone or something within their organizations provide financial, developmental or professional rewards. • Discretionaryeffort:employees’willingnesstoexpendeffort beyond work expectations, such as helping others with heavy workloads or looking for ways to perform their jobs more effectively.• Intenttostay.The results are absolute values and are obtained by regression statistical analysis.
M See more on page 27
EmployeeSurvey-EngagementRatel X STS28a l
2008
Overall participation rate 80
Rational Commitment Index 0.16
Emotional Commitment Index 0.35
Discretionary Effort Index 0.43
Intent to Stay Index 0.34

33
Objectives 08
Foster internal mobility: corporate target is to fill 70% of jobs requiring experience internally
Support local sites in enhancing management systems for labor
Identify key talents through people reviews
HIGH LEvEL OBJECtIvE
Ensuredynamiccareerprogression,life-longlearningandemployabilitytomeet employee and company needs
Internal mobility - jobs filled internally l STS14 l %2004 2005 2006 2007 2008
Jobs requiring experience filled internally 61 85 61 78 84
Average training hours l LA10 l
2004 2005 2006 2007 2008
X StS15 Professionals* 38 37 30 35 27
StS16 Operators 67 80 91** 61 72
StS17 Others (non professionals) 36 30 30 29 29
total*** 49 53 43 44 43
(*) It refers to employees who hold managerial roles and are exempt from overtime compensation (**) This higher figure is linked to the regular certification/re-certification of operators at least every 18 months.(***) Including training on equipment and outside training. (*) It refers to employees who hold positions normally requiring graduate or post-graduate
education and who are not eligible for overtime compensation.(**) In previous reports we published the «percentage of exempt employees having changed jobgrade in the last 12 months. For a better understanding, we decided to rename the indicator without changing the content.
Employee access to training l X STS18 l %2006 2007 2008
Employees having received > 35 hours training/year* 37 48 36
(*) This indicator is particularly important as it shows how training is distributed among employees.
Promotion rate and people reviews l LA12 l STS21 l %2005 2006 2007 2008
StS21a Percentage of exempt* employees having having been promoted** in last 12 months
21 34 18.3 20.2
StS21b Percentage of exempts assessed during collective people review (in the last 2 years)
43 59 62 53
Internal mobilityWith a close scrutiny on external hiring in 2008, more jobs were posted for internal hiring and more positions were filled internally.
Training hoursThe average hours of training per employee was below our goal as the travel to attend training was reduced and the number of external hires was also down significantly.If we look in detail at the results, we can see that this is particularly the case for the exempt population while training has been kept up to a very high level for operators with an average of 72 training hours per person. This is mainly due to training on new equipment, new procedures, required polyvalency to replace people in the team during absence or departure and evolution to an upper level in process, automa-tion or maintenance path.(Note: we found out a discrepancy in the information published for training hours in the past two years. We then decided to update all three years with the right data.)
Promotion and people reviewWhile the number of those reviewed collectively was lower in 2008, the company adopted a uniform process for a bi-annual People Review of exempt employees in every region. The worldwide campaign was initiated in the fourth quarter of 2008 and should be completed in 2010. The process should result in identification of high potential employees and suc-cessors for future opportunities.
ST University and corporate trainingIn 2008, STU was accredited with the Corporate Learning Improvement Process (CLIP) certification.
WhatisCLIP?CLIP is a quality improvement framework for corporate lear-ning organizations that was drawn on the European Founda-tion for Management Development’s EQUIS quality assess-ment methodology. EQUIS (European Quality Improvement System) is a quality assessment and improvement program for business schools, and business and economics departments of universities.At its core CLIP is a mechanism for quality benchmarking, mutual learning and sharing of good practice. Internal self-assessment against a comprehensive set of rigorous criteria is combined with external review by experienced peers.The peer review is conducted by two Chief Learning Officers (CLOs) from companies having achieved the CLIP certificate, supplemented by a representative from a senior business school and the EFMD. Information about good practice and other issues is captured from a self assessment process, and the peer review team’s reports constitute the basis for best practices workshops, quality benchmarking and mutual lear-ning between certified CLIP companies. CLIP provides value externally and internally for the companies that are going through the process. It is a quality certification and therefore has an external marketing value. For example, some companies highlight the award in their public sustai-nability reporting. Equally significant, though, it has internal value because it helps to reposition learning within the or-ganization in a strategic way, giving it visibility and credibility within the company itself.

Social Performance overview 08
34
Objectives 08
Document ST best practices in the implementation of human rights
Create a quarterly dashboard of key indicators for human rights
HIGH LEvEL OBJECtIvE
Proceed to deeper integration of human rights issues in and beyond ST
0 10 20 30 40 50
1.72
3.55
5.02
4.1
0.37
1.23
4.1
1.9
40
42.58
43.98
44
38.5
40
40
40
Morocco
Malta
Italy
France
Singapore
Malaysia
China
North America
WorkingtimeinselectedcountrieslSTHR4lSTHR6l
ST standard working time Overtime
Workingtimelosttostrikes l STS38 l %
2004 2005 2006 2007 2008
Ratio time lost to strikes / time worked 0.04 0.15 0.04 0.04 0.02
Workingtimeandovertimehoursl STS36 lSTHR7l2004 2005 2006 2007 2008
StS36 Employees with regular work time less than 48 hours per week (%)
100 100 100 100 100
StHR7 Average overtime per week (hours per employees)
1.79 1.24 4.17 3.12 2.22
Communication meetings l X STS34a l %
2005 2006 2007 2008
Average number of meetings per year in each organization or site during which management presents company/ organization/site results to all employees allowing time for open questions
10 9 10 10
Workingtime&overtimeThe increase of the standard working time in Malaysia is due to an organization change in production shifts. The global organization changed from four crews with four shifts to three crews with three shifts.
Collective bargaining l LA4 l STHR5 lThe following is sourced from an article published in The StraitsTimes,Singapore,January2009.“At least 2,000 manufacturing, electronics workers expected to be laid off in Q1.The United Workers of Electronic and Electrical Industries, or UWEEI, is expecting another 2,000 to be laid off in the first quarter of this year alone. The union said that in comparison, about 2,300 workers in the unionised electronics sector lost their jobs over the whole of last year. This time around, some companies are taking extra steps to help their affected workers. 57-year-old Madam Gayah Sarimon is one of 215 workers STMicroelectronics retrenched less than a month ago. She and other colleagues are now undergoing training cour-ses at the Employable and Employability Institute (e2i) to help them gain new skills and possibly land a new job. It is part of STMicroelectronics’ effort with UWEEI to help affected workers even after retrenchment and to expose them to other job opportunities. Madam Gayah said: “I am confident I can gain new skills. Nowadays in Singapore, there are so many (job) vacancies like (in) healthcare, customer service, and hotels. So, why shouldn’t Itry?”Halimah Yacob, executive secretary of UWEEI and NTUC deputy secretary general, said: “We have been working very closely with companies… ST (STMicroelectronics) is a good
and positive example, because they gave us ample notice (before workers were retrenched).” “We worked in advance with them, we prepared the workers. We have a plan as to what to do with them to help them find jobs.” Apart from the training courses, affected workers also received retrenchment pay-outs of one month’s salary for each year of service and can continue to enjoy medical benefits for one year. STMicroelectronics will also pay their union membership fees for a year. As the economic crisis deepens, Madam Halimah hopes more companies will adopt the responsible attitude of working clo-sely with their unions and e2i to explore ways to help affected workers, even after retrenching them.”
FreedomofassociationFreedom of association is part of the Principles for Sustainable Excellence, STMicroelectronics’ Code of Conduct:“Our employees have the right to join or form collective bo-dies, within the framework of local legislation. These rights are balanced by the duties of employees to the company and by the individual responsibilities of employees to each other.”In January 2007 we launched a social policy called Sustainable Excellence in Human Resources Management which expres-ses very specifically the fact that:“Employees at ST are free to choose whether or not to lawfully organize and join associations including trade unions. ST does not restrict or interfere with employees’ efforts to join a lawful association of their choice, and this includes any behavior that involves threatening, interrogating, spying on, penalizing or discriminating against employees.”In 2008, 75% of ST’s employees are covered by union or other representation.
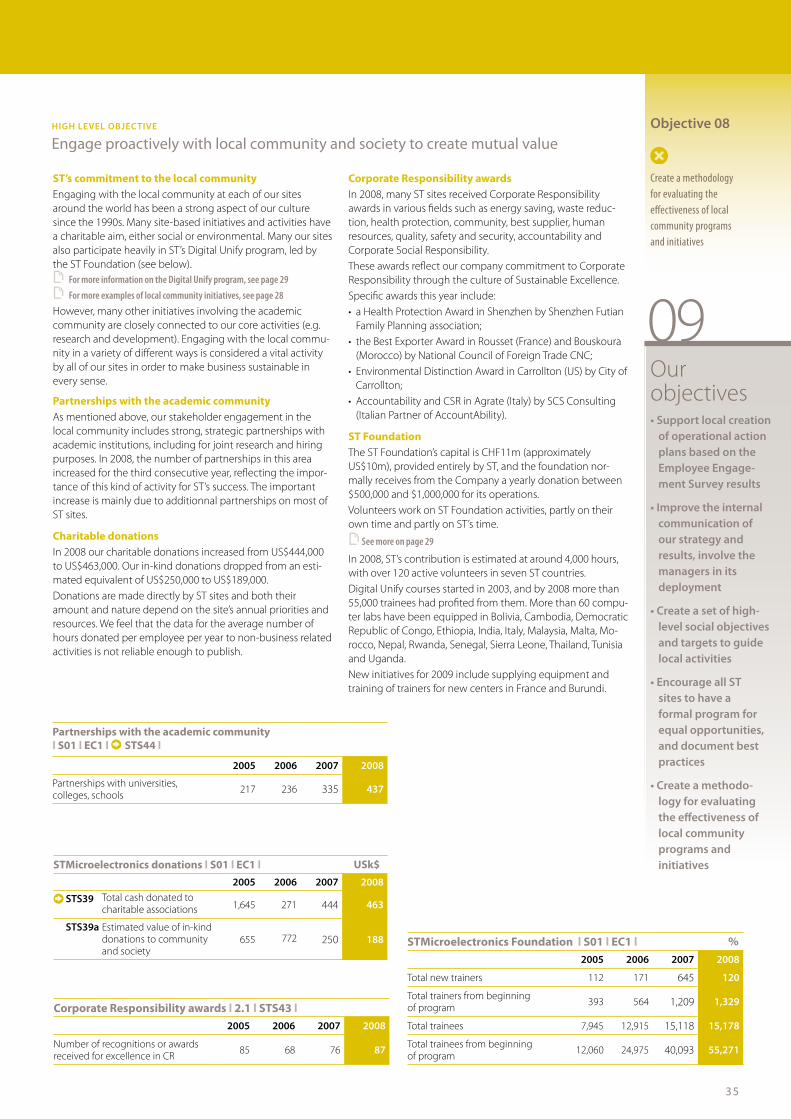
35
Objective 08
Create a methodology for evaluating the effectiveness of local community programs and initiatives
HIGH LEvEL OBJECtIvE
Engage proactively with local community and society to create mutual value
STMicroelectronicsFoundationl S01 l EC1 l %2005 2006 2007 2008
Total new trainers 112 171 645 120
Total trainers from beginning of program 393 564 1,209 1,329
Total trainees 7,945 12,915 15,118 15,178
Total trainees from beginning of program 12,060 24,975 40,093 55,271
Partnerships with the academic community l S01 l EC1 l X STS44 l
2005 2006 2007 2008
Partnerships with universities, colleges, schools 217 236 335 437
CorporateResponsibilityawardsl 2.1 l STS43 l2005 2006 2007 2008
Number of recognitions or awards received for excellence in CR 85 68 76 87
STMicroelectronics donations l S01 l EC1 l USk$2005 2006 2007 2008
X StS39 Total cash donated to charitable associations 1,645 271 444 463
StS39a Estimated value of in-kind donations to community and society
655 772 250 188
ST’s commitment to the local communityEngaging with the local community at each of our sites around the world has been a strong aspect of our culture since the 1990s. Many site-based initiatives and activities have a charitable aim, either social or environmental. Many our sites also participate heavily in ST’s Digital Unify program, led by the ST Foundation (see below).M For more information on the Digital Unify program, see page 29M For more examples of local community initiatives, see page 28However, many other initiatives involving the academic community are closely connected to our core activities (e.g. research and development). Engaging with the local commu-nity in a variety of different ways is considered a vital activity by all of our sites in order to make business sustainable in every sense.
Partnerships with the academic communityAs mentioned above, our stakeholder engagement in the local community includes strong, strategic partnerships with academic institutions, including for joint research and hiring purposes. In 2008, the number of partnerships in this area increased for the third consecutive year, reflecting the impor-tance of this kind of activity for ST’s success. The important increase is mainly due to additionnal partnerships on most of ST sites.
Charitable donationsIn 2008 our charitable donations increased from US$444,000 to US$463,000. Our in-kind donations dropped from an esti-mated equivalent of US$250,000 to US$189,000.Donations are made directly by ST sites and both their amount and nature depend on the site’s annual priorities and resources. We feel that the data for the average number of hours donated per employee per year to non-business related activities is not reliable enough to publish.
CorporateResponsibilityawardsIn 2008, many ST sites received Corporate Responsibility awards in various fields such as energy saving, waste reduc-tion, health protection, community, best supplier, human resources, quality, safety and security, accountability and Corporate Social Responsibility.These awards reflect our company commitment to Corporate Responsibility through the culture of Sustainable Excellence.Specific awards this year include:• aHealthProtectionAwardinShenzhenbyShenzhenFutian Family Planning association;• theBestExporterAwardinRousset(France)andBouskoura (Morocco) by National Council of Foreign Trade CNC;• EnvironmentalDistinctionAwardinCarrollton(US)byCityof Carrollton;• AccountabilityandCSRinAgrate(Italy)bySCSConsulting (Italian Partner of AccountAbility).
STFoundationThe ST Foundation’s capital is CHF11m (approximately US$10m), provided entirely by ST, and the foundation nor-mally receives from the Company a yearly donation between $500,000 and $1,000,000 for its operations.Volunteers work on ST Foundation activities, partly on their own time and partly on ST’s time.
M See more on page 29
In 2008, ST’s contribution is estimated at around 4,000 hours, with over 120 active volunteers in seven ST countries. Digital Unify courses started in 2003, and by 2008 more than 55,000 trainees had profited from them. More than 60 compu-ter labs have been equipped in Bolivia, Cambodia, Democratic Republic of Congo, Ethiopia, India, Italy, Malaysia, Malta, Mo-rocco, Nepal, Rwanda, Senegal, Sierra Leone, Thailand, Tunisia and Uganda.New initiatives for 2009 include supplying equipment and training of trainers for new centers in France and Burundi.
09• Support local creation
of operational action plans based on the Employee Engage- ment Survey results
• Improve the internal communication of our strategy and results, involve the managers in its deployment
• Create a set of high- level social objectives and targets to guide local activities
• Encourage all ST sites to have a formal program for equal opportunities, and document best practices
• Create a methodo- logy for evaluating the effectiveness of local community programs and initiatives
Our objectives

36
AcorporateguidelinerequiresallST
sitestoenforceanon-smokingpolicy,
which must include the clear designa-
tion of smoking areas. Smoking is pro-
hibitedinallproductionareas,utilities
andsupportareas,offices,warehouses
and stores.
Smoking is not only dangerous at our
sitesbecauseofthefirerisk,butitalso
kills 5.4m people in the world per year
and causes other serious illnesses.
This comes at a cost not only for the
community as a whole but also for the
company.
Thus in 2008 several ST sites decided to
launch stop-smoking campaigns.
• Bouskoura(Morocco):threeaware
ness campaigns have been launched.
• Bristol(United-Kingdom):aposter
campaign was launched to explain
the different ways to stop smoking
and where smokers can get advice to
helpthemquit.
• Phoenix(USA):50employeesatten-
ded stop-smoking classes during na-
tionalGreatAmericanSmokeoutday,
the third Thursday in November.
• Rousset(France):40employeeswere
introducedtotheAllenCarrmethod
that centers on removing the
psychological need to smoke.
• Tours(France):anicotineaddiction
specialist came to the site and ad-
visedsmokersonhowtoquit,ashas
occurredforthepastfiveyears.
Towards a non-smoking company ST health plan program
Over110,000exams in two years
US$1m spent on health in 2008
36 local health
awareness campaigns
listed in 2008
Health & Safety

Local actions I Health & Safety
37
A new approach to improve safety at work: Behavioral Risk Improvement
In 2005, STMicroelectronic’s site at Tours, France, implemented an innovative program, known as Behavioral Risk Improvement (BRI) to help reduce its recordable cases rate. Impressive results have been achieved with a 44% decrease between 2005 and 2008. In 2006 and again in 2008, ST’s site at Rousset, France, has used the same method.
The basis of the BRI program is the observation of employees by their peers within groups. The-se groups are organized so that each includes an observer. Importantly, the observers and the observed must be colleagues at the same grade and not, for example, on differing management levels. The safety team provides each observer with a grid – developed taking into account past accident records and trends – that lists both safe and unsafe behavior.
Twice a week, each observer has to notify his group that he will observe them during a 45 minute period. Regularly the grids are compiled anonymously by a senior manager defined as the project coordinator, who then gives the results to the safety department. Coordinator
and observers analyze together the collected data and may decide to create a working group to solve any problems observed.
The success of this program relies on coordi-nation between several teams: staff involved in safety, quality, manufacturing, training and communication roles. Management support is essential to this method. They need to accept that some of their employees will devote part of their working time to observations.
Communication and training – behavior com-prehension, observation and feedback techni-ques, and instructions for using the grid – are extremely important. People need to unders-tand that it is not a question of evaluation but just of common sense.
As the program develops, the grids will change according to the progress made. Ideally this program’s principles should become the norm and part of the company’s safety culture. Every employee should be comfortable to point out to their colleagues when he or she observes unsafe behavior.
Corporate Safety Manager is always looking for new methods to improve ST’s safety records. When solutions implemented across the company do not lead to satisfactory decreases at specific sites, even if these sites already have low severity and recordable cases rates, his role is to analyze activity at these sites more closely and propose tailored solutions.
This chart shows ST’s Recordable Cases rate compared to US manufacturing and US semi-conductor industry.
In 2008, ST Recordable Cases rate kept on decreasing (-20%) meaning that ST still has results greatly better than the sector averages.The source of data is the US Bureau of Labor Statistics (BLS) and the Semiconductor Industry Association (SIA).
0
1
2
3
4
5
6
0.39
5.6
1.5
0.84
2007 US Manufacturing (Source BLS)2007 All US semiconductor (Source BLS)2006 SIA OHS2008 ST
Recordable Cases Rate Benchmarks*
(*) Latest data available.
Interview with François Bonnot Safety Manager, Rousset, France
Why do you believe this method is so successful? The success of this method is due in part to the fact that 10% of the workforce observes their peers twice a week which means that on average there is always someone in observation. Another point is that once employees have agreed on the method’s principles, it brings everyone closer together and creates better teamwork.
Apart from employees, are there other stakeholders positively impacted by this program?Customers are benefiting. Once this method’s values become the norm, meaning that people are used to respec-ting the health and safety rules, employees will naturally apply these principles in other areas, which implies a very positive impact, especially for quality.
Apart from safety, what are the other positive impacts for the company?There’s a positive impact in terms of corporate image, for example in terms of how we are viewed by representatives of local authorities, such as factory inspectors. An indica-tion of positive reaction to the BRI program is through the fact that other companies have asked ST for presentations about the BRI program.
The costs related to workplace injuries are decreasing as the BRI program continuously reduces the number of acci-dents. And, as already mentioned, this process is changing the mindset of our employees, which means a very positive impact on personal behavior, thus improving quality.
Safe behavior
Extract of the BRI awareness campaign with the illustration of one unsafe and safe behavior
Unsafe behavior
!

Health & Safety Performance overview 08
38
Objectives 08
Reduce Recordable cases rate by 10%
Reduce Severity rate by 10%
Reduce the rate of injuries with days lost for our contractors by 10%
Deploy a new tool to record, share and investigate work-related injuries and illness
Ensure 35,000 employees benefit from available tests and services
Disclosure on management approach
We manage our Health and Safety performance using OHSAS 18001, which is widely seen as the most rigorous international standard for occupational Health and Safety issues. Twenty of our sites, including all 14 manufacturing sites, where 89% of our employees work, are certified OHSAS 18001 compliant.
5 You can find the full disclosure on management approach in the html version of this report
This safety performance data covers 93% of our employees. The remaining 7% work in functions and locations unrelated to manufacturing. In 2008 we extended the scope of our reporting thanks to a new online company reporting tool. This new device is used to track, record and investigate all injuries. It also allows internal benchmark.
2008 safety results
We are pleased to report that since we began keeping com-pany-wide records in 2004, there have been no work-related fatalities within ST. There was a strong improvement of our performance in 2008, with a 20% decrease in the recordable case (RC) rate for work-related injuries and illness, bettering our 10% target. The overall improvement since 2002 is close to 60%, or around 10% per year.
Our severity rate decreased by 18% in 2008, which also beats our 10% target. The overall improvement since 2002 is an impressive 65%.
The impact of these results can be seen in the decrease of the estimated cost (see graph) to the company by 23% in 2008
compared with 2007. In total, the improvements since 2002 have resulted in savings of US$23 million. In 2008, we continued actions and programs carried over from previous years, in particular in the areas of communication and training. Each year we also continue to improve our ha-zard identification, risk assessment and risk control manage-ment systems. This has resulted in a 18% decrease in the rate of industrial recordable cases involving chemicals, machines or electrical current, for example, and a 23% decrease in domestic cases, which relate to a fall or slip, or hitting a door or building, etc.).
M For more details on safety program, see page 39
Contractor’s safety indicator
In 2007 we started to track injuries incurred by our contractors and the resulting time lost at all our manufacturing sites and our three main non-manufacturing sites. There was a decrease in injuries during 2008 of 12%, exceeding our 10% target. This includes more than 5,700 contractors.
Chemical workstation risk I StEv67 I StEv68 I
Each workstation using chemicals has been assessed using an internal methodology called ST Chemical Risk Assessment. ST has a comprehensive approach to ensure the prevention of significant risk.
H&S topics covered in formal agreements with trade unions I LA9 I
5 For more details, see the html version of this report
In 2008, we maintained our company-wide Health Plan which was launched by our CEO, Carlo Bozotti, in 2005 and imple-mented at the end of 2006.
During 2008 the first 18-month round of medical examina-tions was completed with 47,000 tests undertaken, following the 63,500 carried out in 2007.
The Health Plan covers all ST sites with the main objective of offering a check-up every 18 months and a set of complemen-tary medical tests every three to five years, depending on age and the exam, to each ST employee.
In 2008 more than 17,000 employees took up this opportu-nity which means that at least 60% of the employees took an exam during the past 18 months.
In 2008, our Health Plan expenses increased from US$820,000 to US$1m. This increase meant we could finance additional medical staff and new equipment, such as electrocardiograms and audiometers.
Screening examinations were continued in 2008 with gyne-cological visits, audiometric tests and eye tests. During the year, nine specific illnesses were targeted by immunization campaigns.
To better measure the health program’s efficiency over the year, we recently launched five new health indicators:
• smoking; • bloodpressure–tohighlightincidenceofhypertension; • bodymassindex–toindicateproblemsrelatingtoweight and obesity; • regularsportpractice; • cholesterol.
Taking account of these indicators will also allow us to spon-sor local health campaigns that relate to our most worrying issues. Our campaigns to help employees stop smoking – as described on page 38 – are one of these.
AngMoKio,SingaporeThe Singapore Platinum HEALTH Award: the highest level of national recognition, following our 2006 Gold award win, for our longstanding dedication to encouraging a culture of healthy living among our employees.
Loyang,SingaporeCertificate of Healthier Canteen Award 2008-2009 by the National Health Promotion Board.
HIGH LEvEL OBJECtIvE
Ensure a safe and healthy workplace
HIGH LEvEL OBJECtIvE
Give all employees access to the same level of medical care
• ReduceRecordable cases rate to 0.37 and Severity rate to 5
• Reducetherateof injuries with days lost for our contractors by 10%
09Our objectives
We won two Health Awardsin 2008.

39
EHS fines
0,0
0,2
0,4
0,6
0,8
1,0
2008
0.39
2007
0.49
2006
0.59
2005
0.51
2004
0.74
2003
0.78
2002
0.93
20082007200620052004200320020
2
4
6
8
10
3.3
4.35.
0
4.3
3.84.
7
6.4
0
4
8
12
16
20
2008200720062005200420032002
5.56.
7
8.8
8.8
8.0
11.0
15.7
10% per year using 2002 as a baseline (Decalogue target)
10% per year using 2002 as a baseline (Decalogue target)
… Result without action
Recordablecasesrate- breakdown: industrial/domestic l LA7 l STHS11 l STHS12 l
0,0
0,1
0,2
0,3
0,4
0,5
DomesticIndustriel
2008200720062005
0.29
0.29
0.19
0.28
0.22
0.23
0.17
0.33
Among the EHS inspection we had this year by various EHS regulatory agencies, the following fine was recorded.
Recordablecasesrate l LA7 l X STHS1 l j 9.1 l
Injuries / illness cost l LA7 l STHS6 l US$m
Severity rate l LA7 l X STHS2 l j 9.3 l
Location type violation Fine Corrective action(s)
Status
EuropeItaly
Safety The Department of Pre-vention and Safety issued a notice of non-compliance for a missing safety risk assessment and other safety issues (including electrical issue, mission protection, and some inadequate emer-gency exit signs).
US$3k All issues were corrected and non-compliances cleared. A written answer was provided within the allotted time.
Closed
Health Plan - Medical examinations
2007 2008 total
Number of employees who took at least one exam NA 17,370 17,370
Medical Examination 62,500 35,536 98,036
• Checkupwithaphysician 23,700 13,863 37,563
• Bloodanalyses 17,000 8,994 25,994
• ChestXrays 8,500 3,788 12,288
• Colorectalcancerimmuoculttest 1,400 754 2,154
• ECG/EKG 6,300 5,019 11,319
•Mammography 1,700 1,160 2,860
• Papsmeartests 2,800 1,488 4,288
• ProstatecancerscreeningPSA 1,100 470 1,570
Screening test 0 8,337 8,337
Biomonitoring 0 70 70
Immunization 1,041 3,121 4,162
Grand total 63,541 47,064 110,605
Lostworkdaycaserate(LWDC)forSTsubcontractorsl LA7 l STHS13
2007 2008
Lost work day case rate 0.99 0.87
M For more information on the indicators presented in this section, please refer to the Reader’s Guide at the beginning of this report
For medical experts, prevention is the key to good health and this is particularly true in the workplace.I have never seen initiatives similar to ST’s corporate health plan anywhere else. It allows us to raise awareness on pre-vention and to instill the idea that prevention can save lives.Initially, we faced a number of problems as people were apprehensive and fearful of visiting clinics for medical exa-minations. Most of them had never performed any control.So, the main activity for medical staff when launching the program was to accompany, communicate, inform and explain to help people overcome their fear. We conducted several awareness campaigns and many workplace meetings.After several months, the health plan has been effectively deployed with many employees taking part on a voluntary basis.
Interview withanoccupationalhealthrepresentative, Bouskoura,Morocco
Interview withXiao Jun LUAN,HealthManager,Shenzhen,China
In Shenzhen, China, ST’s corporate health plan has been welcomed by all employees, who consider it as a sign that their management cares for them, especially as the medical tests and procedures proposed go further than Chinese legal requirements.After a large communication campaign through the site’s bulletin board, a health tests bus visited the site and the dormitories, for more comfort and convenience for the employees.

40
Ecopack®
Environment
Fortenyears,SThasdevelopedawide
program called Ecopack® to devise
and implement solutions leading to
environment friendly chip-packaging.
What we call packaging refers to the
black plastic containers that house
the microchip and provide four major
functions: interconnection of electri-
calsignals,mechanicalprotectionof
circuits,distributionofelectricalenergy
(thatis,power)forcircuitfunction,and
dissipation of heat generated by circuit
function.
We have both favored greener mate-
rials and removed polluting and hazar-
doussubstancesfromourdevices,like
progressively banning lead and other
heavy metals from our manufacturing
lines.
We are deploying this program
through:
•Ecopack1
= RoHS compliant* + lead-free
•Ecopack2
= Ecopack 1 + halogen -free
•Ecopack3
= RoHS compliant + lead-free
+ halogen-free + fluor-free
•Ecopack4
= Ecopack 3 + Phthalate-free
We are now proposing to our custo-
mers Ecopack 2 grades packaging and
by default all products delivered today
by ST are RoHS compliant.
(*) Including exemptions M For more information on our hazardous substances management, see page 41 and www.st.com/stonline/ leadfree/index.htm
Our results* from1994 to 2008
Energy: - 51.5%Water: - 72.7%Chemicals (2000-2008):
- 44.4%(*) Consumption per unit of production

41
Chemica ls management I Environmental per formance
Hazardous material management
The semiconductor industry uses many different chemicals; most of them in very low volumes, but some contain substances of very high concern (SVHC* ).For ten years, we have been deploying many programs to reduce risks related to the handling of chemicals, waste management and final products in use. The result is a comprehensive policy that involves many ST departments.
Chemical saving and recycling programsSince 1993, ST has been working on programs to reduce its hazardous substances consump-tion and improve the resulting waste treatment. The evolution of our Decalogue helped us to successfully challenge our performance in these areas. Thus we have been reducing our chemical consumption by more than 5% a year, on average, since 1998. Through corporate and local chemical saving plans, many initiatives have been implemented and shared across ST to outperform this goal, such as substitution of the most hazardous substances, chemical recycling, process optimi-zation or hardware modification to dilute che-micals and lower their flow rates. In 2008 a focus was given to tend to the elimination of PFOs compounds in Front-end and the conversion to halogen free materials in Back-end applications.
Chemical management and risk management Health and safety risks have been monitored very soon, starting with the creation of emer-gency response teams and specific EHS training programs. To limit employees’ exposure to hazardous substances and other risks, since the mid-1990s, ST has implemented a total chemical management program, in partnership with its
suppliers. As suppliers provide us directly on site with chemicals, most hazardous substances are used in closed systems without exposure to employees and the environment. In 2003, local and corporate teams worked together to define a strict methodology for che-mical risk assessment. Each chemical is assessed in use at every stage from storage to waste treatment. A risk prevention program is deve-loped for each situation in order to eliminate or reduce the risk as much as possible.
ST initiatives and compliance to international standards and regulations
Ecopack®
M For more information, see page 40 and www.st.com/ stonline/leadfree/index.htm
RoHS (Restriction of Hazardous Substances) complianceClosely linked to the Waste Electrical and Elec-tronic Equipment Directive (WEEE), this EU di-rective was adopted in 2003 to fix the maximum concentration level of six hazardous materials and took effect in 2006. ST was compliant in the due date thanks to our Ecopack® program, with legal exemptions for some products with no acknowledged technical alternative to lead.
5 www.st.com/stonline/leadfree/index.htm
REACH(Registration,Evaluation,andAuthorizationofChemicals)complianceThe REACH 2006 European legislation addres-ses the production, importation and use of chemical substances, to mitigate their potential impacts on both environment and human health. Major efforts have been done internally to comply with this regulation.
M For more details, see page 62
ST plays two main roles in REACH: downstream users and producers of articles (our finished goods). As producers of articles we have the duty to notify our customers of the presence of SVHC in our products, if above the defined concentration. The next steps for us, as for all semiconductor companies and associations, will be to contribute to the elaboration of exposure scenarios as defined in REACH and ensure appli-cation of all viable risk management measures.
Management throughout the supply chainIn 1999, we announced in the second version of our Decalogue our intention to publish and update information about the chemical content of our products. In 2008, ST has published its 14th list of banned, exempted and restricted substances**. This list is reviewed annually to take into account the most stringent worldwide regulations and standards, and includes our customers’ requirements. Our suppliers and subcontractors have to comply with it and produce lab analyses to this effect. They also have to certify their compliance to our programs and in-force legislation and to ensure they have adequate EHS management systems (such as OHSAS 18001, ISO 14001 or EMAS). In 2008, a major improvement has been carried out with the creation of a new documentation system database to store and share this information internally. Thus we can guarantee our compliance to worldwide regulations and standards, and give details about the content of our products to our customers. - ECOPACK® brand; - Material Declaration, for our compliance to RoHS and other worldwide regulations and standards (covers all our products since 2008); - REACH letters for our compliance to this legislation and details about the SVHC (2008).
M For more details, see page 62
(*) REACH terminology(**) Substances may be regulated via various ways: some substances are completely banned; some are used and accepted, due to regulatory exemption or lack of alternative solutions.
ST considers the management of chemicals as its second key issue, after climate change. So far we have successfully anticipated increasingly stringent legislation as well as keeping up with our customers’ requirements.
Customers
SuppliersSubcontractorsFoundries
• Salesand marketing departments
• Purchasing (Corporate and local)
• Outsourcing and wafer Foundries outsourcing departments
ST documentation systems
Corporate and sites EHS departments Corporate Chemical commitee sites Chemical commitee Product group divisionsMaterial Declaration Champions
MBanned,exempted and declarable substances list
Material Declarations
ECOPACK® products and Material Declarations and EHS communication and letters

42
Environmental per formance I Waste management
Partnering with suppliers for material recycling
Efficient procurement of raw materials in the semiconductor industry is critical as we use high volumes of expensive metals. In recent months the cost of these resources has continued to rise.
Some concrete achievements on Front-endsitesLionel Simonnet is Procurement Manager at our Rousset site in France. When he worked on targets and coils supply with his major suppliers, he discovered that ST could benefit from a reduced price if ST could guarantee the return of used parts for recycling.
As part of the Front-End production process, in the CVD-PVD* workshop we use targets and coils as part of the microchip manufacturing process that may be made of several materials – tantalum**, titanium and copper – that we buy from Honeywell, Praxair and Nikko.
In our industry, the materials we use are highly purified and produced to be compliant with all semiconductor quality standards.
Acids used in manufacturing processes are also recovered and recycled. Alain Broc, Facilities Process Fluids Manager at the Rousset site, works on reducing the quantities of chemicals used while trying to find less-polluting alternatives for any dangerous chemicals.
At the Rousset site, phosphoric acid is now completely recycled. It is bought by an external company and used in water recycling systems. As with other products we use, the phosphoric acid is in such pure state that even as a waste it is still very valuable for other industries.
Recyclingtantalum**
The Rousset site has taken part in a tantalum recycling program with local steelworkers since mid-2007. This has achieved the twin objectives of getting lower prices from suppliers and limiting environmental impact as used products are completely recycled.
The most critical issue is to guarantee traceability of the products. To ensure this each used part is assigned a specific reference within the accounting system so that suppliers can be confident that we return to them the correct products. This project has been achieved through efficient teamwork between the production workshop, and the logistics, purchasing and procurement teams.
To save on transport costs and emissions, the parts are collected and stored onsite and sent back to the suppliers every three months.
Over 18 months, the recycling of tantalum has meant a saving of US$38,000 for the Rousset site with an additional US$28,000 gained with the recycling of other materials. This good practice has now also been implemented at the Crolles site in France.
(*) Chemical Vapor Deposition-Physical Vapor Deposition.(**) ST requires its suppliers to sign a statement ensuring that the tantalum they provide does not come from Congo.
Despite an environment of increasing raw material prices, developing creative partnerships with our suppliers has kept actual purchase costs low and made more efficient use of resources.
Interview with Lionel Simmonet Procurementmanager,Rousset,France (left on picture)
Alain Broc FacilitiesProcessFluidsmanager,Rousset,France (right on picture)

43
Shortage of supply and the high price of polysilicon have forced many companies to lookatanysolutionstorecyclesilicon.Atagloballevel,STtookthedecisiontorecycleits silicon wafers. AprojectwasstartedinJuly2008torecycle our stock of patterned wafer scraps. Previously,SThadbeenrecyclingonlyitsnon-patterned wafer scraps.
The process involved identifying all availablewafers,definingacontrolledand secure process to remove sensitive or confidentialinformation,andselectingtherightsubcontractortocollect,package,identify and ship all wafers stored at ST sites.
It was decided to sandblast the wafers toeraseanyinformationonthem,inpartnership with a secure subcontractor
inTaiwan,beforesellingthemtothephotovoltaic industry to be turned into solar cells.Highlevelsofsecurityarerequiredin the process to protect our intellectual property. Logistically it is also challenging to organize the transport of more than ten tons of silicon from our warehouses to our subcontractor.
This project has been initiated and coordinatedfromRousset,byGérardStehelin,Silicon,Mask,WaferPackingGlobalPurchasingManager,GlobalPurchasingOrganization,Front-EndMaterialsandEquipment,whoreceivedanSTBronzeAwardonbehalfofallthepeopleinvolvedfrom many ST sites and organizations.
This major project led to a number of benefits.Development of useful knowledge that can be put to use in other similar projects.
Real financial benefit, with
US$1.3m saved.
Contribution to renewable energy while reducing energy consumption and eliminating waste.
311,000 wafers weighting ten tons have been treated by sandblasting in Taiwan and turned into solar cells producing 460kW of power.
In 2008, ST sites won eight environmental awards, demonstrating good results in the key areas of environmental protection.
Wastemanagement:•Tours,France,wontheTrophéeduDéchet issued by the Chamber of Commerce for its high-performance waste management. •Shenzhen,China,wonawastereductionprize issued by the local environmental protection agency.
Wastewater:Phoenix, USA, won the 100% Compliance Award from the City of Phoenix for zero violations in waste water discharge.
Saving energy:•Shenzhen,China,wonanEnergySavingprize from the Shenzhen Energy Saving Committee.
Transportation:•Grenoble,France,wontwopricesforits Mobility Management Plan, contributing to reducing CO2 emissions.
Environmental protection: •Carrollton,USA,wonthe2008Environmental Distinction Award from the City of Carrollton. •AngMoKio,Singapore,wonanawardfromthe National Environmental Agency Corporate and School Partnership Program.
The special case of silicon
Environmental awards 2008 I STEV19 I

Communicationand awareness
Public transportand coaches
Biking and walkingincentives
ST shuttlesST-1
ST-2
Car pooling Greener business
Energy-e�cient driving
44
Environmental per formance I Cl imate Change
Around the world of transport initiativesTransport is a major contributor to climate change according to scientists, representing 18.4% of global greenhouse gases emissions (source: International Energy Agency). For STMicroelectronics, it represents a small part of our total emissions (around 6%) but despite this, many of our sites have decided to tackle this issue, proposing alternative solutions to their employees.Our sites have taken many initiatives locally. Every site has strong support from local mana-gement and a motivated team to make progress in this area. Employee transportation is a sensitive issue to address because it deals with employees’ privacy (for home-work journeys). ST cannot compel anyone to use greener means of transportation but the company can give incentives and help raise employees’ awareness of the issues. A successful mobility management plan has to take account of local factors, including the workforce’s size, where employees live, local and national regulations and subsidies and public transportation infrastructure. Any mobility plan management has to respect certain requirements:• safety(roadinfrastructureandequipment);• cost-effectivenessforbothSTandemployees;• availability,flexibilityandcomfort;
• lowenvironmentalimpact;• reducedtrafficcongestion;• carparking.Several ST sites have developed local initiatives that offer relevant transport solutions.
Communication and awarenessCommunication is indispensable to a sucessful mobility management plan. Its aim is threefold: a dialogue between management and em-ployees; awareness about the benefits of alternative transportation; and information about the existing solutions. Castelletto (Italy): tailored solutions communi-cated to each employee.Grenoble (France) and Paris (France): online description of advantages and practical informa-tion for each mode of transport (such as cycling, walking, carpooling or public transport). Crolles (France): online CO2 calculator to measure individual impacts, which are calcula-ted from means of transport, distances traveled and number of people traveling.Kirkop(Malta): training for new employees includes a module on transportation.
Public transport and coachesPublic transport and buses are one of the most standard solutions for ST sites. Their success depends on the fares, frequency of service and its coverage.
Grenoble and Paris: bus tickets offered to cyclists and walkers for rainy days or other occa-sions when walking or cycling is impractical. Grenoble,Paris,RoussetandTours(France):partnership with local authorities and neigh-bouring companies to improve public transport services.
ST shuttlesSome of our sites are rather close to each other. To reduce the number of trips for employees traveling to and from some sites have organized daily shuttles. Rousset/Grenoble/Crolles,Castelletto/Agrate:daily shuttles between ST sites. In several countries there are also daily shuttles with ST or private coaches because there is no public transport available.Bouskoura (Morocco): a private coach company assigned to ST, free of charge for employees. Kirkop,AngMoKio(Singapore)andShen-zhenSalesandMarketingOffice(China): ST buses free of charge for employees, taking into account shift schedules for operators. Greater Noida (India): 38 ST buses, running on compressed natural gas transport 80% of the site’s employees.

Communicationand awareness
Public transportand coaches
Biking and walkingincentives
ST shuttlesST-1
ST-2
Car pooling Greener business
Energy-e�cient driving
45
Car-poolingCar-pooling can complement public transport and may be convivial and safer, cheaper and less polluting. Grenoble,Phoenix(USA)andRousset:parking places dedicated to carpoolers close the site entrance.Tours: breakfasts organized for employees from a same district so that they meet each other and then carpool. Rousset: employees’ subscription to a carpoo-ling association paid by ST. Employees are put in touch with all the members and benefit from some commercial advantages.Phoenix: quarterly fuel card offered by ST to carpoolers.
Cycling and walking incentivesCycling and walking are the cheapest, healthiest and most environment friendly transport option. For them to be practical, safe and convenient access to ST’s sites are required, and the sites themselves cannot be located too far from surrounding cities.Phoenix: quarterly gift cards offered by ST to walkers and cyclists.Tunis (Tunisia): 10 bikes available for ST em-ployees to borrow.Grenoble and Paris: packages offered to bikers and walkers (such as public transport tickets, backpacks, bike lights and maintenance kits).
Energy-efficient drivingA mobility management plan can never encom-pass every employee. ST is also willing to find solutions for people who cannot avoid using their cars. They can move towards greener vehi-cles and drive safely and in a more fuel-efficient manner. Grenoble: ST provides financial support for employees to buy electric cars or transform their vehicle to be powered by LPG (liquid petroleum gas) or CNG (compressed natural gas).Paris: real time information about traffic for employees so they can avoid congestion.Paris and Tours: training sessions on economic and safe driving.
Greener business ST is also developing solutions to limit CO2 emis-sions during the course of business. In addition to shuttles between sites we also limit business travel as far as possible using conference calls, net-meeting conferences and other e-learning solutions. Geneva (Switzerland): meeting rooms equipped with sophisticated communications equipment including microphones, cameras and speakers for video conferencing.Grasbrunn (Germany): salesmen’s company cars consume less than 6 liters/100km and emit less than 140g of CO2, which is below the company requirements.STUniversity: virtual classrooms with webcams, headphones and software for remote interactive training between several employees.
ST Grenoble - exemplary in mobility managementIn 2008, ST Grenoble (France) was recognized twice for the excellence of its mobility management plan. The site won a prize from the European Platform on Mobility Management and another from CIPRA, an international non-governmental organization campaigning for Alps protection. The Grenoble site has been active in this area since 2000 and has rea-ched exceptional results thanks to a comprehensive package of measures and constant collaboration with neighboring companies and local authorities.
In 2008, more than 54% of ST Grenoble employees were using alternative transport methods that contri-buted to saving more than 1,000 tons of CO2.
A Mobility Management Commission in FranceAt the end of 2008, ST France (six sites) decided to combine their efforts on mobility management and create a national commission.
The commission suggests that every ST employee should be offered several solutions of alternative transport. Best practice and lessons learned from each site will be shared.
In 2009, local commissions will be implemented to col-lect individual sites’ needs and expectations and locally implement decisions taken by the national committee.
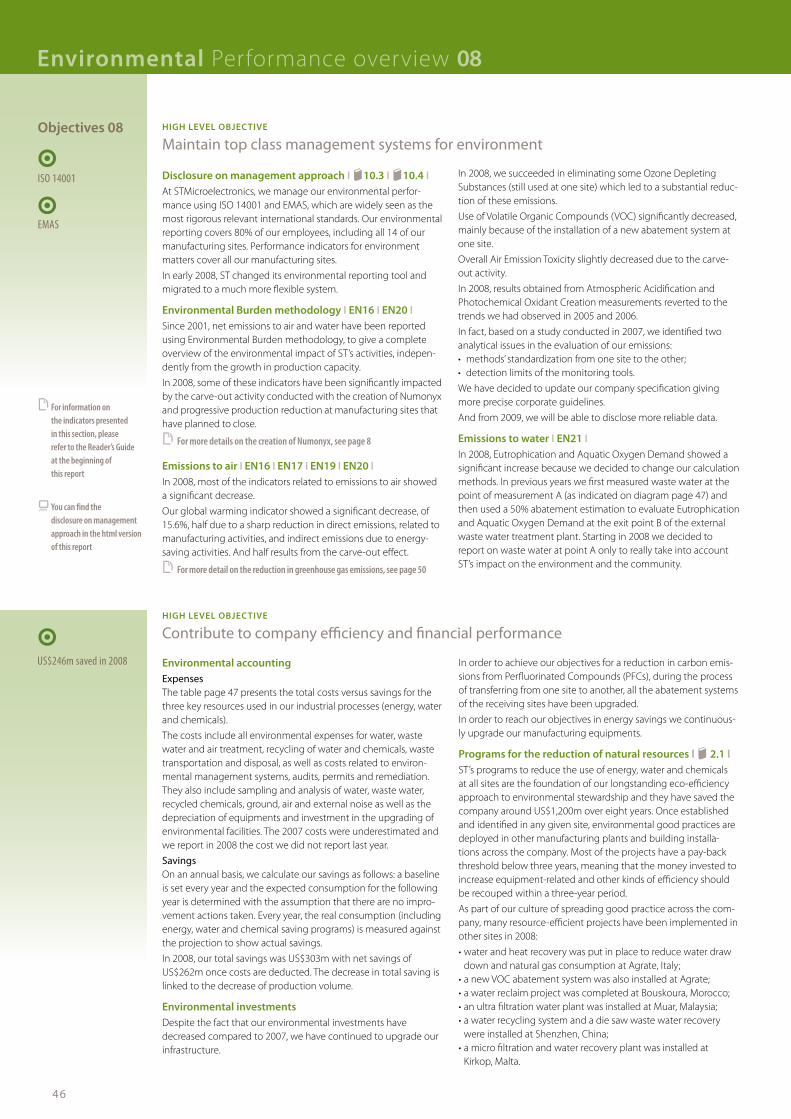
46
Environmental Performance overview 08
Objectives 08
ISO 14001
EMAS
US$246m saved in 2008
Disclosure on management approach I j10.3 I j10.4 IAt STMicroelectronics, we manage our environmental perfor-mance using ISO 14001 and EMAS, which are widely seen as the most rigorous relevant international standards. Our environmental reporting covers 80% of our employees, including all 14 of our manufacturing sites. Performance indicators for environment matters cover all our manufacturing sites.In early 2008, ST changed its environmental reporting tool and migrated to a much more flexible system.
Environmental Burden methodology I EN16 I EN20 ISince 2001, net emissions to air and water have been reported using Environmental Burden methodology, to give a complete overview of the environmental impact of ST’s activities, indepen-dently from the growth in production capacity. In 2008, some of these indicators have been significantly impacted by the carve-out activity conducted with the creation of Numonyx and progressive production reduction at manufacturing sites that have planned to close.
M For more details on the creation of Numonyx, see page 8
Emissions to air I EN16 I EN17 I EN19 I EN20 IIn 2008, most of the indicators related to emissions to air showed a significant decrease.Our global warming indicator showed a significant decrease, of 15.6%, half due to a sharp reduction in direct emissions, related to manufacturing activities, and indirect emissions due to energy- saving activities. And half results from the carve-out effect.
M For more detail on the reduction in greenhouse gas emissions, see page 50
In 2008, we succeeded in eliminating some Ozone Depleting Substances (still used at one site) which led to a substantial reduc-tion of these emissions.Use of Volatile Organic Compounds (VOC) significantly decreased, mainly because of the installation of a new abatement system at one site.Overall Air Emission Toxicity slightly decreased due to the carve-out activity.In 2008, results obtained from Atmospheric Acidification and Photochemical Oxidant Creation measurements reverted to the trends we had observed in 2005 and 2006.In fact, based on a study conducted in 2007, we identified two analytical issues in the evaluation of our emissions: • methods’standardizationfromonesitetotheother; • detectionlimitsofthemonitoringtools.We have decided to update our company specification giving more precise corporate guidelines. And from 2009, we will be able to disclose more reliable data.
Emissions to water I EN21 IIn 2008, Eutrophication and Aquatic Oxygen Demand showed a significant increase because we decided to change our calculation methods. In previous years we first measured waste water at the point of measurement A (as indicated on diagram page 47) and then used a 50% abatement estimation to evaluate Eutrophication and Aquatic Oxygen Demand at the exit point B of the external waste water treatment plant. Starting in 2008 we decided to report on waste water at point A only to really take into account ST’s impact on the environment and the community.
HIGH LEvEL OBJECtIvE
Maintain top class management systems for environment
HIGH LEvEL OBJECtIvE
Contributetocompanyefficiencyandfinancialperformance
Environmental accountingExpenses The table page 47 presents the total costs versus savings for the three key resources used in our industrial processes (energy, water and chemicals). The costs include all environmental expenses for water, waste water and air treatment, recycling of water and chemicals, waste transportation and disposal, as well as costs related to environ-mental management systems, audits, permits and remediation. They also include sampling and analysis of water, waste water, recycled chemicals, ground, air and external noise as well as the depreciation of equipments and investment in the upgrading of environmental facilities. The 2007 costs were underestimated and we report in 2008 the cost we did not report last year.SavingsOn an annual basis, we calculate our savings as follows: a baseline is set every year and the expected consumption for the following year is determined with the assumption that there are no impro-vement actions taken. Every year, the real consumption (including energy, water and chemical saving programs) is measured against the projection to show actual savings. In 2008, our total savings was US$303m with net savings of US$262m once costs are deducted. The decrease in total saving is linked to the decrease of production volume.
Environmental investmentsDespite the fact that our environmental investments have decreased compared to 2007, we have continued to upgrade our infrastructure.
In order to achieve our objectives for a reduction in carbon emis-sions from Perfluorinated Compounds (PFCs), during the process of transferring from one site to another, all the abatement systems of the receiving sites have been upgraded. In order to reach our objectives in energy savings we continuous-ly upgrade our manufacturing equipments.
Programs for the reduction of natural resources l j 2.1 lST’s programs to reduce the use of energy, water and chemicals at all sites are the foundation of our longstanding eco-efficiency approach to environmental stewardship and they have saved the company around US$1,200m over eight years. Once established and identified in any given site, environmental good practices are deployed in other manufacturing plants and building installa-tions across the company. Most of the projects have a pay-back threshold below three years, meaning that the money invested to increase equipment-related and other kinds of efficiency should be recouped within a three-year period.As part of our culture of spreading good practice across the com-pany, many resource-efficient projects have been implemented in other sites in 2008: •waterandheatrecoverywasputinplacetoreducewaterdraw down and natural gas consumption at Agrate, Italy; •anewVOCabatementsystemwasalsoinstalledatAgrate; •awaterreclaimprojectwascompletedatBouskoura,Morocco; •anultrafiltrationwaterplantwasinstalledatMuar,Malaysia; •awaterrecyclingsystemandadiesawwastewaterrecovery were installed at Shenzhen, China; •amicrofiltrationandwaterrecoveryplantwasinstalledat Kirkop, Malta.
5 You can find the disclosure on management approach in the html version of this report
M For information on the indicators presented in this section, please refer to the Reader’s Guide at the beginning of this report
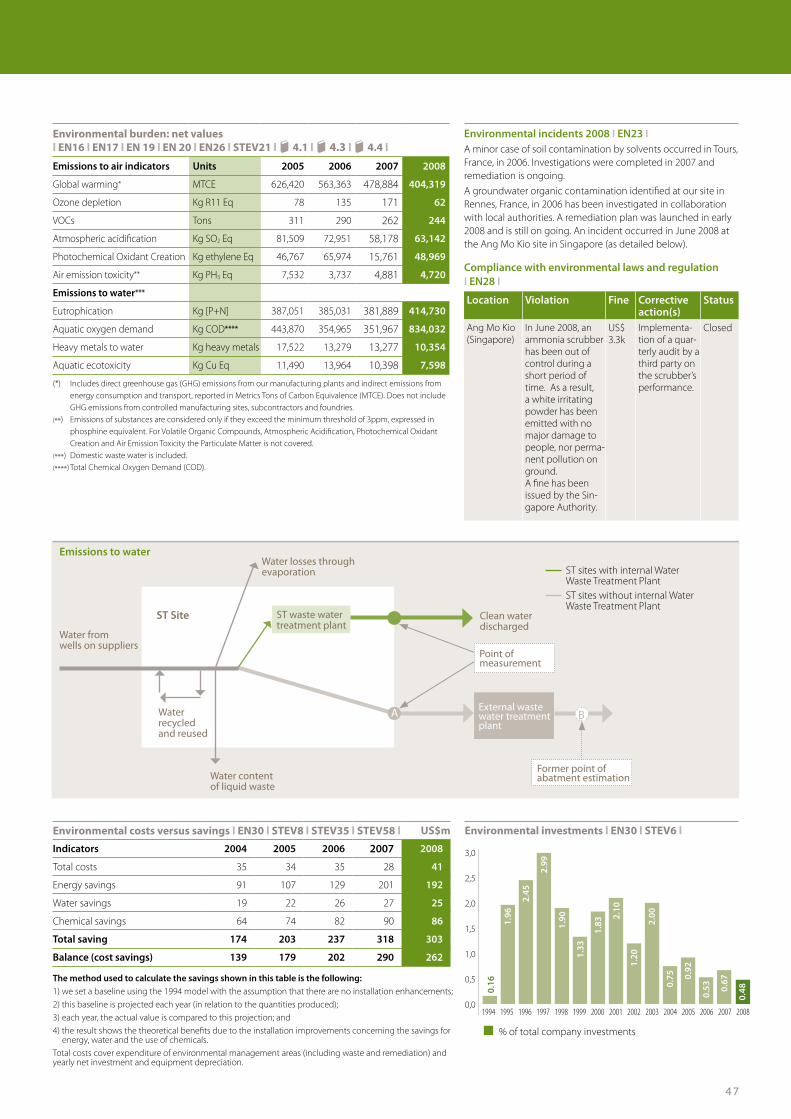
47
Environmental burden: net values l EN16 l EN17 l EN 19 l EN 20 l EN26 l STEV21 l j 4.1 l j 4.3 l j 4.4 l
Emissions to air indicators Units 2005 2006 2007 2008
Global warming* MTCE 626,420 563,363 478,884 404,319
Ozone depletion Kg R11 Eq 78 135 171 62
VOCs Tons 311 290 262 244
Atmospheric acidification Kg SO2 Eq 81,509 72,951 58,178 63,142
Photochemical Oxidant Creation Kg ethylene Eq 46,767 65,974 15,761 48,969
Air emission toxicity** Kg PH3 Eq 7,532 3,737 4,881 4,720
Emissions to water***
Eutrophication Kg [P+N] 387,051 385,031 381,889 414,730
Aquatic oxygen demand Kg COD**** 443,870 354,965 351,967 834,032
Heavy metals to water Kg heavy metals 17,522 13,279 13,277 10,354
Aquatic ecotoxicity Kg Cu Eq 11,490 13,964 10,398 7,598
(*) Includes direct greenhouse gas (GHG) emissions from our manufacturing plants and indirect emissions from energy consumption and transport, reported in Metrics Tons of Carbon Equivalence (MTCE). Does not include GHG emissions from controlled manufacturing sites, subcontractors and foundries.(**) Emissions of substances are considered only if they exceed the minimum threshold of 3ppm, expressed in phosphine equivalent. For Volatile Organic Compounds, Atmospheric Acidification, Photochemical Oxidant Creation and Air Emission Toxicity the Particulate Matter is not covered.(***) Domestic waste water is included.(****) Total Chemical Oxygen Demand (COD).
Environmental costs versus savings l EN30 l STEV8 l STEV35 l STEV58 l US$m
Indicators 2004 2005 2006 2007 2008
Total costs 35 34 35 28 41
Energy savings 91 107 129 201 192
Water savings 19 22 26 27 25
Chemical savings 64 74 82 90 86
total saving 174 203 237 318 303
Balance (cost savings) 139 179 202 290 262
the method used to calculate the savings shown in this table is the following:1) we set a baseline using the 1994 model with the assumption that there are no installation enhancements;2) this baseline is projected each year (in relation to the quantities produced);3) each year, the actual value is compared to this projection; and4) the result shows the theoretical benefits due to the installation improvements concerning the savings for energy, water and the use of chemicals.Total costs cover expenditure of environmental management areas (including waste and remediation) and yearly net investment and equipment depreciation.
0,0
0,5
1,0
1,5
2,0
2,5
3,0
200820072006200520042003200220012000199919981997199619951994
0.16
1.96
2.45
2.99
1.90
1.33
1.83
2.10
1.20
2.00
0.75 0.
92
0.53 0.
67
0.48
Environmental investments l EN30 l STEV6 l
Water recycled and reused
Water from wells on suppliers
Water losses through evaporation
ST waste water treatment plant
External waste water treatment plant
Clean water discharged
Former point of abatment estimationWater content
ofliquidwaste
St Site
A B
Location violation Fine Corrective action(s)
Status
Ang Mo Kio (Singapore)
In June 2008, an ammonia scrubber has been out of control during a short period of time. As a result, a white irritating powder has been emitted with no major damage to people, nor perma-nent pollution on ground. A fine has been issued by the Sin-gapore Authority.
US$ 3.3k
Implementa-tion of a quar-terly audit by a third party on the scrubber’s performance.
Closed
Compliance with environmental laws and regulation I EN28 I
ST sites with internal Water Waste Treatment PlantST sites without internal Water Waste Treatment Plant
Environmental incidents 2008 I EN23 IA minor case of soil contamination by solvents occurred in Tours, France, in 2006. Investigations were completed in 2007 and remediation is ongoing. A groundwater organic contamination identified at our site in Rennes, France, in 2006 has been investigated in collaboration with local authorities. A remediation plan was launched in early 2008 and is still on going. An incident occurred in June 2008 at the Ang Mo Kio site in Singapore (as detailed below).
Point of measurement
Emissions to water
% of total company investments

48
Environmental Performance overview 08
Objectives 08
Reduce energy consumption by 5%*
Reduce water consumption by 5%*
Reduce chemical consumption by 5%*
HIGH LEvEL OBJECtIvE
Continuously improve our eco-footprint according to Decalogue target
Overall reduction in consumption of resourcesIn 2008, for all ST manufacturing sites, electricity use decreased by 14.2%, water use by 16.3% and use of chemicals by 12.8%. These trends should be compared to a production decrease equivalent to 9.6% and an estimated carve-out effect of about -7% for electri-city, -9% for water and -4% for chemicals.
Energy saved Savings include the global energy efficiency improvements in manufacturing processes and facilities management within our manufacturing sites. The overall energy consumption (natural gas and electricity) in kWh per unit of production expressed in norma-lized value (baseline 100 in 1994) reaches the value of 48.5 in 2008.
Consumption of electricity per unit of productionIn 2008, the overall trend since 1994 for electricity consumption reduction, based on our Environment, Health and Safety Decalo-gue target to achieve a cumulative reduction of 5% per year (per unit of production), has been maintained. The global reduction in 2008 versus 2007 is at 5.2%. This result is partially due to upgrades to manufacturing processes, with more sophisticated and com-plex technology.
Consumption of natural gasNatural gas is mainly used for air heating purposes and for coo-king at on-site canteens, representing only approximately 10% of our total energy use. We are focusing on reducing natural gas consumption as part of our commitment to reduce CO2 emissions.
The graph on page 49 summarizes the results achieved over the years through energy saving programs, including electricity and natural gas.
Consumption of chemicals l j 5.1 lOur manufacturing processes require significant amounts of chemicals, especially in Front-end activities. Since some chemicals have a potential impact on the environment and also carry health and safety risks, we work hard to keep their use as low as possible.
M For more detail about our chemical management, see page 41In 2008, despite the global consumption of chemicals has decreased by 12.8% in absolute value, compared to 2007, the consumption per production unit is deteriorating due to a de-crease in production.
However, since 2000, the average reduction in chemical use has been over 7.8% per year, compared to the annual target of 5% reduction per unit of production.
Consumption of waterThis is an area where we continue to make good progress. We have consistently exceeded our Environmental, Health and Safety Decalogue target, reducing water consumption per unit of production by an average of 8.9% per year since 1994. The chart on page 49 plots our performance against the EHS Decalogue target of 5% reduction since 1994 and shows that the reduction of water consumption per unit produced has been much faster than anticipated.
The reduction in water consumption is achieved through conti-nuous improvements in our processes and through a reduction in water draw down, but also thanks to recycling practices that are shared between different sites. As a company, our water recycling and reuse rate is 34.5%, but reaches 40% to 50% in some Front-end plants (Rousset and Catania) and 75% in some Back-end plants (Malta).
We monitor our complete water cycle, which consists of a number of stages. Water is drawn from relevant sources and is used, reused and recycled for our manufacturing processes and services at our sites. During these processes some water is lost through evapora-tion and the remaining water is discharged in waste water sewage systems or as part of liquid waste (such as salt water solutions, solvent solutions or sludge).
All of our water is treated either internally with a waste water treatment plant or externally. Since 2008, we disclose the percen-tage of waste water treated internally.
M For more details on this new calculation, see page 46
While none of our manufacturing sites is located in sensitive biolo-gical areas, or in any special wetland environments, every care is taken to keep the environmental impact of our activities on our surroundings to a minimum. l EN12 l
Start a change of mindset in STMicroelectronics’ ecological approach by:
• evaluating the balance between the energy consumption induced by our products and the energy saved thanks to them;
• performing Life- Cycle Assessments (LCA) studies for at least four products;
• introducing the concept of eco- design.
09Our objectives
(*) Per unit of production/year compared to the 1994 baseline
Interview with Marie-Anne De NervilleDiffusionEngineeringmanager,Rousset,France
Rousset Front-end tackling consumption of chemicals Reducing chemical consumption was a focus of the Front-end manufacturing team at at Rousset site, France, in 2008.
• A major project focused on sulfuric acid used for wet resist strip with the objective to better load equip- ments by rationalizing recipes (from 16 to 10). Such program allowed to gain productivity, reduce reduce chemicals consumption by 10% and by then reduce costs and final emissions.
• Another project focused on oxalic acid use with the primary objective of reducing its consumption, and secondly to develop alternatives. A possibility is to use a more diluted solution of the acid that has the additional benefit of providing an 80% cost reduction.
And so, even in mature production units we still find ways to reduce chemical use and then reduce our impact on the environment.
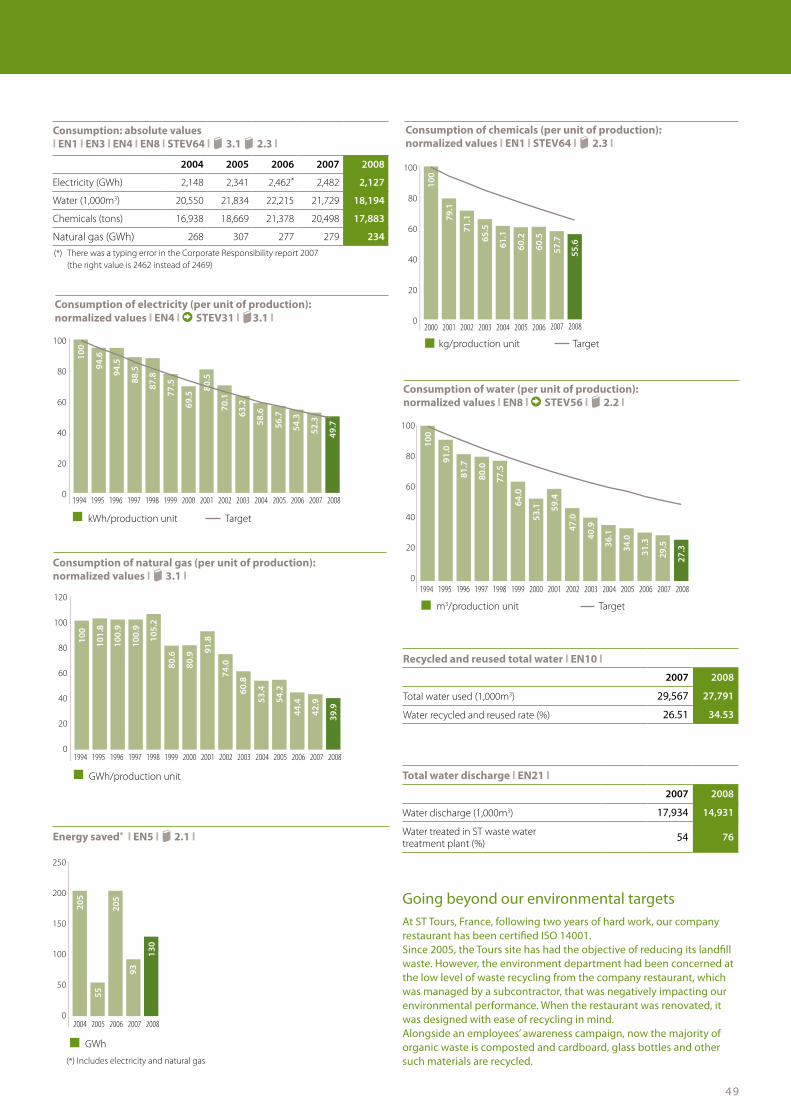
49
Consumption of electricity (per unit of production): normalized values l EN4 l X STEV31 l j3.1 l
2008200720062005200420032002200120001999199819971996199519940
20
40
60
80
100
100
94.6
94.5
88.5
87.8
77.5
69.5
80.5
70.1
63.2
58.6
56.7
54.3
52.3
49.7
kWh/production unit Target
Consumption of natural gas (per unit of production): normalized values l j 3.1 l
2008200720062005200420032002200120001999199819971996199519940
20
40
60
80
100
120
100
101.
8
100.
9
100.
9
105.
2
80.6
80.9 91
.8
74.0
60.8
53.4
54.2
44.4
42.9
39.9
GWh/production unit
Consumption: absolute values l EN1 l EN3 l EN4 l EN8 l STEV64 l j 3.1 j 2.3 l
2004 2005 2006 2007 2008
Electricity (GWh) 2,148 2,341 2,462* 2,482 2,127
Water (1,000m3) 20,550 21,834 22,215 21,729 18,194
Chemicals (tons) 16,938 18,669 21,378 20,498 17,883
Natural gas (GWh) 268 307 277 279 234(*) There was a typing error in the Corporate Responsibility report 2007 (the right value is 2462 instead of 2469)
Energy saved* l EN5 l j 2.1 l
200820072006200520040
50
100
150
200
250
205
55
205
93
130
GWh
(*) Includes electricity and natural gas
Consumption of water (per unit of production): normalized values l EN8 l X STEV56 l j 2.2 l
2008200720062005200420032002200120001999199819971996199519940
20
40
60
80
10010
0
91.0
81.7
80.0
77.5
64.0
53.1 59
.4
47.0
36.1
34.0
31.3
40.9
29.5
27.3
m3/production unit Target
Consumption of chemicals (per unit of production): normalized values l EN1 l STEV64 l j 2.3 l
2008200720062005200420032002200120000
20
40
60
80
100
100
79.1
71.1
65.5
61.1
60.2
60.5
57.7
55.6
kg/production unit Target
Total water discharge l EN21 l
2007 2008
Water discharge (1,000m3) 17,934 14,931
Water treated in ST waste water treatment plant (%) 54 76
Recycled and reused total water l EN10 l
2007 2008
Total water used (1,000m3) 29,567 27,791
Water recycled and reused rate (%) 26.51 34.53
Going beyond our environmental targetsAt ST Tours, France, following two years of hard work, our company restaurant has been certified ISO 14001.Since 2005, the Tours site has had the objective of reducing its landfill waste. However, the environment department had been concerned at the low level of waste recycling from the company restaurant, which was managed by a subcontractor, that was negatively impacting our environmental performance. When the restaurant was renovated, it was designed with ease of recycling in mind. Alongside an employees’ awareness campaign, now the majority of organic waste is composted and cardboard, glass bottles and other such materials are recycled.
50
Objectives 08
80% of waste to be reused or recycled
<5% landfill waste versus total waste
Reduce pollution from VOCs by 10%*
Reduce pollution from acidification by 5%*
Reduce pollution from eutrophication by 5%*
Reduce pollution from heavy metals by 10%*
Reduce our eco-footprint below 0.95
Summary of greenhouse gas emissions l j 8.1 lWe consider global warming as a critical issue and work hard to decrease the level of greenhouse gases (GHG) released into the atmosphere through our manufacturing activities. In our EHS De-calogue, we have defined an ambitious Carbon Roadmap which targets CO2 neutrality for ST by 2010. With impressive results – a reduction of 31% in total emissions over the five past years – we should be able to reach this objective for our direct emissions. Also based on guidelines from the Global Reporting Initiative (GRI) and the Greenhouse Gas Protocol*, we decided to disclose our CO2 emissions in a different way that better focuses on our direct emissions CO2 neutrality. Thus, our net direct emissions have decreased by 39% since 2004 thanks to our management program to reduce CO2 emissions from perfluorinated compounds (PFCs), and our carbon offset and emissions reduction programs.
The net emissions of PFCs were reduced only by 11,000 Metric Tons of Carbon Equivalent (MTCE) instead of our objective of 50,000 MTCE because much investment in PFCs abatement was delayed due to process transfer from one site to another.
Nevertheless we have been able to reach the objective reported in our EHS Decalogue to reduce net PFCs emissions to 10% versus 1995 by 2008.
5 For more information on our initiatives to reduce greenhouse gases (EN18) see the html version of the report
(*) This protocol arose from a partnership between the World Resources Institute and the World Business Council for Sustainable Development (WBSD).
A study conducted in 2007 on transportation emissions, using a standard methodology developed in Europe and financed by the European Environment Agency (EEA), concluded that we were over estimating our emissions. This was because we were using emission factors for old technology and higher polluting means of transport. In 2008, all our calculations have been done with these new emission factors, meaning we are reporting lower transporta-tion emissions results.
Under the old calculation methods, total transportation emission of about 100 ktons CO2 would have resulted in 89 ktons CO2.
Green energyOur wind farm located in the south of France produced only 21.7GWh in 2008, as damage to some of the equipment from particularly strong gusts of wind meant that the turbines were only operational for part of the year.
The total green energy used by ST consists of electricity that is either purchased or generated by renewable sources and accounts for about 3% of total energy consumption. The electri-city produced by ST’s wind farm accounts for about 1% of total energy consumption, while the small contribution of photovoltaic and solar thermal energy accounts for about 0.01%. In addition to this, the electricity purchased from nuclear sources is about 29%, making the total energy used without CO2 emissions of 32% in 2008.
Environmental Performance overview 08
HIGH LEvEL OBJECtIvE
Progressively achieve carbon neutralityReduce net PFC emissions to 10% versus 1995 by 2008
Increase use of renewable energy to 15% of total energy use by 2010
WasteIn 2008, only 3.6% of total waste produced by ST went to landfill. All other waste was reused, recycled or burned to produce energy. The overall downward trend over time continues to be very positive, with an impressive decrease of landfill waste of 78% over the last eight years. The reduction of landfill waste has been achieved by selecting appropriate waste recycle and reuse activities. We organize regular audits to control the waste recycling conducted by our subcontractors.As a result of our program to reduce landfill waste, reused and recycled waste (measured as a percentage of total waste) has increased steadily over the years. In 2008, we reused or recycled about 89% of waste generated. Recycled and reused waste at our sites varies between 47% and 98% according to the local technologies available and specific waste characteristics.Hazardous waste, in very general terms, is the waste resulting from the production process, which can include such things as chemical substances, some plastics and lightbulbs. This waste showed a reduction of about 3.4% between 2007 and 2008.Most hazardous waste is recycled or reused and the remai-ning waste is disposed off safely by specially authorized com-panies to avoid environmental contamination. Most of our
hazardous waste is treated in the same country that it was produced, unless there is no authorized treatment plant. The safe transportation of hazardous waste to a location where it can be treated occurs for two of our sites, in full accordance with the Basel Convention. The total waste figure shows an increase between 2007 and 2008 mainly due to one of our site new waste water treat-ment plant sludge’s production. This sludge is recycled as fertilizer and as a nutritional agent for biological masses.
ST’s Eco-footprint 2008The Eco-footprint is an environmental composite indicator that allows ST to monitor a number of key aspects of the environmental performance of our manufacturing plants. The ten parameters that compose this indicator and the cor-responding GRI G3 indicators we use to report our progress in detail are shown in the table on page 51. In 2001, we defined the value of 1 as our target for each pa-rameter, generally based on the best performance achieved by an ST site at some point, or based on the best projected performance for the coming years. In 2008, we slightly missed our objective of reducing our eco-footprint below our new target of 0.95, with a global result of 0.96 compared to 0.97 in 2007.
HIGH LEvEL OBJECtIvE
Continuously improve our eco-footprint according to Decalogue target
(*) Per unit of production/ year compared to the 1994 baseline

51
Direct and indirect energy consumption by primary source l EN3 l EN4 l STEV37 l j 3.3 l
Breakdown of energy consumption (GWh) 2006 2007 2008
Electricity consumption 2,462 2,482 2,127
Natural gas consumption 274 279 234
Others sources 41 1 0
Total energy consumption 2,777 2,762 2,361
Electricity % 88.66 89.86 90.09
Breakdown of energy sources (%)
Green electricity purchased 9.51 3.01 2.04
Electricity produced by ST’s windfarm 0.96 1.10 0.92
Photovoltaic and thermal solar electricity produced by ST 0.004 0.01 0.01
Electricity purchased from nuclear 29.84 25.60 28.78
Electricity purchased from non renewable sources 48.346 60.18 58.34
Natural gas 9.87 10.10 9.91
Other fuels 1.47 0 0
Total 100 100 100
Electricity produced by windfarm l EN3 l STEV40 l j 3.3l GWh
2004 2005 2006 2007 2008
Electricity 30.5 33.1 23.7 30.0 21.7
Summary of net CO2 emissions l EN16 l EN17 l EN29 l 3.4 l kTons
2005 2006 2007 2008
Direct Emissions 808 792 532 482STEV46 Direct emissions due to PFCs 747 728 481 439
Direct emissions due to boilers 61 64 51 43
Indirect Emissions (purchased electricity)
1,096 975 1,029 882
STEV48 Other indirect emissions(transportation*) 242 242 107 89
X STEV47 Total emissions** 2,146 2,009 1,668 1,453STEV52 Sequestration due to the imple-
mentation of reforestation projects 40 81 126 179
Total Direct net emissions 768 711 406 303
(*) The transportation emissions value is a global estimate of employees’ transportation and transport of goods.(**) Transportation emissions are integrated in the total emissions.
CO2 emissions: normalized values l EN16 l
2008200720062005200420032002200120001999199819971996199519940
20
40
60
80
100
120
100
103
97 92
88
83
72 72
63
52 49
38
57
33 30
kTons CO2/wafer out
Landfill waste l EN22 l X STEV71 l j 3.4 l
2008200720062005200420032002200120001999199819971996199519940
10
20
30
40
50
60
70
80
71.0
51.0
41.0
42.5
36.2
26.0
25.8
21.0 14
.8
6.7 8.3
4.8
5.9
5.5
3.6
% of total waste Target
Recycled waste l EN22 l STEV72 l j 6.1l %2004 2005 2006 2007 2008
Waste recycling and reuse 80 78 80 83 89
Waste l EN22 l Tons
2006 2007 2008
Total hazardous waste 15,647 13,205 12,756
Total waste 44,364 43,628 46,367
Waste under Basel Convention l EN24 l
2007 2008
Hazardous waste transported % of total hazardous waste 0.09 0.02
Eco-footprint l STEV23 l
2005 2006 2007 2008
Front-end
EN4 Electricity 1.15 1.10 1.01 0.93
EN8 Water 1.12 1.02 0.95 0.87
EN1 Chemicals 1.08 1.13 1.03 0.95
EN16 Global warming 1.64 1.29 1.07 1
EN22 Waste R+R 1.29 1.25 1.21 1.1
EN1 Material intensity 1.18 1.17 1.08 1
EN20 VOC 0.88 0.75 0.65 0.67
EN20 Acidification 2.2 1.44 1.17 1.32
EN21 Fluoride 2.21 3.05 2.72 2.26
EN21 Eutrophication 1.97 1.84 1.76 2.19
Total 1.424 1.353 1.226 1.18
Back-end
EN4 Electricity 0.96 0.86 0.74 0.69
EN8 Water 1.00 1.05 1.00 0.9
EN1 Chemicals 0.61 0.51 0.36 0.26
EN16 Global warming 1.00 0.89 0.80 0.94
EN22 Waste R+R 1.06 1.11 1.01 1
EN1 Material intensity 1.33 1.20 1.06 0.76
EN20 VOC 1.04 0.53 0.43 0.38
EN20 Acidification 1.20 1.78 0.46 1.5
EN21 Heavy Metals 0.98 1.28 0.46 0.52
EN21 Eutrophication 0.88 0.50 0.45 0.26
Total 0.992 0.960 0.706 0.74
Total Eco-footprint 1.21 1.16 0.97 0.96
Target 0.95

52
In2008,450,000canisterscontaining
8” wafers were sent from Front-end
to Back-end sites or to our customers.
Before2007,STusedtopack-upthese
wafers in standardized outer boxes
that had just a capacity of four
canisters.
Taking into account the fact that
logistic companies often consider the
volumetric weight (reflecting the den-
sityofthepackage)fortheirinvoicing,
it meant that when we were sending
lessthanfourcanisters,weeffectively
paid for emptiness.
In2006,localGlobalLogisticand
Warehousing (GLWO) departments
in our Front-end sites evaluated the
contentoftheirboxes.Inconclusion,
there was a real economic and ecolo-
gical interest in asking ST suppliers to
design new boxes for smaller contents.
Prototypes were proposed and tested
withscrapsfirstandthenwafers.As
resultswerepositive,forthepasttwo
years local GLWOs use boxes that can
containone,twoorfourcanisters,
which has resulted in yearly savings of
US$278,000andmaterialreductions
equivalentto89,000kginvolumetric
weight.
Innovating in product packing -30% decrease
in customer returns thanks
to launch of major quality
programs
Electronic ballast used
for light bulbs allows
80% of energy saving
15% of fuel saved
thanks to ‘start & stop’
system in cars
Product responsibility

53
Respons ib le produc ts des ign I Produc t Responsibi l i t y
Towards a greener automotive market
Reaching a greener automotive market is not such an easy subject for manufacturers as well as for final consumers. In fact, even if new technologies for CO2 reduction already exist, time may be running out for automotive manufacturers to integrate them into cars and for a change in consumers’ mentality. For example, in the industry today, even if a consumer wants to buy a greener car, he might not be willing to pay more for a car that has less performance than he is used to.
Existing technical solutionsThere are many different ways to reduce drastically fuel consumption and CO2 emissions. • Start-stopsystemscanreduceurbanfuel consumption by 8% to 10%. This technology has an outstanding price-performance ratio; we expect virtually all of European vehicles to be equipped with such a system in just a few years’ time.
• Electricpower-steering,enhancedcomputer control of the engines, and piezoelectrically and magnetically-controlled fuel injection for gasoline and diesel cars can all increase engine efficiency.• Newdesignsofenginefans,andoilandwater pumps can cut fuel consumption by between 5% and 10%.
The hybrid solutionThere are great opportunities for developing hybrid technology further. State of the art battery technology allows the best hybrid vehicles to travel for 50 to 80 kilometers on electricity alone.The cost for a short trip is only around one third of that incurred by a combustion engine at fuel prices at the end 2008. In this view, hybrid cars would require the integration of a lot more electronic components mainly for Powertrain, but also for charging, heating, air conditioning, etc...
ST has developed a wide product portfolio to respond to these increasing needs and will need to do more to complete its range as the market for hybrid cars develops.ST can provide a wide range of low-energy semiconductor components and other optimized products. Our designers and developers collaborate closely with our customers in this field to support the launching of new solutions on the market.
M For more detail, see page 55
Climate change and more particularly CO2 emissions are key issues for the automotive market. But increasing energy prices should lead to the development of new solutions.
Interview with Herbert Sax Technical Marketing Principal Engineer, Marketing and Application, Automotive Business Unit, Europe

The slogan “We work for your energy efficient world” was the main theme for ST’s participa-tion in the Electronica Exhibition in Munich, November 2008.
At ST’s booth, we presented numerous applica-tions, in partnership with our customers, where ST’s products contribute to reducing energy consumption.Our CEO, Carlo Bozotti, participated in a round table discussion about the contribution of the semiconductor industry to climate protection, with the objective to show what contribution the semiconductor industry and its companies can make to reduce worldwide emissions of CO2.
Looking back…Although the semiconductor industry makes a relatively small contribution to climate change compared to many other industries, it must minimize its own impact on the environment,
especially regarding greenhouse gas emissions. Based on its structured Environmental Health and Safety Decalogue approach, ST has decreased its global energy consumption per unit of production by 50.4% since 1994, an average of over 5% per year. In the last two years, although the number of wafers we pro-cessed increased 15%, our total CO2 emissions decreased in absolute value by 27%. Our efforts have demonstrated that investment in reducing consumption of energy, water and chemicals can lead to financial savings, proving correct the slogan we have adopted: Green is Black. We have showed that there is no conflict between the moral pressure to be environmen-tally responsible and the commercial pressure to maximize the bottom line – the two can go hand in hand. Some of the energy saving measures we have developed in our manufacturing units could be considered as industrial secrets as they sharpen
our competitive edge – but we do not keep them confidential. We call this ‘responsible competition’. Unlike strictly commercial compe-tition, where we not only want to be the leader but also to be as far ahead of our competitors as possible, in the field of energy savings we want to be the leader but also we want our competitors to be close behind us.
Innovating for energy-efficient productsThe semiconductor industry can play a key role in reducing energy consumption, both in terms of the energy used by the component and the energy-saving characteristics that the ST com-ponent brings to the final electronic appliance. For example, as part of our determination to be an undisputed leader in the area of power solutions, many of our products are dedicated to power management – from components in domestic electronic appliances like refrige-rators, televisions and washing machines to industrial power management, lighting and automotive applications. While our components are sold to be used in products that consume energy, very often ST technology makes a substantial difference by ensuring considerable reductions in overall
54
Produc t Responsibi l i t y I Respons ib le produc ts des ign
Working for an energy- efficient world
With the development of electronics and their inclusion in so much of the equipment we use in our personal or professional lives, energy efficiency is vitally important.

55
energy consumption. For example, almost anything that uses an electric motor, whether it is a refrigerator or a vacuum cleaner, can be made more efficient by accurate electronic control. The challenge is to make these electro-nic solutions competitive and easy to use, so that equipment manufacturers can build more environmentally responsible products without financial penalties.This means not only designing products that inherently reduce energy consumption but also supporting the customers with clear instruc-tions and guidance, encouraging them to take advantage of the energy-reducing potential of electronics solutions. For example, ST recently introduced a free library of motor control software for use with its low power STM32 microcontrollers.
WhereSTproductsplayakeyrole• Device consumptionPower MOSFET: the evolution from Power MESH (1996) to MDmesh (2005) meant a reduction of 82% in energy consumption of the device for the same function. Around 2 billion units are sold per year.• HomeappliancesWashing machines: new technology for motor control means a consumption reduction from 600kWh per year to 350kWh per year.Refrigerators: inverter driving and electronic thermostats provide an energy saving of 250kWh per year. If this were applied to all refrigerators in Europe, it would contribute to save the equivalent to 9,000GWh per year,
Some key figures (Source: Energy Information Administration)
World energy consumption is projected
to increase by 50% from 2005 to 2030
33% of energy consumption in 2004
was electrical energy
Energy consumption for lighting represents 19%of total electrical energy worldwide
55% of electrical energy is used in motors
corresponding to 5 million tons CO2 saved per year the same as 1 million cars each running 30,000km per year. Lighting (CFL): using electronic ballast for light bulbs reduces energy consumption by 80%.• CarsPower steering: electronic control replacing hydraulic pumps reduces fuel consumption by 0.17 liters per 100km.Fuel pumps: if electronic control replaces belt-driven systems, fuel consumption is 0.12 liter per 100km less.’Start and stop’ system: this helps save energy in urban cycles with a reduction of 15% in fuel consumption.• SolutionsforalternativeenergyThe increasing demand for alternative energy (such as solar and wind power), with high pres-sure on cost and efficiency, drives innovation in power electronics. In this field, we have started to develop new solutions to manage solar cells or wind turbines, including converters, rectifiers and microcontrollers.
Looking at the world’s figures on energy consumption we are really aware of the fact that there is room for improvement in this field and that by designing low power components we can significantly contribute to energy efficiency in appliances and equipment at home, at work and when traveling.
Two concrete examples presented at the ElectronicaExhibition,Munich,November2008
EfficientMaximumPowerPointTracking (MPPT)ST ’smonolithicMPPT,theenergyefficientlink between photovoltaic panels and thestringinverter,increasestheaverageefficiencyofphotovoltaicpanelsby3-6%,especially with partial shading (ST patents).
EfficientfuelmanagementST’spowertrainsolutionssignificantlycontribute to the reduction in fuel consumption(upto15%)infuelefficientvehicles’with32-bitmicrocontrollers,smartpower and PowerMOS families (the integra-tionofthisproductinitsfinalapplicationisacourtesyofValeo,France).
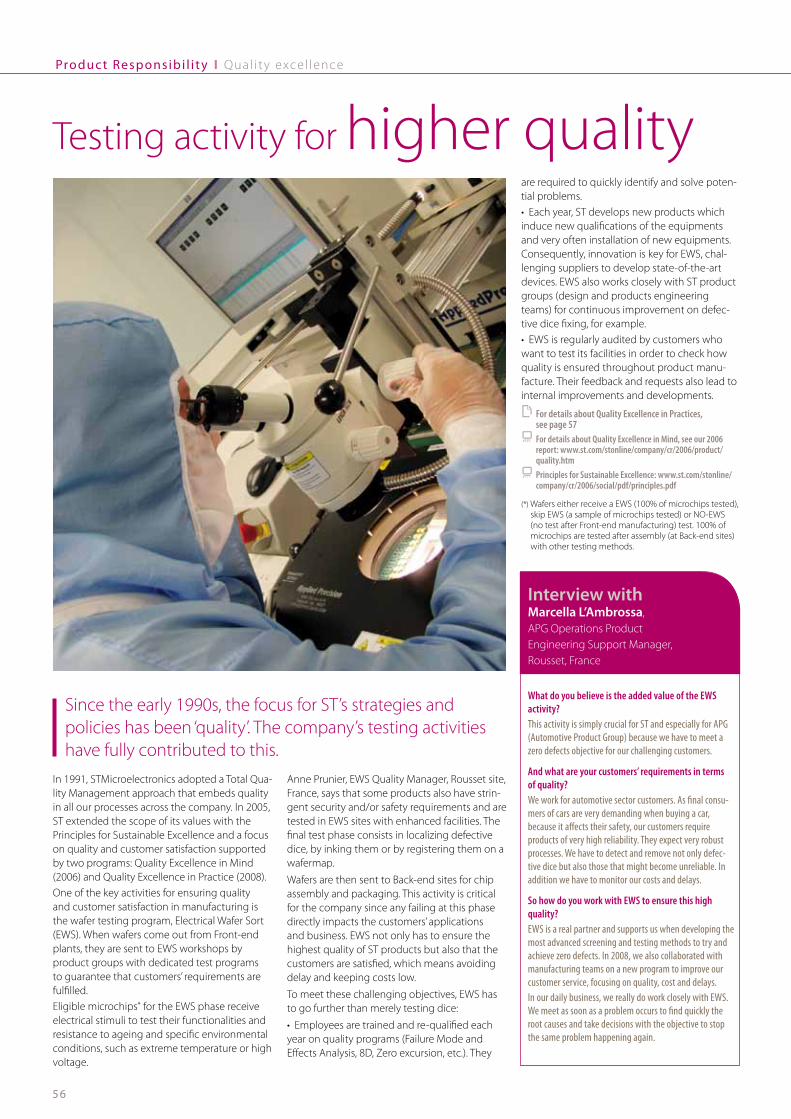
56
Produc t Responsibi l i t y I Qual i t y excel lence
In 1991, STMicroelectronics adopted a Total Qua-lity Management approach that embeds quality in all our processes across the company. In 2005, ST extended the scope of its values with the Principles for Sustainable Excellence and a focus on quality and customer satisfaction supported by two programs: Quality Excellence in Mind (2006) and Quality Excellence in Practice (2008).One of the key activities for ensuring quality and customer satisfaction in manufacturing is the wafer testing program, Electrical Wafer Sort (EWS). When wafers come out from Front-end plants, they are sent to EWS workshops by product groups with dedicated test programs to guarantee that customers’ requirements are fulfilled.Eligible microchips* for the EWS phase receive electrical stimuli to test their functionalities and resistance to ageing and specific environmental conditions, such as extreme temperature or high voltage.
Anne Prunier, EWS Quality Manager, Rousset site, France, says that some products also have strin-gent security and/or safety requirements and are tested in EWS sites with enhanced facilities. The final test phase consists in localizing defective dice, by inking them or by registering them on a wafermap.
Wafers are then sent to Back-end sites for chip assembly and packaging. This activity is critical for the company since any failing at this phase directly impacts the customers’ applications and business. EWS not only has to ensure the highest quality of ST products but also that the customers are satisfied, which means avoiding delay and keeping costs low.
To meet these challenging objectives, EWS has to go further than merely testing dice:
• Employeesaretrainedandre-qualifiedeachyear on quality programs (Failure Mode and Effects Analysis, 8D, Zero excursion, etc.). They
are required to quickly identify and solve poten-tial problems.• Eachyear,STdevelopsnewproductswhichinduce new qualifications of the equipments and very often installation of new equipments. Consequently, innovation is key for EWS, chal-lenging suppliers to develop state-of-the-art devices. EWS also works closely with ST product groups (design and products engineering teams) for continuous improvement on defec-tive dice fixing, for example. • EWSisregularlyauditedbycustomerswhowant to test its facilities in order to check how quality is ensured throughout product manu-facture. Their feedback and requests also lead to internal improvements and developments.
M For details about Quality Excellence in Practices, see page 57 5 For details about Quality Excellence in Mind, see our 2006 report: www.st.com/stonline/company/cr/2006/product/ quality.htm 5 Principles for Sustainable Excellence: www.st.com/stonline/ company/cr/2006/social/pdf/principles.pdf
(*) Wafers either receive a EWS (100% of microchips tested), skip EWS (a sample of microchips tested) or NO-EWS (no test after Front-end manufacturing) test. 100% of microchips are tested after assembly (at Back-end sites) with other testing methods.
Testing activity for higher quality
Since the early 1990s, the focus for ST’s strategies and policies has been ‘quality’. The company’s testing activities have fully contributed to this.
Interview with Marcella L’Ambrossa,APG Operations Product Engineering Support Manager, Rousset, France
What do you believe is the added value of the EWS activity?This activity is simply crucial for ST and especially for APG (Automotive Product Group) because we have to meet a zero defects objective for our challenging customers.
And what are your customers’ requirements in terms of quality?We work for automotive sector customers. As final consu-mers of cars are very demanding when buying a car, because it affects their safety, our customers require products of very high reliability. They expect very robust processes. We have to detect and remove not only defec-tive dice but also those that might become unreliable. In addition we have to monitor our costs and delays.
So how do you work with EWS to ensure this high quality?EWS is a real partner and supports us when developing the most advanced screening and testing methods to try and achieve zero defects. In 2008, we also collaborated with manufacturing teams on a new program to improve our customer service, focusing on quality, cost and delays. In our daily business, we really do work closely with EWS. We meet as soon as a problem occurs to find quickly the root causes and take decisions with the objective to stop the same problem happening again.

Product responsibility Performance overview 08
5757
Quality(baseline100in2004)lPR5l X STPR2l X STPR3l X STPR4lQ4’ 04 Q4’ 05 Q4’ 06 Q4’ 07 Q1' 08 Q2' 08 Q3' 08 Q4' 08
Customer complaints* 100 86.2 71.6 64.2 65.1 68.8 67.9 82.6
Cycle time to process failures analysis 100 72.7 62.6 71.9 74.0 67.9 64.2 62.2
Customer returns 100 41.1 38.3 40.0 28.6 21.1 26.3 33.7
QualityExcellenceThe Quality Excellence in Mind (QEM) program, completed in 2007, was launched to reinforce the engagement and commitment of ST people to excellence in product quality and custo-mer satisfaction. The objective was to get a breakthrough in ST quality levels, with the goal of reaching zero failures for our customers. The QEM program, and associated quality initiatives, helped us reduce customer returns by 30% and improve management commitment to quality, as perceived by employees in the employee engagement survey. In 2008, ST began a related campaign cal-led Quality Excellence in Practice (QEP). This program is designed to ensure that ST people have the required skills and knowledge about ST quality tools, methods and procedures and that they apply them with discipline in their daily jobs. The QEP program starts with an awareness session demonstrating the impact that ST tools, methods and procedures can have on customer satisfaction and ST’s profits. Each organization then nominates participants to attend specific eLearnings based on the key processes they must master in their job. Participants are then evaluated and receive certification in their area of competence.QEP will be extended more widely through ST in 2009 and more information on the program will follow next year.
Product StewardshipOur product stewardship focuses on three main categories: responsible environmental and social applications of our products, including in particular energy-saving* products and health; the chemical content of our products; and responsible military use of our products.
Products for Energy Saving I EN26 I EC2 I STPR1IThis is a field on which we have decided to focus from now on. Several internal studies and evaluations are on-going or should be launched soon to help us better identify where and how our products can contribute to the energy consumption reduction.We have already identified 4 fields on which semiconductor components could help: stand-by, lighting, electric engines, air conditioning and heating.For example, ‘Stand-by’ mode for domestic appliances has been identified as a high energy consumer where major reduction’s achie-vements could be reached with the help of semiconductor chips. Many of our products may help reduce residen-tial energy consumption.
ST is also developing: • productstoobtainthemaximumfromsolar energy such as components integrated in inverters to get higher efficiency in photovol- taic panels;• anhydrogenmicrofuelcellthatcanbeusedin portable equipment with the capacity to extend the operating time by five.M See more on pages 54-55(*) As we are currently working on a more accurate method to identify energy-saving features, this year again, we have decided not to publish the amount of our sales related to energy-saving devices.
Products for HealthThefirstLab-on-Chipforrapidmolecular flu detectionDuring 2008, ST and Veredus Laboratories an-nounced the commercial availability of VereFlu™, a portable Lab-on-Chip application for rapid detection of all major influenza types.VereFlu™ is a breakthrough molecular diagnostic test that can detect infection with high accuracy and sensitivity within two hours, providing genetic information of the infection that tradi-tionally would take days or weeks to learn. With its high level of automation, users outside the traditional lab environment can easily perform the tests where needed.Combining STs’ In-Check™ Lab-on-Chip platform with Veredus’ bioapplication capability, VereFlu is the first test available on the market that has integrated two powerful molecular biological applications in a Lab-on-Chip the size of a fin-gernail. It can identify and differentiate human strains of Influenza A and B viruses, including the Avian Flu strain H5N1, in a single test.
Furthering innovation in humanoid roboticsST and the Waseda University Humanoid Ro-botics Institute (HRI) in Japan, a global leader in state-of-the-art robotics research, announced in 2008 the development of a high-performance two-wheel inverted pendulum robot, furthering innovation in both humanoid robotics and medical research.ST and HRI are cooperating to use leading-edge semiconductor knowledge to promote the speedier development of innovative ‘humanoids’ and medical-care robotic systems, involving researchers and development engineers from both ST and HRI. ST will become a supplier to HRI for semiconductor products, while also providing HRI with leading-edge semiconductor prototypes on a cost-free basis. This will make it possible for HRI to conduct advanced evalua-tions of possible humanoid and medical-care robotic applications.
In addition, future cooperation between ST and HRI is expected to include the establishment of an ST-sponsored scholarship system for HRI students.
Military use of our productsSTMicroelectronic’s position on military use of its products is stated in our Code of Conduct, the Principles for Sustainable Excellence: “We will not sell products that we know are to be included in weapons.”To give some guidance, our Corporate Ethics Committee (CEC) published in 2007 a position paper on weapons detailing the definition of what we consider as a weapon and how we can check the end uses of our products. The com-mittee is aware that situations may be complex or sometimes very specific, and in case of doubt the CEC is available to provide advice, as was done twice in 2008.
Material declaration IPR1I STEV78 I STEV79 INew process for Materials Declaration in place. In 2008, to enhance customer satisfaction and support supply chain demand for environmen-tal, health and safety regulatory compliance and to achieve the standards our customers expect, STMicroelectronics defined appropriate responsibilities, tools and methods to provide customers with the full chemical composition of delivered products.ST decided to use the IPC 1752-2 Class 6 stan-dard to avoid multiple form filling and report management, so reducing time and costs. At each stage we took into consideration world-wide customer and stakeholder expectations.For each product group a Materials Declaration Champion has been assigned and trained to provide standard full and accurate chemical composition documents for our products.In order to ensure full document traceability and to organize worldwide data exchange, we developed a new documentation management system for our Materials Declaration process.
WEEE I EN27 IAsasupplierofcomponentstotheelec-tronics industry (and not manufacturers of electronicequipment),wearenotdirectlyaffected by the European Directive 2002/96/EC Waste of Electrical and Electronic Equipment(WEEE).
(*) The indicators related to customer complaints and returns are calculated as the ratio of the number of complaints or returns received during a period, to the quantities of products shipped or invoiced during the same period. However, the complaints or returns received are generally related to shipments made a few weeks or months before; as a consequence, when volumes shipped drop sharply (as it was the case at the end of 2008 due to the market crisis), this ratio increases significantly.
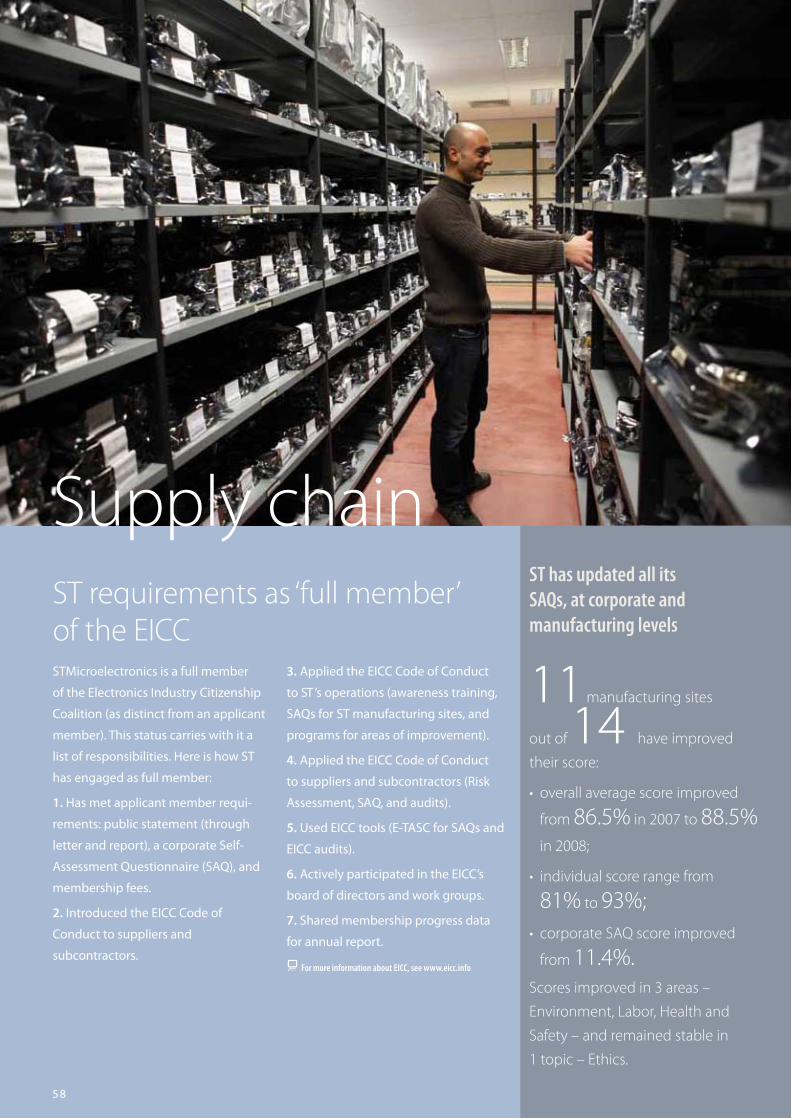
58
Produc t Responsibi l i t y I Ti t le heading
STMicroelectronics is a full member
of the Electronics Industry Citizenship
Coalition (as distinct from an applicant
member). This status carries with it a
list of responsibilities. Here is how ST
has engaged as full member:
1.Hasmetapplicantmemberrequi-
rements: public statement (through
letterandreport),acorporateSelf-
AssessmentQuestionnaire(SAQ),and
membership fees.
2. Introduced the EICC Code of
Conduct to suppliers and
subcontractors.
3. AppliedtheEICCCodeofConduct
toST ’soperations(awarenesstraining,
SAQsforSTmanufacturingsites,and
programs for areas of improvement).
4.AppliedtheEICCCodeofConduct
to suppliers and subcontractors (Risk
Assessment,SAQ,andaudits).
5.UsedEICCtools(E-TASCforSAQsand
EICC audits).
6.ActivelyparticipatedintheEICC’s
board of directors and work groups.
7. Shared membership progress data
for annual report.
5 For more information about EICC, see www.eicc.info
ST requirements as ‘full member’ of the EICC
ST has updated all its SAQs, at corporate and manufacturing levels
11 manufacturing sites
out of 14 have improved
their score:
• overallaveragescoreimproved
from 86.5% in 2007 to 88.5%
in 2008;
• individualscorerangefrom
81% to 93%;• corporateSAQscoreimproved
from 11.4%.Scores improved in 3 areas –
Environment, Labor, Health and
Safety – and remained stable in
1 topic – Ethics.
Supply chain

Suppl iers and subcontrac tors management I Supply chain
59
Our progress within the Electronics Industry Citizenship Coalition
ST decided to get involved in the Electronics Industry Citizenship Coalition (EICC) to participate to a standardized approach to Corporate Responsibility management within the electronic industry supply chain.
The EICC approach is composed of five steps: Phase 1: Code of Conduct introduction and Risk-Assessment level 1;Phase 2: Self-Assessment;Phase 3: validation through audit assessment and corrective action activities;Phase 4: reporting; Phase 5: sustaining engagement.
Since 2006, we have been implementing the EICC approach with our key material suppliers and subcontractors. Phases 1 and 2 are almost achieved. In 2008, we took the decision to move ahead and support these companies in phase 3.
M For details about where we and our suppliers and subcontrac- tors stand in the EICC program, see below and pages 62 and 63
In ST, the Corporate Responsibility department is responsible for deploying the EICC program. To manage the suppliers and subcontractors involvement in this initiative, it works in collaboration with the Purchasing and Sourcing department which has created a new central role in 2008 to manage the Quality and Sustainable Excellence programs.
This person has worked in close collaboration with the purchasing and outsourcing managers to prioritize the first companies to be contacted. A Self-Assessment Questionnaire package has been prepared that includes a process presentation, an official invitation letter from ST, a questionnaire and a connection to the online tool E-TASC.
In total, 17 suppliers and nine subcontractors have been contacted by ST with this package in order to subscribe to E-TASC. This web portal, accessible to electronic industry members, is a comprehensive device for a company to check its Corporate Responsibility performance and share its results with its customers upon request. A very comprehensive Self-Assessment Questionnaire (SAQ) has to be filled in online at central and local levels to assess their Ethical, Labour and Environment, Health and Safety management systems and practices.
A critical issue in this process is the fact that ST works with hundreds of suppliers and subcontractors and that the products we buy come from several of their manufacturing sites. This then requires the completion of many Self-Assessment questionnaires.
As we are among the first companies to launch this phase at the supply chain level, we decided to adopt a temperate approach. For the moment, our objective is to promote the EICC initiative rather than imposing it. Purchasing and Sourcing department managers have spent several months negotiating with each company to agree on subscribing to E-TASC and filling in the questionnaire for their main sites, and then to share their Corporate Responsibility perfomance. The spirit of the approach is to
explain that as it is an industry initiative, if they complete the SAQ once, they will be able to share their results with other customers that might be EICC members too.
In 2009, we will keep on inviting new companies to complete their SAQ and integrate these specific criteria in our suppliers /subcontractors performance evaluation tools (SPE).
In 2008, ST was among the very first companies to implement the EICC’s phase 3 validation process. After having filled in the Self-Assessment Questionnaire (SAQ) about our own sites in 2007, we have proposed to our key material suppliers and subcontractors that they do the same.
2005 ST becomes member of the EICC.ST adopts EICC’s Code of Conduct.
2006ST deploys the EICC compliant code within our Principles and training programs. ST starts to introduce the EICC Code of Conduct to key material suppliers and Back-end subcontractors. ST deploys an internal risk assessment*.
2007ST organizes a joint EICC audit at our Shenzhen site.ST is elected to the EICC board of directors.15 ST manufacturing sites complete EICC’s Self-Assessment Questionnaire.Our key material suppliers and Back-end subcontractors perform the risk assessment level 1.
2008ST starts inviting suppliers and Back-end subcontractors to join E-TASC and to perform online Self-Assessment Questionnaires.M For details on programs launched in 2008, see pages 62 and 63
ST sites update their results in E-TASCST invites local suppliers to join the EICC initiative.M For details, see page 58
ST introduces the EICC to our wider supply chain.
(*) Based on EICC methodology, we adapted a gap analysis to measure our internal risks.

60
Supply chain I Customer management
ST-NXP joint venture: ensuring robust supply chain processes
Both companies have agreed to maintain ST’s supply chain processes in the JV. ST has worked as a service supplier and dedicated a full-time team to ensure this integration happens smoothly.
A six-month preparation program has been undertaken to achieve a challenging target: that this huge change management be put in place within three days.
Several projects have been launched to cover all the program’s requirements, including:
• convertingoneNXPplanttoSTsystemsand processes; • recreatingtheportfolioofNXPproductsinto ST systems; • settingtheprocessforNXPplantstobecome JV subcontractors; and • trainingthenewmembersoftheJV’ssupply chain to use new processes and applications.
ST, NXP and the JV have been creating and establishing new roles. The JV will take the responsibility of developing a products portfolio, with manufacturing done at ST, NXP and the foundries, using services and supply chain applications from ST. This definition of roles was especially important for financial and corporate responsibility reporting reasons.
In the meantime, new ST-NXP customers were contacted to keep them up to date with the JV’s progress and on the specific changes that may affect them, such as sales contacts or products references and packaging. Sales departments have had special assistance in order to help them get ready for the JV’s full launch in 2009.
This JV will benefit customers as they will have just one contact for a larger range of products. And this will be further enhanced with the next step, the development of the ST-NXP/Ericsson Mobile Platforms JV.(*) Now STEricsson
The ST-NXP joint-venture (JV), created to be a leader in the Wireless and mobile-multimedia market, started its operations on 2 August 2008. ST has invested significantly so that the JV will be fully ready and self-directed by early 2009.
Interview with Jean-Philippe MartinCentral Service Manager, MMC*, Grenoble Site, France
Bosch and ST have implemented, in 2008, a new monitoring tool for Bosch and Blaupunkt locations to better follow ST’s service on a quarterly basis.
Each of the eight main Bosch plants in Europe collects data and Stefan Riwan, Business & Supply Chain Manager, Key Account Bosch Worldwide, consolidates the global results for ST.
ST and Bosch have developed a self-assessment question-naire with four criteria on which ST should communicate and improve its performance: • delivery reliability; • flexibility to Bosch’s orders’ variations; • logistics; • communication and cooperation.
The results are much appreciated and this action in line with ST’s continuous improvement process. The two particular focus points are, for now, delivery reliability and communication. Both topics are perceived by Bosch as areas to be improved by ST. In order to do this, a clear list of requirements and measures was set up and agreed with Bosch, and each quarter a clear improvement, measured in percentage points, is established.
ST provides products to Bosch for all aspects of the automo-tive market and for their integration in all relevant car elec-tronics modules, such as ABS/ESP, airbags, body electronics, motor-management systems and car infotainment.
Setting up quarterly monitoring with Bosch
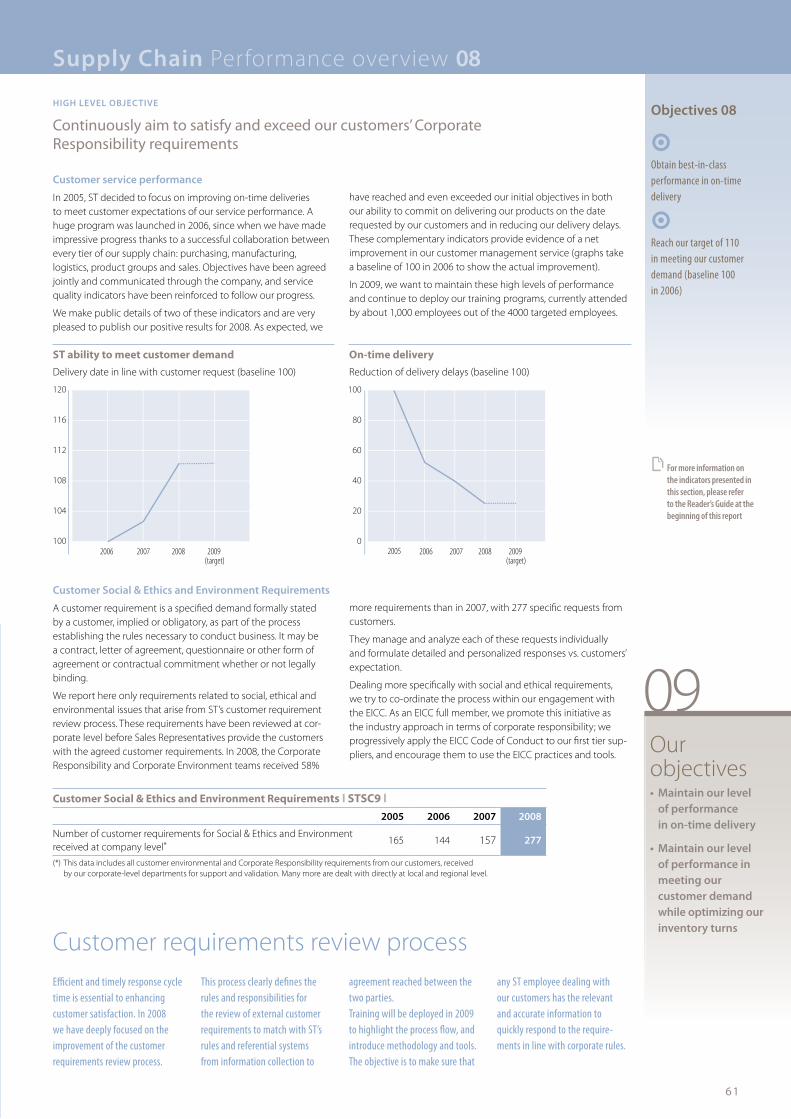
61
Supply Chain Performance overview 08Supply Chain Performance overview 08
Objectives 08
Obtain best-in-class performance in on-time delivery
Reach our target of 110 in meeting our customer demand (baseline 100 in 2006)
HIGH LEvEL OBJECtIvE
Continuously aim to satisfy and exceed our customers’ Corporate Responsibilityrequirements
CustomerSocial&EthicsandEnvironmentRequirements l STSC9 l2005 2006 2007 2008
Number of customer requirements for Social & Ethics and Environment received at company level*
165 144 157 277
(*) This data includes all customer environmental and Corporate Responsibility requirements from our customers, received by our corporate-level departments for support and validation. Many more are dealt with directly at local and regional level.
ST ability to meet customer demandDelivery date in line with customer request (baseline 100)
100
104
108
112
116
120
0
20
40
60
80
100
2009 (target)
200820072005 20062009 (target)
200820072006100
104
108
112
116
120
0
20
40
60
80
100
2009 (target)
200820072005 20062009 (target)
200820072006
On-time deliveryReduction of delivery delays (baseline 100)
• Maintain our level of performance in on-time delivery
• Maintain our level of performance in meeting our customer demand while optimizing our inventory turns
09
Customer Social & Ethics and Environment Requirements
A customer requirement is a specified demand formally stated by a customer, implied or obligatory, as part of the process establishing the rules necessary to conduct business. It may be a contract, letter of agreement, questionnaire or other form of agreement or contractual commitment whether or not legally binding.
We report here only requirements related to social, ethical and environmental issues that arise from ST’s customer requirement review process. These requirements have been reviewed at cor-porate level before Sales Representatives provide the customers with the agreed customer requirements. In 2008, the Corporate Responsibility and Corporate Environment teams received 58%
more requirements than in 2007, with 277 specific requests from customers.
They manage and analyze each of these requests individually and formulate detailed and personalized responses vs. customers’ expectation.
Dealing more specifically with social and ethical requirements, we try to co-ordinate the process within our engagement with the EICC. As an EICC full member, we promote this initiative as the industry approach in terms of corporate responsibility; we progressively apply the EICC Code of Conduct to our first tier sup-pliers, and encourage them to use the EICC practices and tools.
Customer service performance
In 2005, ST decided to focus on improving on-time deliveries to meet customer expectations of our service performance. A huge program was launched in 2006, since when we have made impressive progress thanks to a successful collaboration between every tier of our supply chain: purchasing, manufacturing, logistics, product groups and sales. Objectives have been agreed jointly and communicated through the company, and service quality indicators have been reinforced to follow our progress.
We make public details of two of these indicators and are very pleased to publish our positive results for 2008. As expected, we
have reached and even exceeded our initial objectives in both our ability to commit on delivering our products on the date requested by our customers and in reducing our delivery delays. These complementary indicators provide evidence of a net improvement in our customer management service (graphs take a baseline of 100 in 2006 to show the actual improvement).
In 2009, we want to maintain these high levels of performance and continue to deploy our training programs, currently attended by about 1,000 employees out of the 4000 targeted employees.
Our objectives
Efficient and timely response cycle time is essential to enhancing customer satisfaction. In 2008 we have deeply focused on the improvement of the customer requirements review process.
This process clearly defines the rules and responsibilities for the review of external customer requirements to match with ST’s rules and referential systems from information collection to
agreement reached between the two parties. Training will be deployed in 2009 to highlight the process flow, and introduce methodology and tools. The objective is to make sure that
any ST employee dealing with our customers has the relevant and accurate information to quickly respond to the require-ments in line with corporate rules.
Customer requirements review process
M For more information on the indicators presented in this section, please refer to the Reader’s Guide at the beginning of this report

62
Supply Chain Performance overview 08
Objectives 08
Support key corporate suppliers in preparing to comply with EU REACH program
Ensure 100% of our Back-end subcontractors are certified ISO 14001 and OHSAS 18001
Strongly encourage ST suppliers to be certified to OHSAS 18001
HIGH LEvEL OBJECtIvE
Achieveefficientandsociallyandenvironmentallybeneficialpartnershipswith our suppliers and subcontractors
Suppliers’ and subcontractors’ environmental performance l X STSC1 l STEV17 lNumber of suppliers/
sub-contractorsISO 14001 certified/ EMAS validated (%) Certification in progress (%)
2005 2006 2007 2008 2005 2006 2007 2008 2005 2006 2007 2008
Suppliers of materials 97 108 112 107 64 64 73 82 83.7 6 6 3 1.3
Suppliers of equipment 61 61 61 40 76 76 76 85 21 21 21 NA
total 158 169 173 147 68.6 74.1 79.9 84.1 11.8 11.4 9 1.3
Subcontractors Back-end NA NA 56 59 NA NA 91 97 NA NA 0 0
Subcontractors Front-end* NA NA 22 11 NA NA 100 100 NA NA 0 0
(*) Starting 2008, total Front-end subcontractors can change from one year to another, because to be reactive to market events, we implement the ‘active foundries’ concept. This list is updated each quarter using planning data.
Suppliers’ and subcontractors’ health and safety performance l STSC2 lNumber of suppliers/
sub-contractorsOHSAS
validated (%)Certification
in progress (%)
2007 2008 2007 2008 2007 2008
Suppliers of materials 112 107 30 37 NA NA
Suppliers of equipment/facilities 61 40 NA 6 NA NA
total 173 147 NA 28.6 NA NA
Subcontractors Back-end 56 59 80 92 0 0
Subcontractors Front-end* 22 11 95 82 0 0
(*) Starting 2008, total Front-end subcontractors can change from one year to another, because to be reactive to market events, we implement the ‘active foundries’ concept. This list is updated each quarter using planning data.
Chemicals managementA very important part of the 2008 Quality and Sustainable Excel-lence programs activities was dedicated to the reinforcement of the control of hazardous materials in our global supply chain.
A new release of our technical specification defining our requi-rements related to the control of hazardous materials – banned, restricted and declarable substances lists – was published in June 2008, and it has been successfully deployed to our partners for full integration and compliancy verification. At the end of 2008, 92% of our key material suppliers and 84% of our Back-end subcon-tractors had sent a complete answer to our requests.
M For more details on our hazardous substances management, see page 41
Registration, Evaluation, Authorisation and Restriction of Chemicals (REACH)Implementing the European REACH regulation on chemicals has required a major effort from our teams in order to secure the procurement of substances for our European sites. We have conti-nuously tracked our chemicals and articles suppliers in order to get a formal engagement to pre-register the relevant substances used in purchased materials.
All our Front-end and Back-end materials suppliers have been re-quested to carefully check their REACH registration requirements, and to send back all necessary documentations and evidence. By end of 2008, 96% of all ST suppliers had completed the documen-tation we requested. Extensive training has been introduced to educate our internal communities and partners about this very demanding European regulation.
M For more details, see page 41
Material declaration In 2008, ST adopted the IPC 1752 Standard for Material Decla-ration. In addition to the internal program described page 41, we took the decision to extend this initiative to our Back-end subcontractors. Thanks to the collaboration of our key Back-end subcontractors, 1200 materials declarations forms have been completed. This will help our products divisions and sales depart-ments to better serve our customers.
CertificationsST supports its suppliers and subcontractors through its SPE (supplier/subcontractor performance evaluation) when EMAS, ISO14001 or OHSAS 18001 certified.
At the end of 2008, 84% of our materials suppliers were EMAS or ISO 14001 certified and 37% OHSAS certified.
In 2008, we reconsidered the number of equipment suppliers. Our target decreased from 61 to 40 due to mergers among our suppliers and because we decided to include only key suppliers.
In 2008, 85% were ISO14001 certified and 6% OHSAS 18001. Our Front-end and Back-end subcontractors have also largely adopted the ISO 14001 standards (100% and 97% respectively) and the OHSAS 18001 (82% and 92%).
09Our objectives• Suppliers and Back- end subcontractors’ compliance to new St hazardous mate- rials requirements (target 80%)
• Keep on encouraging our suppliers and subcontractors (Front-end, Back-end) to be certified ISO 14001 and OHSAS 18001

63
Suppliers’ and subcontractors’ compliance with EICC
target Number Agreement to
comply with EICC (%)
EICC Risk- Assessment
1 performed (%)
EICC Self-Assess-ment questionnaire
completed**
EICC Audit process launched
Key suppliers checked against
EICC
2007 2008 2007 2008 2007 2008 2007 2008 2007 2008 2007 2008
Suppliers of materials 117 108 52 81.5 100 100 0 18 0 0 100 100
Suppliers of equipment/facilities/IT NA 104 NA 34 NA 34 NA 0 NA 0 NA 100
Subcontractors Back-end 28 40 69 97 100 100 0 11 0 0 0 100
Subcontractors Front-end* 22 11 0 86.4 0 100 0 0 0 0 0 0
Objectives 08
Obtain completion of the EICC Self-Assessment Ques-tionnaire by the 15 highest risk key suppliers
Start the EICC audit process on the two highest risk suppliers
Deploy the EICC supplier engagement model to local suppliers
Obtain commitment to EICC from key Front-end subcontractors
Perform EICC Risk-Assess-ment level 1 on key Front-end subcontractors
Ensure 30 highest risk Back-end subcontractors perform EICC Self-Assessment Questionnaire
Start the EICC audit process on the three highest risk Back-end subcontractors
Implement the subcontrac-tor performance evaluation tool, including EICC criteria (for Back-end subcontrac-tors)
HIGH LEvEL OBJECtIvE
ActivelycontributetotheEICCinitiativebysupportingsuppliersandsubcontractors in reaching compliance
(*) Starting 2008, total Front-end subcontractors can change from one year to another, because to be reactive to market events, we implement the ‘active foundries’ concept. This list is updated each quarter using planning data.(**) The number of SAQs is not the number of suppliers/subcontractors that have filled in SAQs. One supplier or subcontractor has to fill in one company level SAQ and SAQs for all their manufacturing sites that produce materials, equipment or products for ST.
Our road-map to comply with the EICC program involves key materials and equipments suppliers, Front-end and Back-end subcontractors and local suppliers.
108 material suppliers were asked to comply with the EICC Code of Conduct and 81.5% signed the code (an increase of 56.7% com-pared to 2007). The process was launched in 2008 for Front-end subcontractors, inducing hard work to include EICC phases in ST processes. We were pleased to obtain an engagement of 86.4%. The Back-end subcontractors’ engagement also increased since 2007 (up to 40.5%).
We started to invite our equipment, facilities and IT suppliers to join this initiative in October 2008 and we are pleased to see that 34% already agreed to comply with the EICC by the end of the year.
Local suppliers have also been invited to adopt the EICC code (see below).
In 2008, we completed the second phase of the EICC program, the Risk-Assessment, for all our material suppliers, and Back-end and Front-end subcontractors. The local suppliers and the equipment makers were invited to perform this step at the end of 2008 and to comply with the EICC Code of Conduct.
The third step, EICC’s Self-Assessment questionnaire (SAQ), was launched in 2008 with a selection of materials suppliers and Back-end subcontractors. Significant effort was necessary to achieve the completion of 29 SAQs by the end of the year.
In 2009 we will extend our invitation to join this program to more companies. The audit step has been postponed this year because we focused on the SAQ process with the suppliers/subcontractors and we wish to perform the audits based on the analysis of these results.
M Reference: for more details about the SAQ, see page 59
By the end of 2008, the Quality and Sustainable Excellence mana-ger supported the sites to prepare an EICC package to be sent to their local suppliers.
The first step was to translate the EICC Code of Conduct in French and Italian, complementing the versions already available in English, Chinese, Spanish and
Japanese. These translations had been approved by the EICC board before the full packages were launched on site. The packages included the EICC Code of Conduct, an engagement letter and the Risk-Assessment level one.
The program is now under deve-lopment, focusing on each site’s top 30 local suppliers.
09Our objectives
• Double the number of SAQs completed
• Obtain completion of SAQs by additional ten Back-end subcontractors and the two major Front-end subcontractors
• Launch one or two EICC audits
• Extend the agreement to comply with EICC for material suppliers (target 85%) and equipment suppliers (target 50%)
• Obtain commitment to the EICC from our Front-end newcomers subcontractors
• Deploy the EICC supplier engagement model with logistic suppliers
• Invite suppliers and subcontractors (Front-end, and Back-end) to the EICC Shenzhen supplier membership event
• Launch a training for internal departments to reinforce knowledge on requirements
• Progressively integrate additional EHS indicators in the supply chain evaluation based on customers’ needs
• Integrate EICC criteria in the evaluation process (score card) for Front-end subcontractors
Extending the EICC campaign to local suppliers
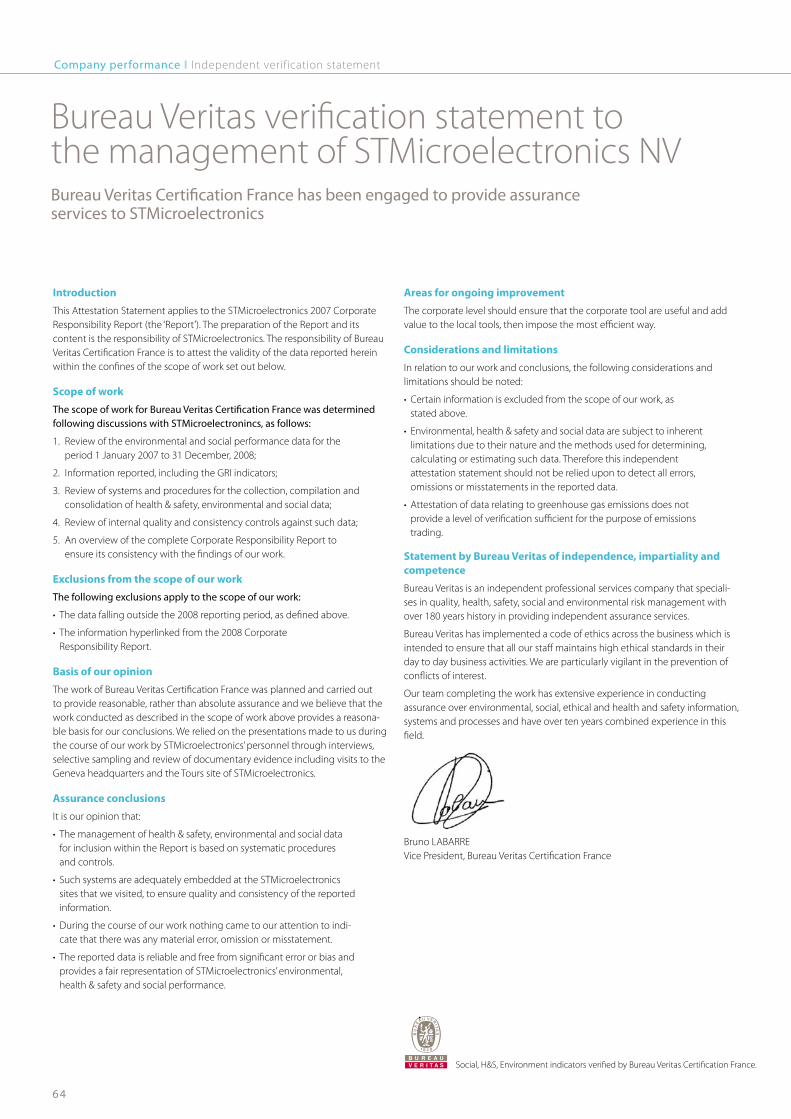
Company performance I Independent verification statement
64
Bureau Veritas verification statement to the management of STMicroelectronics NVBureauVeritasCertificationFrancehasbeenengagedtoprovideassurance services to STMicroelectronics
Introduction
This Attestation Statement applies to the STMicroelectronics 2007 Corporate Responsibility Report (the ‘Report’). The preparation of the Report and its content is the responsibility of STMicroelectronics. The responsibility of Bureau Veritas Certification France is to attest the validity of the data reported herein within the confines of the scope of work set out below.
Scope of work
ThescopeofworkforBureauVeritasCertificationFrancewasdeterminedfollowingdiscussionswithSTMicroelectronincs,asfollows:
1. Review of the environmental and social performance data for the period 1 January 2007 to 31 December, 2008;
2. Information reported, including the GRI indicators;
3. Review of systems and procedures for the collection, compilation and consolidation of health & safety, environmental and social data;
4. Review of internal quality and consistency controls against such data;
5. An overview of the complete Corporate Responsibility Report to ensure its consistency with the findings of our work.
Exclusions from the scope of our work
The following exclusions apply to the scope of our work:
• Thedatafallingoutsidethe2008reportingperiod,asdefinedabove.
• Theinformationhyperlinkedfromthe2008Corporate Responsibility Report.
Basis of our opinion
The work of Bureau Veritas Certification France was planned and carried out to provide reasonable, rather than absolute assurance and we believe that the work conducted as described in the scope of work above provides a reasona-ble basis for our conclusions. We relied on the presentations made to us during the course of our work by STMicroelectronics’ personnel through interviews, selective sampling and review of documentary evidence including visits to the Geneva headquarters and the Tours site of STMicroelectronics.
Assurance conclusions
It is our opinion that:
• Themanagementofhealth&safety,environmentalandsocialdata for inclusion within the Report is based on systematic procedures and controls.
• SuchsystemsareadequatelyembeddedattheSTMicroelectronics sites that we visited, to ensure quality and consistency of the reported information.
• Duringthecourseofourworknothingcametoourattentiontoindi- cate that there was any material error, omission or misstatement.
• Thereporteddataisreliableandfreefromsignificanterrororbiasand provides a fair representation of STMicroelectronics’ environmental, health & safety and social performance.
Areas for ongoing improvement
The corporate level should ensure that the corporate tool are useful and add value to the local tools, then impose the most efficient way.
Considerations and limitations
In relation to our work and conclusions, the following considerations and limitations should be noted:
• Certaininformationisexcludedfromthescopeofourwork,as stated above.
• Environmental,health&safetyandsocialdataaresubjecttoinherent limitations due to their nature and the methods used for determining, calculating or estimating such data. Therefore this independent attestation statement should not be relied upon to detect all errors, omissions or misstatements in the reported data.
• Attestationofdatarelatingtogreenhousegasemissionsdoesnot provide a level of verification sufficient for the purpose of emissions trading.
Statement by Bureau Veritas of independence, impartiality and competence
Bureau Veritas is an independent professional services company that speciali-ses in quality, health, safety, social and environmental risk management with over 180 years history in providing independent assurance services.
Bureau Veritas has implemented a code of ethics across the business which is intended to ensure that all our staff maintains high ethical standards in their day to day business activities. We are particularly vigilant in the prevention of conflicts of interest.
Our team completing the work has extensive experience in conducting assurance over environmental, social, ethical and health and safety information, systems and processes and have over ten years combined experience in this field.
Bruno LABARRE Vice President, Bureau Veritas Certification France
Social, H&S, Environment indicators verified by Bureau Veritas Certification France.
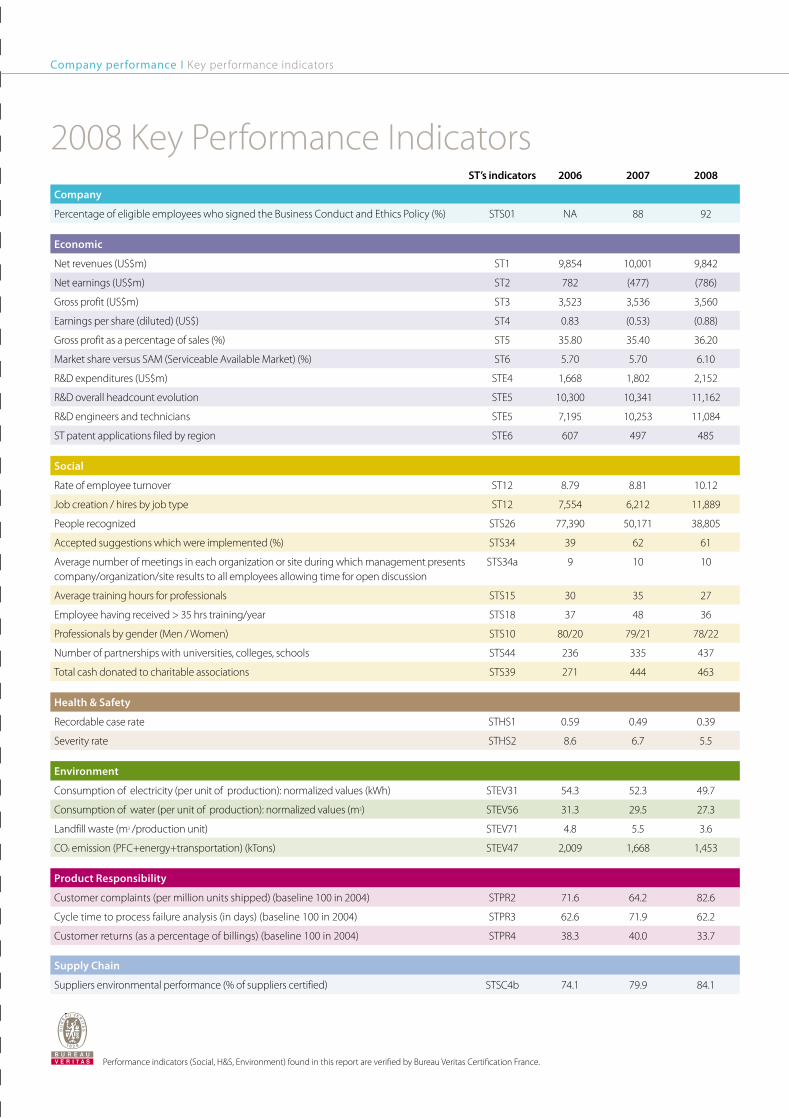
This index shows where to find full or partial information relating to the Global Reporting Initiative (GRI) core elements and indicators in this report. GRIindicatorsareshowninthecolorofthesectioninwhichtheybelong.ThisindexalsoshowswheretofindinformationrelatingtoST’sownperformanceindicators.Theseareallprefixed‘ST’andshowninblackprint. ST has identified a number of Key Performance Indicators (KPIs), which are shown as X. All KPIs have been verified and validated by Bureau Veritas Certification, France.
Information about the Global Compact principles can be found in the html version of this report.
Performanceindicators(Social,H&S,Environment)foundinthisreportareverifiedbyBureauVeritasCertificationFrance.
2008 Key Performance IndicatorsST’s indicators 2006 2007 2008
Company
PercentageofeligibleemployeeswhosignedtheBusinessConductandEthicsPolicy(%) STS01 NA 88 92
Economic
Netrevenues(US$m) ST1 9,854 10,001 9,842
Netearnings(US$m) ST2 782 (477) (786)
Grossprofit(US$m) ST3 3,523 3,536 3,560
Earningspershare(diluted)(US$) ST4 0.83 (0.53) (0.88)
Gross profit as a percentage of sales (%) ST5 35.80 35.40 36.20
Market share versus SAM (Serviceable Available Market) (%) ST6 5.70 5.70 6.10
R&Dexpenditures(US$m) STE4 1,668 1,802 2,152
R&D overall headcount evolution STE5 10,300 10,341 11,162
R&D engineers and technicians STE5 7,195 10,253 11,084
ST patent applications filed by region STE6 607 497 485
Social
Rate of employee turnover ST12 8.79 8.81 10.12
Job creation / hires by job type ST12 7,554 6,212 11,889
People recognized STS26 77,390 50,171 38,805
Accepted suggestions which were implemented (%) STS34 39 62 61
Average number of meetings in each organization or site during which management presents company/organization/site results to all employees allowing time for open discussion
STS34a 9 10 10
Average training hours for professionals STS15 30 35 27
Employeehavingreceived>35hrstraining/year STS18 37 48 36
Professionals by gender (Men / Women) STS10 80/20 79/21 78/22
Number of partnerships with universities, colleges, schools STS44 236 335 437
Total cash donated to charitable associations STS39 271 444 463
Health & Safety
Recordable case rate STHS1 0.59 0.49 0.39
Severity rate STHS2 8.6 6.7 5.5
Environment
Consumption of electricity (per unit of production): normalized values (kWh) STEV31 54.3 52.3 49.7
Consumption of water (per unit of production): normalized values (m3) STEV56 31.3 29.5 27.3
Landfillwaste(m3 /production unit) STEV71 4.8 5.5 3.6
CO² emission (PFC+energy+transportation) (kTons) STEV47 2,009 1,668 1,453
Product Responsibility
Customer complaints (per million units shipped) (baseline 100 in 2004) STPR2 71.6 64.2 82.6
Cycle time to process failure analysis (in days) (baseline 100 in 2004) STPR3 62.6 71.9 62.2
Customer returns (as a percentage of billings) (baseline 100 in 2004) STPR4 38.3 40.0 33.7
Supply Chain
Suppliers environmental performance (% of suppliers certified) STSC4b 74.1 79.9 84.1
Indicator reference Content PagesCompany1.1 Chief executive statement 3, 4
1.2 Key impacts, risks and opportunities 3, 4, 5, 9
2 Organizational profile Reader’sguide,1,11,18, 24-25,30,35,41,43
3.1-3.4 Report profile Reader’sguide
3.5-3.11 Report scope and boundary Reader’sguide,insidefrontcover, 1, 4-5, 18-21, 22-24, 30-35, 46-51, 57, 61-63
3.12 GRI content index Inside flap
3.13 Assurance 64
4.1-4.3, 4.6, 4.8, 4.9 Governance 10-13, 58
4.12-4.13 Commitments to external initiatives 5, 58
4.14-4.17 Stakeholder engagement Reader’sguide,4-5,16, 28-29, 58-63
S01 Community 24-25, 28-29, 35, 39, 47
S02, S03, S04, HR4, X STS01 Corruption 10-13
S05, SO8, HR3 Public Policy and compliance 26-27, 36, 58-59, 63
EconomicEC1, STE7, STE8, STE9, STE11 Economicperformance 19-20, 37
EC2 Financial implication and other risks and opportunities due to climate change
46, 52-53, 57
EC6, X STE1, STE10 Market presence 20, 59, 62-63,
EC8, EC9, X STS39, STS39a, STS43 Indirect economic impacts 15, 20, 28-29, 37
STE3, X STS44, X STE4, X STE5, X STE6 Sustainable Innovation 21, 35
SocialLA1, LA2, ST12, STS6 Employment 31
LA4, STHR4, STHR5, STHR6, X STS36, STHR7, X STS34a, STS38 Laborandmanagementrelations 34
LA6, LA7, LA8, X STHS1, X STHS2, STH6, STHS 11, STHS12, STSHS13, STEV67, STEV68, j 9.1, 9.3
Occupational Health & Safety 37-39
LA10, LA11, LA12, X STS15, STS16, STS17, X STS18, STS21a, STS21b TrainingandEducation 23, 25, 33
X STS26, STS28, X STS28a, STS28b, X STS34, STS47 Employeeempowermentandengagement 32
LA13, STS8, STS9, X STS10, STS11, STS12, STS12a, STS12b Diversityandequalopportunity 31
EnvironmentEN1, EN3, EN4, EN5, EN7, EN8, EN10, EN30, STEV6, STEV8, X STEV31,STEV35, STEV37, X STEV56, STEV58, STEV64, j 2.1, 2.2, 2.3, 3.1, 5.1
Material, energy, water; expenditure and investment
42-43, 44-45, 46-51
EN12, EN16, EN17, EN18, EN19, EN20, EN21, EN22, EN23, EN24, EN28, EN29, EN30, STEV19, STEV21, STEV27, STEV40 STEV46, X STEV47, STEV48, STEV52, X STEV71, STEV72, j 3.3, 3.4, 4.1, 4.3, 4.4, 8.1, 10.3, 10.4
Emissions,effluentsandwaste;Compliance;Transport
44-45, 46, 48-51
EN6, EN26, STPR1 Products and service 41, 54-55, 57
Product ResponsibilityEN27, PR1, PR3, PR5, STEV78, STEV79, X STPR2, X STPR3, X STPR4 Customer Health & Safety; product and
service labeling41, 57, 60, 62
Supply chainHR2, X STSC1, STSC2, STSC9 Supply chain management 61-63
This report is in accordance with the 2006 Global Reporting Initiative (GRI) G3 Guidelines, with an A+ self-declared rating checked and confirmed by GRI.
supply chain
Change in ST scope
in 2008
MarchSTMicroelectronics, Intel and Francisco Partners create Numonyx in Flash memory segment.
Number of ST employees involved: 4,132 Countries where employees are based: Italy, Singapore and Malaysia
Final application of our products
Communication
Computer
JanuarySTacquiresGenesisMicrochip,strengtheningitsposition as a semiconductor technology leader in the consumer electronics market.
Number of Genesis employees involved: 663
Countries where employees are based: US,Canada,India,Singapore,China,Korea,Taiwan, Japan
JulySTMicroelectronics and NXP merge wireless businesses to expand product breadth and boost innovation.
Number of ST employees involved: 2,681
Countries where employees are based: Belgium, Brazil, Canada, China, Czech Republic, Finland, France, Germany, India, Ireland, Italy, Japan, Korea, Malaysia, Mexico, Morocco, Netherlands, Norway, Philippines, Portugal, Singapore, Sweden, Switzerland, Taiwan,Turkey,UKandUSA
Silicon ingot
Assembly & test
ChipWafer processing
SuppliersManufacturing Front-end
R&D Conception Design
Assembly line & final test Back-end
Business customer
We have built strong partnerships with many suppliers and subcontractors from whom we purchase raw materials,equipment,energy, gas, chemicals and services.
New products conception is the result of several steps, the design of the architecture and electrical layout, electrical and logical simulations, drawing of components and generation of reticles (circuit drawings).
The manufacturing of chips is a process of around 400 separate stages in several workshops. Starting with a plain silicon wafer, the Front-end manufacturing results in the etching of several hundreds to thousands dice, depending on the end product and the used technology.
The dice are cut from the silicon wafer before being assembled in a package. The chips are then tested prior to delivery to the customer.
how do we create a chip
Maskcreation
Weofferabroadrange of products and we serve a wide range of custo-mers that are leading companies in the fields of communications, consumer goods, automobile manufacture, computers and other industry sectors.
ST R&D and Manufacturing
Consumer
Automotive
Industriel
ST’s sales are well balanced between the industry’s five major high-growth sectors:
Company performance I Key performance indicators Company performance I Indicator index
5 The html Indicator Index gives more detailed information with: •additionalreferencestotheseindicators(htmlreport,20-F,www.st.com) •referencestoadditionalSTandGRIindicators •explanationwhenGRIindicatorsarenotreportedon.
5 FormoreinformationontheGRIApplicationlevels,see:www.globalreporting.org/ GRIReports/ApplicationLevels/

Indicators and use of symbolsWhere relevant, we have used our own company indicators to give a complete and accurate picture of our performance. These are all prefixed “ST”. Also, we have identified a number of Key Performance Indicators (KPIs), which are shown as X.
A detailed table on the inside back cover page provides a summary of the results of all KPIs for the current year.
We have used a few symbols to illustrate:
• thelevelofachievementof our objectives
In progress
Target achieved
No progress
High level objectives are all spe-cified on page 4 and are detailed in sub-level objectives in each section of the report;
• referencestotheweb5• referencestoanotherpagein the report itself M• referencestoourEnvironment, Health and Safety Decalogue j
The ST Corporate Responsibility Report 2008 is printed on paper produced by factories whose environmental management system is ISO 14001 certified.The paper used is entirely chlorine free, and the high recyclability and renewability of the raw material, together with production processes, are optimized for maximum reduction of impact on the environment.
Furthermore the paper used is certified with the ProgramofEndorsementforForestCertification(PEFC),meaningthatthewoodusedtoproduceit (minimum 30%) has come from forests that are well managed according to strict environmental, social and economic standards. The forests of origin have been independently inspected and evaluated according to the principles and criteria that have been agreedandapprovedbyPEFC.
This book is printed on Creator Silk 350g/m2
(cover pages) and 135g/m2 (inside pages) IQnet and AEONOR certify that the organisation Torraspapel, S.A. (Motril) as implemented and maintains an ISO 14001 Environmental Management System.
Certificate Chain of custody of forest Based products N°: PEFC/14-33-00002-B www.pefc.org
APG Automotive Product GroupAPM Analog,PowerandMEMSASD Application Specific DiscreteASIC Application Specific Integrated CircuitbeStick Internal self-assessment toolCCI Computer & Communication InfrastructureCDP Cassa Depositi e PrestitiCEA Commissariatàl’EnergieAtomiqueCEC CorporateEthicsCommitteeCEO ChiefExecutiveOfficerCMOS Complementary MOS (Metal Oxide Semiconductor)CMR Carcinogenic, Mutagenic, toxic for ReproductionCOD Chemical Oxygen DemandCOO ChiefOperatingOfficerCPG Computer Peripherals GroupCR Corporate ResponsibilityCVD-PVD Chemical Vapor Deposition-Physical Vapor DepositionDART Days Away from work, job Restriction, job TransferDNA Deoxyribonucleic acidEcopack® Lead-freelabellingforRoHS- compliance(theEUDirectiveon RestrictiononUseofHazardous Substances)EFQM EuropeanFoundationofQuality ManagementEFTA EuropeanFreeTradeAssociationEICC ElectronicsIndustryCodeofConductEHS Environmental,Health&SafetyEMAS CommunityEco-Managementand Audit SchemeEMS ElectronicManufacturingServices providersePA Online performance appraisal toolEWS ElectricalWaferSortGeSI Global e-Sustainability InitiativeGHG Greenhouse GasesGRI Global Reporting InitiativeHED HomeEntertainment&DisplayHPC Home, Personal and Communication (ST Product Group)HR Human ResourcesH&S Health & SafetyIC Integrated CircuitICB Informatics & Computer BasicsICT Information and Communication- TechnologiesILO InternationalLaborOrganizationIMS Industrial & Multisegment SectorIn-Check™ STLab-on-ChipplatformIP Intellectual PropertyIPAD Integrated Passive and Active DevicesISO International Organization for StandardizationKPI Key Performance IndicatorLOP LocalOperatingProceduresMEMS Micro-Electro-MechanicalSystems
MMS Microcontrolers, Memories & SmartcardsMOSFET MetalOxideSemiconductorField EffectTransistorMPG Memory Products GroupMTCE MetricTonsofCarbonEquivalentNAND Not AndNGO Non-Governmental OrganizationNOR Not OrNOX Nitrogen OxidesODM Original Design ManufacturersODS Ozone depleting SubstancesOEM OriginalEquipmentManufacturersOHS Occupational Health & SafetyOHSAS Occupational Health & Safety Assessment Series (OHSAS 18001)OSHA Occupational Safety & Health AdministrationintheUnitedStatesPFCs Perfluorinated CompoundsPFOs Perfluoro-octane SulfonateR&D Research & DevelopmentR11 ChloroFluoroCarbon (CFC) and is also called CFC 11. It is an Ozone Depleting Substance. Its chemical name is Trichlorofluoromethane.RC Recordable case rateREACH Registration,Evaluationand Authorization of ChemicalsRoHS Restriction of Hazardous SubstancesSAM Serviceable Available MarketSE SustainableExcellenceSIA Semiconductor Industry AssociationSoC System-on-ChipSOP Standard Operating ProceduresSOX Sulfur OxidesSR Severity RateSRI Socially Responsible InvestmentSTU STUniversityTCE TonsofCarbonEquivalentTQM TotalQualityManagementUSAs UnvestedStockAwardsUSGAAP USGenerallyAcceptedAccounting PrinciplesUWEEI UnitedWorkersofElectronicand ElectricalIndustriesVOCs Volatile Organic CompoundsWBCSC World Business Council for Sustainable DevelopmentWEEE WasteofElectricalandElectronic EquipmentWSC World Semiconductor Council20-F Annual report filed with the SecuritiesandExchangeCommission
GRI indicator prefixesEC EconomicImpactEN EnvironmentHR Human RightsLA EmploymentPR Product ResponsibilitySO Society
ST indicator prefixesST CompanySTE EconomicsSTEV EnvironmentSTHR Human RightsSTHS Health & SafetySTS SocialSTSC Supply ChainSTSO CompanySTPR Product Responsibility
Reader’sguideReader’sguideGlossary
Report scope and profileThis is a report of how responsibly we have performed as a company in the calendar year 2008.ItcoversallSTMicroelectronicsNV’sactivitiesandsites,unlessotherwisestated.YoucanfinddetailsaboutST’s structure and countries of operation in the chart on page 1. For other information you can access reports from previous years at http://www.st.com/stonline/company/cr/reports/index.htm.ThenameofourglobalorganizationhaschangedfromTotalQualityandCorporateResponsibility(TQCR)toQuality,EducationandSustainableDevelopment(QES).TheCorporateResponsibilitydepartmentispartofthisorganization.
AccessibilityThis printed Corporate Responsibility Report details STMicroelectronics Corporate Responsibility performance and shows how ourcompanyintegratesSustainableExcellenceinitsstrategyanddailyactivity.As with previous reports, we have presented some concrete examples from sites, regions, product groups and central organiza-tions to illustrate not just our performance but also the challenges we face, and the growing company-wide awareness of corporate responsibility this reflects.These lessons and experience gained from these examples are relevant not just to the sole country or site explicitly detailed. Often, there is a company strategy and each year, we select some specific examples to illustrate it and involve ST sites and organizations. ThereportispublishedinEnglishonly.This report is printed and is also accessible on the web and can be downloaded in PDF format at http://www.st.com/stonline/company/cr/reports/index.htm. Our website has been significantly updated, providing new information about our Corporate Responsibility strategy and performance.
MaterialityIn order to define material issues of most relevance and interest for our audience, for the past two years we have organized specific sessions to get feedback from our stakeholders:• wetookintoaccountspontaneousfeedback(email,webrequests);• weorganized11phoneinterviewswithexternalstakeholders(includingcustomers,businesspartners,academics, SRI analysts, government, the Corporate Responsibility community and major companies); • wehaveconductedregularfollow-upsessionsonrulesandregulations;• wehaveconductedhigh-levelbenchmarking;• wehaveinterviewedST’sVicePresidentsinvolvedinthekeyissueslinkedtoSustainableExcellence;• wehavelaunchedasuccessfulinternalsurvey,witharound228managersgivingustheirfeedback;• wehavekepttrackof,andtriedtoanticipate,therulesandregulationsbeingputinplaceatworldwidelevel.For more clarity, we have decided to publish a special focus to show how we have defined our material issues (pages 4 and 5).
We are aware that the Disclosure on Management Approach for each section is very important to help you understand how we manage material issues and potential risks. As our management approach is very stable and does not need an annual update, we have decided to publish it, in some detail, on the web only. 5 See more on www.st.com/stonline/company/sd/index.htm
AssuranceAsinpreviousyears,BureauVeritasCertificationhasprovidedassuranceservicestous,includingverifyingallourSocial,Envi-ronment Health and Safety indicators.Auditing by Bureau Veritas Certification takes place at two levels in the company. First, the auditing team verifies data collection andconsolidationprocessesbycheckingcorporateleveldata.Secondthesefiguresareverifiedatagivenlocalsite.Eachyearwechooseadifferentsite,andin2008theTourssite,France,wasaudited.This is a good method for us to check the relevancy and accuracy of processes in place and so to guarantee data integrity.
M You can find details of our verification processes on page 64
Adherence to GRI and the UN Global CompactThis report is prepared and presented in accordance with the 2006 Global Reporting (GRI) G3 Guidelines, with an A+ self-declared rating checked and confirmed by GRI. If G3 indicators are not applicable or relevant to us we explain why we do not report on them either in the text and/or in the indicator index in the html version of this report. We use our
ownindicatorstorespondtoortosupplementGRIindicators(seebelow).WealsoendorsetheprinciplesoftheUnitedNationsGlobal Compact. This report describes actions we have taken to implement these principles, and serves as our Communication on Progress.On the back cover flap, there is an index that links GRI, Global Compact and ST indicators to related information in this report.
Give us your feedbackWe are committed to improving both our Corporate Responsibi-lity Performance and the ways we communicate with our stakeholders. We encourage contributions and debate from all stakeholders and welcome feedback on the content and presentation of this report – as well as suggestions for next year.
In order to get your feedback, we have developed an online form, available at http://www.st.com/stonline/company/sd/contact.htm, please do not hesitate to use this for any comments.
Of course, you can also contact us directly at [email protected] or contact:
Kate Rigge
STMicroelectronics CorporateHeadquarters 39, Chemin du Champ-des-Filles – C.P. 21 CH-1228Geneva–Plan-Les-Ouates Switzerland
STMicroelectronics
Corporate Responsibility Report A culture of Sustainable Excellence
STM
icro
elec
tron
ics
Corp
orat
e Re
spon
sibi
lity
Repo
rt 2
008
A C
ultu
re o
f Sus
tain
able
Exc
elle
nce
Report on:1.1 2.1 - 2.103.1 - 3.8, 3.10 - 3.124.1 - 4.4, 4.14 - 4.15
Report on criteria listed for Level C plus: 1.23,9, 3,134.5 - 4.13, 4.16 - 4.17
Same as requirement for Level B
Not Required Management Approach Disclosures for each Indicator Category
Management Approach Disclosures for each Indicator Category
Report on a minimum of 10 Performance Indicators, including at least one from each of: Economic, Social and Environmental.
Report on a minimum of 20 Performance Indicators, at least one from each of Economic, Environmental, Human Rights, Labor, Society, Product Responsibility.
Report on each core G3 and Sector Supplement* Indicatorwith due regard to the Material- ity Principle by either: a)report- ing on the Indicator or b) explaining the reason for its omission.
J ] h g j l �9 h h da[ Y lag f � D] n] d C C+ B B+ A A+
J]hg
jl�=p
l]jfY
ddq�9
kkmj]
\
J]hg
jl�=p
l]jfY
ddq�9
kkmj]
\
J]hg
jl�=p
l]jfY
ddq�9
kkmj]
\
OU
TPU
TO
UTP
UT
OU
TPU
T
G3 Profile Disclosures
G3 Management Approach
Disclosure
G3 Performance Indicators &
Sector Supplement Performance Indicators
KlYf\
Yj\�<
ak[dgk
mj]k
5 For more detail, see the html version of the report

Indicators and use of symbolsWhere relevant, we have used our own company indicators to give a complete and accurate picture of our performance. These are all prefixed “ST”. Also, we have identified a number of Key Performance Indicators (KPIs), which are shown as X.
A detailed table on the inside back cover page provides a summary of the results of all KPIs for the current year.
We have used a few symbols to illustrate:
• thelevelofachievementof our objectives
In progress
Target achieved
No progress
High level objectives are all spe-cified on page 4 and are detailed in sub-level objectives in each section of the report;
• referencestotheweb5• referencestoanotherpagein the report itself M• referencestoourEnvironment, Health and Safety Decalogue j
The ST Corporate Responsibility Report 2008 is printed on paper produced by factories whose environmental management system is ISO 14001 certified.The paper used is entirely chlorine free, and the high recyclability and renewability of the raw material, together with production processes, are optimized for maximum reduction of impact on the environment.
Furthermore the paper used is certified with the ProgramofEndorsementforForestCertification(PEFC),meaningthatthewoodusedtoproduceit (minimum 30%) has come from forests that are well managed according to strict environmental, social and economic standards. The forests of origin have been independently inspected and evaluated according to the principles and criteria that have been agreedandapprovedbyPEFC.
This book is printed on Creator Silk 350g/m2
(cover pages) and 135g/m2 (inside pages) IQnet and AEONOR certify that the organisation Torraspapel, S.A. (Motril) as implemented and maintains an ISO 14001 Environmental Management System.
Certificate Chain of custody of forest Based products N°: PEFC/14-33-00002-B www.pefc.org
APG Automotive Product GroupAPM Analog,PowerandMEMSASD Application Specific DiscreteASIC Application Specific Integrated CircuitbeStick Internal self-assessment toolCCI Computer & Communication InfrastructureCDP Cassa Depositi e PrestitiCEA Commissariatàl’EnergieAtomiqueCEC CorporateEthicsCommitteeCEO ChiefExecutiveOfficerCMOS Complementary MOS (Metal Oxide Semiconductor)CMR Carcinogenic, Mutagenic, toxic for ReproductionCOD Chemical Oxygen DemandCOO ChiefOperatingOfficerCPG Computer Peripherals GroupCR Corporate ResponsibilityCVD-PVD Chemical Vapor Deposition-Physical Vapor DepositionDART Days Away from work, job Restriction, job TransferDNA Deoxyribonucleic acidEcopack® Lead-freelabellingforRoHS- compliance(theEUDirectiveon RestrictiononUseofHazardous Substances)EFQM EuropeanFoundationofQuality ManagementEFTA EuropeanFreeTradeAssociationEICC ElectronicsIndustryCodeofConductEHS Environmental,Health&SafetyEMAS CommunityEco-Managementand Audit SchemeEMS ElectronicManufacturingServices providersePA Online performance appraisal toolEWS ElectricalWaferSortGeSI Global e-Sustainability InitiativeGHG Greenhouse GasesGRI Global Reporting InitiativeHED HomeEntertainment&DisplayHPC Home, Personal and Communication (ST Product Group)HR Human ResourcesH&S Health & SafetyIC Integrated CircuitICB Informatics & Computer BasicsICT Information and Communication- TechnologiesILO InternationalLaborOrganizationIMS Industrial & Multisegment SectorIn-Check™ STLab-on-ChipplatformIP Intellectual PropertyIPAD Integrated Passive and Active DevicesISO International Organization for StandardizationKPI Key Performance IndicatorLOP LocalOperatingProceduresMEMS Micro-Electro-MechanicalSystems
MMS Microcontrolers, Memories & SmartcardsMOSFET MetalOxideSemiconductorField EffectTransistorMPG Memory Products GroupMTCE MetricTonsofCarbonEquivalentNAND Not AndNGO Non-Governmental OrganizationNOR Not OrNOX Nitrogen OxidesODM Original Design ManufacturersODS Ozone depleting SubstancesOEM OriginalEquipmentManufacturersOHS Occupational Health & SafetyOHSAS Occupational Health & Safety Assessment Series (OHSAS 18001)OSHA Occupational Safety & Health AdministrationintheUnitedStatesPFCs Perfluorinated CompoundsPFOs Perfluoro-octane SulfonateR&D Research & DevelopmentR11 ChloroFluoroCarbon (CFC) and is also called CFC 11. It is an Ozone Depleting Substance. Its chemical name is Trichlorofluoromethane.RC Recordable case rateREACH Registration,Evaluationand Authorization of ChemicalsRoHS Restriction of Hazardous SubstancesSAM Serviceable Available MarketSE SustainableExcellenceSIA Semiconductor Industry AssociationSoC System-on-ChipSOP Standard Operating ProceduresSOX Sulfur OxidesSR Severity RateSRI Socially Responsible InvestmentSTU STUniversityTCE TonsofCarbonEquivalentTQM TotalQualityManagementUSAs UnvestedStockAwardsUSGAAP USGenerallyAcceptedAccounting PrinciplesUWEEI UnitedWorkersofElectronicand ElectricalIndustriesVOCs Volatile Organic CompoundsWBCSC World Business Council for Sustainable DevelopmentWEEE WasteofElectricalandElectronic EquipmentWSC World Semiconductor Council20-F Annual report filed with the SecuritiesandExchangeCommission
GRI indicator prefixesEC EconomicImpactEN EnvironmentHR Human RightsLA EmploymentPR Product ResponsibilitySO Society
ST indicator prefixesST CompanySTE EconomicsSTEV EnvironmentSTHR Human RightsSTHS Health & SafetySTS SocialSTSC Supply ChainSTSO CompanySTPR Product Responsibility
Reader’sguideReader’sguideGlossary
Report scope and profileThis is a report of how responsibly we have performed as a company in the calendar year 2008.ItcoversallSTMicroelectronicsNV’sactivitiesandsites,unlessotherwisestated.YoucanfinddetailsaboutST’s structure and countries of operation in the chart on page 1. For other information you can access reports from previous years at http://www.st.com/stonline/company/cr/reports/index.htm.ThenameofourglobalorganizationhaschangedfromTotalQualityandCorporateResponsibility(TQCR)toQuality,EducationandSustainableDevelopment(QES).TheCorporateResponsibilitydepartmentispartofthisorganization.
AccessibilityThis printed Corporate Responsibility Report details STMicroelectronics Corporate Responsibility performance and shows how ourcompanyintegratesSustainableExcellenceinitsstrategyanddailyactivity.As with previous reports, we have presented some concrete examples from sites, regions, product groups and central organiza-tions to illustrate not just our performance but also the challenges we face, and the growing company-wide awareness of corporate responsibility this reflects.These lessons and experience gained from these examples are relevant not just to the sole country or site explicitly detailed. Often, there is a company strategy and each year, we select some specific examples to illustrate it and involve ST sites and organizations. ThereportispublishedinEnglishonly.This report is printed and is also accessible on the web and can be downloaded in PDF format at http://www.st.com/stonline/company/cr/reports/index.htm. Our website has been significantly updated, providing new information about our Corporate Responsibility strategy and performance.
MaterialityIn order to define material issues of most relevance and interest for our audience, for the past two years we have organized specific sessions to get feedback from our stakeholders:• wetookintoaccountspontaneousfeedback(email,webrequests);• weorganized11phoneinterviewswithexternalstakeholders(includingcustomers,businesspartners,academics, SRI analysts, government, the Corporate Responsibility community and major companies); • wehaveconductedregularfollow-upsessionsonrulesandregulations;• wehaveconductedhigh-levelbenchmarking;• wehaveinterviewedST’sVicePresidentsinvolvedinthekeyissueslinkedtoSustainableExcellence;• wehavelaunchedasuccessfulinternalsurvey,witharound228managersgivingustheirfeedback;• wehavekepttrackof,andtriedtoanticipate,therulesandregulationsbeingputinplaceatworldwidelevel.For more clarity, we have decided to publish a special focus to show how we have defined our material issues (pages 4 and 5).
We are aware that the Disclosure on Management Approach for each section is very important to help you understand how we manage material issues and potential risks. As our management approach is very stable and does not need an annual update, we have decided to publish it, in some detail, on the web only. 5 See more on www.st.com/stonline/company/sd/index.htm
AssuranceAsinpreviousyears,BureauVeritasCertificationhasprovidedassuranceservicestous,includingverifyingallourSocial,Envi-ronment Health and Safety indicators.Auditing by Bureau Veritas Certification takes place at two levels in the company. First, the auditing team verifies data collection andconsolidationprocessesbycheckingcorporateleveldata.Secondthesefiguresareverifiedatagivenlocalsite.Eachyearwechooseadifferentsite,andin2008theTourssite,France,wasaudited.This is a good method for us to check the relevancy and accuracy of processes in place and so to guarantee data integrity.
M You can find details of our verification processes on page 64
Adherence to GRI and the UN Global CompactThis report is prepared and presented in accordance with the 2006 Global Reporting (GRI) G3 Guidelines, with an A+ self-declared rating checked and confirmed by GRI. If G3 indicators are not applicable or relevant to us we explain why we do not report on them either in the text and/or in the indicator index in the html version of this report. We use our
ownindicatorstorespondtoortosupplementGRIindicators(seebelow).WealsoendorsetheprinciplesoftheUnitedNationsGlobal Compact. This report describes actions we have taken to implement these principles, and serves as our Communication on Progress.On the back cover flap, there is an index that links GRI, Global Compact and ST indicators to related information in this report.
Give us your feedbackWe are committed to improving both our Corporate Responsibi-lity Performance and the ways we communicate with our stakeholders. We encourage contributions and debate from all stakeholders and welcome feedback on the content and presentation of this report – as well as suggestions for next year.
In order to get your feedback, we have developed an online form, available at http://www.st.com/stonline/company/sd/contact.htm, please do not hesitate to use this for any comments.
Of course, you can also contact us directly at [email protected] or contact:
Kate Rigge
STMicroelectronics CorporateHeadquarters 39, Chemin du Champ-des-Filles – C.P. 21 CH-1228Geneva–Plan-Les-Ouates Switzerland
Corporate Responsibility Report A culture of Sustainable Excellence
STM
icro
elec
tron
ics
Corp
orat
e Re
spon
sibi
lity
Repo
rt 2
008
A C
ultu
re o
f Sus
tain
able
Exc
elle
nce
Report on:1.1 2.1 - 2.103.1 - 3.8, 3.10 - 3.124.1 - 4.4, 4.14 - 4.15
Report on criteria listed for Level C plus: 1.23,9, 3,134.5 - 4.13, 4.16 - 4.17
Same as requirement for Level B
Not Required Management Approach Disclosures for each Indicator Category
Management Approach Disclosures for each Indicator Category
Report on a minimum of 10 Performance Indicators, including at least one from each of: Economic, Social and Environmental.
Report on a minimum of 20 Performance Indicators, at least one from each of Economic, Environmental, Human Rights, Labor, Society, Product Responsibility.
Report on each core G3 and Sector Supplement* Indicatorwith due regard to the Material- ity Principle by either: a)report- ing on the Indicator or b) explaining the reason for its omission.
ReportÊApplicationÊ Level C C+ B B+ A A+
Repo
rtÊEx
terna
llyÊA
ssure
d
Repo
rtÊEx
terna
llyÊA
ssure
d
Repo
rtÊEx
terna
llyÊA
ssure
d
OU
TPU
TO
UTP
UT
OU
TPU
T
G3 Profile Disclosures
G3 Management Approach
Disclosure
G3 Performance Indicators &
Sector Supplement Performance Indicators
Stand
ardÊD
isclos
ures
5 For more detail, see the html version of the report
STMicroelectronics