glutamine sensitivity analysis identifies the xct antiporter as a common triple-negative breast...
TRANSCRIPT

Please cite this article in press as: Timmerman et al., Glutamine Sensitivity Analysis Identifies the xCT Antiporter as a Common Triple-Negative BreastTumor Therapeutic Target, Cancer Cell (2013), http://dx.doi.org/10.1016/j.ccr.2013.08.020
Cancer Cell
Article
Glutamine Sensitivity Analysis Identifiesthe xCT Antiporter as a Common Triple-NegativeBreast Tumor Therapeutic TargetLuika A. Timmerman,1,* Thomas Holton,4 Mariia Yuneva,6 Raymond J. Louie,1,3 Merce Padro,1,3 Anneleen Daemen,1,2
Min Hu,5 Denise A. Chan,1,3 Stephen P. Ethier,7 Laura J. van ‘t Veer,1,2 Kornelia Polyak,8 Frank McCormick,1,10
and Joe W. Gray9,101UCSF/Helen Diller Family Comprehensive Cancer Center2Department of Laboratory Medicine3Department of Radiation Oncology
University of California, San Francisco, San Francisco, CA 94115, USA4School of Engineering, San Francisco State University, San Francisco, CA 94115, USA5Novartis Institutes for BioMedical Research (China), Pudong New Area, Shanghai 201203, P.R. China6Division of Physiology and Metabolism, MRC National Institute of Medical Research, London NW7 1AA, UK7Hollings Cancer Center, Medical University of South Carolina, Charleston, SC 29425, USA8Department of Medical Oncology, Dana-Farber Cancer Institute, Harvard Medical School, Boston, MA 02215, USA9Department of Biomedical Engineering, Oregon Health Sciences University, Portland, OR 97239, USA10These authors contributed equally to this work
*Correspondence: [email protected]
http://dx.doi.org/10.1016/j.ccr.2013.08.020
SUMMARY
A handful of tumor-derived cell lines form the mainstay of cancer therapeutic development, yielding drugswith an impact typically measured as months to disease progression. To develop more effective breastcancer therapeutics andmore readily understand their clinical impact, we constructed a functional metabolicportrait of 46 independently derived breast cell lines. Our analysis of glutamine uptake and dependenceidentified a subset of triple-negative samples that are glutamine auxotrophs. Ambient glutamine indirectlysupports environmental cystine acquisition via the xCT antiporter, which is expressed on one-third oftriple-negative tumors in vivo. xCT inhibition with the clinically approved anti-inflammatory sulfasalazinedecreases tumor growth, revealing a therapeutic target in breast tumors of poorest prognosis and a leadcompound for rapid, effective drug development.
INTRODUCTION
Current cancer therapeutic development methodologies are
expensive, slow, and unable to allow early prediction of the pal-
ette and prevalence of responses tumors can mount when chal-
lenged with a prototypic drug. Breast cancer is a challenging
example. Large heterogeneity exists within and between well-
established subtypes and drug responses (reviewed in Weigelt
and Reis-Filho, 2009). Three distinct nomenclatures group
breast tumors based on morphological criteria (e.g., ductal,
Significance
There is a strong disconnect between compound efficacy in tuical response rates, slowing the production of effective theraptumor responses to a particular perturbation could be identcurrently used to identify applicable clinical populations, thsponders. Here, we use functional analyses in 47 independenrelated to perturbations in glutaminemetabolism, and estimateunderserved population of patients with breast cancer and a l
lobular, invasive, or in situ); expression of the estrogen receptor
(ER), progesterone receptor (PR), and Her2 receptor tyrosine
kinase (Her2); or molecular phenotype, derived from compre-
hensive mRNA similarities (e.g., luminal, basal). Approximately
one-fourth of breast tumors are ‘‘triple negative’’ (ER�/ PR�/Her2�; TNBC), and usually have a basal molecular phenotype.
They are aggressive, with poorest prognosis, high mitotic index,
and intrinsic DNA damage repair defects (reviewed in Weigelt
and Reis-Filho, 2009; Alli et al., 2009). A subset termed claudin
low and related metaplastic tumors have rapid disease courses,
mor cell lines used for cancer drug development versus clin-eutics. This would be improved if the frequency and types ofified early in the process. While drug target expression isese patient cohorts contain both responders and nonre-t breast-derived cell lines to measure metabolic responsestheir frequency.We identify a therapeutic target in a severelyead compound for rapid, durable therapeutic development.
Cancer Cell 24, 1–16, October 14, 2013 ª2013 Elsevier Inc. 1

TripleNegative
ER+
MolecularPhenotype
PathologicalClassification
25
17
10
Basal
ClaudinLow
Luminal
Her2+
Her2+82
17
39
13
A
0.001 3.3x10- 9
4.2x10- 11
1.7x10- 4
2.4x10⁻⁷
5.3x10⁻¹⁰
1.2x10- 8
1.2x10⁻⁷
4.5x10- 8
2.2x10⁻¹³
hGA
C E
xpre
ssio
n (lo
g 2)
4
6
8
10ER−ER+BasalLuminal
GSE1561
GSE2034
GSE20271
GSE23988
GSE4922
GSE1456
GSE7390
Chin 2006
G
p-value
M453
H2185Z1
CAMA1
M175
B483
B474M468
BT549 HMLE
184B5H100
H38
M157
184A1
H1500M231
H1954 BT20AU565
Hs578tH1143
H3153
H1569
M435
M436
M415
LuminalBasalClaudin LowNon-tumorigenic
D
Glutamine Consumption (nMoles/cell/day x10-4)0-0.5 1 2 3
0
1
2
3
Glu
cose
Upt
ake
at 4
Hou
rs (
% in
crea
se X
100
)
HMLE
H1143H1569
M435M231
H1500
M436H100
BT549 H38M157 184A1
M468
184B5 H2185 Hs578t H3153AU565
H1954
M415
Z1B474
CAMA1M175
B483
hGA
C E
xpre
ssio
n (lo
g 2)
3
4
5
6
7
-0.5 0Glutamine Consumption (nMoles/cell/day x10-4)
1 2
LuminalBasalClaudin LowNon-tumorigenicPurified Normal
3
BT20
F184A1
0
1
2
Am
ino
Aci
d C
onsu
mpt
ion
(nM
oles
/cel
l/day
x10
-3)
GlnLeuIleSerVal
CysLysPheThrArg
TyrMetAspHisTrp
Claudin LowNon-tumorigenic
E
M157H38
HMLE
H100BT549
184B5
0
1
2
3
4
5
6
7B
T54
9M
12A
H10
0H
s578
tM
435
MC
F7
M23
1M
10A
H19
54M
468
184A
1H
1569
M45
3Z
BT
47D
H38
HM
LEH
1500
M36
118
4B5
BT
474
LY2
M43
6A
U56
5H
1187
H31
53B
T20
M17
5H
2185
H70
M15
7M
415
Z1
CA
MA
1S
KB
R3
H14
28H
1937
Z30
U81
2H
1143
BT
483
600M
PE
M13
4H
202
Dou
blin
g T
ime
(day
s) LuminalBasalClaudin LowNon-tumorigenic
Cell Line
LuminalBasalClaudin LowNon-tumorigenic
C
0
100
200
300
M43
5M
12A
LY2
H10
0M
157
H15
69M
231
M43
6H
1500
H11
4318
4B5
M10
AH
3818
4A1
Hs5
78t
MC
F7
SK
BR
3H
202
ZB
AU
565
HM
LEB
T20
BT
549
H19
54M
361
H31
53D
u447
5T
47D
H19
37M
134
H11
8760
0MP
EH
1428
BT
483
M46
8U
812
CA
MA
1M
175
H70 Z1
H21
85B
T47
4Z
30M
415
M45
3
Glu
cose
Upt
ake
(% in
crea
se a
t 4 h
ours
)Cell Line
B
0
50
(legend on next page)
Cancer Cell
Glutamine Sensitivity Analysis
2 Cancer Cell 24, 1–16, October 14, 2013 ª2013 Elsevier Inc.
Please cite this article in press as: Timmerman et al., Glutamine Sensitivity Analysis Identifies the xCT Antiporter as a Common Triple-Negative BreastTumor Therapeutic Target, Cancer Cell (2013), http://dx.doi.org/10.1016/j.ccr.2013.08.020
Cancer Cell
Glutamine Sensitivity Analysis
Please cite this article in press as: Timmerman et al., Glutamine Sensitivity Analysis Identifies the xCT Antiporter as a Common Triple-Negative BreastTumor Therapeutic Target, Cancer Cell (2013), http://dx.doi.org/10.1016/j.ccr.2013.08.020
stem cell features, and chemotherapy-resistant characteristics
(Hennessy et al., 2009, Prat et al., 2010). No TNBC-targeted ther-
apeutic exists, and patient prognosis is grim.
Many tumors increase uptake and reliance on environmental
nutrients such as glucose, glutamine (reviewed in Souba, 1993;
Gatenby and Gillies, 2004; DeBerardinis et al., 2008), cystine,
and asparagine (Iglehart et al., 1977; Asselin et al., 1989).
Seminal work in tumor series of increasing proliferation rate
and de-differentiation (Erlich ascites, Knox et al., 1970; Morris
hepatoma, Linder-Horowitz et al., 1969; Nb2 lymphoma, Gout
et al., 1997) correlated these features with malignant progres-
sion, fostering drug development efforts focused on specific
nutrients. However, resulting nutrient mimetics were systemi-
cally toxic (reviewed in Souba, 1993), and inexplicable variability
among increasing numbers of tumor isolates eventually
discouraged these endeavors. Only leukemia dependence on
asparagine was successfully pursued to a molecular under-
standing and effective drug (Asparaginase, reviewed in Narta
et al., 2007).
The xCT cystine/glutamate antiporter is the major means of
increasing cystine uptake and the rate-limiting step for gluta-
thione (GSH) synthesis in fibroblasts, rat hepatocytes, and Nb2
lymphoma (Bannai and Tateishi, 1986; Gout et al., 1997). Dual
roles in reactive oxygen species (ROS) neutralization and detox-
ification of xenobiotics such as chemotherapeutics make GSH
an appealing drug target. However, inhibitors of glutathione syn-
thesis failed clinical trials due to toxicities related to systemic
GSH depletion (reviewed in Hamilton and Batist, 2004). xCT
may provide a target for cell-specific GSH depletion. Drug
screens identified off-target effects of the anti-inflammatory
pro drug sulfasalazine (SASP) as an xCT inhibitor (Gout et al.,
2001). SASP, glutamate, monosodium glutamate, and chemical
inhibitors of xCT reduce GSH, increase ROS, potentiate chemo-
therapeutic effects, and attenuate growth in a handful of tumor-
derived cell lines in vitro and xenografts (reviewed in Lo et al.,
2008a). SASP is labile and insoluble under physiological condi-
tions, limiting anti-xCT use to preclinical experiments. Other
effects ascribed to SASP include the on-target anti-inflammatory
activity of an SASP metabolite, NFkB inhibition, and direct inter-
action with GSH in cell-free extracts.
Molecular explanations for glutamine reliance remain elusive,
although the phenomenon is well described (Coles and John-
stone, 1962; Kovacevi�c and Morris, 1972; Reitzer et al., 1979;
DeBerardinis et al., 2007; Yuneva et al., 2007; Wise et al.,
2008). Glutamine provides carbon and nitrogen for independent
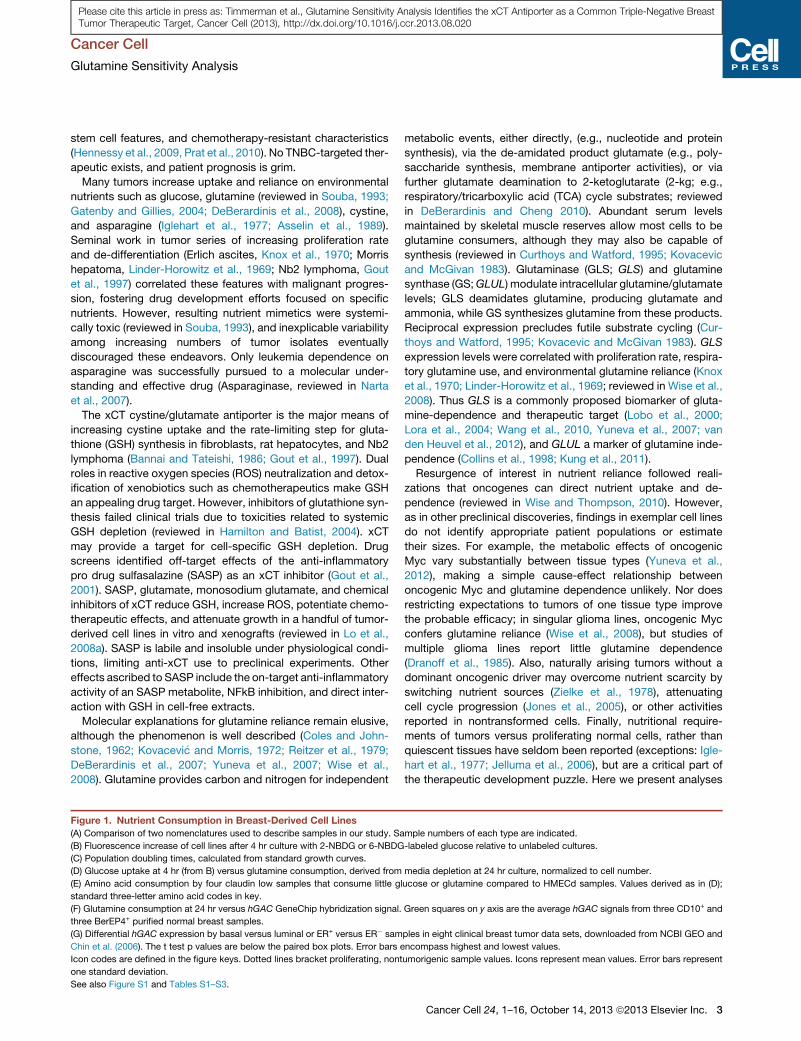
Figure 1. Nutrient Consumption in Breast-Derived Cell Lines
(A) Comparison of two nomenclatures used to describe samples in our study. Sa
(B) Fluorescence increase of cell lines after 4 hr culture with 2-NBDG or 6-NBDG
(C) Population doubling times, calculated from standard growth curves.
(D) Glucose uptake at 4 hr (from B) versus glutamine consumption, derived from
(E) Amino acid consumption by four claudin low samples that consume little g
standard three-letter amino acid codes in key.
(F) Glutamine consumption at 24 hr versus hGAC GeneChip hybridization signal.
three BerEP4+ purified normal breast samples.
(G) Differential hGAC expression by basal versus luminal or ER+ versus ER� sam
Chin et al. (2006). The t test p values are below the paired box plots. Error bars e
Icon codes are defined in the figure keys. Dotted lines bracket proliferating, nont
one standard deviation.
See also Figure S1 and Tables S1–S3.
metabolic events, either directly, (e.g., nucleotide and protein
synthesis), via the de-amidated product glutamate (e.g., poly-
saccharide synthesis, membrane antiporter activities), or via
further glutamate deamination to 2-ketoglutarate (2-kg; e.g.,
respiratory/tricarboxylic acid (TCA) cycle substrates; reviewed
in DeBerardinis and Cheng 2010). Abundant serum levels
maintained by skeletal muscle reserves allow most cells to be
glutamine consumers, although they may also be capable of
synthesis (reviewed in Curthoys and Watford, 1995; Kovacevic
and McGivan 1983). Glutaminase (GLS; GLS) and glutamine
synthase (GS;GLUL) modulate intracellular glutamine/glutamate
levels; GLS deamidates glutamine, producing glutamate and
ammonia, while GS synthesizes glutamine from these products.
Reciprocal expression precludes futile substrate cycling (Cur-
thoys and Watford, 1995; Kovacevic and McGivan 1983). GLS
expression levels were correlated with proliferation rate, respira-
tory glutamine use, and environmental glutamine reliance (Knox
et al., 1970; Linder-Horowitz et al., 1969; reviewed in Wise et al.,
2008). Thus GLS is a commonly proposed biomarker of gluta-
mine-dependence and therapeutic target (Lobo et al., 2000;
Lora et al., 2004; Wang et al., 2010, Yuneva et al., 2007; van
den Heuvel et al., 2012), and GLUL a marker of glutamine inde-
pendence (Collins et al., 1998; Kung et al., 2011).
Resurgence of interest in nutrient reliance followed reali-
zations that oncogenes can direct nutrient uptake and de-
pendence (reviewed in Wise and Thompson, 2010). However,
as in other preclinical discoveries, findings in exemplar cell lines
do not identify appropriate patient populations or estimate
their sizes. For example, the metabolic effects of oncogenic
Myc vary substantially between tissue types (Yuneva et al.,
2012), making a simple cause-effect relationship between
oncogenic Myc and glutamine dependence unlikely. Nor does
restricting expectations to tumors of one tissue type improve
the probable efficacy; in singular glioma lines, oncogenic Myc
confers glutamine reliance (Wise et al., 2008), but studies of
multiple glioma lines report little glutamine dependence
(Dranoff et al., 1985). Also, naturally arising tumors without a
dominant oncogenic driver may overcome nutrient scarcity by
switching nutrient sources (Zielke et al., 1978), attenuating
cell cycle progression (Jones et al., 2005), or other activities
reported in nontransformed cells. Finally, nutritional require-
ments of tumors versus proliferating normal cells, rather than
quiescent tissues have seldom been reported (exceptions: Igle-
hart et al., 1977; Jelluma et al., 2006), but are a critical part of
the therapeutic development puzzle. Here we present analyses
mple numbers of each type are indicated.
-labeled glucose relative to unlabeled cultures.
media depletion at 24 hr culture, normalized to cell number.
lucose or glutamine compared to HMECd samples. Values derived as in (D);
Green squares on y axis are the average hGAC signals from three CD10+ and
ples in eight clinical breast tumor data sets, downloaded from NCBI GEO and
ncompass highest and lowest values.
umorigenic sample values. Icons represent mean values. Error bars represent
Cancer Cell 24, 1–16, October 14, 2013 ª2013 Elsevier Inc. 3

Q- Culture Size(% control at day 5)
Q-
+ 2
X G
U c
ultu
re s
i ze
(% c
ontr
ol a
t day
5)
20 400 60 80 100 120
100
120
80
60
40
20
0
B
F
Q-
Cul
ture
Siz
e(%
con
t rol
at d
ay 5
) High density
H3153184A10
20
40
60
80
100
120Q-
Low density
DU- Q- U- Q- U- Q-
48 hr 72 hrC
p-ACC S-79
t-ACC
p-AMPK T-172
t-AMPK
cleaved PARP
184A
1U- Q- U- Q- U- Q-24 hr 48 hr 72 hr
Cp-AMPK T-172
t-AMPK
H31
53
24 hr
Q- #:ATP
1 2 3 4 5
0
1
2
3
4
5184A1
Ave
rage
Lig
h tU
nits
(x1
06 )
CQ-
C
1 2 3 4 5
0
1
2
3
4
5H3153
Time (days)Time (days)0
24 29 36 36 44
0
9 19 242722
M435
M436
H1569H3153
H1143
AU565BT20
Hs578tH1954
M231H1500
H100
H38 M157184A1 M468
BT549M415
HMLE
184B5M175
B483
H2185
B474Z1
CAMA1
G
1.0
Glu
tam
ine
Con
sum
ptio
n(n
Mol
es /
cell
/ da y
X 1
0-4)
-0.5
0
0.5
1.5
2.0
2.5
0 20 40 60 80 100 120
Glutamine-free Culture Size (% control at day 5)
LuminalBasalClaudin LowNon-tumorigenicPurified Normal
3.0
184A1
C CFQ-
% S-phase
100
80
60
40
20
0
H3153
36 636
2 ND1.7
C Q- CF
41 51 29
2.3 2.1 ND
Per
cent
G1S-phaseG2/M
Culture size (% control) 100 31 7110041 91
E
% Mitotic Figures
H100M435
M231H1500
H38
M436 M157
BT549
BT20H1569 H70
M10AH1143
M12A
184A1
H1954
Hs578t
Ly2
M415
M134
M361M175
CAMA1H202
B474B483Z1
U812T47D
MCF7ZB
H1428184B5
H3153HMLE M468
SKBR3H2185
AU565H1937
H
3
4
5
6
7
8
0 20 40 60 80 100 120
Glutamine-free Culture Size (% control at day 5)
hGA
C E
xpr e
ssio
n (lo
g 2)
H10
0M
435
M43
6H
38M
231
H15
00H
1954
M15
7M
134
Hs5
78t
BT
549
BT
20M
361
LY2
M17
5M
415
184A
1H
1569
184B
5H
3153
MC
F7
HM
LEM
10A
H70 ZB
CA
MA
1S
KB
R3
M46
8H
1428
T47
DH
202
H11
43U
812
Z1
M12
AH
2185
BT
483
H19
37B
T47
4A
U56
50
20
40
60
80
100
120
Q-
Cul
ture
Siz
e (
% c
ontr
ol a
t day
5)
A
184A1H3153
Glutamine Sensitive
LuminalBasalClaudin LowNon-tumorigenic
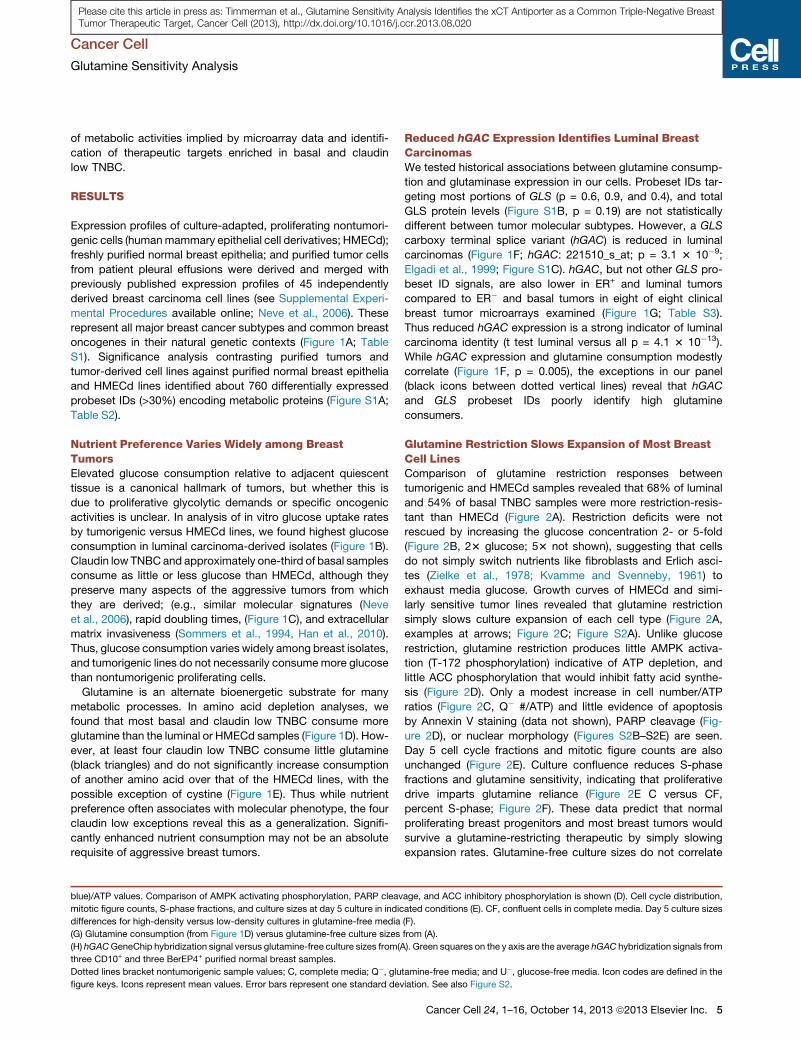
Figure 2. Glutamine Restriction Slows Culture Expansion
(A) Day 5 culture sizes for each cell line grown in glutamine-free media, normalized to culture in control media.
(B) Day 5 culture sizes in glutamine-free media with twice the normal glucose concentration (23 GU, y axis) versus glutamine-free media with normal glucose
levels (x axis), each normalized to culture in control media.
(C–F) Glutamine deprivation responses in the nontumorigenic exemplar 184A1 and a similarly sensitive tumorigenic line H3153 (arrows in A) are shown.
Growth curves derived from Cell Titer Glow/ATP content analysis (C). Q- #/ATP numbers are the ratio of cell numbers derived from manual counting (trypan
(legend continued on next page)
Cancer Cell
Glutamine Sensitivity Analysis
4 Cancer Cell 24, 1–16, October 14, 2013 ª2013 Elsevier Inc.
Please cite this article in press as: Timmerman et al., Glutamine Sensitivity Analysis Identifies the xCT Antiporter as a Common Triple-Negative BreastTumor Therapeutic Target, Cancer Cell (2013), http://dx.doi.org/10.1016/j.ccr.2013.08.020
Cancer Cell
Glutamine Sensitivity Analysis
Please cite this article in press as: Timmerman et al., Glutamine Sensitivity Analysis Identifies the xCT Antiporter as a Common Triple-Negative BreastTumor Therapeutic Target, Cancer Cell (2013), http://dx.doi.org/10.1016/j.ccr.2013.08.020
of metabolic activities implied by microarray data and identifi-
cation of therapeutic targets enriched in basal and claudin
low TNBC.
RESULTS
Expression profiles of culture-adapted, proliferating nontumori-
genic cells (humanmammary epithelial cell derivatives; HMECd);
freshly purified normal breast epithelia; and purified tumor cells
from patient pleural effusions were derived and merged with
previously published expression profiles of 45 independently
derived breast carcinoma cell lines (see Supplemental Experi-
mental Procedures available online; Neve et al., 2006). These
represent all major breast cancer subtypes and common breast
oncogenes in their natural genetic contexts (Figure 1A; Table
S1). Significance analysis contrasting purified tumors and
tumor-derived cell lines against purified normal breast epithelia
and HMECd lines identified about 760 differentially expressed
probeset IDs (>30%) encoding metabolic proteins (Figure S1A;
Table S2).
Nutrient Preference Varies Widely among BreastTumorsElevated glucose consumption relative to adjacent quiescent
tissue is a canonical hallmark of tumors, but whether this is
due to proliferative glycolytic demands or specific oncogenic
activities is unclear. In analysis of in vitro glucose uptake rates
by tumorigenic versus HMECd lines, we found highest glucose
consumption in luminal carcinoma-derived isolates (Figure 1B).
Claudin low TNBC and approximately one-third of basal samples
consume as little or less glucose than HMECd, although they
preserve many aspects of the aggressive tumors from which
they are derived; (e.g., similar molecular signatures (Neve
et al., 2006), rapid doubling times, (Figure 1C), and extracellular
matrix invasiveness (Sommers et al., 1994, Han et al., 2010).
Thus, glucose consumption varies widely among breast isolates,
and tumorigenic lines do not necessarily consumemore glucose
than nontumorigenic proliferating cells.
Glutamine is an alternate bioenergetic substrate for many
metabolic processes. In amino acid depletion analyses, we
found that most basal and claudin low TNBC consume more
glutamine than the luminal or HMECd samples (Figure 1D). How-
ever, at least four claudin low TNBC consume little glutamine
(black triangles) and do not significantly increase consumption
of another amino acid over that of the HMECd lines, with the
possible exception of cystine (Figure 1E). Thus while nutrient
preference often associates with molecular phenotype, the four
claudin low exceptions reveal this as a generalization. Signifi-
cantly enhanced nutrient consumption may not be an absolute
requisite of aggressive breast tumors.
blue)/ATP values. Comparison of AMPK activating phosphorylation, PARP cleav
mitotic figure counts, S-phase fractions, and culture sizes at day 5 culture in indic
differences for high-density versus low-density cultures in glutamine-free media
(G) Glutamine consumption (from Figure 1D) versus glutamine-free culture sizes
(H) hGACGeneChip hybridization signal versus glutamine-free culture sizes from(A
three CD10+ and three BerEP4+ purified normal breast samples.
Dotted lines bracket nontumorigenic sample values; C, complete media; Q�, glufigure keys. Icons represent mean values. Error bars represent one standard dev
Reduced hGAC Expression Identifies Luminal BreastCarcinomasWe tested historical associations between glutamine consump-
tion and glutaminase expression in our cells. Probeset IDs tar-
geting most portions of GLS (p = 0.6, 0.9, and 0.4), and total
GLS protein levels (Figure S1B, p = 0.19) are not statistically
different between tumor molecular subtypes. However, a GLS
carboxy terminal splice variant (hGAC) is reduced in luminal
carcinomas (Figure 1F; hGAC: 221510_s_at; p = 3.1 3 10�9;
Elgadi et al., 1999; Figure S1C). hGAC, but not other GLS pro-
beset ID signals, are also lower in ER+ and luminal tumors
compared to ER� and basal tumors in eight of eight clinical
breast tumor microarrays examined (Figure 1G; Table S3).
Thus reduced hGAC expression is a strong indicator of luminal
carcinoma identity (t test luminal versus all p = 4.1 3 10�13).
While hGAC expression and glutamine consumption modestly
correlate (Figure 1F, p = 0.005), the exceptions in our panel
(black icons between dotted vertical lines) reveal that hGAC
and GLS probeset IDs poorly identify high glutamine
consumers.
Glutamine Restriction Slows Expansion of Most BreastCell LinesComparison of glutamine restriction responses between
tumorigenic and HMECd samples revealed that 68% of luminal
and 54% of basal TNBC samples were more restriction-resis-
tant than HMECd (Figure 2A). Restriction deficits were not
rescued by increasing the glucose concentration 2- or 5-fold
(Figure 2B, 23 glucose; 53 not shown), suggesting that cells
do not simply switch nutrients like fibroblasts and Erlich asci-
tes (Zielke et al., 1978; Kvamme and Svenneby, 1961) to
exhaust media glucose. Growth curves of HMECd and simi-
larly sensitive tumor lines revealed that glutamine restriction
simply slows culture expansion of each cell type (Figure 2A,
examples at arrows; Figure 2C; Figure S2A). Unlike glucose
restriction, glutamine restriction produces little AMPK activa-
tion (T-172 phosphorylation) indicative of ATP depletion, and
little ACC phosphorylation that would inhibit fatty acid synthe-
sis (Figure 2D). Only a modest increase in cell number/ATP
ratios (Figure 2C, Q� #/ATP) and little evidence of apoptosis
by Annexin V staining (data not shown), PARP cleavage (Fig-
ure 2D), or nuclear morphology (Figures S2B–S2E) are seen.
Day 5 cell cycle fractions and mitotic figure counts are also
unchanged (Figure 2E). Culture confluence reduces S-phase
fractions and glutamine sensitivity, indicating that proliferative
drive imparts glutamine reliance (Figure 2E C versus CF,
percent S-phase; Figure 2F). These data predict that normal
proliferating breast progenitors and most breast tumors would
survive a glutamine-restricting therapeutic by simply slowing
expansion rates. Glutamine-free culture sizes do not correlate
age, and ACC inhibitory phosphorylation is shown (D). Cell cycle distribution,
ated conditions (E). CF, confluent cells in complete media. Day 5 culture sizes
(F).
from (A).
). Green squares on the y axis are the average hGAC hybridization signals from
tamine-free media; and U�, glucose-free media. Icon codes are defined in the
iation. See also Figure S2.
Cancer Cell 24, 1–16, October 14, 2013 ª2013 Elsevier Inc. 5

0
50
%To
tal S
-Pha
se a
t day
5(n
ocod
azol
e)
D
E
Complete mediaDay 5 Glutamine-free
Group B Group CGroup A
M41
5
H19
54
Hs5
78t
BT
549
H15
69
M43
5
M23
1
H10
0
H38
H15
00
M15
7
H19
37
H31
53
M231 M435 H1569 H38
Rb (total)
pRb (S780)
Actin
GLN+ + + +- - - -
F
S-phasedecrease
(Δ %)
11ND33
ND208
ND
18
26
446
ND4212
23
ND
0 20 40 60Glutamine-free Culture Size
(% control at day 5)
80 100 120
Gro
up A
Gro
up B
Gro
up C
Lowdensity
Highdensity
LuminalBasalClaudin Low
M415H1954M175
Hs578tBT549H1569M134
M435M231H100H38H1500BT20M436
M157M361
Other tumorigenic
Group BGroup C
Non-tumorigenic
Glutamine-free Culture Size (% control at day 5)
0 20 40 60 80 100 120
Dou
blin
gT
ime
(day
s)
5
4
6
7
3
2
1
G
0
50
Δ %
G2/
M a
t day
5(n
ocod
azol
e)
Complete mediaDay 5 Glutamine-free
C
Group B Group CGroup A
M41
5
H19
54
H19
37
H31
53
Hs5
78t
BT
549
H15
69
M15
7
M43
5
M23
1
H10
0
H38
H15
00
Ann
exin
Pos
itive
(% in
crea
se a
t day
3)
Group B Group C
0
42
68
1012
LuminalBasalClaudin Low
Group A
BH
s578
t
M13
4
BT
549
H15
69
M15
7M
361
BT
20H
38
M23
1
M43
6M
435
H15
00H
100
AC
ultu
re s
ize
(% o
f sta
rt)
M175H1954LY2M415
0 1 2 3 4 5
M361
BT20H38M231M436M435H1500
0
100
200
300
400
0 1 2 3 4 5
Hs578tM134BT549H1569
0 1 2 3 4 5
H100
Group A Group B Group C
M157
Time (days)
H11
43H
1937
H19
54H
3153
LY
2M
175
M41
5M
468
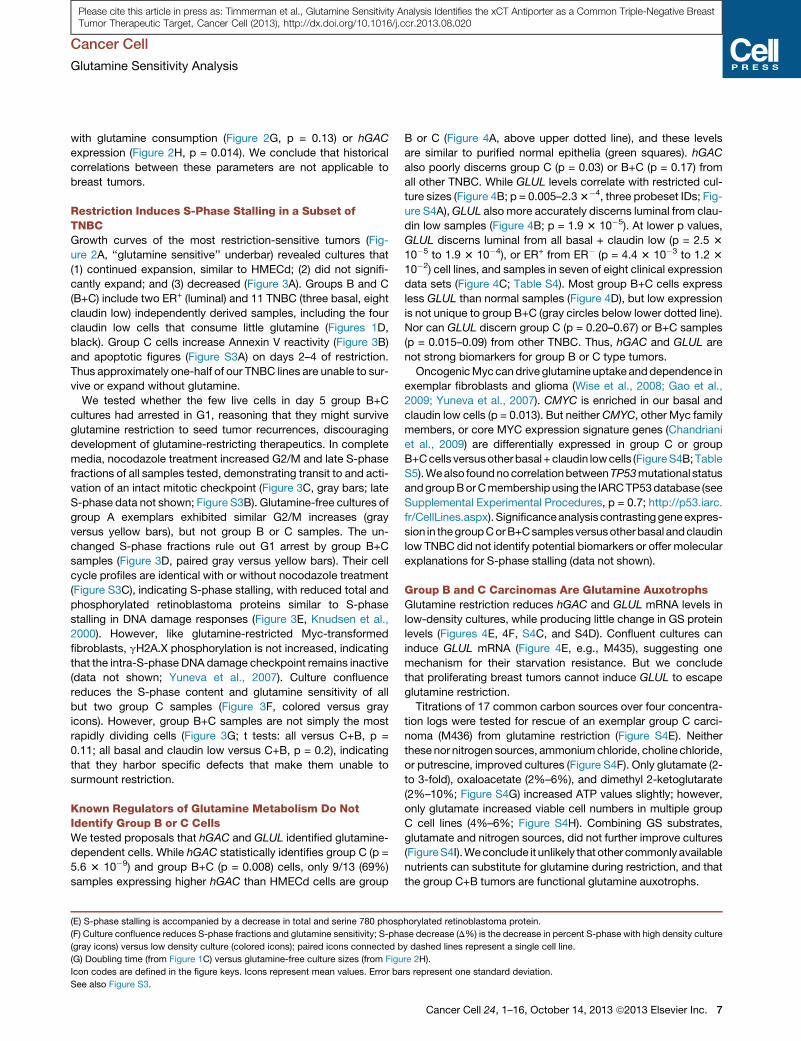
Figure 3. Glutamine Restriction Induces S-Phase Stalling in a Subset of Basal TNBC
(A) Growth curves of ‘‘glutamine-sensitive’’ carcinomas (underlined in Figure 2A) in glutamine-free media.
(B) Percent increases in annexin V reactivity of cells in glutamine-free media at day 3. Group averages: A, 0.8%, ± 1.4; B, 1.2% ± 1.4; and C, 5.8% ± 3.2; t test A
versus C p = 0.005.
(C) Paired bars representing the change in percent of cells in G2/M (D%G2/M) with nocodazole treatment at day 5 in control (gray) versus glutamine-free (yellow)
media, using cell-cycle-curve-fitting software (FLOJO, Treestar).
(D) Paired bars representing the percent S-phase fraction with nocodazole treatment of day 5 cultures in control (gray) versus glutamine-free (yellow) media.(legend continued on next page)
Cancer Cell
Glutamine Sensitivity Analysis
6 Cancer Cell 24, 1–16, October 14, 2013 ª2013 Elsevier Inc.
Please cite this article in press as: Timmerman et al., Glutamine Sensitivity Analysis Identifies the xCT Antiporter as a Common Triple-Negative BreastTumor Therapeutic Target, Cancer Cell (2013), http://dx.doi.org/10.1016/j.ccr.2013.08.020
Cancer Cell
Glutamine Sensitivity Analysis
Please cite this article in press as: Timmerman et al., Glutamine Sensitivity Analysis Identifies the xCT Antiporter as a Common Triple-Negative BreastTumor Therapeutic Target, Cancer Cell (2013), http://dx.doi.org/10.1016/j.ccr.2013.08.020
with glutamine consumption (Figure 2G, p = 0.13) or hGAC
expression (Figure 2H, p = 0.014). We conclude that historical
correlations between these parameters are not applicable to
breast tumors.
Restriction Induces S-Phase Stalling in a Subset ofTNBCGrowth curves of the most restriction-sensitive tumors (Fig-
ure 2A, ‘‘glutamine sensitive’’ underbar) revealed cultures that
(1) continued expansion, similar to HMECd; (2) did not signifi-
cantly expand; and (3) decreased (Figure 3A). Groups B and C
(B+C) include two ER+ (luminal) and 11 TNBC (three basal, eight
claudin low) independently derived samples, including the four
claudin low cells that consume little glutamine (Figures 1D,
black). Group C cells increase Annexin V reactivity (Figure 3B)
and apoptotic figures (Figure S3A) on days 2–4 of restriction.
Thus approximately one-half of our TNBC lines are unable to sur-
vive or expand without glutamine.
We tested whether the few live cells in day 5 group B+C
cultures had arrested in G1, reasoning that they might survive
glutamine restriction to seed tumor recurrences, discouraging
development of glutamine-restricting therapeutics. In complete
media, nocodazole treatment increased G2/M and late S-phase
fractions of all samples tested, demonstrating transit to and acti-
vation of an intact mitotic checkpoint (Figure 3C, gray bars; late
S-phase data not shown; Figure S3B). Glutamine-free cultures of
group A exemplars exhibited similar G2/M increases (gray
versus yellow bars), but not group B or C samples. The un-
changed S-phase fractions rule out G1 arrest by group B+C
samples (Figure 3D, paired gray versus yellow bars). Their cell
cycle profiles are identical with or without nocodazole treatment
(Figure S3C), indicating S-phase stalling, with reduced total and
phosphorylated retinoblastoma proteins similar to S-phase
stalling in DNA damage responses (Figure 3E, Knudsen et al.,
2000). However, like glutamine-restricted Myc-transformed
fibroblasts, gH2A.X phosphorylation is not increased, indicating
that the intra-S-phase DNA damage checkpoint remains inactive
(data not shown; Yuneva et al., 2007). Culture confluence
reduces the S-phase content and glutamine sensitivity of all
but two group C samples (Figure 3F, colored versus gray
icons). However, group B+C samples are not simply the most
rapidly dividing cells (Figure 3G; t tests: all versus C+B, p =
0.11; all basal and claudin low versus C+B, p = 0.2), indicating
that they harbor specific defects that make them unable to
surmount restriction.
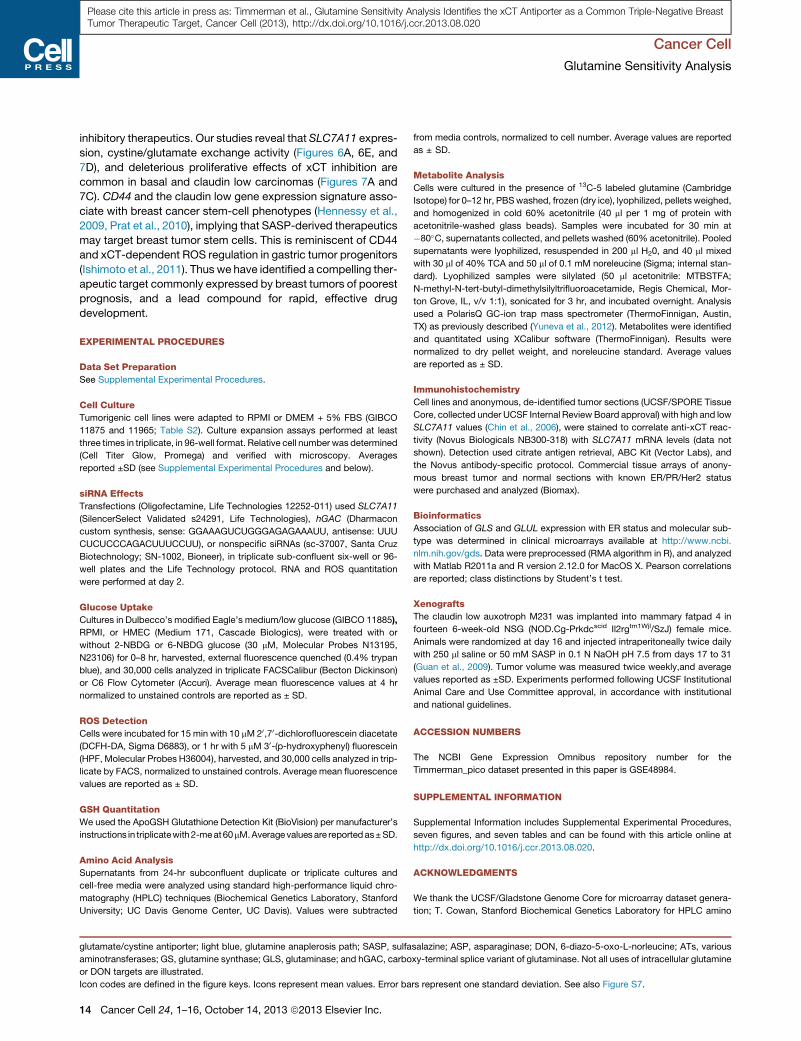
Known Regulators of Glutamine Metabolism Do NotIdentify Group B or C CellsWe tested proposals that hGAC and GLUL identified glutamine-
dependent cells. While hGAC statistically identifies group C (p =
5.6 3 10�9) and group B+C (p = 0.008) cells, only 9/13 (69%)
samples expressing higher hGAC than HMECd cells are group
(E) S-phase stalling is accompanied by a decrease in total and serine 780 phosp
(F) Culture confluence reduces S-phase fractions and glutamine sensitivity; S-pha
(gray icons) versus low density culture (colored icons); paired icons connected b
(G) Doubling time (from Figure 1C) versus glutamine-free culture sizes (from Figu
Icon codes are defined in the figure keys. Icons represent mean values. Error ba
See also Figure S3.
B or C (Figure 4A, above upper dotted line), and these levels
are similar to purified normal epithelia (green squares). hGAC
also poorly discerns group C (p = 0.03) or B+C (p = 0.17) from
all other TNBC. While GLUL levels correlate with restricted cul-
ture sizes (Figure 4B; p = 0.005–2.33�4, three probeset IDs; Fig-
ure S4A),GLUL also more accurately discerns luminal from clau-
din low samples (Figure 4B; p = 1.9 3 10�5). At lower p values,
GLUL discerns luminal from all basal + claudin low (p = 2.5 3
10�5 to 1.9 3 10�4), or ER+ from ER� (p = 4.4 3 10�3 to 1.2 3
10�2) cell lines, and samples in seven of eight clinical expression
data sets (Figure 4C; Table S4). Most group B+C cells express
less GLUL than normal samples (Figure 4D), but low expression
is not unique to group B+C (gray circles below lower dotted line).
Nor can GLUL discern group C (p = 0.20–0.67) or B+C samples
(p = 0.015–0.09) from other TNBC. Thus, hGAC and GLUL are
not strong biomarkers for group B or C type tumors.
OncogenicMyccandrive glutamineuptake anddependence in
exemplar fibroblasts and glioma (Wise et al., 2008; Gao et al.,
2009; Yuneva et al., 2007). CMYC is enriched in our basal and
claudin low cells (p = 0.013). But neither CMYC, other Myc family
members, or core MYC expression signature genes (Chandriani
et al., 2009) are differentially expressed in group C or group
B+Ccells versusotherbasal +claudin lowcells (FigureS4B;Table
S5).Wealso foundnocorrelationbetweenTP53mutational status
andgroupBorCmembershipusing the IARCTP53database (see
Supplemental Experimental Procedures, p = 0.7; http://p53.iarc.
fr/CellLines.aspx). Significanceanalysis contrastinggeneexpres-
sion in thegroupCorB+Csamplesversusotherbasal andclaudin
low TNBC did not identify potential biomarkers or offer molecular
explanations for S-phase stalling (data not shown).
Group B and C Carcinomas Are Glutamine AuxotrophsGlutamine restriction reduces hGAC and GLUL mRNA levels in
low-density cultures, while producing little change in GS protein
levels (Figures 4E, 4F, S4C, and S4D). Confluent cultures can
induce GLUL mRNA (Figure 4E, e.g., M435), suggesting one
mechanism for their starvation resistance. But we conclude
that proliferating breast tumors cannot induce GLUL to escape
glutamine restriction.
Titrations of 17 common carbon sources over four concentra-
tion logs were tested for rescue of an exemplar group C carci-
noma (M436) from glutamine restriction (Figure S4E). Neither
these nor nitrogen sources, ammoniumchloride, choline chloride,
or putrescine, improved cultures (Figure S4F). Only glutamate (2-
to 3-fold), oxaloacetate (2%–6%), and dimethyl 2-ketoglutarate
(2%–10%; Figure S4G) increased ATP values slightly; however,
only glutamate increased viable cell numbers in multiple group
C cell lines (4%–6%; Figure S4H). Combining GS substrates,
glutamate and nitrogen sources, did not further improve cultures
(FigureS4I).Weconclude it unlikely that other commonlyavailable
nutrients can substitute for glutamine during restriction, and that
the group C+B tumors are functional glutamine auxotrophs.
horylated retinoblastoma protein.
se decrease (D%) is the decrease in percent S-phase with high density culture
y dashed lines represent a single cell line.
re 2H).
rs represent one standard deviation.
Cancer Cell 24, 1–16, October 14, 2013 ª2013 Elsevier Inc. 7

5
4
3
2
1
0Q
DensityM435 M231 M436 H100M175
+ +L C
+ +L C
+ +L C
+ +L C
+ +L C
+ +L C
Hs578tGroup
BGroup CGroup
A
E
Rel
ativ
e G
LUL
mR
NA
Le
vels
(da
y 3)
Other tumorigenic
Group BGroup C
Non-tumorigenic Purified Normal
D
5
4
6
7
8
9
10
0 20 40 60 80 100 120
GLU
L E
xpre
ssio
n (lo
g 2)
Glutamine-free Culture Size(% control at day 5)
0 20 40 60 80 100 1204
5
6
7
8
9
10
BLuminalBasalClaudin Low
GLU
L E
xpre
ssio
n (lo
g 2) Non-tumorigenic
Purified Normal
Glutamine-free Culture Size (% control at day 5)
8
9
10
11
12
13
GSE2034
GSE20271
GSE23988
GSE4922
GSE1456
GSE7390
Chin 2006
p-value 1.3x10⁻¹⁵
4.0x10⁻⁸
4.7x10⁻⁶
1.0x10⁻⁶
4.9x10⁻¹⁰
1.7x10⁻⁹
8.6x10⁻⁷
2.7x10⁻¹⁰
ER−ER+BasalLuminal
C
GLU
L E
xpre
ssio
n (lo
g 2)
5
4
6
3
2
1
0
F
QDensity
M435 M231 M436 H100M175
+ +L C
BT549
+ +L C
+ +L C
+ +L C
+ +L C
+ +L C
+ +L C
Hs578t
Group B Group CGroup A
Rel
ativ
e hG
AC
mR
NA
Le
vels
(da
y 3)
3
4
5
6
7
8
0 20 40 60 80 100 120
hGA
C E
xpre
ssio
n (lo
g 2)
Glutamine-free Culture Size (% control at day 5)
A Other tumorigenic
Group BGroup C
Non-tumorigenic Purified Normal
Figure 4. Common Regulators of Glutamine Metabolism Do Not Identify Auxotrophic Cells
(A) hGAC GeneChip hybridization signal (log2) versus glutamine-free culture sizes (from Figure 2H) coded as restriction groups B and C versus others.
(B) GLUL GeneChip hybridization signal (log2) versus day 5 glutamine-free culture sizes, coded by molecular subtype.
(C) GLUL expression by basal versus luminal or ER+ versus ER� samples in eight clinical breast tumor expression data sets, downloaded from NCBI GEO and
Chin 2006 (Chin et al., 2006); t test p values are below paired boxplots. Error bars encompass highest and lowest values.
(D) Correlation of glutamine-free culture sizes and GLUL expression as in (B), but coded by restriction groups.
(E and F) Comparison of (E)GLUL and (F) hGACmRNA levels at day 3 in glutamine replete versus deficient media, from quantitative PCR analysis. L, low density;
C, confluent; and Q, glutamine.
Icon codes are defined in the figure keys. Green squares, average hybridization signals from three CD10+ and three BerEP4+ purified normal breast samples.
Icons represent mean values. Error bars represent one standard deviation. Dotted lines bracket proliferating, nontumorigenic sample values.
See also Figure S4 and Tables S4 and S5.
Cancer Cell
Glutamine Sensitivity Analysis
8 Cancer Cell 24, 1–16, October 14, 2013 ª2013 Elsevier Inc.
Please cite this article in press as: Timmerman et al., Glutamine Sensitivity Analysis Identifies the xCT Antiporter as a Common Triple-Negative BreastTumor Therapeutic Target, Cancer Cell (2013), http://dx.doi.org/10.1016/j.ccr.2013.08.020

6
7
8
9
10
11B
Gen
echi
p H
ybrid
izat
ion
Sig
nals
fo
r B
asal
Clin
ical
sam
ples
(lo
g 2)
ASCT2 SLC3A2
SLC38A1
SLC38A2
SLC7A5
10
8
6
4
A G
enec
hip
Hyb
ridiz
atio
n S
igna
ls
for
Aux
otro
phic
Cel
ls (
log 2
)
ASCT2 SLC3A2
SLC38A1
SLC38A2
SLC7A5
Cul
ture
Siz
e (%
con
trol
)
E
020
40
60
80
100
120
1 D0234567
Asp (D0 = 100 u/ml)(IC50 = 0.08 u/ml)
Pac (D0 = 500 ng/ml)(IC50 = 16 u/ml)
Dox (D0 = 125 ng/ml)(IC50 = 15.6 u/ml)
Dilution (x4)
Cul
ture
Siz
e (%
con
trol
siR
NA
)
LuminalBasalClaudin LowNon-tumorigenic
0 20 40 60 80 100 1200.01
0.1
1
10
100
Glutamine-free Culture Size(% control at day 5)
D>100
Asp
arag
inas
e IC
50 (
units
/ml)
si hGAC
Other tumorigenic
Group BGroup C
Non-tumorigenic
Group A
Asp
arag
inas
e IC
85 (
units
/ml)
DON IC85 (mM)10-1 10110-210-310-4 1
1
0.1
10
100
>100
C
F
Glutamine
GLS/hGAC
(80 / 7 / 13)
AspartateMalate
Oxaloacetate
α-ketoglutarateCitrate
(0 / 70 / 30)
Acetyl-CoAPyruvate
Glucose
(38 / 35 / 26)(38 / 36 / 26)
G
ATs / GLUD2
Group C
Glutamate(46 / 27 / 28)
0
20
40
60
Malate Citrate Aspartate
Met
abol
ite A
bund
ance
(% c
ontr
ol m
edia
cul
ture
s)
12 hr Q-24 hr Q-
M43
6M
231
BT549
H1937
H
020406080
100120
Figure 5. Glutamine Auxotrophy Presents Therapeutic Opportunities
(A) GeneChip hybridization signals for four glutamine transporters and the common heavy chain (SLC3A2) in glutamine auxotrophic cells. Error bars encompass
highest and lowest values.
(B) GeneChip hybridization signals for transporters as in (A), for basal carcinoma subsets of clinical data sets downloaded from NCBI GEO and Chin 2006 (Chin
et al., 2006), one example data set shown. Error bars encompass highest and lowest values.
(C) Relative asparaginase (y axis), and DON (x axis) sensitivities (IC85) of our cell panel, coded by restriction groups B and C versus others. Dotted line, as-
paraginase concentration used to kill sensitive leukemia cells in vitro (1 u/ml).
(D) Day 5 glutamine-free culture sizes (from Figure 2A) versus asparaginase sensitivity (IC50 shown).
(E) Four-fold drug titrations and calculated IC50s for an exemplar group C auxotroph (M436). D0, highest drug concentration and calculated IC50s in figure key;
Asp, asparaginase; Pac, paclitaxel; and Dox, doxorubicin.(legend continued on next page)
Cancer Cell
Glutamine Sensitivity Analysis
Cancer Cell 24, 1–16, October 14, 2013 ª2013 Elsevier Inc. 9
Please cite this article in press as: Timmerman et al., Glutamine Sensitivity Analysis Identifies the xCT Antiporter as a Common Triple-Negative BreastTumor Therapeutic Target, Cancer Cell (2013), http://dx.doi.org/10.1016/j.ccr.2013.08.020

Cancer Cell
Glutamine Sensitivity Analysis
Please cite this article in press as: Timmerman et al., Glutamine Sensitivity Analysis Identifies the xCT Antiporter as a Common Triple-Negative BreastTumor Therapeutic Target, Cancer Cell (2013), http://dx.doi.org/10.1016/j.ccr.2013.08.020
Glutamine Auxotrophy Presents TherapeuticOpportunitiesWe tested three approaches to therapeutic development target-
ing auxotrophic TNBC: preventing glutamine access, inhibiting
glutamine-dependent enzymes, and inhibiting activities
requiring glutamine metabolites. Auxotrophs (Figure 5A) and
basal carcinoma subsets in clinical microarray data sets
(Figure 5B, example; Table S6) expressmultiple glutamine trans-
porters. Thus we prevented glutamine access by treating
cultures with the leukemia therapeutic asparaginase, reducing
asparagine and glutamine to their acidic derivatives (Figure S5A;
Narta et al., 2007). This produced an apparent synthetic lethality
at concentrations equal to that of leukemia in all group C and in
approximately one-third of group B cells (Figure 5C, 85% inhib-
itory concentration [IC85] below dotted line; Asselin et al., 1989).
Correlated asparaginase sensitivities and glutamine-free culture
sizes (Figure 5D, p = 5.7 3 10�6; asparaginase IC84; p = 9.3 3
10�9, not shown) reveal that glutamine re-synthesis from the as-
paraginase products glutamate and ammonia is uncommon. We
propose that local asparaginase/glutaminase delivery would kill
auxotrophic tumors without requiring selective identification and
targeting of their potentially varied molecular defects. Cells
relatively resistant to paclitaxel or doxorubicin are exquisitely
asparaginase-sensitive, indicating that an asparaginase-like
therapeutic could become a critical, independent alternative
for drug-resistant tumors (Figure 5E).
Analysis of 13C-5-glutamine-derived metabolites in the group
C TNBC M436 (Figure 5F; Table S7) revealed that 80% of intra-
cellular glutamine is imported (all five carbon positions are 13C-
labeled). Approximately 40% of TCA cycle metabolites and their
derivatives are directly produced from this pool, and another
one-third (27%–30%) are partially 13C-labeled. Glutamine re-
striction depletes these pools (Figure 5G), suggesting that inhibi-
tion of glutaminase (GLS/hGAC) or aminotrasferases (ATs) might
kill or slow growth of the auxotrophs. siRNA-mediated reduction
of hGAC-attenuated culture expansion of auxotrophs with high
glutamine consumption rates (Figure 5H, M436, M231; Fig-
ure S5B), but provided little efficacy against BT549, an auxo-
troph that consumes little glutamine (Figure 1D), or H1937, a
group A TNBC. In comprehensive tests, treatment with a broad
spectrum inhibitor of amidotransferases including GLS
(6-diazo-5-oxo-L-norleucine; DON; reviewed in Souba, 1993)
placed auxotrophs among the most sensitive samples (Fig-
ure 5C). We propose that inhibitors of single DON targets should
be refined for use against auxotrophic TNBC.
Glutamine Is Required for ROS Control in TNBCFinally, we tested the strategy of inhibiting an activity that re-
quires glutamine metabolites. In the normal human fibroblast
IMR-90, one-third of glutamine uptake supplies glutamate for
xCT exchange activity (Bannai and Ishii, 1988). Analysis of amino
acid consumption revealed highly correlated cystine depletion
(F) TCA cycle diagram illustrating respiratory use of glutamine in red arrows.
metabolite that contains (all/several/no) 13C-carbons derived from culture with 13
(G) Decrease in key TCA cycle metabolite pools with glutamine restriction, expre
(H) Proliferative effects of siRNA-mediated hGAC mRNA reduction in exemplar c
Icon codes are defined in the figure keys. Icons represent mean values. Error ba
See also Figure S5 and Tables S6 and S7.
10 Cancer Cell 24, 1–16, October 14, 2013 ª2013 Elsevier Inc.
and glutamate secretion in 27 of our lines (Figure 6A, p = 8.8 3
10�11; Figure S6A), suggesting xCT activity. Glutamine restric-
tion strongly reduced exchange (Figure 6B), modestly decreased
GSH levels (Figure 6C) and increased intracellular ROS by at
least 30% in 8/19 TNBC (Figure 6D, light blue). This is partially
corrected by the ROS scavenger N-acetylcysteine (NAC) in 12/
13 samples (light gray). NAC does not allow culture expansion
(Figure S6B), thus, glutamine use for ROS control is common,
but other glutamine-influenced factors are also required for
auxotroph proliferation.
Wedirectly assessed the xCTexpression and function in TNBC
that was implied by the glutamine restriction effects on ROS.
Basal and claudin low lines overexpress the xCT exchange-spe-
cific subunit SLC7A11 (Figure 6E, p = 0.06–7.4 3 10�4; Fig-
ure S6C), the glutamate-cysteine ligase regulatory subunit of
glutathione synthase (arrow;GCLM, p = 0.011), and amembrane
interacting protein CD44 p = 0.005–5.9 3 10�8; Ishimoto et al.,
2011). Cystine consumption and SLC7A11 mRNA levels corre-
late (Figures 6F and S6D), and siRNA-mediated reduction of
SLC7A11 mRNA increases intracellular ROS (Figures 6G and
6H). SASP treatment reduces cystine/glutamate exchange and
GSH content (Figures 6B and 6C). 2-mercaptoethanol (2me) pro-
vides cystine asmixed 2me-cysteine disulfides (Ishii et al., 1981),
and normalizes GSH levels, demonstrating SASP specificity for
cystine and GSH production. In 18/19 TNBC, SASP increases
endogenous ROS by at least 50% (Figure 6D, teal bars), which
are reduced by NAC in 14/16 samples (dark gray bars). Using
reagents for specificROSspecies,we found that SASP increases
hydroxyl radicals, in keeping with the expected effects of GSH
depletion (Figure S6E; Franco et al., 2007). Thus, the xCT anti-
porter is commonly expressed and functional in TNBC. HMECd
expresses these genes (Figure 6E, columns ‘‘I’’), but xCT is
much less active (Figure 6A, green).
SASP Treatment Attenuates Tumor GrowthIn proliferation assays, we found that SASP treatment dramati-
cally reduces TNBC culture sizes with half-maximal inhibitory
concentration (IC50) values modestly correlated to cystine up-
take in complete media (Figure 7A, p = 0.07). Culture sizes are
significantly restored by NAC (Figure 7B) and not affected by
the active anti-inflammatory fragment of SASP, 5-aminosalicylic
acid (5-ASA; Figure S7A). Thus inhibition of cystine acquisition,
not anti-inflammatory activity, is responsible for TNBC prolifera-
tive sensitivity. This concentration range (0.2–0.7 mM) is not far
from serum concentrations measured in bowel inflammatory
patients (0.18 mM; Guastavino et al., 1988). Under normoxic
conditions (5% O2), SASP sensitivity increased 2- to 3-fold (Fig-
ure S7B), and SASP significantly slowed growth of an auxotro-
phic line xenograft (Figure 7C), indicating that xCT activity is
also critical for growth in vivo. Accordingly, 8/20 anonymous
TNBC clinical specimens strongly express xCT (Figure 7D
and S7C–S7K). TNBC can be treated with carboplatin, and
Numbers indicate mass spectroscopy determination of the percent of each
C-5-glutamine in M436.
ssed as percent control media cultures. Q�, glutamine-free media.
ell lines, expressed as a percent of transfection with a scrambled siRNA.
rs represent one standard deviation.

0
4
6
8
10
0 1 20 1
3
Glu
tam
ate
Sec
retio
n(n
mol
es /
cell
/ day
x10
-4)
LuminalBasalClaudin LowNon-tumorigenic
Cystine Consumption(nmoles / cell / day x 10-4)
BT549
HMLE
AU565
B474
184A1
M468
184B5M175
B483
Z1
CAMA1
M415
2
2
0
- 2-2
M436
H1569
H3153
H1143
BT20
Hs578t
H1954
M157
H1500
H100H38
M435
M453
H2185
M231
A
5
6
7
8
9
10F LuminalBasalClaudin LowNon-tumorigenic
4
BT549
HMLE
184A1
M468
184B5
M175
B483 Z1
M415H1569
H3153H1143
BT20
Hs578t
H1954
M231H1500
H38
M157
M453
B474AU565
M436
Cystine Consumption(nmoles / cell / day x 10-4)
SLC
7A11
Exp
ress
ion
(log 2
)
1 2 3
M435H100
CAMA1
H2185
0
GCLM
CD44
SLC7A11
Luminal PEN BasalI Claudin LowE
B
-4
-2
2
4
6
8
Cys Glu
0
Cys Glu
Control mediaGlutamine-freeControl +50 μM SASP Control +100 μM SASP Control +300 μM SASP
(nm
oles
/ ce
ll / d
ay x
10-
4 )
M436 M157 M15
7 G
luta
thio
ne C
onte
nt
(% c
ontr
ol m
edia
cul
ture
s)
020406080
100120
SASP2me
Q
C
0
100
200
300
0100
400
800SASP 300 + NAC
Glutamine-freeGlutamine-free + NAC
Group CGroup A Group B
DC
FH
DA
-Det
ecte
d R
OS
Lev
els
(% c
ontr
ol m
edia
)
D
SASP 300 μM
H11
43
H19
37
M46
8
M17
5
H19
54
H31
53
BT
20
H10
0
H15
00
H38
M23
1
M43
5
M43
6
BT
549
H15
69
Hs5
78t
M13
4
M15
7
M36
1
si Scramblesi SLC7A11
NAC
++
+
+++
02
4
6
8
10
12
G
M23
1 D
CF
H-D
A m
ean
fluor
esce
nce
(x10
4 )
si Scramblesi SLC7A11
++
++
+
++
0
20
40
60
80
100
H
SLC
7A11
mR
NA
Lev
els
(% c
ontr
ol m
edia
cul
ture
s)
Figure 6. Glutamine Restriction and xCT Inhibition Increase ROS
(A) Change in media cystine (x axis) and glutamate (y axis) concentrations of cells cultured 24 hr in control media.
(B) Twenty-four hr of glutamine restriction or SASP treatment reduces cystine/glutamate exchange by exemplar group C auxotrophs. cys, cystine and glu,
glutamate.
(C) Effects of 24-hr glutamine restriction or SASP treatment on GSH content in an exemplar group C TNBC; Q, glutamine-free media; SASP, SASP treatment in
complete media; and SASP + 2me, SASP treatment in the presence of beta-mercaptoethanol.
(D) ROS levels in basal carcinomas assessed with DCFHDA fluorescence, normalized to control media reactivity. Light blue, 2-day cultures in glutamine-
free media. Group averages: A, 112% ± 21; B, 121% ± 31; C, 162% ± 59; t test group A versus C, p = 0.07; and group A versus B+C, p = 0.074. Light gray,
(legend continued on next page)
Cancer Cell
Glutamine Sensitivity Analysis
Cancer Cell 24, 1–16, October 14, 2013 ª2013 Elsevier Inc. 11
Please cite this article in press as: Timmerman et al., Glutamine Sensitivity Analysis Identifies the xCT Antiporter as a Common Triple-Negative BreastTumor Therapeutic Target, Cancer Cell (2013), http://dx.doi.org/10.1016/j.ccr.2013.08.020

Cancer Cell
Glutamine Sensitivity Analysis
Please cite this article in press as: Timmerman et al., Glutamine Sensitivity Analysis Identifies the xCT Antiporter as a Common Triple-Negative BreastTumor Therapeutic Target, Cancer Cell (2013), http://dx.doi.org/10.1016/j.ccr.2013.08.020
carboplatin + SASP reduces the carboplatin IC50 in 13/14 of our
TNBC samples (Figure 7E).We propose that SASP be derived for
clinical use.
DISCUSSION
Rodent breast tumors (Erlich Ascites series) were instrumental in
the definition of central metabolic pathways and tumor-specific
aberrations, but work in human breast tumors is largely limited
to aspects of fatty acid metabolism (see Menendez and Lupu,
2007). Reports of other metabolic features are less frequent
and use only one or a few samples, producing biased conclu-
sions due, for example, to the mistaken use claudin low lines
to represent typical TNBC; misidentification of GeneChip probe-
set IDs that are hGAC splice variant specific as reporting total
GLS mRNA; the lack of gene expression comparisons between
tumors and normal breast epithelia; and the inability to directly
compare nontumorigenic breast derivative and tumorigenic
behaviors (for examples, see Collins et al., 1998; Kung et al.,
2011; Simpson et al., 2012). Our data clarify these misunder-
standings and provide a detailed nutrient utilization portrait of
a comprehensive organ site-specific tumor collection, contrast-
ing gene expression and functional assays to define common
nutrient utilization patterns and responses to drugs that leverage
associated metabolic activities.
Historically Associated Metabolic Features VarySubstantially in Breast CancerDoubling time, glutamine consumption, and glutamine reliance
are historically correlated. Among this triad, only doubling time
and glutamine-free culture sizes modestly correlate across our
large sample collection (Figure 3G, p = 0.002). However, the
glutamine auxotrophs are not simply the most rapidly dividing
samples. Nor are they the largest glutamine consumers; four of
eight auxotrophic, claudin low samples consume no more gluta-
mine than proliferating nontumorigenic cells (Figure 1D, black tri-
angles: BT549, H38, H100, M157). Glutamine can be cycled by
import via ASCT2 and export in exchange for essential amino
acids via the LAT1/4f2hc antiporter (SLC7A5/SLC3A2, Figure 7F,
dark blue arrows; Nicklin et al., 2009). Our four low glutamine
consumers express all antiporter components (Figure 5A), and
glutamate cycling would not deplete measured ambient gluta-
mine levels. Thus, these cells may require glutamine to fuel
both this exchange activity and the xCT antiporter and use rela-
tively less glutamine for respiration. This may explain the relative
proliferative resistance to siRNA-mediated reduction of hGAC
seen in BT549 (Figure 5H). Differences between glutamine
cycling and catabolismmay also partially explain historically var-
iable correlations between glutamine uptake and glutamine reli-
ance in other tumors.
glutamine-free media +NAC. Teal, cultures treated 24 hr with SASP. Group avera
0.019; and group A versus B+C, p = 0.003. Dark gray, SASP +NAC.
(E) Heatmap of genes involved in xCT function: red, increased and green, decreas
nontumorigenic cell lines; and PE, ER+ tumor cells purified from pleural effusions
(F) SLC7A11 GeneChip hybridization signal (log2) versus cystine consumption, ic
(G) ROS levels in M231, 48 hr after targeting SLC7A11 or a scrambled siRNA, in
(H) SLC7A11 knockdown efficiency of siRNAs used in (G).
Icon codes are defined in the figure keys. NAC, N-acetylcystine and SASP, su
deviation. Amino acid quantitation obtained with HPLC. See also Figure S6.
12 Cancer Cell 24, 1–16, October 14, 2013 ª2013 Elsevier Inc.
Conversely, auxotrophs of high glutamine consumption (Fig-
ure 1D; M436) that require glutamine as a major respiratory
fuel (Figures 5F and 5G; Figure 7F, light blue arrows) and for
glutamate/cystine exchange (Figures 6B and 7F, gray arrows),
may be more susceptible to inhibition of hGAC (Figure 5H;
M436, M231) and subordinate glutamate-dependent activities
such as aminotransferases (ATs; Thornburg et al., 2008). Thus
within a single tumor cell line, multiple critical requirements for
glutamine may exist and provide multiple therapeutic targets,
either individually or in combination. We hypothesize that xCT
inhibition may be further potentiated by limiting glutamate avail-
ability (Figure 7F).
Historically Proposed Genetic Indicators of GlutamineReliance Do Not Define AuxotrophyWith the resurgent interest in tumor metabolism, metabolic
genes such as GLS and GLUL have been re-asserted as poten-
tial therapeutic targets and biomarkers, but we find that thera-
peutic relevance is not so easily defined. Gene expression may
suggest metabolic behaviors that are more likely active in
specific tumor groups, such as a statistical association of
hGAC with high glutamine consumption in basal and claudin
low versus luminal tumors (Figures 1F). However, neither hGAC
nor GLUL defines high glutamine consumption or identifies the
true auxotrophic group B and/or C cells with appropriate sensi-
tivity to be considered independent clinical biomarkers. We also
find that responses to interruption of ongoingmetabolic activities
can vary substantially due to unknown cell-intrinsic factors. For
example, individual tumors can respond to glutamine restriction
by slowing culture expansion or stalling in S-phase and dying
(Figures 3A–3C). Molecular explanation(s) for S-phase stalling
remain unclear and may be due to tumor defects far removed
from direct glutamine interaction.
xCT Is a Compelling Therapeutic Target forTriple-Negative TumorsInhibitor and RNAi studies reveal xCT induction as the dominant
means of increasing cystine acquisition to accelerate GSH syn-
thesis (reviewed in Lo et al., 2008a). Thus xCTmay be a target for
cell-specific GSH depletion, because SASP and other xCT inhib-
itors can slow growth of exemplar cell lines in xenograft without
significant effects on other organs and can cooperate with che-
motherapeutics such as cisplatin (Okuno et al., 2003), geldana-
mycin (Huang et al., 2005), doxorubicin (Narang et al., 2007),
and gemcitabine (Lo et al., 2008b). Currently, the SASP structure
is labile, designed to be cleaved by enteric bacteria to release an
active anti-inflammatory fragment. It is also insoluble in aqueous
solutions and not optimized for the fortuitous interaction with
xCT. Thus while direct clinical applications to TNBC are unreal-
istic, SASP is a strong lead compound for development of xCT
ges; A, 205% ± 43; B, 287% ± 62; C, 405% ± 168; t test group A versus C, p =
ed; N, purified normal CD10+ and BerEp4+ breast epithelial cells; I, proliferating
.
ons coded by molecular subtype.
the presence or absence of N-acetylcystine (NAC).
lfasalazine. Icons represent mean values. Error bars represent one standard

A
0
0.2
0.4
0.6
0.8
1.0
0.5 1.0 1.5 2.0 2.5
SA
SP
IC50
(m
M)
Cystine Consumption(nmoles / cell / day x10-4)
r = -0.5p = 0.07Other TNBC
Group BGroup C
H1569
H1500H1954
M231
H1143
Hs578t
HCC38
H100 M157
H3153BT20 M435
B
0
20
40
60
80
100
Cul
ture
Siz
e (%
con
trol
at d
ay 5
)
+ 33.3 mM NAC+ 11.1 mM NAC+ 3.7 mM NAC+ 1.2 mM NAC
SASP 0.3 mM
Group C
Group A
Group B
BT549H3153 Hs578t
C
SASPSaline
0
100
200
300
400
500
600
700
800
900
16 17 20 23 27 30 31
Treatment Start
Days Post-Implantation
Tum
or V
olum
e (m
m3 )
IC50 (μg/ml)1
Gro
up C
Gro
up
AG
roup
B
QIn
sens
.Basal Carboplatin IC50
+ SASP 0.3 mMCl. Low Carboplatin IC50
+ SASP 0.3 mM
E
M436
H1500
M468
H38
BT20
H100
Hs578t
M231
M435
H1143
H3153
H1954
H1937
M157
0.001 0.01 0.1 10 100
D
50μm
50μm
Glutamine
GLShGAC
GSASP
Cystine
Leucine
Glutamate Glutamate
xCT
LAT1
ASCT2
CystineGlutathione
ATs
2-KG TCA Cycle/
Respiration
DONGlutamine
Protein
Nucleotide
SASPFree
Radicals
F
Cysteine
Extracellular Intracellular
GLUD2
p= 0.006
p= 0.012
p= 0.011
p= 0.002
Figure 7. SASP Attenuates Proliferation In Vitro and In Vivo
(A) Cystine consumption in complete media derived from HPLC analysis (x axis) versus SASP sensitivity (IC50).
(B) NAC treatment rescues SASP-induced culture size defects in an exemplar cell from each restriction group A–C.
(C) SASP treatment attenuates xenograft growth; group average tumor volumes separation p values noted on graph.
(D) Examples of xCT expression in exemplar human TNBC tumor sections. Nuclei, blue and xCT-specific HRP signal, brown; upper positive, lower negative.
(E) SASP reduces the carboplatin IC50 of most basal TNBC; paired icons connected by dashed lines represent a single TNBC. Colored icons, carboplatin IC50;
gray icons, IC50 of carboplatin plus 300 mM SASP; and Q insens., basal TNBC with less glutamine-sensitivity than non-tumorigenic cells.
(F) Summary of discussed glutamine catabolic activities. Red, compounds tested in this manuscript; green, activities with potential therapeutic
inhibitory importance in glutamine-avid TNBC; dark blue, LAT1 glutamine/leucine antiporter and ASCT2, system ASC glutamine transporter; gray, xCT, the
(legend continued on next page)
Cancer Cell
Glutamine Sensitivity Analysis
Cancer Cell 24, 1–16, October 14, 2013 ª2013 Elsevier Inc. 13
Please cite this article in press as: Timmerman et al., Glutamine Sensitivity Analysis Identifies the xCT Antiporter as a Common Triple-Negative BreastTumor Therapeutic Target, Cancer Cell (2013), http://dx.doi.org/10.1016/j.ccr.2013.08.020
Cancer Cell
Glutamine Sensitivity Analysis
Please cite this article in press as: Timmerman et al., Glutamine Sensitivity Analysis Identifies the xCT Antiporter as a Common Triple-Negative BreastTumor Therapeutic Target, Cancer Cell (2013), http://dx.doi.org/10.1016/j.ccr.2013.08.020
inhibitory therapeutics. Our studies reveal that SLC7A11 expres-
sion, cystine/glutamate exchange activity (Figures 6A, 6E, and
7D), and deleterious proliferative effects of xCT inhibition are
common in basal and claudin low carcinomas (Figures 7A and
7C). CD44 and the claudin low gene expression signature asso-
ciate with breast cancer stem-cell phenotypes (Hennessy et al.,
2009, Prat et al., 2010), implying that SASP-derived therapeutics
may target breast tumor stem cells. This is reminiscent of CD44
and xCT-dependent ROS regulation in gastric tumor progenitors
(Ishimoto et al., 2011). Thus we have identified a compelling ther-
apeutic target commonly expressed by breast tumors of poorest
prognosis, and a lead compound for rapid, effective drug
development.
EXPERIMENTAL PROCEDURES
Data Set Preparation
See Supplemental Experimental Procedures.
Cell Culture
Tumorigenic cell lines were adapted to RPMI or DMEM + 5% FBS (GIBCO
11875 and 11965; Table S2). Culture expansion assays performed at least
three times in triplicate, in 96-well format. Relative cell number was determined
(Cell Titer Glow, Promega) and verified with microscopy. Averages
reported ±SD (see Supplemental Experimental Procedures and below).
siRNA Effects
Transfections (Oligofectamine, Life Technologies 12252-011) used SLC7A11
(SilencerSelect Validated s24291, Life Technologies), hGAC (Dharmacon
custom synthesis, sense: GGAAAGUCUGGGAGAGAAAUU, antisense: UUU
CUCUCCCAGACUUUCCUU), or nonspecific siRNAs (sc-37007, Santa Cruz
Biotechnology; SN-1002, Bioneer), in triplicate sub-confluent six-well or 96-
well plates and the Life Technology protocol. RNA and ROS quantitation
were performed at day 2.
Glucose Uptake
Cultures in Dulbecco’s modified Eagle’s medium/low glucose (GIBCO 11885),
RPMI, or HMEC (Medium 171, Cascade Biologics), were treated with or
without 2-NBDG or 6-NBDG glucose (30 mM, Molecular Probes N13195,
N23106) for 0–8 hr, harvested, external fluorescence quenched (0.4% trypan
blue), and 30,000 cells analyzed in triplicate FACSCalibur (Becton Dickinson)
or C6 Flow Cytometer (Accuri). Average mean fluorescence values at 4 hr
normalized to unstained controls are reported as ± SD.
ROS Detection
Cells were incubated for 15 min with 10 mM 20,70-dichlorofluorescein diacetate
(DCFH-DA, Sigma D6883), or 1 hr with 5 mM 30-(p-hydroxyphenyl) fluorescein(HPF, Molecular Probes H36004), harvested, and 30,000 cells analyzed in trip-
licate by FACS, normalized to unstained controls. Average mean fluorescence
values are reported as ± SD.
GSH Quantitation
We used the ApoGSH Glutathione Detection Kit (BioVision) per manufacturer’s
instructions in triplicatewith2-meat60mM.Averagevaluesare reportedas±SD.
Amino Acid Analysis
Supernatants from 24-hr subconfluent duplicate or triplicate cultures and
cell-free media were analyzed using standard high-performance liquid chro-
matography (HPLC) techniques (Biochemical Genetics Laboratory, Stanford
University; UC Davis Genome Center, UC Davis). Values were subtracted
glutamate/cystine antiporter; light blue, glutamine anaplerosis path; SASP, sulfa
aminotransferases; GS, glutamine synthase; GLS, glutaminase; and hGAC, carbo
or DON targets are illustrated.
Icon codes are defined in the figure keys. Icons represent mean values. Error ba
14 Cancer Cell 24, 1–16, October 14, 2013 ª2013 Elsevier Inc.
from media controls, normalized to cell number. Average values are reported
as ± SD.
Metabolite Analysis
Cells were cultured in the presence of 13C-5 labeled glutamine (Cambridge
Isotope) for 0–12 hr, PBSwashed, frozen (dry ice), lyophilized, pellets weighed,
and homogenized in cold 60% acetonitrile (40 ml per 1 mg of protein with
acetonitrile-washed glass beads). Samples were incubated for 30 min at
�80�C, supernatants collected, and pellets washed (60% acetonitrile). Pooled
supernatants were lyophilized, resuspended in 200 ml H20, and 40 ml mixed
with 30 ml of 40% TCA and 50 ml of 0.1 mM noreleucine (Sigma; internal stan-
dard). Lyophilized samples were silylated (50 ml acetonitrile: MTBSTFA;
N-methyl-N-tert-butyl-dimethylsilyltrifluoroacetamide, Regis Chemical, Mor-
ton Grove, IL, v/v 1:1), sonicated for 3 hr, and incubated overnight. Analysis
used a PolarisQ GC-ion trap mass spectrometer (ThermoFinnigan, Austin,
TX) as previously described (Yuneva et al., 2012). Metabolites were identified
and quantitated using XCalibur software (ThermoFinnigan). Results were
normalized to dry pellet weight, and noreleucine standard. Average values
are reported as ± SD.
Immunohistochemistry
Cell lines and anonymous, de-identified tumor sections (UCSF/SPORE Tissue
Core, collected under UCSF Internal Review Board approval) with high and low
SLC7A11 values (Chin et al., 2006), were stained to correlate anti-xCT reac-
tivity (Novus Biologicals NB300-318) with SLC7A11 mRNA levels (data not
shown). Detection used citrate antigen retrieval, ABC Kit (Vector Labs), and
the Novus antibody-specific protocol. Commercial tissue arrays of anony-
mous breast tumor and normal sections with known ER/PR/Her2 status
were purchased and analyzed (Biomax).
Bioinformatics
Association of GLS and GLUL expression with ER status and molecular sub-
type was determined in clinical microarrays available at http://www.ncbi.
nlm.nih.gov/gds. Data were preprocessed (RMA algorithm in R), and analyzed
with Matlab R2011a and R version 2.12.0 for MacOS X. Pearson correlations
are reported; class distinctions by Student’s t test.
Xenografts
The claudin low auxotroph M231 was implanted into mammary fatpad 4 in
fourteen 6-week-old NSG (NOD.Cg-Prkdcscid Il2rgtm1Wjl/SzJ) female mice.
Animals were randomized at day 16 and injected intraperitoneally twice daily
with 250 ml saline or 50 mM SASP in 0.1 N NaOH pH 7.5 from days 17 to 31
(Guan et al., 2009). Tumor volume was measured twice weekly,and average
values reported as ±SD. Experiments performed following UCSF Institutional
Animal Care and Use Committee approval, in accordance with institutional
and national guidelines.
ACCESSION NUMBERS
The NCBI Gene Expression Omnibus repository number for the
Timmerman_pico dataset presented in this paper is GSE48984.
SUPPLEMENTAL INFORMATION
Supplemental Information includes Supplemental Experimental Procedures,
seven figures, and seven tables and can be found with this article online at
http://dx.doi.org/10.1016/j.ccr.2013.08.020.
ACKNOWLEDGMENTS
We thank the UCSF/Gladstone Genome Core for microarray dataset genera-
tion; T. Cowan, Stanford Biochemical Genetics Laboratory for HPLC amino
salazine; ASP, asparaginase; DON, 6-diazo-5-oxo-L-norleucine; ATs, various
xy-terminal splice variant of glutaminase. Not all uses of intracellular glutamine
rs represent one standard deviation. See also Figure S7.

Cancer Cell
Glutamine Sensitivity Analysis
Please cite this article in press as: Timmerman et al., Glutamine Sensitivity Analysis Identifies the xCT Antiporter as a Common Triple-Negative BreastTumor Therapeutic Target, Cancer Cell (2013), http://dx.doi.org/10.1016/j.ccr.2013.08.020
acid analysis; R. Higashi, CREAM, University of Louisville, for mass spectrom-
etry; the UCSF Preclinical Therapeutics Core for xenografts; and D. Albertson,
T. Tlsty, J. Korkola, and W. Kinlaw for valuable manuscript critiques. Support
was provided by the National Institutes of Health, National Cancer Institute,
Bay Area Breast Cancer SPORE (P50 CA 58207), grant U54 CA 112970, the
Prospect Creek Foundation, the Durra Family Fund, the Mount Zion Health
Fund, and a Supporting Foundation of the Jewish Community Federation.
Received: October 14, 2012
Revised: March 21, 2013
Accepted: August 23, 2013
Published: October 3, 2013
REFERENCES
Alli, E., Sharma, V.B., Sunderesakumar, P., and Ford, J.M. (2009). Defective
repair of oxidative dna damage in triple-negative breast cancer confers sensi-
tivity to inhibition of poly(ADP-ribose) polymerase. Cancer Res. 69, 3589–
3596.
Asselin, B.L., Ryan, D., Frantz, C.N., Bernal, S.D., Leavitt, P., Sallan, S.E., and
Cohen, H.J. (1989). In vitro and in vivo killing of acute lymphoblastic leukemia
cells by L-asparaginase. Cancer Res. 49, 4363–4368.
Bannai, S., and Tateishi, N. (1986). Role of membrane transport in metabolism
and function of glutathione in mammals. J. Membr. Biol. 89, 1–8.
Bannai, S., and Ishii, T. (1988). A novel function of glutamine in cell culture:
utilization of glutamine for the uptake of cystine in human fibroblasts. J. Cell.
Physiol. 137, 360–366.
Chandriani, S., Frengen, E., Cowling, V.H., Pendergrass, S.A., Perou, C.M.,
Whitfield, M.L., and Cole, M.D. (2009). A core MYC gene expression signature
is prominent in basal-like breast cancer but only partially overlaps the core
serum response. PLoS ONE 4, e6693.
Chin, K., DeVries, S., Fridlyand, J., Spellman, P.T., Roydasgupta, R., Kuo,
W.L., Lapuk, A., Neve, R.M., Qian, Z., Ryder, T., et al. (2006). Genomic and
transcriptional aberrations linked to breast cancer pathophysiologies.
Cancer Cell 10, 529–541.
Coles, N.W., and Johnstone, R.M. (1962). Glutamine metabolism in Ehrlich
ascites-carcinoma cells. Biochem. J. 83, 284–291.
Collins, C.L., Wasa, M., Souba, W.W., and Abcouwer, S.F. (1998).
Determinants of glutamine dependence and utilization by normal and tumor-
derived breast cell lines. J. Cell. Physiol. 176, 166–178.
Curthoys, N.P., andWatford, M. (1995). Regulation of glutaminase activity and
glutamine metabolism. Annu. Rev. Nutr. 15, 133–159.
DeBerardinis, R.J., and Cheng, T. (2010). Q’s next: the diverse functions of
glutamine in metabolism, cell biology and cancer. Oncogene 29, 313–324.
DeBerardinis, R.J., Mancuso, A., Daikhin, E., Nissim, I., Yudkoff, M., Wehrli, S.,
and Thompson, C.B. (2007). Beyond aerobic glycolysis: transformed cells can
engage in glutamine metabolism that exceeds the requirement for protein and
nucleotide synthesis. Proc. Natl. Acad. Sci. USA 104, 19345–19350.
DeBerardinis, R.J., Lum, J.J., Hatzivassiliou, G., and Thompson, C.B. (2008).
The biology of cancer: metabolic reprogramming fuels cell growth and prolif-
eration. Cell Metab. 7, 11–20.
Dranoff, G., Elion, G.B., Friedman, H.S., Campbell, G.L., and Bigner, D.D.
(1985). Influence of glutamine on the growth of human glioma and medullo-
blastoma in culture. Cancer Res. 45, 4077–4081.
Elgadi, K.M.,Meguid, R.A., Qian,M., Souba,W.W., and Abcouwer, S.F. (1999).
Cloning and analysis of unique human glutaminase isoforms generated by
tissue-specific alternative splicing. Physiol. Genomics 1, 51–62.
Franco, R., Panayiotidis, M.I., and Cidlowski, J.A. (2007). Glutathione deple-
tion is necessary for apoptosis in lymphoid cells independent of reactive oxy-
gen species formation. J. Biol. Chem. 282, 30452–30465.
Gao, P., Tchernyshyov, I., Chang, T.C., Lee, Y.S., Kita, K., Ochi, T., Zeller, K.I.,
De Marzo, A.M., Van Eyk, J.E., Mendell, J.T., and Dang, C.V. (2009). c-Myc
suppression of miR-23a/b enhances mitochondrial glutaminase expression
and glutamine metabolism. Nature 458, 762–765.
Gatenby, R.A., and Gillies, R.J. (2004). Why do cancers have high aerobic
glycolysis? Nat. Rev. Cancer 4, 891–899.
Gout, P.W., Kang, Y.J., Buckley, D.J., Bruchovsky, N., and Buckley, A.R.
(1997). Increased cystine uptake capability associated with malignant pro-
gression of Nb2 lymphoma cells. Leukemia 11, 1329–1337.
Gout, P.W., Buckley, A.R., Simms, C.R., and Bruchovsky, N. (2001).
Sulfasalazine, a potent suppressor of lymphoma growth by inhibition of the
x(c)- cystine transporter: a new action for an old drug. Leukemia 15, 1633–
1640.
Guan, J., Lo, M., Dockery, P., Mahon, S., Karp, C.M., Buckley, A.R., Lam, S.,
Gout, P.W., and Wang, Y.Z. (2009). The xc- cystine/glutamate antiporter as a
potential therapeutic target for small-cell lung cancer: use of sulfasalazine.
Cancer Chemother. Pharmacol. 64, 463–472.
Guastavino, E., Litwin, N.H., Heffes Nahmod, L., and Licastro, R. (1988).
[Ulcerative colitis in children. Levels of salicylazosulfapyridine and sulfapyri-
dine during treatment]. Acta Gastroenterol. Latinoam. 18, 107–113.
Hamilton, D., and Batist, G. (2004). Glutathione analogues in cancer treatment.
Curr. Oncol. Rep. 6, 116–122.
Han, J., Chang, H., Giricz, O., Lee, G.Y., Baehner, F.L., Gray, J.W., Bissell,
M.J., Kenny, P.A., and Parvin, B. (2010). Molecular predictors of 3D morpho-
genesis by breast cancer cell lines in 3D culture. PLoS Comput. Biol. 6,
e1000684.
Hennessy, B.T., Gonzalez-Angulo, A.M., Stemke-Hale, K., Gilcrease, M.Z.,
Krishnamurthy, S., Lee, J.S., Fridlyand, J., Sahin, A., Agarwal, R., Joy, C.,
et al. (2009). Characterization of a naturally occurring breast cancer subset
enriched in epithelial-to-mesenchymal transition and stem cell characteristics.
Cancer Res. 69, 4116–4124.
Huang, Y., Dai, Z., Barbacioru, C., and Sadee, W. (2005). Cystine-glutamate
transporter SLC7A11 in cancer chemosensitivity and chemoresistance.
Cancer Res. 65, 7446–7454.
Iglehart, J.K., York, R.M., Modest, A.P., Lazarus, H., and Livingston, D.M.
(1977). Cystine requirement of continuous human lymphoid cell lines of normal
and leukemic origin. J. Biol. Chem. 252, 7184–7191.
Ishii, T., Hishinuma, I., Bannai, S., and Sugita, Y. (1981). Mechanism of growth
promotion of mouse lymphoma L1210 cells in vitro by feeder layer or 2-mer-
captoethanol. J. Cell. Physiol. 107, 283–293.
Ishimoto, T., Nagano, O., Yae, T., Tamada, M., Motohara, T., Oshima, H.,
Oshima, M., Ikeda, T., Asaba, R., Yagi, H., et al. (2011). CD44 variant regulates
redox status in cancer cells by stabilizing the xCT subunit of system xc(-) and
thereby promotes tumor growth. Cancer Cell 19, 387–400.
Jelluma, N., Yang, X., Stokoe, D., Evan, G.I., Dansen, T.B., and Haas-Kogan,
D.A. (2006). Glucose withdrawal induces oxidative stress followed by
apoptosis in glioblastoma cells but not in normal human astrocytes. Mol.
Cancer Res. 4, 319–330.
Jones, R.G., Plas, D.R., Kubek, S., Buzzai, M., Mu, J., Xu, Y., Birnbaum, M.J.,
and Thompson, C.B. (2005). AMP-activated protein kinase induces a p53-
dependent metabolic checkpoint. Mol. Cell 18, 283–293.
Knox, W.E., Linder, M., and Friedell, G.H. (1970). A series of transplantable rat
mammary tumors with graded differentiation, growth rate, and glutaminase
content. Cancer Res. 30, 283–287.
Knudsen, K.E., Booth, D., Naderi, S., Sever-Chroneos, Z., Fribourg, A.F.,
Hunton, I.C., Feramisco, J.R., Wang, J.Y., and Knudsen, E.S. (2000). RB-
dependent S-phase response to DNA damage. Mol. Cell. Biol. 20, 7751–7763.
Kovacevi�c, Z., and Morris, H.P. (1972). The role of glutamine in the oxidative
metabolism of malignant cells. Cancer Res. 32, 326–333.
Kovacevic, Z., and McGivan, J.D. (1983). Mitochondrial metabolism of gluta-
mine and glutamate and its physiological significance. Physiol. Rev. 63,
547–605.
Kung, H.N., Marks, J.R., and Chi, J.T. (2011). Glutamine synthetase is a
genetic determinant of cell type-specific glutamine independence in breast
epithelia. PLoS Genet. 7, e1002229.
Kvamme, E., and Svenneby, G. (1961). The effect of glucose on glutamine
utilization by Ehrlich ascites tumor cells. Cancer Res. 21, 92–98.
Cancer Cell 24, 1–16, October 14, 2013 ª2013 Elsevier Inc. 15

Cancer Cell
Glutamine Sensitivity Analysis
Please cite this article in press as: Timmerman et al., Glutamine Sensitivity Analysis Identifies the xCT Antiporter as a Common Triple-Negative BreastTumor Therapeutic Target, Cancer Cell (2013), http://dx.doi.org/10.1016/j.ccr.2013.08.020
Linder-Horowitz, M., Knox, W.E., and Morris, H.P. (1969). Glutaminase activ-
ities and growth rates of rat hepatomas. Cancer Res. 29, 1195–1199.
Lo, M., Wang, Y.Z., and Gout, P.W. (2008a). The x(c)- cystine/glutamate anti-
porter: a potential target for therapy of cancer and other diseases. J. Cell.
Physiol. 215, 593–602.
Lo, M., Ling, V., Wang, Y.Z., and Gout, P.W. (2008b). The xc- cystine/glutamate
antiporter: a mediator of pancreatic cancer growth with a role in drug resis-
tance. Br. J. Cancer 99, 464–472.
Lobo, C., Ruiz-Bellido, M.A., Aledo, J.C., Marquez, J., Nunez DeCastro, I., and
Alonso, F.J. (2000). Inhibition of glutaminase expression by antisense mRNA
decreases growth and tumourigenicity of tumour cells. Biochem. J. 348,
257–261.
Lora, J., Alonso, F.J., Segura, J.A., Lobo, C., Marquez, J., and Mates, J.M.
(2004). Antisense glutaminase inhibition decreases glutathione antioxidant
capacity and increases apoptosis in Ehrlich ascitic tumour cells. Eur. J.
Biochem. 271, 4298–4306.
Menendez, J.A., and Lupu, R. (2007). Fatty acid synthase and the lipogenic
phenotype in cancer pathogenesis. Nat. Rev. Cancer 7, 763–777.
Narang, V.S., Pauletti, G.M., Gout, P.W., Buckley, D.J., and Buckley, A.R.
(2007). Sulfasalazine-induced reduction of glutathione levels in breast cancer
cells: enhancement of growth-inhibitory activity of Doxorubicin.
Chemotherapy 53, 210–217.
Narta, U.K., Kanwar, S.S., and Azmi, W. (2007). Pharmacological and clinical
evaluation of L-asparaginase in the treatment of leukemia. Crit. Rev. Oncol.
Hematol. 61, 208–221.
Neve, R.M., Chin, K., Fridlyand, J., Yeh, J., Baehner, F.L., Fevr, T., Clark, L.,
Bayani, N., Coppe, J.P., Tong, F., et al. (2006). A collection of breast cancer
cell lines for the study of functionally distinct cancer subtypes. Cancer Cell
10, 515–527.
Nicklin, P., Bergman, P., Zhang, B., Triantafellow, E., Wang, H., Nyfeler, B.,
Yang, H., Hild, M., Kung, C., Wilson, C., et al. (2009). Bidirectional transport
of amino acids regulates mTOR and autophagy. Cell 136, 521–534.
Okuno, S., Sato, H., Kuriyama-Matsumura, K., Tamba, M., Wang, H., Sohda,
S., Hamada, H., Yoshikawa, H., Kondo, T., and Bannai, S. (2003). Role of
cystine transport in intracellular glutathione level and cisplatin resistance in
human ovarian cancer cell lines. Br. J. Cancer 88, 951–956.
Prat, A., Parker, J.S., Karginova, O., Fan, C., Livasy, C., Herschkowitz, J.I., He,
X., and Perou, C.M. (2010). Phenotypic and molecular characterization of the
claudin-low intrinsic subtype of breast cancer. Breast Cancer Res. 12, R68.
16 Cancer Cell 24, 1–16, October 14, 2013 ª2013 Elsevier Inc.
Reitzer, L.J., Wice, B.M., and Kennell, D. (1979). Evidence that glutamine, not
sugar, is the major energy source for cultured HeLa cells. J. Biol. Chem. 254,
2669–2676.
Simpson, N.E., Tryndyak, V.P., Beland, F.A., and Pogribny, I.P. (2012). An
in vitro investigation of metabolically sensitive biomarkers in breast cancer
progression. Breast Cancer Res. Treat. 133, 959–968.
Sommers, C.L., Byers, S.W., Thompson, E.W., Torri, J.A., and Gelmann, E.P.
(1994). Differentiation state and invasiveness of human breast cancer cell lines.
Breast Cancer Res. Treat. 31, 325–335.
Souba, W.W. (1993). Glutamine and cancer. Ann. Surg. 218, 715–728.
Thornburg, J.M., Nelson, K.K., Clem, B.F., Lane, A.N., Arumugam, S.,
Simmons, A., Eaton, J.W., Telang, S., and Chesney, J. (2008). Targeting aspar-
tate aminotransferase in breast cancer. Breast Cancer Res. 10, R84.
van den Heuvel, A.P., Jing, J., Wooster, R.F., and Bachman, K.E. (2012).
Analysis of glutamine dependency in non-small cell lung cancer: GLS1 splice
variant GAC is essential for cancer cell growth. Cancer Biol. Ther. 13, 1185–
1194.
Wang, J.B., Erickson, J.W., Fuji, R., Ramachandran, S., Gao, P., Dinavahi, R.,
Wilson, K.F., Ambrosio, A.L., Dias, S.M., Dang, C.V., and Cerione, R.A. (2010).
Targeting mitochondrial glutaminase activity inhibits oncogenic transforma-
tion. Cancer Cell 18, 207–219.
Weigelt, B., and Reis-Filho, J.S. (2009). Histological and molecular types of
breast cancer: is there a unifying taxonomy? Nat Rev Clin Oncol 6, 718–730.
Wise, D.R., and Thompson, C.B. (2010). Glutamine addiction: a new therapeu-
tic target in cancer. Trends Biochem. Sci. 35, 427–433.
Wise, D.R., DeBerardinis, R.J., Mancuso, A., Sayed, N., Zhang, X.Y., Pfeiffer,
H.K., Nissim, I., Daikhin, E., Yudkoff, M., McMahon, S.B., and Thompson, C.B.
(2008). Myc regulates a transcriptional program that stimulates mitochondrial
glutaminolysis and leads to glutamine addiction. Proc. Natl. Acad. Sci. USA
105, 18782–18787.
Yuneva, M., Zamboni, N., Oefner, P., Sachidanandam, R., and Lazebnik, Y.
(2007). Deficiency in glutamine but not glucose induces MYC-dependent
apoptosis in human cells. J. Cell Biol. 178, 93–105.
Yuneva, M.O., Fan, T.W., Allen, T.D., Higashi, R.M., Ferraris, D.V., Tsukamoto,
T., Mates, J.M., Alonso, F.J., Wang, C., Seo, Y., et al. (2012). The metabolic
profile of tumors depends on both the responsible genetic lesion and tissue
type. Cell Metab. 15, 157–170.
Zielke, H.R., Ozand, P.T., Tildon, J.T., Sevdalian, D.A., and Cornblath, M.
(1978). Reciprocal regulation of glucose and glutamine utilization by cultured
human diploid fibroblasts. J. Cell. Physiol. 95, 41–48.