glycemic index, glycemic load and glycemic … pasta day 2013... · world pasta day 2013 istanbul,...
TRANSCRIPT
WORLD PASTA DAY 2013 ISTANBUL, TURKEY • OCTOBER 25TH, 2013
PASTA AND HEALTH: GLYCEMIC INDEX, GLYCEMIC LOAD AND GLYCEMIC
RESPONSE: AN INTERNATIONAL SCIENTIFIC CONSENSUS
STATEMENT
Sara Baer-Sinnott, President, Oldways

Glycemic Index, Glycemic Load and Glycemic Response An International Scientific Consensus Summit
Stresa, Italy • June 6 - 7, 2013 Under the patronage of the Ministero della
Salute
Glyemic Index, Glycemic Load, Glycemic Response: International Scientific Consensus Conference
Purpose: to bring together international experts in the field of
carbohydrates and health in order to present/discuss the issues related to the role of glycemic index/glycemic load/glycemic response in the prevention and treatment of disease; and
to develop a solid Scientific Consensus Statement on what can be agreed upon regarding glycemic index/glycemic load/glycemic response. This document was drafted by speakers at the end of the Summit in a separate afternoon session on June 7th.
Scientific Committee
Glyemic Index, Glycemic Load, Glycemic Response: International Scientific Consensus Committee
Chairs: David J.A. Jenkins, MD, PhD, DSc (Toronto, Canada)
University Professor and Canada Research Chair in Nutrition and Metabolism, Department of Nutritional Sciences, Faculty of Medicine, University of Toronto, Director, Risk Factor Modification Centre, St. Michael’s Hospital
Walter C. Willett, MD, DrPH (Boston, USA) Fredrick John Stare Professor of Epidemiology and Nutrition Chair, Department of Nutrition, Harvard School of Public Health
Glyemic Index, Glycemic Load, Glycemic Response: International Scientific Consensus Committee
Arne Astrup, MD, DMSc (Copenhagen, Denmark) Professor, Department of Nutrition, Exercise and Sports (NEXS) Faculty of Science, University of Copenhagen.
Livia Augustin, PhD (Toronto, Canada) Research Fellow, Risk Factor Modification Centre, St. Michael’s Hospital
Sara Baer-Sinnott (Boston, USA) President, Oldways
Alan W. Barclay, PhD (Sydney, Australia) Head of Research, Australian Diabetes Council; Chief Scientific Officer Glycemic Index Foundation
Inger Björck, PhD (Lund, Sweden) Professor and Managing Director Antidiabetic Food Centre, Lund University
Jennie C. Brand-Miller, PhD (Sydney, Australia) Professor, Boden Institute of Obesity, Nutrition, Exercise and Eating Disorders, University of Sydney
Furio Brighenti, DrPH (Parma, Italy) Professor of Human Nutrition, Department of Food Science University of Parma
Anette E. Buyken, PhD (Bonn, Germany) Research Associate, Department of Nutritional Epidemiology, University of Bonn.
Antonio Ceriello, MD (Barcelona, Spain) Head of Research at the Institut d'Investigacions Biomèdiques August Pi i Sunyer (IDIBAPS)
Cyril W.C. Kendall, PhD (Toronto, Canada) Research Associate, Department of Nutritional Sciences, Faculty of
Medicine, University of Toronto and Adj. Professor College of Pharmacy and Nutrition, University of Saskatchewan (Saskatoon, Canada)
Carlo La Vecchia, MD (Milan, Italy) Chief, Department of Epidemiology, Mario Negri Institute, and Professor of Epidemiology, University of Milan
Geoffrey Livesey, PhD (Wymondham, UK) Director, Independent Nutrition Logic
Simin Liu, MD, ScD (Providence, USA) Professor, Departments of Epidemiology and Medicine, Brown University
Andrea Poli, MD (Milan, Italy) Scientific Director, Nutrition Foundation of Italy
Gabriele Riccardi, MD (Naples, Italy) Full Professor of Endocrinology and Metabolic Diseases, Department of Clinical Medicine and Surgery, Federico II University
Salwa W. Rizkalla, MD, PhD, DSc (Paris, France) Senior Researcher, National Institute of Health and Medical Research (INSERM) U 872, team 7, Research centre in human nutrition, ICAN Institute of Cardiometabolism & Nutrition, University Pierre et Marie Curie-Paris 6, Centre of Research in Human Nutrition, Pitié Salpêtrière Hospital
John L. Sievenpiper, MD, PhD (Toronto, Canada) Toronto 3D Knowledge Synthesis and Clinical Trials Unit, Clinical Nutrition and Risk Factor Modification Centre, St. Michael's Hospital), Department of Pathology and Molecular Medicine, Faculty of Health Sciences, McMaster University
Antonia Trichopoulou, MD, PhD (Athens, Greece) Professor and Director, World Health Organization Collaborating Centre for Food & Nutrition, Department of Hygiene and Epidemiology, University of Athens Medical School, and Vice President, Hellenic Health Foundation
Thomas M.S. Wolever MD, PhD (Toronto, Canada) Professor, Department of Nutritional Sciences, University of Toronto
• Glycemic Index • Glycemic Load • Glycemic Response
Definitions

DEFINITIONS
Glycemic Index (GI): Ranks the quality of individual carbohydrate-rich foods on a scale of 1-100. GI measures how glucose levels rise after someone eats an amount of food that contains 50 grams of carbohydrate. Foods with a low GI Score (under 55) provide steady fuel. Foods with a high GI score (70 and up) are likely to provide an unhealthy quick rush of blood sugar, followed by a sharp crash.
DEFINITIONS
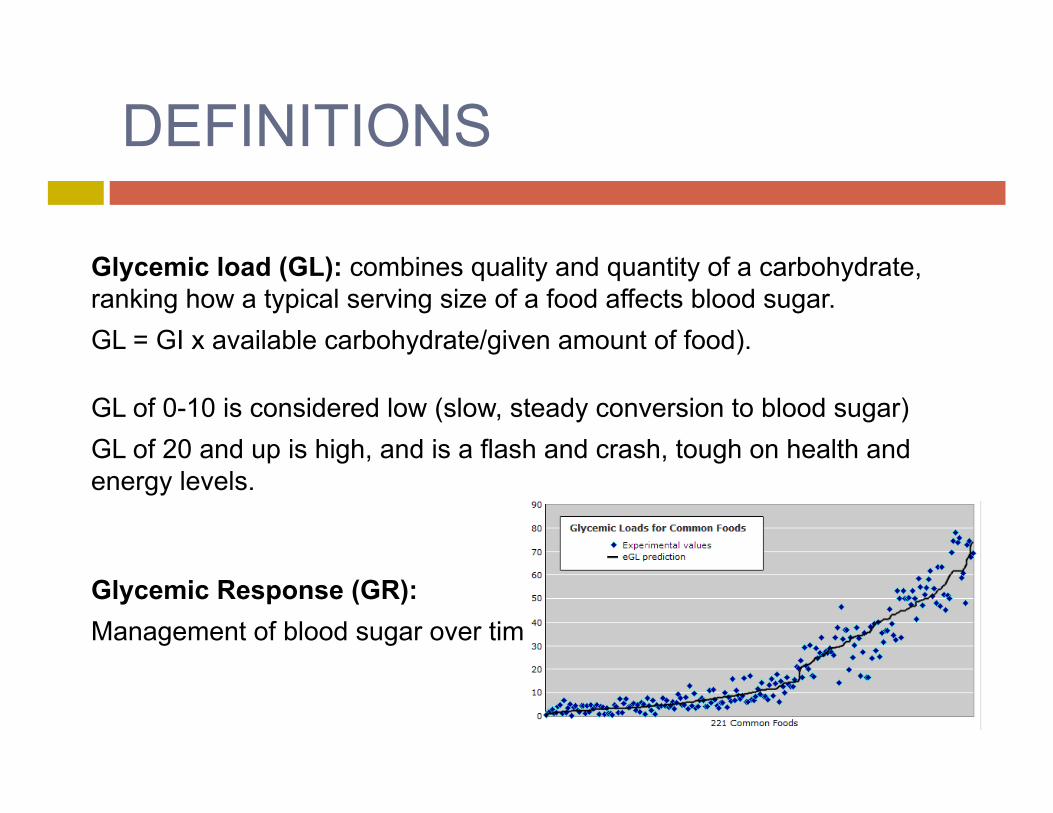
Glycemic load (GL): combines quality and quantity of a carbohydrate, ranking how a typical serving size of a food affects blood sugar. GL = GI x available carbohydrate/given amount of food).
GL of 0-10 is considered low (slow, steady conversion to blood sugar) GL of 20 and up is high, and is a flash and crash, tough on health and energy levels.
Glycemic Response (GR): Management of blood sugar over time
QUALITY – Carbs, Fats & Proteins
As useful as GI, GL, and GR can be, it’s important to keep in mind that understanding the effect of carbohydrates on blood sugar is just one part of choosing a healthy diet.
The quality of fats and proteins matters too, as do fiber, vitamins, minerals and other factors.
The bottom line? Eating a wide variety of delicious, whole foods, guided by the latest science in all these areas, is the way to go.
PASTA and GI/GL/GR
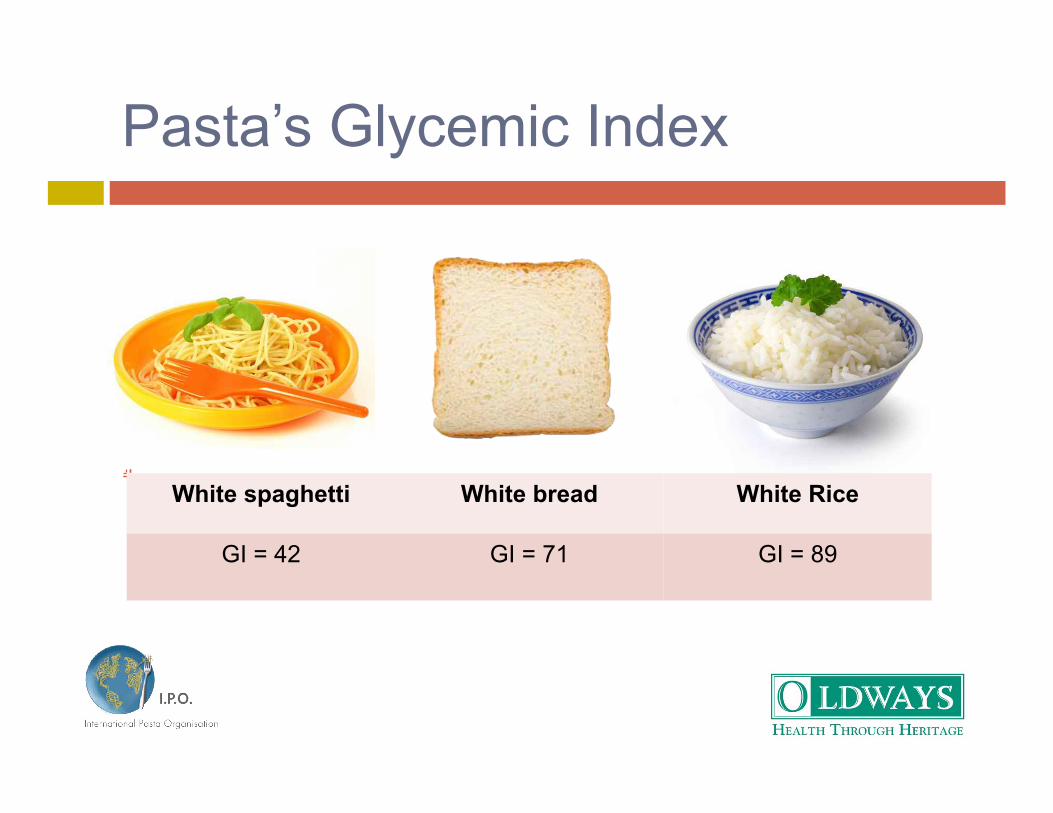
Pasta’s Glycemic Index
White spaghetti White bread White Rice
GI = 42 GI = 71 GI = 89
12
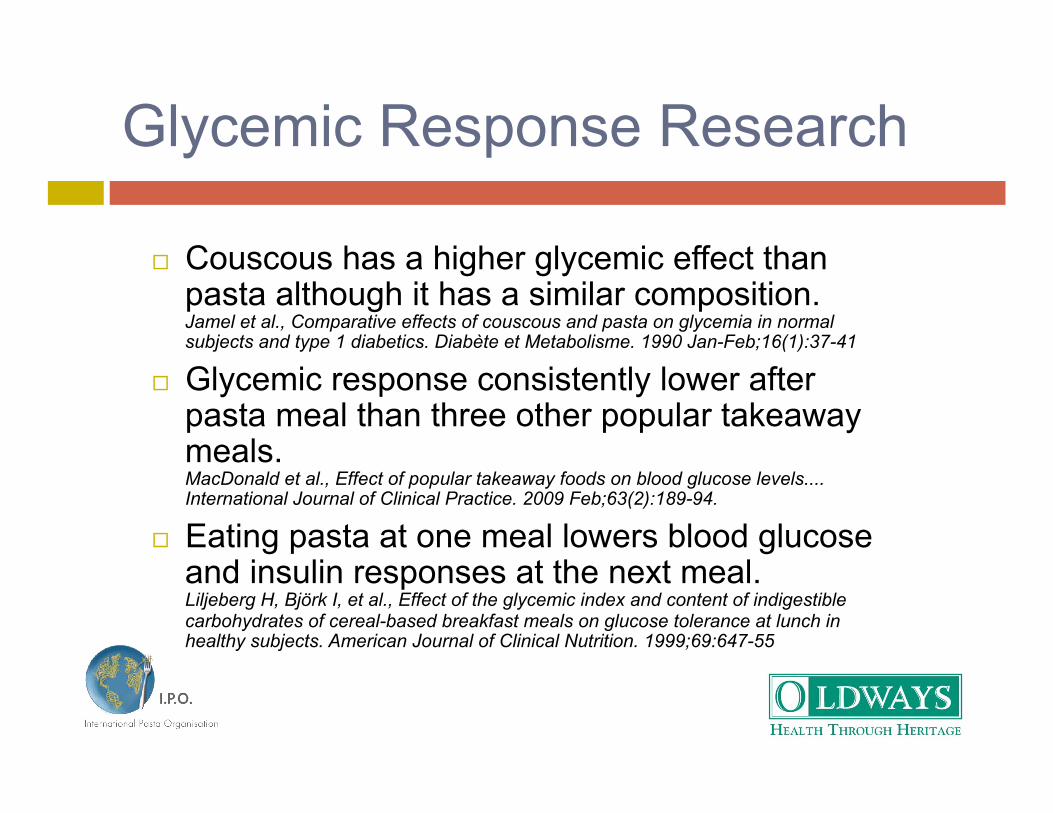
Glycemic Response Research
Couscous has a higher glycemic effect than pasta although it has a similar composition. Jamel et al., Comparative effects of couscous and pasta on glycemia in normal subjects and type 1 diabetics. Diabète et Metabolisme. 1990 Jan-Feb;16(1):37-41
Glycemic response consistently lower after pasta meal than three other popular takeaway meals. MacDonald et al., Effect of popular takeaway foods on blood glucose levels.... International Journal of Clinical Practice. 2009 Feb;63(2):189-94.
Eating pasta at one meal lowers blood glucose and insulin responses at the next meal. Liljeberg H, Björk I, et al., Effect of the glycemic index and content of indigestible carbohydrates of cereal-based breakfast meals on glucose tolerance at lunch in healthy subjects. American Journal of Clinical Nutrition. 1999;69:647-55
13

Pasta Type Matters Too
Thicker, larger pasta shapes tend to have a lower glycemic index than thinner, smaller ones. Pi-Sunyer FX. Glycemic index and disease. American Journal of Clinical Nutrition. 2002 Jul;76(1):2905-2985.
14

As Does Cooking Time
Spaghetti (white, durum wheat)
180 grams cooked (1 cup+)
Cooked 5 minutes GI = 34 GL = 16
Cooked 11 minutes GI = 59 GL = 28
Cooked 16.5 minutes GI = 65 GL = 31 Values from glycemicindex.com, University of Sydney
15

• PPG • Glycemic Index • Glycemic Load
Consensus Statement - Foundation
• PPG • Glycemic Index • Glycemic Load
Consensus Statement - Foundation
Glyemic Index, Glycemic Load, Glycemic Response: International Scientific Consensus Statement
1. Carbohydrates present in different foods have distinct physiological effects, including effects on post-prandial glycemia (PPG), also known as the glycemic response1, with different implications for health.
Different carbohydrate foods have different effects on glycemic response, which in turn, impacts the risk of disease and weight management.
Glyemic Index, Glycemic Load, Glycemic Response: International Scientific Consensus Statement
2. Reducing PPG is recognized as a beneficial physiological effect (Ceriello and Colagiuri 2008, Levitan et al. 2004, Coutinho et al. 1999, EFSA 2011)
Avoiding spikes in blood sugar is a good thing for health.
Glyemic Index, Glycemic Load, Glycemic Response: International Scientific Consensus Statement
3. Ways to reduce PPG include slowing carbohydrate absorption by consuming low glycemic index (GI)2 and low glycemic load (GL)3 foods to reduce the dietary GI and GL (Jenkins et al. 2001, Salmeron et al. 1997).
Consuming low GI and low GL foods like pasta will slow carbohydrate absorption and produce gentle changes in blood sugar, not big spikes.
Glyemic Index, Glycemic Load, Glycemic Response: International Scientific Consensus Statement
4. The GI methodology is a sufficiently valid and reproducible method for differentiating foods based on their glycemic response (Wolever, 2013, Brouns et al. 2005).
Although nutrition science is imprecise, scientists agree that the GI is a valid way to distinguish the glycemic response among foods. For example, you can take flour and water and make either pasta or bread. The way pasta is made – the extrusion -- causes a lower glycemic response for pasta than bread and thus pasta has a much lower GI than bread.
Glyemic Index, Glycemic Load, Glycemic Response: International Scientific Consensus Statement
5. The GI quantifies specific physiological properties of carbohydrate-containing foods as influenced by the food matrix. These characteristics extend beyond their chemical composition of food and include delaying gastric emptying and reducing the rate of digestion and small intestinal absorption.
Similarly, we can’t just think of foods as chemicals. Using wheat as an example, pasta is in a different form and matrix than other wheat products – and therefore it evokes a different glycemic response in our bodies.

Glyemic Index, Glycemic Load, Glycemic Response: International Scientific Consensus Statement
6. When considering the macronutrient composition, the GL/1000kJ (the product of GI and available4 carbohydrate content) is the single best predictor of the glycemic response of foods (Bao et al. 2011).
The glycemic load measures both carbohydrate quality and quantity. For example: watermelon has a high GI, but a fairly low GL because watermelon is mostly water; it contains very little carbohydrate in a typical serving.

• Low-GI and low-GL diets and reduced risk of disease
• Evidence from random controlled trials and from epidemiological studies
Consensus Statement: Effects on Health
Glyemic Index, Glycemic Load, Glycemic Response: International Scientific Consensus Statement
7. There is convincing evidence from meta-analyses of controlled dietary trials that diets low in GI improve glycemic control in people with type 2 and type 1 diabetes (Giacco et al. 2000, Brand-Miller et al 2003, Livesey et al 2008, Thomas and Elliot 2010, Jenkins et al. 2012).
CLINICAL TRIALS – Diabetes It’s logical that a low GI diet will help people with diabetes (type 1 and type 2). There is evidence from randomized controlled trials that eating a low GI diet will help improve glycemic control.
Glyemic Index, Glycemic Load, Glycemic Response: International Scientific Consensus Statement
8. There is convincing evidence from meta-analyses of prospective cohort studies that low GI/GL diets reduce the risk of type 2 diabetes (Barclay et al 2008, Livesey et al 2013).
EPIDEMIOLOGICAL STUDIES – Diabetes From epidemiological studies, low GI/GL diets reduce the risk of Type 2 Diabetes.

Glyemic Index, Glycemic Load, Glycemic Response: International Scientific Consensus Statement
9. There is convincing evidence from a large body of prospective cohort studies that low GI/GL diets reduce the risk of coronary heart disease (Liu et al. 2000, Mirrahimi et al 2012, Fan et al. 2012).
EPIDEMIOLOGICAL STUDIES – Heart disease Similarly, from epidemiological studies, low GI/GL diets reduce the risk of heart disease.
Glyemic Index, Glycemic Load, Glycemic Response: International Scientific Consensus Statement
10. The proof of principle for the concept of slowing carbohydrate absorption is the use of alpha-glucosidase inhibitors (acarbose etc.) to reduce progression to type 2 diabetes and coronary heart disease (Chiasson et al. 2002, Chiasson et al. 2003).
WHY GI/GL HELPFUL FOR DIABETES AND HEART DISEASE: We can feel confident about how low GI/GL diets reduce progression to Type 2 Diabetes and heart disease, because we understand the mechanism: by slowing carbohydrate absorption. This mechanism was demonstrated by a medicine called acarbose in studies.

Glyemic Index, Glycemic Load, Glycemic Response: International Scientific Consensus Statement
11. The quality of carbohydrate rich foods as defined by GI/GL is particularly important for individuals who are sedentary, overweight and at increased risk of type 2 diabetes (Salmeron et al. 1997, Ludwig et al. 2002).
INCREASED NEED FOR LOW GI/GL DIETS Studies show that once someone has increased risk factors (not much exercise, overweight and T2D), eating low GI/GL diets is even more important.
Glyemic Index, Glycemic Load, Glycemic Response: International Scientific Consensus Statement
12. Potential mechanisms for reduction of type 2 diabetes include evidence that low GI/GL diets improve insulin sensitivity and beta-cell function in people with type 2 diabetes and those at risk for type 2 diabetes (Rizkalla et al. 2004, Solomon et al. 2011).
WHY LOW GI/GL DIETS HELPFUL FOR DIABETES: Low GI/GL diets improve insulin sensitivity and help insulin-producing cells in the pancreas to function better. This likely explains why they reduce risk of Type 2 Diabetes.
Glyemic Index, Glycemic Load, Glycemic Response: International Scientific Consensus Statement
13. Potential mechanisms for reduction of coronary heart disease include evidence that low GI/GL diets improve blood lipids and inflammatory markers including C-reactive protein (CRP) (Frost et al. 1999, Liu et al. 2001, Liu et al. 2002, Wolever et al. 2008, Shikany et al. 2010, Goff et al. 2013).
WHY LOW GI/GL DIETS HELPFUL FOR HEART DISEASE: Low GI/GL diets improve blood lipids and reduce systemic inflammation. This likely explains why they reduce risk of coronary heart disease.
Glyemic Index, Glycemic Load, Glycemic Response: International Scientific Consensus Statement
14. Probable evidence exists for low GI/GL diets in reducing total body fat mass and in weight management (Larsen et al. 2010, Murakami et al. 2013, Bouche’ et al. 2002, McMillan-Price et al. 2006, Ebbeling et al. 2007).
WEIGHT MANAGEMENT – some evidence There is some evidence that lower GI/GL diets reduce weight; however, it is not as strong as the evidence for reducing heart disease and diabetes.
• Whole grains and fiber • Total diet • Communication to consumers and health
professionals • Guidelines • Labeling • High quality measurements
Consensus Statement: Implementation
Glyemic Index, Glycemic Load, Glycemic Response: International Scientific Consensus Statement
15. The GI complements other ways of characterizing carbohydrate foods, such as fiber and whole grain content (Riccardi et al. 2008, Slavin 2008).
GI is not the only measure of carbohydrate quality – fiber and whole grain content are also important.
Glyemic Index, Glycemic Load, Glycemic Response: International Scientific Consensus Statement
16. Low GI and low GL should be considered in the context of a healthy diet.
Considering low GI and GL as a guide for healthy eating only works with an overall healthy diet. Some candy bars may have an even lower GI than pasta – but the pasta is clearly a healthier choice, even more so with its “plate partners” of vegetables, tomato sauce, olive oil, beans, fish or lean meat.
Glyemic Index, Glycemic Load, Glycemic Response: International Scientific Consensus Statement
17. Given the rapid rise in diabetes and obesity there is a need to communicate information on GI/GL to the general public and health professionals.
It is time to communicate accurate information about GI/GL, both to consumers and to health professionals.
Glyemic Index, Glycemic Load, Glycemic Response: International Scientific Consensus Statement
18. This should be supported by inclusion of GI/GL in dietary guidelines and in food composition tables.
Along with communications with health professionals, GI/GL should be included in nutrition guidelines, and in nutrition databases widely used by health professionals.
Glyemic Index, Glycemic Load, Glycemic Response: International Scientific Consensus Statement
19. In addition package labels and low GI/GL symbols on healthy foods should be considered.
Labeling with GI and GL on packages of healthy foods should be considered.
Glyemic Index, Glycemic Load, Glycemic Response: International Scientific Consensus Statement
20. More comprehensive high-quality food composition tables need to be developed for GI/GL at the national level.
Many foods – including pasta – have inconsistent values on different GI/GL tables. Cooking time, different companies, different formulations cause inconsistent values.
International and national tables should be developed, including foods typically eaten in each region.
TAKEAWAY MESSAGES Scientific Consensus Statement on GI/GL/GR
1. Consuming low GI and low GL foods like pasta will slow carbohydrate absorption and produce gentle changes in blood sugar, not big spikes – a good thing for health. 2. From epidemiological and meta analysis of clinical studies, low GI/GL diets reduce the risk of Diabetes and Heart Disease. 3. There is some evidence that lower GI/GL diets reduce weight; however, it is not as strong as the evidence for reducing heart disease and diabetes. 4. Low GI and GL as a guide for healthy eating only works with an overall healthy diet – like the Mediterranean, Latin American or other traditional diet.
5. GI/GL should be communicated to consumers and health professionals, and included in nutrition guidelines, and in nutrition databases widely used by health professionals. Also, GI/GL is only one measure of carbohydrate quality – whole grains and fiber are others. 6. Many foods – including pasta – have inconsistent values on different GI/GL tables. International and national tables should be developed, including foods typically eaten in each region.
TAKEAWAY MESSAGES Scientific Consensus Statement on GI/GL/GR
OVERALL –
For good health, it is important to consider both the quality and quantity of carbohydrates consumed.
FOR PASTA –
Pasta is a high quality carbohydrate, and especially when eaten in moderate quantities, with its healthy partners.
Viva la Pasta! Pasta per tutti!! Teşekkür ederim!