glycemic index, glycemic load, and metabolic syndrome in
TRANSCRIPT
RESEARCH ARTICLE Open Access
Glycemic index, glycemic load, andmetabolic syndrome in Mexicanadolescents: a cross-sectional study fromthe NHNS-2012Itandehui Castro-Quezada1,2, Salomón Angulo-Estrada3, Almudena Sánchez-Villegas1,4, María Dolores Ruiz-López2,5,Reyes Artacho2, Lluís Serra-Majem1,4 and Teresa Shamah-Levy3*
Abstract
Background: The role of dietary glycemic index (GI) and dietary glycemic load (GL) on metabolic syndrome (MetS)in youth populations remains unclear. The aim of the present study was to evaluate the association among dietaryGI, dietary GL, and MetS and its components in Mexican adolescents.
Methods: This study was conducted within the framework of the National Health and Nutrition Survey 2012, across-sectional, probabilistic, population-based survey with a multistage stratified cluster sampling design. Weanalyzed a sample of 1346 subjects aged 12–19 years, representing 13,164,077 adolescents. Dietary habits wereassessed through a validated semiquantitative food-frequency questionnaire. We assigned GI values using theInternational Tables of GI values. We defined MetS according to the International Diabetes Federation criteriadeveloped for adolescents. Multiple logistic regression models were used to estimate odds ratios (ORs) and their95% confidence intervals (CIs) to evaluate the association between categories of dietary GI and GL and theprevalence of MetS and its components.
Results: We observed no associations between dietary GI or GL and MetS prevalence. Female adolescents in thehighest category of dietary GI had higher odds of abnormal blood pressure (OR = 3.66; 95% CI, 1.46–9.22; P fortrend = 0.012). A high dietary GL was also associated with higher odds of abnormal blood pressure in femaleadolescents (OR = 5.67; 95% CI, 1.84–17.46; P for trend = 0.003).
Conclusions: We found higher odds of abnormal blood pressure for female adolescents with a high dietary GI anddietary GL.
Keywords: Glycemic index, Glycemic load, Metabolic syndrome, Adolescent, Mexico
BackgroundThe prevalence of metabolic syndrome (MetS) is highamong children and adolescents with obesity [1, 2]. InMexico, almost 35% of adolescents are either overweightor obese [3] and the prevalence of MetS oscillates between6.5% [4] and 19.2% [5]. Therefore, special attention shouldbe given to modifiable risk factors, such as lifestyle and
dietary habits: they play an important role in the develop-ment and progression of MetS. Among dietary factors,carbohydrates are the main energy source in the diets ofmost populations and have a special function in energymetabolism and homoeostasis [6]. However, evidenceindicates that some carbohydrate sources can be benefi-cial; others are not, depending on their quality and fibercontent [7]. The quality of carbohydrates can be measuredusing the glycemic index (GI); this is defined as the in-cremental area under the curve of blood glucose responseafter eating 50 g of available carbohydrates from a certainfood and expressed as a percentage of the glycemic
* Correspondence: [email protected] for Nutrition and Health Research, National Institute of Public Healthof Mexico, Universidad No. 655, Colonia Santa María Ahuacatitlán, 62100Cuernavaca, Morelos, MexicoFull list of author information is available at the end of the article
© The Author(s). 2017 Open Access This article is distributed under the terms of the Creative Commons Attribution 4.0International License (http://creativecommons.org/licenses/by/4.0/), which permits unrestricted use, distribution, andreproduction in any medium, provided you give appropriate credit to the original author(s) and the source, provide a link tothe Creative Commons license, and indicate if changes were made. The Creative Commons Public Domain Dedication waiver(http://creativecommons.org/publicdomain/zero/1.0/) applies to the data made available in this article, unless otherwise stated.
Castro-Quezada et al. BMC Nutrition (2017) 3:44 DOI 10.1186/s40795-017-0162-2
response elicited by 50 g of glucose or white bread [8].Moreover, the glycemic load (GL) considers both the qual-ity and quantity of carbohydrate intake [9, 10].In adults, evidence from different meta-analysis of ran-
domized controlled trials (RCTs) demonstrated that low-GI or GL diets resulted in lower fasting blood glucoseand glycated hemoglobin levels [11] and a greater de-crease in total cholesterol and low density lipoproteincholesterol (LDL-c) compared to control diets [12, 13].Nevertheless, the latter findings have not been observedin overweight/obese subjects who followed low GI/GLdiets [14]. Furthermore, results from RCTs have demon-strated a favorable effect of a low-GI diet on triglyceridelevels [15] or concentration of high-density lipoproteincholesterol (HDL-c) [16]. However, such findings are in-consistent and have not been confirmed by a recentmeta-analysis [13].In children and adolescents, a meta-analysis has dem-
onstrated that low-GI diets might reduce serum triglyc-erides and homeostasis model assessment index inoverweight or obese children and adolescents [17].The association among GI, GL, and MetS has been
mostly studied in prospective studies in adult popula-tions [18, 19] and produced varying results. The evi-dence for such an association in young people is scarce.Two cross-sectional studies conducted in Australia haveidentified higher odds of developing MetS for each unitincrease in breakfast GL [20] and per 20 unit dietary GLincrease [21].To our knowledge, no evidence is available on the rela-
tionship between the quality of carbohydrates and MetSin a Mexican youth population. Therefore, the main ob-jective of this study was to evaluate the association amongdietary GI, dietary GL, and MetS and its components in anationally representative sample of Mexican adolescents.
MethodsStudy populationThis study was conducted within the framework of the Na-tional Health and Nutrition Survey 2012 (NHNS-2012), across-sectional, probabilistic, population-based survey witha multistage stratified cluster sampling design conducted inMexico. The design and methods of the NHNS-2012 havebeen described elsewhere [22]. The main objective of theNHNS-2012 was to quantify the frequency, distribution,and trends in health and nutrition conditions and their de-terminants in the Mexican population [22]. Data were col-lected by computer-assisted interviews at participants’homes. Child interviewees under the age of 14 years wereassisted in their responses by a relative.In the NHNS-2012 an original probabilistic sample of
17,000 adolescents was drawn. For the present study, weused the NHNS-2012 subsample of 2203 adolescentsaged 12–19 years evaluated by means of a validated
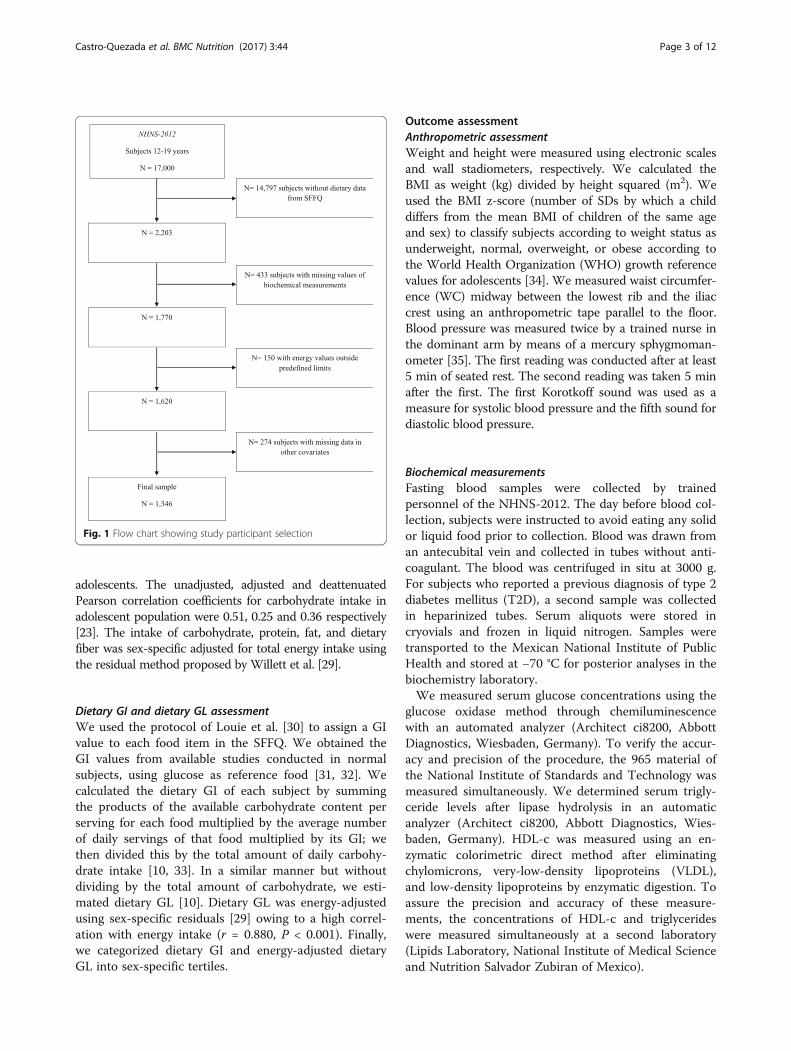
semiquantitative food-frequency questionnaire (SFFQ)to assess dietary habits [23]. We excluded subjects withmissing values for biochemical measurements (19.7%) orother covariates used in the statistical analyses (12.4%).Furthermore, we excluded subjects with energy valuesoutside predefined limits (6.8%). The methodology forcleaning dietary data has been broadly described else-where [24]. First, the weight in grams of food consumedby each study subject was evaluated according to age-group. We excluded from the analysis subjects who con-sumed above three standard deviations (SDs) of one ormore food items. The biological plausibility of food in-take and the percentage contribution of each food tototal dietary intake was used to verify data identified ashigh values. Second, we estimated very high values ofenergy intake by the ratio of energy intake/estimated en-ergy requirement. The equations of the Institute ofMedicine were used as reference [25]. The physical ac-tivity level of each subject was considered according toprevious studies regarding data of the NHNS-1999 [26].We excluded very low values of energy intake: under 0.5of energy intake/basal metabolic rate (BMR). We esti-mated BMR for adults (≥19 years of age) using theMifflin-St Jeor equations [27]. For subjects under19 years of age, we used the age- and sex-specific equa-tions of the Food and Agriculture Organization [28]. Ac-cordingly, we included a final sample of 1346 subjects inour analyses, representing a total of 13,164,077 Mexicanadolescents (Fig. 1).
Exposure assessmentDietary assessmentTrained personnel applied a validated SFFQ to evaluatedietary habits during the 7 days before the interview date[23, 24]. For each food item, the questionnaire measuredthe frequency of intake according to set categories: therange was “never” to “six times a day.” Participants alsodesignated the food portion sizes, using defined categor-ies and number of servings consumed during that week.We first converted the data to number of times a day,and we then estimated the daily portion size. To calcu-late the consumption of energy (kcal/day) and daily nu-trient intakes, we multiplied the daily frequency ofconsumption (portions/day) of each food by the amountof energy and nutrients in a standard serving or portionsize of that food. For that purpose, we used the food com-position tables compiled by the National Institute of PublicHealth of Mexico (INSP: Databases of the nutritional valueof food. Compilation of the National Institute of PublicHealth, unpublished). We totaled the contributions of allfoods using Microsoft Visual FoxPro 7.0 (Microsoft Cor-poration, Seattle, WA, USA). The average Pearson correl-ation coefficient, between SFFQ and two 24-h dietaryrecalls, for absolute nutrient intake was 0.374 for
Castro-Quezada et al. BMC Nutrition (2017) 3:44 Page 2 of 12
adolescents. The unadjusted, adjusted and deattenuatedPearson correlation coefficients for carbohydrate intake inadolescent population were 0.51, 0.25 and 0.36 respectively[23]. The intake of carbohydrate, protein, fat, and dietaryfiber was sex-specific adjusted for total energy intake usingthe residual method proposed by Willett et al. [29].
Dietary GI and dietary GL assessmentWe used the protocol of Louie et al. [30] to assign a GIvalue to each food item in the SFFQ. We obtained theGI values from available studies conducted in normalsubjects, using glucose as reference food [31, 32]. Wecalculated the dietary GI of each subject by summingthe products of the available carbohydrate content perserving for each food multiplied by the average numberof daily servings of that food multiplied by its GI; wethen divided this by the total amount of daily carbohy-drate intake [10, 33]. In a similar manner but withoutdividing by the total amount of carbohydrate, we esti-mated dietary GL [10]. Dietary GL was energy-adjustedusing sex-specific residuals [29] owing to a high correl-ation with energy intake (r = 0.880, P < 0.001). Finally,we categorized dietary GI and energy-adjusted dietaryGL into sex-specific tertiles.
Outcome assessmentAnthropometric assessmentWeight and height were measured using electronic scalesand wall stadiometers, respectively. We calculated theBMI as weight (kg) divided by height squared (m2). Weused the BMI z-score (number of SDs by which a childdiffers from the mean BMI of children of the same ageand sex) to classify subjects according to weight status asunderweight, normal, overweight, or obese according tothe World Health Organization (WHO) growth referencevalues for adolescents [34]. We measured waist circumfer-ence (WC) midway between the lowest rib and the iliaccrest using an anthropometric tape parallel to the floor.Blood pressure was measured twice by a trained nurse inthe dominant arm by means of a mercury sphygmoman-ometer [35]. The first reading was conducted after at least5 min of seated rest. The second reading was taken 5 minafter the first. The first Korotkoff sound was used as ameasure for systolic blood pressure and the fifth sound fordiastolic blood pressure.
Biochemical measurementsFasting blood samples were collected by trainedpersonnel of the NHNS-2012. The day before blood col-lection, subjects were instructed to avoid eating any solidor liquid food prior to collection. Blood was drawn froman antecubital vein and collected in tubes without anti-coagulant. The blood was centrifuged in situ at 3000 g.For subjects who reported a previous diagnosis of type 2diabetes mellitus (T2D), a second sample was collectedin heparinized tubes. Serum aliquots were stored incryovials and frozen in liquid nitrogen. Samples weretransported to the Mexican National Institute of PublicHealth and stored at −70 °C for posterior analyses in thebiochemistry laboratory.We measured serum glucose concentrations using the
glucose oxidase method through chemiluminescencewith an automated analyzer (Architect ci8200, AbbottDiagnostics, Wiesbaden, Germany). To verify the accur-acy and precision of the procedure, the 965 material ofthe National Institute of Standards and Technology wasmeasured simultaneously. We determined serum trigly-ceride levels after lipase hydrolysis in an automaticanalyzer (Architect ci8200, Abbott Diagnostics, Wies-baden, Germany). HDL-c was measured using an en-zymatic colorimetric direct method after eliminatingchylomicrons, very-low-density lipoproteins (VLDL),and low-density lipoproteins by enzymatic digestion. Toassure the precision and accuracy of these measure-ments, the concentrations of HDL-c and triglycerideswere measured simultaneously at a second laboratory(Lipids Laboratory, National Institute of Medical Scienceand Nutrition Salvador Zubiran of Mexico).
Fig. 1 Flow chart showing study participant selection
Castro-Quezada et al. BMC Nutrition (2017) 3:44 Page 3 of 12

Metabolic syndromeThe presence of MetS was identified according to theInternational Diabetes Federation (IDF) definition of MetSfor children and adolescents [36, 37]. For adolescents aged12–16 years, MetS was defined according to the followingcriteria: (1) presence of abdominal obesity (WC ≥90th per-centile for age and sex or adult cutoff if lower); and (2) thepresence of two or more other conditions among triglyc-erides ≥150 mg/dL, HDL-c <40 mg/dL, systolic bloodpressure ≥130 or diastolic blood pressure ≥85 mmHg,fasting plasma glucose ≥100 mg/dL, and known T2D.Adult IDF criteria were used for subjects aged 16 years orolder: central obesity (defined as WC ≥90 cm for maleand ≥80 cm for female adolescents); and at least two ofthe following factors: triglycerides ≥150 mg/dL or specifictreatment for high triglycerides; HDL-c <40 mg/dL inmales and <50 mg/dL in females or specific treatment forthese lipid abnormalities; systolic blood pressure ≥130,diastolic blood pressure ≥85 mmHg, or treatment of pre-viously diagnosed hypertension; fasting plasma glucose≥100 mg/dL; or previously diagnosed T2D.
CovariatesWe used specific questionnaires to assess sociodemo-graphic characteristics, medical history, and lifestylehabits. Socioeconomic status (SES) information was basedon well-being. Using these data, we calculated an index(well-being index) by principal-components analysis,which included home conditions and presence in thehome of household appliances, goods, and services. Thecontinuous variable was categorized into tertiles and usedas a proxy for low, medium, and high SES levels.To collect information on physical activity and seden-
tary lifestyle in the 12- to 14-year age-group, we used aquestionnaire of eight items [38]. The questions includedhours of sleep, screen time, means of transportation toschool, and formal physical activity (e.g., skating, dan-cing, and soccer) over the previous year. We also identi-fied the means of transportation and length of timespent on the home-to-school route and vice versa. Fur-thermore, we categorized formal or competitive physicalactivities performed in the previous year according tothe following criteria: (1) inactive; (2) one or two activ-ities; and (3) three or more activities.We assessed physical activity in adolescents aged 15–
19 years using the short version of the International Phys-ical Activity Questionnaire [39]. In addition, participantswere asked about their usual hours of sleep, inactive trans-port time, and usual screen time [40, 41]. The evaluationcomprised 14 questions and allowed us to differentiate theactivity during the week and on weekends. Finally, inagreement with WHO criteria, we classified physical ac-tivity into three categories: active, moderately active, andinactive [42].
Statistical analysesThe sample design characteristics (sample weights, cluster,and strata variables) were considered for all the analyses.We estimated the baseline characteristics of the populationand dietary intake according to sex-specific tertiles of diet-ary GI and energy-adjusted dietary GL. To explore dif-ferences across categories of dietary GI and energy-adjusteddietary GL, we used linear regression models and design-based Wald statistics for quantitative variables; weemployed the design-based F statistic (corrected, weightedPearson chi-square statistic) for categorical data.We used multiple logistic regression models to estimate
odds ratios (ORs) and their 95% confidence intervals (CIs)to evaluate the association between categories of dietaryGI and GL and the prevalence of MetS. The first modelwas adjusted for age (years). The second multivariatemodel further included the following: SES (low, middle,high); geographic regions of Mexico (north, central, south,metropolitan area) and dietary fiber intake (continuous,energy-adjusted). To examine the associations betweencategories of dietary GI and GL and the prevalence ofMetS components (elevated WC, abnormal blood pres-sure, elevated fasting serum triglycerides, low HDL-c, ele-vated fasting serum glucose concentrations), we fittedlogistic regression models with the same covariates asthose used for the main analyses. We selected covariatesusing a hypothesis-based analysis. The addition of poten-tial confounders, such as physical activity levels or screentime as covariates in the multivariate models, did notchange the magnitude or effect of our results; thus, we didnot use those factors in the final models. We took the low-est categories of dietary GI and GL as references in all themodels. The tests of the linear trend across increasing cat-egories of dietary GI and GL were conducted by assigningthe sex-specific median value within each category. Wetreated those variables as continuous in the logistic regres-sion models.To examine a possible interaction between dietary GI
and GL and age (under and over 16 years), and weightstatus (underweight/normal, overweight/obese), we intro-duced the product terms in the different multivariablemodels; we considered P < 0.05 in the likelihood ratio testas statistically significant. All statistical analyses wereperformed using Stata 12.0 (StataCorp, College Station,TX, USA), and the significance level was set at P < 0.05.
ResultsIn this study, the mean (SD) dietary GI and GL of ado-lescents in the NHNS-2012 was 51.8 (5.3) and 150.0(27.3), respectively. The MetS prevalence in the overallsample was 8.8%, with a higher proportion among fe-male (12.0%) than male adolescents (6.4%; P = 0.019).Tables 1 and 2 present the main characteristics of the
sample according to sex-specific tertiles of dietary GI
Castro-Quezada et al. BMC Nutrition (2017) 3:44 Page 4 of 12
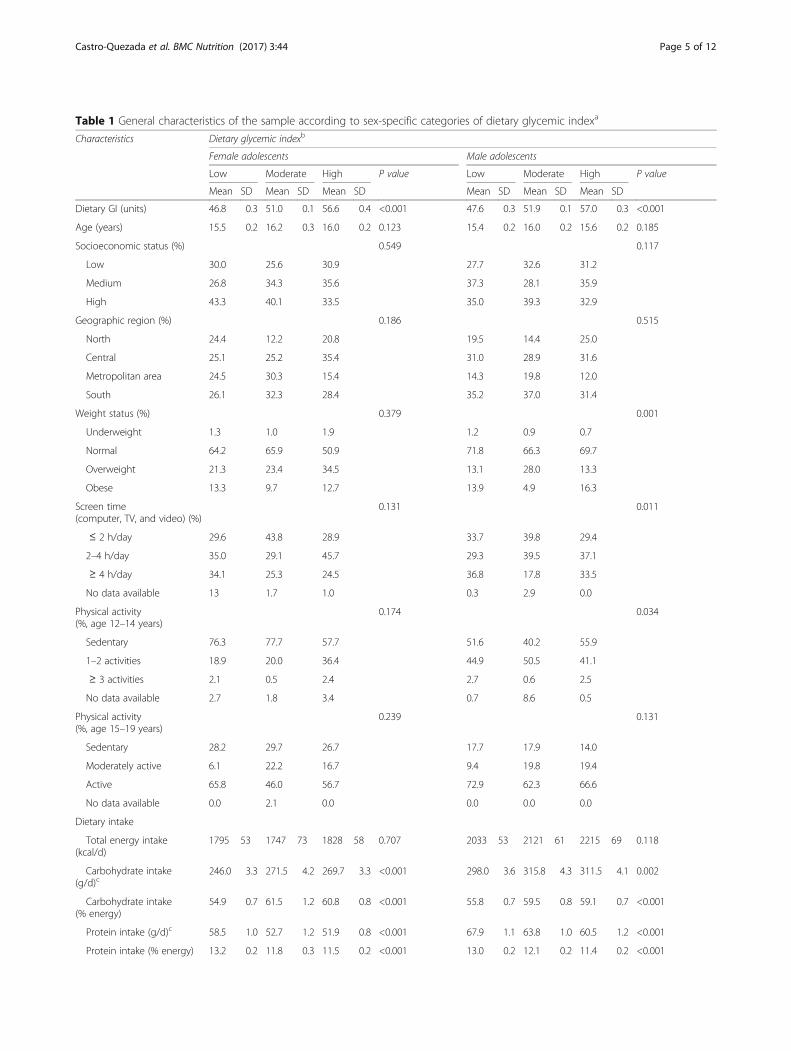
Table 1 General characteristics of the sample according to sex-specific categories of dietary glycemic indexa
Characteristics Dietary glycemic indexb
Female adolescents Male adolescents
Low Moderate High P value Low Moderate High P value
Mean SD Mean SD Mean SD Mean SD Mean SD Mean SD
Dietary GI (units) 46.8 0.3 51.0 0.1 56.6 0.4 <0.001 47.6 0.3 51.9 0.1 57.0 0.3 <0.001
Age (years) 15.5 0.2 16.2 0.3 16.0 0.2 0.123 15.4 0.2 16.0 0.2 15.6 0.2 0.185
Socioeconomic status (%) 0.549 0.117
Low 30.0 25.6 30.9 27.7 32.6 31.2
Medium 26.8 34.3 35.6 37.3 28.1 35.9
High 43.3 40.1 33.5 35.0 39.3 32.9
Geographic region (%) 0.186 0.515
North 24.4 12.2 20.8 19.5 14.4 25.0
Central 25.1 25.2 35.4 31.0 28.9 31.6
Metropolitan area 24.5 30.3 15.4 14.3 19.8 12.0
South 26.1 32.3 28.4 35.2 37.0 31.4
Weight status (%) 0.379 0.001
Underweight 1.3 1.0 1.9 1.2 0.9 0.7
Normal 64.2 65.9 50.9 71.8 66.3 69.7
Overweight 21.3 23.4 34.5 13.1 28.0 13.3
Obese 13.3 9.7 12.7 13.9 4.9 16.3
Screen time(computer, TV, and video) (%)
0.131 0.011
≤ 2 h/day 29.6 43.8 28.9 33.7 39.8 29.4
2–4 h/day 35.0 29.1 45.7 29.3 39.5 37.1
≥ 4 h/day 34.1 25.3 24.5 36.8 17.8 33.5
No data available 13 1.7 1.0 0.3 2.9 0.0
Physical activity(%, age 12–14 years)
0.174 0.034
Sedentary 76.3 77.7 57.7 51.6 40.2 55.9
1–2 activities 18.9 20.0 36.4 44.9 50.5 41.1
≥ 3 activities 2.1 0.5 2.4 2.7 0.6 2.5
No data available 2.7 1.8 3.4 0.7 8.6 0.5
Physical activity(%, age 15–19 years)
0.239 0.131
Sedentary 28.2 29.7 26.7 17.7 17.9 14.0
Moderately active 6.1 22.2 16.7 9.4 19.8 19.4
Active 65.8 46.0 56.7 72.9 62.3 66.6
No data available 0.0 2.1 0.0 0.0 0.0 0.0
Dietary intake
Total energy intake(kcal/d)
1795 53 1747 73 1828 58 0.707 2033 53 2121 61 2215 69 0.118
Carbohydrate intake(g/d)c
246.0 3.3 271.5 4.2 269.7 3.3 <0.001 298.0 3.6 315.8 4.3 311.5 4.1 0.002
Carbohydrate intake(% energy)
54.9 0.7 61.5 1.2 60.8 0.8 <0.001 55.8 0.7 59.5 0.8 59.1 0.7 <0.001
Protein intake (g/d)c 58.5 1.0 52.7 1.2 51.9 0.8 <0.001 67.9 1.1 63.8 1.0 60.5 1.2 <0.001
Protein intake (% energy) 13.2 0.2 11.8 0.3 11.5 0.2 <0.001 13.0 0.2 12.1 0.2 11.4 0.2 <0.001
Castro-Quezada et al. BMC Nutrition (2017) 3:44 Page 5 of 12

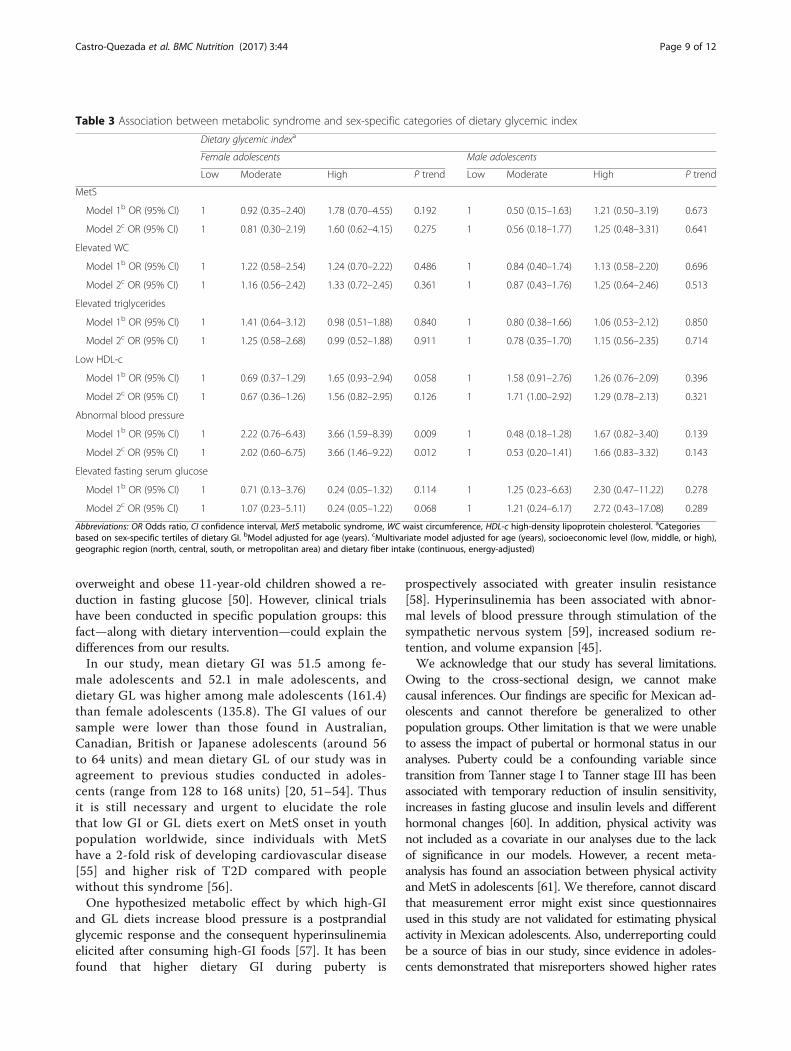
and energy-adjusted dietary GL. Participants in the high-est category of dietary GI had higher carbohydrate andsugar intake and lower values of protein and total fat,than subjects in the lowest category of dietary GI. Simi-lar characteristics were found across categories of dietaryGL, in addition, we observed a higher dietary fiber in-take in the top tertile of dietary GL compared with thosein the lowest tertile. We found no differences in theprevalence of MetS or the mean of its componentsacross dietary GL categories.Table 3 shows the ORs and 95% CI for MetS and its com-
ponents according to sex-specific categories of dietary GI.We observed no association of MetS with either dietary GIor dietary GL. However, when MetS components were ana-lyzed separately, a direct association between the highestdietary GI and abnormal blood pressure was evident in fe-male adolescents (Model 1: OR = 3.66; 95% CI, 1.59–8.39;P for trend = 0.009). This association remained statisticallysignificant after multivariate adjustment. Table 4 shows theORs and 95% CI for MetS and its components according tosex-specific categories of energy-adjusted dietary GL. Ourresults from the multivariate model also indicated that fe-male adolescents with the highest dietary GL had higherodds of abnormal blood pressure (OR = 5.67; 95% CI,1.84–17.46); there was a significant trend across categoriesof dietary GL (P for trend = 0.003). Among males, no
statistically significant associations were found betweendietary GI or dietary GL and abnormal BP. We found nostatistically significant associations for the remaining MetScriteria with dietary GI or GL.None of the interactions assessed was statistically sig-
nificant in the association between dietary GI and GLand MetS (P for interaction >0.05)
DiscussionIn this cross-sectional study, we found no associations be-tween dietary GI or GL and MetS. However, in an analysisof MetS components, high dietary GI and GL were associ-ated with higher odds of abnormal blood pressure in femaleadolescents.We found no associations between dietary GI or
GL and MetS. Similar results were observed in a clin-ical trial performed in European children and adoles-cents (5–18 years) did not reveal an association between alow-GI diet and MetS [43]. A cross-sectional study con-ducted in 516 Australian adolescents found no associationbetween overall dietary GI or dietary GL and MetS [20].In that study, however, breakfast GL was found to be pre-dictive of MetS in female, but not male, adolescents. Inthe present study, we used SFFQ to assess dietary intake,and we were unable to estimate dietary GI or GL at
Table 1 General characteristics of the sample according to sex-specific categories of dietary glycemic indexa (Continued)
Fat intake (g/d)c 67.2 1.1 58.8 1.3 59.1 1.3 <0.001 77.5 1.3 70.5 1.6 69.5 1.5 <0.001
Fat intake (% energy) 33.9 0.5 28.8 0.9 29.4 0.7 <0.001 33.2 0.5 29.8 0.7 29.6 0.5 <0.001
MUFA (g/d)c 22.6 0.5 19.7 0.5 20.5 0.6 <0.001 25.9 0.6 23.6 0.5 24.7 0.6 0.020
PUFA (g/d)c 14.3 0.4 14.1 0.4 14.5 0.4 0.750 17.4 0.4 17.5 0.7 16.8 0.4 0.424
SFA (g/d)c 25.8 0.5 22.1 0.6 22.7 0.7 <0.001 29.4 0.7 26.2 0.7 26.5 0.7 0.002
Trans fatty acids(g/d)c
0.5 0.0 0.5 0.0 0.5 0.0 0.054 0.5 0.0 0.5 0.0 0.6 0.0 0.692
Dietary fiber intake(g/d)c
21.6 0.5 22.7 1.3 21.3 0.7 0.683 25.8 0.7 27.0 1.0 22.8 0.8 0.003
Dietary sugar intake(g/d)
94.1 4.9 109.9 7.2 112.3 4.4 0.021 108.4 4.1 116.2 6.4 134.6 4.4 <0.001
WC (cm) 76.8 1.0 76.8 1.2 78.3 1.4 0.640 77.0 1.5 77.5 1.0 78.7 1.2 0.660
Triglycerides (mg/dL) 116.9 7.5 135.3 9.7 113.5 5.6 0.142 113.2 6.6 113.3 6.6 132.1 9.4 0.212
HDL-c (mg/dL) 45.1 0.8 48.7 2.0 43.0 1.4 0.075 43.3 0.9 41.3 0.9 43.0 0.8 0.231
Systolic blood pressure(mmHg)
107.1 0.9 108.9 1.1 110.0 1.2 0.169 111.2 1.5 110.9 1.0 113.3 1.0 0.219
Diastolic blood pressure(mmHg)
70.0 0.8 72.0 1.1 73.2 1.0 0.050 70.3 1.1 71.1 0.9 73.3 0.8 0.051
Fasting serum glucose (mg/dL)
80.4 1.0 79.0 1.2 77.6 1.0 0.172 81.3 0.8 80.2 1.3 81.5 1.4 0.733
MetS prevalence (%)d 9.5 9.7 16.9 0.234 6.9 3.8 8.4 0.344
Abbreviations: GI Glycemic index, GL glycemic load, kcal/d kilocalories per day, grams per day (g/d), MUFA monounsaturated fatty acids, PUFA polyunsaturated fattyacids, SFA saturated fatty acids, WC waist circumference, HDL-c high-density lipoprotein cholesterol, MetS metabolic syndromeaValues are expressed as means and standard deviations (SD) for continuous variables, and data from categorical variables are shown as percentagesbCategories based on sex-specific tertiles of dietary GI. cValues were adjusted for energy intake using sex-specific residuals. dThe age-specific InternationalDiabetes Foundation definition of the metabolic syndrome was used [36, 37]
Castro-Quezada et al. BMC Nutrition (2017) 3:44 Page 6 of 12
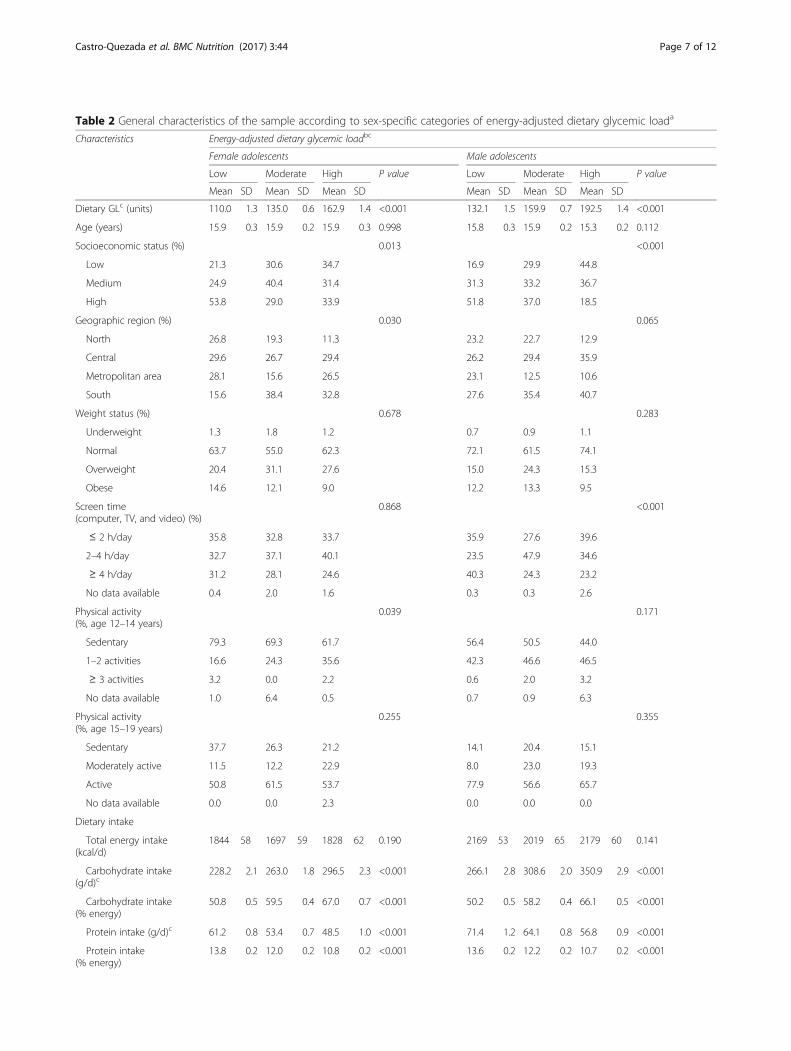
Table 2 General characteristics of the sample according to sex-specific categories of energy-adjusted dietary glycemic loada
Characteristics Energy-adjusted dietary glycemic loadbc
Female adolescents Male adolescents
Low Moderate High P value Low Moderate High P value
Mean SD Mean SD Mean SD Mean SD Mean SD Mean SD
Dietary GLc (units) 110.0 1.3 135.0 0.6 162.9 1.4 <0.001 132.1 1.5 159.9 0.7 192.5 1.4 <0.001
Age (years) 15.9 0.3 15.9 0.2 15.9 0.3 0.998 15.8 0.3 15.9 0.2 15.3 0.2 0.112
Socioeconomic status (%) 0.013 <0.001
Low 21.3 30.6 34.7 16.9 29.9 44.8
Medium 24.9 40.4 31.4 31.3 33.2 36.7
High 53.8 29.0 33.9 51.8 37.0 18.5
Geographic region (%) 0.030 0.065
North 26.8 19.3 11.3 23.2 22.7 12.9
Central 29.6 26.7 29.4 26.2 29.4 35.9
Metropolitan area 28.1 15.6 26.5 23.1 12.5 10.6
South 15.6 38.4 32.8 27.6 35.4 40.7
Weight status (%) 0.678 0.283
Underweight 1.3 1.8 1.2 0.7 0.9 1.1
Normal 63.7 55.0 62.3 72.1 61.5 74.1
Overweight 20.4 31.1 27.6 15.0 24.3 15.3
Obese 14.6 12.1 9.0 12.2 13.3 9.5
Screen time(computer, TV, and video) (%)
0.868 <0.001
≤ 2 h/day 35.8 32.8 33.7 35.9 27.6 39.6
2–4 h/day 32.7 37.1 40.1 23.5 47.9 34.6
≥ 4 h/day 31.2 28.1 24.6 40.3 24.3 23.2
No data available 0.4 2.0 1.6 0.3 0.3 2.6
Physical activity(%, age 12–14 years)
0.039 0.171
Sedentary 79.3 69.3 61.7 56.4 50.5 44.0
1–2 activities 16.6 24.3 35.6 42.3 46.6 46.5
≥ 3 activities 3.2 0.0 2.2 0.6 2.0 3.2
No data available 1.0 6.4 0.5 0.7 0.9 6.3
Physical activity(%, age 15–19 years)
0.255 0.355
Sedentary 37.7 26.3 21.2 14.1 20.4 15.1
Moderately active 11.5 12.2 22.9 8.0 23.0 19.3
Active 50.8 61.5 53.7 77.9 56.6 65.7
No data available 0.0 0.0 2.3 0.0 0.0 0.0
Dietary intake
Total energy intake(kcal/d)
1844 58 1697 59 1828 62 0.190 2169 53 2019 65 2179 60 0.141
Carbohydrate intake(g/d)c
228.2 2.1 263.0 1.8 296.5 2.3 <0.001 266.1 2.8 308.6 2.0 350.9 2.9 <0.001
Carbohydrate intake(% energy)
50.8 0.5 59.5 0.4 67.0 0.7 <0.001 50.2 0.5 58.2 0.4 66.1 0.5 <0.001
Protein intake (g/d)c 61.2 0.8 53.4 0.7 48.5 1.0 <0.001 71.4 1.2 64.1 0.8 56.8 0.9 <0.001
Protein intake(% energy)
13.8 0.2 12.0 0.2 10.8 0.2 <0.001 13.6 0.2 12.2 0.2 10.7 0.2 <0.001
Castro-Quezada et al. BMC Nutrition (2017) 3:44 Page 7 of 12
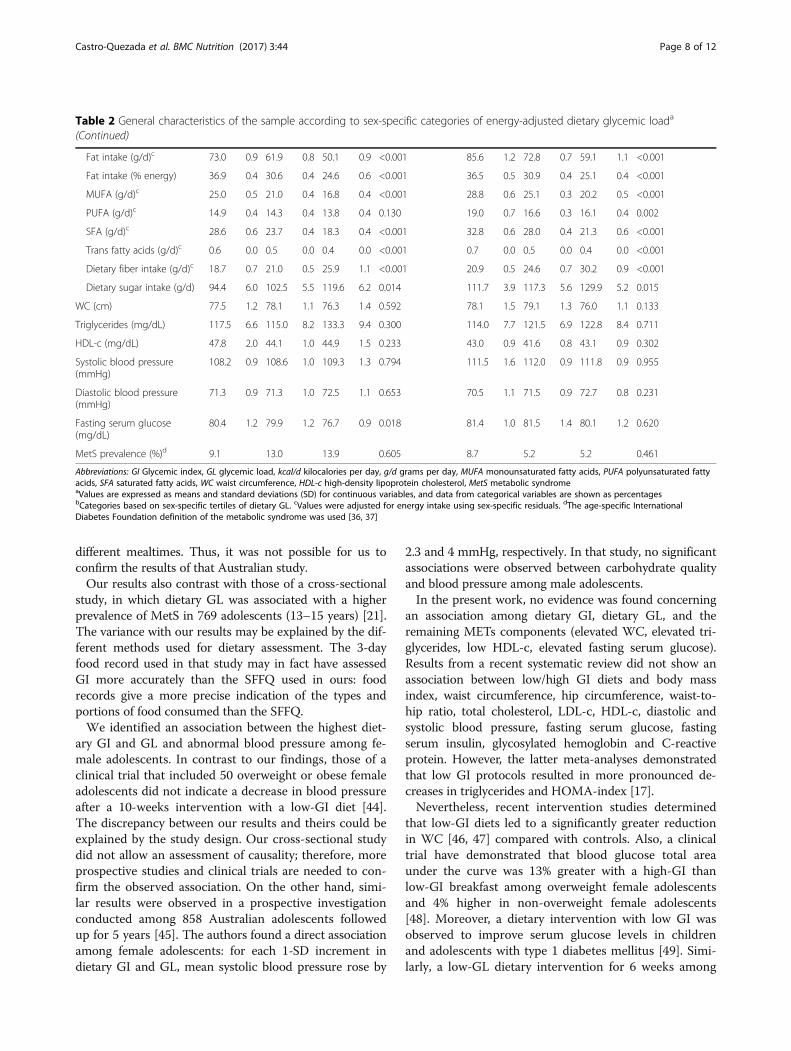
different mealtimes. Thus, it was not possible for us toconfirm the results of that Australian study.Our results also contrast with those of a cross-sectional
study, in which dietary GL was associated with a higherprevalence of MetS in 769 adolescents (13–15 years) [21].The variance with our results may be explained by the dif-ferent methods used for dietary assessment. The 3-dayfood record used in that study may in fact have assessedGI more accurately than the SFFQ used in ours: foodrecords give a more precise indication of the types andportions of food consumed than the SFFQ.We identified an association between the highest diet-
ary GI and GL and abnormal blood pressure among fe-male adolescents. In contrast to our findings, those of aclinical trial that included 50 overweight or obese femaleadolescents did not indicate a decrease in blood pressureafter a 10-weeks intervention with a low-GI diet [44].The discrepancy between our results and theirs could beexplained by the study design. Our cross-sectional studydid not allow an assessment of causality; therefore, moreprospective studies and clinical trials are needed to con-firm the observed association. On the other hand, simi-lar results were observed in a prospective investigationconducted among 858 Australian adolescents followedup for 5 years [45]. The authors found a direct associationamong female adolescents: for each 1-SD increment indietary GI and GL, mean systolic blood pressure rose by
2.3 and 4 mmHg, respectively. In that study, no significantassociations were observed between carbohydrate qualityand blood pressure among male adolescents.In the present work, no evidence was found concerning
an association among dietary GI, dietary GL, and theremaining METs components (elevated WC, elevated tri-glycerides, low HDL-c, elevated fasting serum glucose).Results from a recent systematic review did not show anassociation between low/high GI diets and body massindex, waist circumference, hip circumference, waist-to-hip ratio, total cholesterol, LDL-c, HDL-c, diastolic andsystolic blood pressure, fasting serum glucose, fastingserum insulin, glycosylated hemoglobin and C-reactiveprotein. However, the latter meta-analyses demonstratedthat low GI protocols resulted in more pronounced de-creases in triglycerides and HOMA-index [17].Nevertheless, recent intervention studies determined
that low-GI diets led to a significantly greater reductionin WC [46, 47] compared with controls. Also, a clinicaltrial have demonstrated that blood glucose total areaunder the curve was 13% greater with a high-GI thanlow-GI breakfast among overweight female adolescentsand 4% higher in non-overweight female adolescents[48]. Moreover, a dietary intervention with low GI wasobserved to improve serum glucose levels in childrenand adolescents with type 1 diabetes mellitus [49]. Simi-larly, a low-GL dietary intervention for 6 weeks among
Table 2 General characteristics of the sample according to sex-specific categories of energy-adjusted dietary glycemic loada
(Continued)
Fat intake (g/d)c 73.0 0.9 61.9 0.8 50.1 0.9 <0.001 85.6 1.2 72.8 0.7 59.1 1.1 <0.001
Fat intake (% energy) 36.9 0.4 30.6 0.4 24.6 0.6 <0.001 36.5 0.5 30.9 0.4 25.1 0.4 <0.001
MUFA (g/d)c 25.0 0.5 21.0 0.4 16.8 0.4 <0.001 28.8 0.6 25.1 0.3 20.2 0.5 <0.001
PUFA (g/d)c 14.9 0.4 14.3 0.4 13.8 0.4 0.130 19.0 0.7 16.6 0.3 16.1 0.4 0.002
SFA (g/d)c 28.6 0.6 23.7 0.4 18.3 0.4 <0.001 32.8 0.6 28.0 0.4 21.3 0.6 <0.001
Trans fatty acids (g/d)c 0.6 0.0 0.5 0.0 0.4 0.0 <0.001 0.7 0.0 0.5 0.0 0.4 0.0 <0.001
Dietary fiber intake (g/d)c 18.7 0.7 21.0 0.5 25.9 1.1 <0.001 20.9 0.5 24.6 0.7 30.2 0.9 <0.001
Dietary sugar intake (g/d) 94.4 6.0 102.5 5.5 119.6 6.2 0.014 111.7 3.9 117.3 5.6 129.9 5.2 0.015
WC (cm) 77.5 1.2 78.1 1.1 76.3 1.4 0.592 78.1 1.5 79.1 1.3 76.0 1.1 0.133
Triglycerides (mg/dL) 117.5 6.6 115.0 8.2 133.3 9.4 0.300 114.0 7.7 121.5 6.9 122.8 8.4 0.711
HDL-c (mg/dL) 47.8 2.0 44.1 1.0 44.9 1.5 0.233 43.0 0.9 41.6 0.8 43.1 0.9 0.302
Systolic blood pressure(mmHg)
108.2 0.9 108.6 1.0 109.3 1.3 0.794 111.5 1.6 112.0 0.9 111.8 0.9 0.955
Diastolic blood pressure(mmHg)
71.3 0.9 71.3 1.0 72.5 1.1 0.653 70.5 1.1 71.5 0.9 72.7 0.8 0.231
Fasting serum glucose(mg/dL)
80.4 1.2 79.9 1.2 76.7 0.9 0.018 81.4 1.0 81.5 1.4 80.1 1.2 0.620
MetS prevalence (%)d 9.1 13.0 13.9 0.605 8.7 5.2 5.2 0.461
Abbreviations: GI Glycemic index, GL glycemic load, kcal/d kilocalories per day, g/d grams per day, MUFA monounsaturated fatty acids, PUFA polyunsaturated fattyacids, SFA saturated fatty acids, WC waist circumference, HDL-c high-density lipoprotein cholesterol, MetS metabolic syndromeaValues are expressed as means and standard deviations (SD) for continuous variables, and data from categorical variables are shown as percentagesbCategories based on sex-specific tertiles of dietary GL. cValues were adjusted for energy intake using sex-specific residuals. dThe age-specific InternationalDiabetes Foundation definition of the metabolic syndrome was used [36, 37]
Castro-Quezada et al. BMC Nutrition (2017) 3:44 Page 8 of 12
overweight and obese 11-year-old children showed a re-duction in fasting glucose [50]. However, clinical trialshave been conducted in specific population groups: thisfact—along with dietary intervention—could explain thedifferences from our results.In our study, mean dietary GI was 51.5 among fe-
male adolescents and 52.1 in male adolescents, anddietary GL was higher among male adolescents (161.4)than female adolescents (135.8). The GI values of oursample were lower than those found in Australian,Canadian, British or Japanese adolescents (around 56to 64 units) and mean dietary GL of our study was inagreement to previous studies conducted in adoles-cents (range from 128 to 168 units) [20, 51–54]. Thusit is still necessary and urgent to elucidate the rolethat low GI or GL diets exert on MetS onset in youthpopulation worldwide, since individuals with MetShave a 2-fold risk of developing cardiovascular disease[55] and higher risk of T2D compared with peoplewithout this syndrome [56].One hypothesized metabolic effect by which high-GI
and GL diets increase blood pressure is a postprandialglycemic response and the consequent hyperinsulinemiaelicited after consuming high-GI foods [57]. It has beenfound that higher dietary GI during puberty is
prospectively associated with greater insulin resistance[58]. Hyperinsulinemia has been associated with abnor-mal levels of blood pressure through stimulation of thesympathetic nervous system [59], increased sodium re-tention, and volume expansion [45].We acknowledge that our study has several limitations.
Owing to the cross-sectional design, we cannot makecausal inferences. Our findings are specific for Mexican ad-olescents and cannot therefore be generalized to otherpopulation groups. Other limitation is that we were unableto assess the impact of pubertal or hormonal status in ouranalyses. Puberty could be a confounding variable sincetransition from Tanner stage I to Tanner stage III has beenassociated with temporary reduction of insulin sensitivity,increases in fasting glucose and insulin levels and differenthormonal changes [60]. In addition, physical activity wasnot included as a covariate in our analyses due to the lackof significance in our models. However, a recent meta-analysis has found an association between physical activityand MetS in adolescents [61]. We therefore, cannot discardthat measurement error might exist since questionnairesused in this study are not validated for estimating physicalactivity in Mexican adolescents. Also, underreporting couldbe a source of bias in our study, since evidence in adoles-cents demonstrated that misreporters showed higher rates
Table 3 Association between metabolic syndrome and sex-specific categories of dietary glycemic index
Dietary glycemic indexa
Female adolescents Male adolescents
Low Moderate High P trend Low Moderate High P trend
MetS
Model 1b OR (95% CI) 1 0.92 (0.35–2.40) 1.78 (0.70–4.55) 0.192 1 0.50 (0.15–1.63) 1.21 (0.50–3.19) 0.673
Model 2c OR (95% CI) 1 0.81 (0.30–2.19) 1.60 (0.62–4.15) 0.275 1 0.56 (0.18–1.77) 1.25 (0.48–3.31) 0.641
Elevated WC
Model 1b OR (95% CI) 1 1.22 (0.58–2.54) 1.24 (0.70–2.22) 0.486 1 0.84 (0.40–1.74) 1.13 (0.58–2.20) 0.696
Model 2c OR (95% CI) 1 1.16 (0.56–2.42) 1.33 (0.72–2.45) 0.361 1 0.87 (0.43–1.76) 1.25 (0.64–2.46) 0.513
Elevated triglycerides
Model 1b OR (95% CI) 1 1.41 (0.64–3.12) 0.98 (0.51–1.88) 0.840 1 0.80 (0.38–1.66) 1.06 (0.53–2.12) 0.850
Model 2c OR (95% CI) 1 1.25 (0.58–2.68) 0.99 (0.52–1.88) 0.911 1 0.78 (0.35–1.70) 1.15 (0.56–2.35) 0.714
Low HDL-c
Model 1b OR (95% CI) 1 0.69 (0.37–1.29) 1.65 (0.93–2.94) 0.058 1 1.58 (0.91–2.76) 1.26 (0.76–2.09) 0.396
Model 2c OR (95% CI) 1 0.67 (0.36–1.26) 1.56 (0.82–2.95) 0.126 1 1.71 (1.00–2.92) 1.29 (0.78–2.13) 0.321
Abnormal blood pressure
Model 1b OR (95% CI) 1 2.22 (0.76–6.43) 3.66 (1.59–8.39) 0.009 1 0.48 (0.18–1.28) 1.67 (0.82–3.40) 0.139
Model 2c OR (95% CI) 1 2.02 (0.60–6.75) 3.66 (1.46–9.22) 0.012 1 0.53 (0.20–1.41) 1.66 (0.83–3.32) 0.143
Elevated fasting serum glucose
Model 1b OR (95% CI) 1 0.71 (0.13–3.76) 0.24 (0.05–1.32) 0.114 1 1.25 (0.23–6.63) 2.30 (0.47–11.22) 0.278
Model 2c OR (95% CI) 1 1.07 (0.23–5.11) 0.24 (0.05–1.22) 0.068 1 1.21 (0.24–6.17) 2.72 (0.43–17.08) 0.289
Abbreviations: OR Odds ratio, CI confidence interval, MetS metabolic syndrome, WC waist circumference, HDL-c high-density lipoprotein cholesterol. aCategoriesbased on sex-specific tertiles of dietary GI. bModel adjusted for age (years). cMultivariate model adjusted for age (years), socioeconomic level (low, middle, or high),geographic region (north, central, south, or metropolitan area) and dietary fiber intake (continuous, energy-adjusted)
Castro-Quezada et al. BMC Nutrition (2017) 3:44 Page 9 of 12
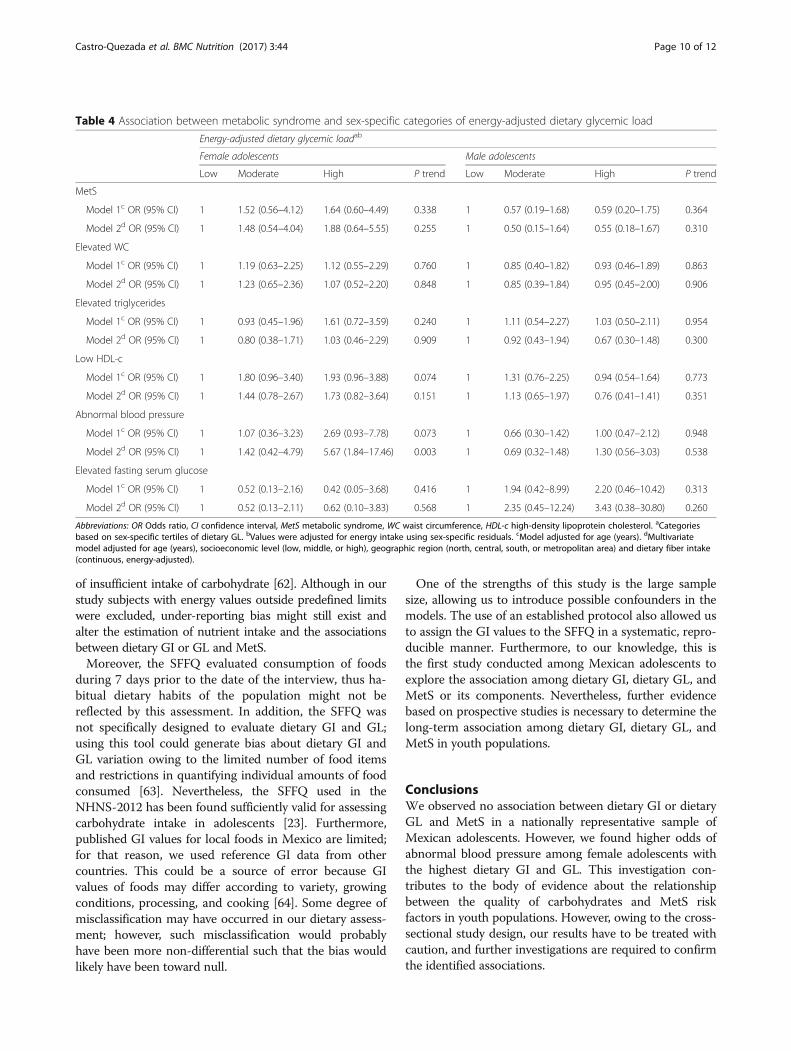
of insufficient intake of carbohydrate [62]. Although in ourstudy subjects with energy values outside predefined limitswere excluded, under-reporting bias might still exist andalter the estimation of nutrient intake and the associationsbetween dietary GI or GL and MetS.Moreover, the SFFQ evaluated consumption of foods
during 7 days prior to the date of the interview, thus ha-bitual dietary habits of the population might not bereflected by this assessment. In addition, the SFFQ wasnot specifically designed to evaluate dietary GI and GL;using this tool could generate bias about dietary GI andGL variation owing to the limited number of food itemsand restrictions in quantifying individual amounts of foodconsumed [63]. Nevertheless, the SFFQ used in theNHNS-2012 has been found sufficiently valid for assessingcarbohydrate intake in adolescents [23]. Furthermore,published GI values for local foods in Mexico are limited;for that reason, we used reference GI data from othercountries. This could be a source of error because GIvalues of foods may differ according to variety, growingconditions, processing, and cooking [64]. Some degree ofmisclassification may have occurred in our dietary assess-ment; however, such misclassification would probablyhave been more non-differential such that the bias wouldlikely have been toward null.
One of the strengths of this study is the large samplesize, allowing us to introduce possible confounders in themodels. The use of an established protocol also allowed usto assign the GI values to the SFFQ in a systematic, repro-ducible manner. Furthermore, to our knowledge, this isthe first study conducted among Mexican adolescents toexplore the association among dietary GI, dietary GL, andMetS or its components. Nevertheless, further evidencebased on prospective studies is necessary to determine thelong-term association among dietary GI, dietary GL, andMetS in youth populations.
ConclusionsWe observed no association between dietary GI or dietaryGL and MetS in a nationally representative sample ofMexican adolescents. However, we found higher odds ofabnormal blood pressure among female adolescents withthe highest dietary GI and GL. This investigation con-tributes to the body of evidence about the relationshipbetween the quality of carbohydrates and MetS riskfactors in youth populations. However, owing to the cross-sectional study design, our results have to be treated withcaution, and further investigations are required to confirmthe identified associations.
Table 4 Association between metabolic syndrome and sex-specific categories of energy-adjusted dietary glycemic load
Energy-adjusted dietary glycemic loadab
Female adolescents Male adolescents
Low Moderate High P trend Low Moderate High P trend
MetS
Model 1c OR (95% CI) 1 1.52 (0.56–4.12) 1.64 (0.60–4.49) 0.338 1 0.57 (0.19–1.68) 0.59 (0.20–1.75) 0.364
Model 2d OR (95% CI) 1 1.48 (0.54–4.04) 1.88 (0.64–5.55) 0.255 1 0.50 (0.15–1.64) 0.55 (0.18–1.67) 0.310
Elevated WC
Model 1c OR (95% CI) 1 1.19 (0.63–2.25) 1.12 (0.55–2.29) 0.760 1 0.85 (0.40–1.82) 0.93 (0.46–1.89) 0.863
Model 2d OR (95% CI) 1 1.23 (0.65–2.36) 1.07 (0.52–2.20) 0.848 1 0.85 (0.39–1.84) 0.95 (0.45–2.00) 0.906
Elevated triglycerides
Model 1c OR (95% CI) 1 0.93 (0.45–1.96) 1.61 (0.72–3.59) 0.240 1 1.11 (0.54–2.27) 1.03 (0.50–2.11) 0.954
Model 2d OR (95% CI) 1 0.80 (0.38–1.71) 1.03 (0.46–2.29) 0.909 1 0.92 (0.43–1.94) 0.67 (0.30–1.48) 0.300
Low HDL-c
Model 1c OR (95% CI) 1 1.80 (0.96–3.40) 1.93 (0.96–3.88) 0.074 1 1.31 (0.76–2.25) 0.94 (0.54–1.64) 0.773
Model 2d OR (95% CI) 1 1.44 (0.78–2.67) 1.73 (0.82–3.64) 0.151 1 1.13 (0.65–1.97) 0.76 (0.41–1.41) 0.351
Abnormal blood pressure
Model 1c OR (95% CI) 1 1.07 (0.36–3.23) 2.69 (0.93–7.78) 0.073 1 0.66 (0.30–1.42) 1.00 (0.47–2.12) 0.948
Model 2d OR (95% CI) 1 1.42 (0.42–4.79) 5.67 (1.84–17.46) 0.003 1 0.69 (0.32–1.48) 1.30 (0.56–3.03) 0.538
Elevated fasting serum glucose
Model 1c OR (95% CI) 1 0.52 (0.13–2.16) 0.42 (0.05–3.68) 0.416 1 1.94 (0.42–8.99) 2.20 (0.46–10.42) 0.313
Model 2d OR (95% CI) 1 0.52 (0.13–2.11) 0.62 (0.10–3.83) 0.568 1 2.35 (0.45–12.24) 3.43 (0.38–30.80) 0.260
Abbreviations: OR Odds ratio, CI confidence interval, MetS metabolic syndrome, WC waist circumference, HDL-c high-density lipoprotein cholesterol. aCategoriesbased on sex-specific tertiles of dietary GL. bValues were adjusted for energy intake using sex-specific residuals. cModel adjusted for age (years). dMultivariatemodel adjusted for age (years), socioeconomic level (low, middle, or high), geographic region (north, central, south, or metropolitan area) and dietary fiber intake(continuous, energy-adjusted).
Castro-Quezada et al. BMC Nutrition (2017) 3:44 Page 10 of 12

AbbreviationsBMI: Body mass index; CI: Confidence interval; GI: Glycemic index;GL: Glycemic load; HDL-c: High-density lipoprotein cholesterol;IDF: International Diabetes Federation; MetS: Metabolic syndrome;MUFA: Monounsaturated fatty acids; NHNS-2012: National Health andNutrition Survey 2012; OR: Odds ratio; PUFA: Polyunsaturated fatty acids;RCTs: Randomized controlled trials; SD: Standard deviation;SES: Socioeconomic status; SFA: Saturated fatty acids; SFFQ: Semiquantitativefood-frequency questionnaire; T2D: Type 2 diabetes mellitus; WC: Waistcircumference; WHO: World Health Organization
AcknowledgementsThe authors thank Ignacio Mendez Gomez-Humaran for his assistance withstatistical analyses.
FundingIC-Q received grants from Consejo Nacional de Ciencia y Tecnología deMéxico (CONACYT), Secretaria de Educación Pública (SEP), the MexicanGovernment, and the PhD International Mobility Programme, University ofGranada and CEI-BioTicGranada.
Availability of data and materialsSample was obtained from the Mexican NHNS-2012 dataset, which is freelyaccessible from the National Public Health Institute of Mexico web site: http://ensanut.insp.mx/basesdoctos.php#.WOueHoWcHIV.In order to analyze data from the NHNS-2012 survey, permission wasobtained from the Ethics Review Board of the National Public Health Instituteof Mexico. The datasets of the current study are available from thecorresponding author on reasonable request.
Authors’ contributionsIC-Q and SA-E contributed to the study design, data analyses, and interpretationof findings and wrote the manuscript with important input and feedback fromall coauthors; AS-V, MDR-L, RA, and LS-M contributed to the study design andto the critical revision of the manuscript; TS-L contributed to the study design,interpretation of findings, and critical revision of the manuscript. All the authorsread and approved the final version of the manuscript.
Competing interestsThe authors declare that they have no competing interests.
Consent for publicationNot applicable.
Ethics approval and consent to participateThis study was conducted according to the guidelines laid down in theDeclaration of Helsinki, and all procedures involving human subjects wereapproved by the Ethics Review Board of the National Public Health Instituteof Mexico. Written informed consent was obtained from all subjects or theirlegal guardians prior to the study.
Publisher’s NoteSpringer Nature remains neutral with regard to jurisdictional claims inpublished maps and institutional affiliations.
Author details1Research Institute of Biomedical and Health Sciences, University of LasPalmas de Gran Canaria, Luis Pasteur s/n, 35016 Las Palmas de Gran Canaria,Spain. 2Department of Nutrition and Food Science, School of Pharmacy,University of Granada, Campus Universitario de la Cartuja, 18071 Granada,Spain. 3Center for Nutrition and Health Research, National Institute of PublicHealth of Mexico, Universidad No. 655, Colonia Santa María Ahuacatitlán,62100 Cuernavaca, Morelos, Mexico. 4Ciber Fisiopatología Obesidad yNutrición (CIBEROBN, CB06/03), Instituto de Salud Carlos III (ISCIII), SpanishGovernment, Madrid, Spain. 5Institute of Nutrition and Food Technologies,University of Granada, Avda. del Conocimiento, Armilla, 18100 Granada,Spain.
Received: 25 October 2016 Accepted: 12 May 2017
References1. Evia-Viscarra ML, Rodea-Montero ER, Apolinar-Jiménez E, Quintana-Vargas S.
Metabolic syndrome and its components among obese (BMI >=95th)Mexican adolescents. Endocr Connect. 2013;2:208–15.
2. Weiss R, Dziura J, Burgert TS, Tamborlane WV, Taksali SE, Yeckel CW, et al.Obesity and the metabolic syndrome in children and adolescents. N Engl JMed. 2004;350(23):2362–74.
3. Gutierrez JP, Rivera-Domarco J, Shamah-Levy T, Villalpando-Hernández S,Franco A, Cuevas-Nasu L, et al. National Health and Nutrition Survey 2012.Nationals Results. (Encuesta Nacional de Salud y Nutrición 2012. ResultadosNacionales). 1st ed. Cuernavaca: Instituto Nacional de Salud Pública; 2012.
4. Rodriguez-Moran M, Salazar-Vazquez B, Violante R, Guerrero-Romero F.Metabolic syndrome among children and adolescents aged 10–18 years.Diabetes Care. 27. United States ; 2004. p. 2516-2517.
5. Halley Castillo E, Borges G, Talavera JO, Orozco R, Vargas-Alemán C, Huitrón-Bravo G, et al. Body mass index and the prevalence of metabolic syndromeamong children and adolescents in two Mexican populations. J AdolescHealth. 2007;40:521–6.
6. Mann J, Cummings JH, Englyst HN, Key T, Liu S, Riccardi G, et al. FAO/WHOscientific update on carbohydrates in human nutrition: conclusions. Eur JClin Nutr. 2007;61(Suppl 1):S132–7.
7. Augustin LS, Kendall CW, Jenkins DJ, Willett WC, Astrup A, Barclay AW, et al.Glycemic index, glycemic load and glycemic response: An InternationalScientific Consensus Summit from the International Carbohydrate QualityConsortium (ICQC). Nutr Metab Cardiovasc Dis. 2015; doi: 10.1016/j.numecd.2015.05.005.
8. Jenkins DJ, Wolever TM, Taylor RH, Barker H, Fielden H, Baldwin JM, et al.Glycemic index of foods: a physiological basis for carbohydrate exchange.Am J Clin Nutr. 1981;34:362–6.
9. Jenkins DJ, Kendall CW, Augustin LS, Franceschi S, Hamidi M, Marchie A, etal. Glycemic index: overview of implications in health and disease. Am J ClinNutr. 2002;76:266S–73S.
10. Salmerón J, Manson JE, Stampfer MJ, Colditz GA, Wing AL, Willett WC.Dietary fiber, glycemic load, and risk of non-insulin-dependent diabetesmellitus in women. JAMA. 1997;277:472–7.
11. Livesey G, Taylor R, Hulshof T, Howlett J. Glycemic response and health–asystematic review and meta-analysis: relations between dietary glycemicproperties and health outcomes. Am J Clin Nutr. 2008;87:258S–68S.
12. Thomas DE, Elliott EJ, Baur L. Low glycaemic index or low glycaemic loaddiets for overweight and obesity. Cochrane Database Syst Rev. 2007;3:CD005105.
13. Goff LM, Cowland DE, Hooper L, Frost GS. Low glycaemic index diets andblood lipids: a systematic review and meta-analysis of randomisedcontrolled trials. Nutr Metab Cardiovasc Dis. 2013;23:1–10.
14. Schwingshackl L, Hoffmann G. Long-term effects of low glycemic index/load vs. high glycemic index/load diets on parameters of obesity andobesity-associated risks: a systematic review and meta-analysis. Nutr MetabCardiovasc Dis. 2013;23:699–706.
15. Sacks FM, Carey VJ, Anderson CA, Miller ER, Copeland T, Charleston J, et al.Effects of high vs low glycemic index of dietary carbohydrate oncardiovascular disease risk factors and insulin sensitivity: the OmniCarbrandomized clinical trial. JAMA. 2014;312:2531–41.
16. Jenkins DJ, Kendall CW, McKeown-Eyssen G, Josse RG, Silverberg J, BoothGL, et al. Effect of a low-glycemic index or a high-cereal fiber diet on type 2diabetes: a randomized trial. JAMA. 2008;300:2742–53.
17. Schwingshackl L, Hobl LP, Hoffmann G. Effects of low glycaemic index/lowglycaemic load vs. high glycaemic index/ high glycaemic load diets onoverweight/obesity and associated risk factors in children and adolescents:a systematic review and meta-analysis. Nutr J. 2015;14:87.
18. Finley CE, Barlow CE, Halton TL, Haskell WL. Glycemic index, glycemic load,and prevalence of the metabolic syndrome in the cooper centerlongitudinal study. J Am Diet Assoc. 2010;110:1820–9.
19. Juanola-Falgarona M, Salas-Salvadó J, Buil-Cosiales P, Corella D, Estruch R,Ros E, et al. Dietary Glycemic Index and Glycemic Load Are PositivelyAssociated with Risk of Developing Metabolic Syndrome in Middle-Agedand Elderly Adults. J Am Geriatr Soc. 2015;63:1991–2000.
20. Nicholl A, du Heaume M, Mori TA, Beilin LJ, Oddy WH, Bremner AP, etal. Higher breakfast glycaemic load is associated with increased
Castro-Quezada et al. BMC Nutrition (2017) 3:44 Page 11 of 12

metabolic syndrome risk, including lower HDL-cholesterolconcentrations and increased TAG concentrations, in adolescent girls. BrJ Nutr. 2014;112:1974–83.
21. O'Sullivan TA, Lyons-Wall P, Bremner AP, Ambrosini GL, Huang RC, Beilin LJ,et al. Dietary glycaemic carbohydrate in relation to the metabolic syndromein adolescents: comparison of different metabolic syndrome definitions.Diabet Med. 2010;27:770–8.
22. Romero-Martinez M, Shamah-Levy T, Franco-Nunez A, Villalpando S, Cuevas-Nasu L, Gutierrez JP, et al. National Health and Nutrition Survey 2012: designand coverage. Salud Publica Mex. 2013;55(Suppl 2):S332–40.
23. Denova-Gutiérrez E, Ramírez-Silva I, Rodríguez-Ramírez S, Jiménez-Aguilar A,Shamah-Levy T, Rivera-Dommarco JA. Validity of a food frequencyquestionnaire to assess food intake in Mexican adolescent and adultpopulation. Salud Publica Mex. 2016;58:617–28.
24. Ramírez-Silva I, Jiménez-Aguilar A, Valenzuela-Bravo D, Martinez-Tapia B,Rodríguez-Ramírez S, Gaona-Pineda E, et al. Methodology for estimating dietarydata from the semi-quantitative food frequency questionnaire of the MexicanNational Health and Nutrition Survey 2012. Salud Publica Mex. 2016;58:629–38.
25. Institute of Medicine. Energy, Dietary reference intakes for energy, carbohydrates,fiber, fat, protein and amino acids (macronutrients). Washington, DC: Institute ofMedicine, National Academies Press; 2005. p. 107–264.
26. Hernández B, de Haene J, Barquera S, Monterrubio E, Rivera J, Shamah T, etal. Factores asociados con la actividad física en mujeres mexicanas en edadreproductiva. Pan Am J Public Health. 2003;14:235–44.
27. Frankenfield D, Roth-Yousey L, Compher C. Comparison of predictiveequations for resting metabolic rate in healthy nonobese and obese adults:a systematic review. J Am Diet Assoc. 2005;105:775–89.
28. Food and Agriculture Organization of the United Nations, World HealthOrganization, United Nations University. Human energy requirements:Report of a Joint FAO/WHO/ONU Expert Consultation. Rome: FAO; 2004.
29. Willett WC, Howe GR, Kushi LH. Adjustment for total energy intake inepidemiologic studies. Am J Clin Nutr. 1997;65(Suppl 4):1220S–8S.discussion 9S-31S
30. Louie JC, Flood V, Turner N, Everingham C, Gwynn J. Methodology foradding glycemic index values to 24-hour recalls. Nutrition. 2011;27:59–64.
31. Atkinson FS, Foster-Powell K, Brand-Miller JC. International tables of glycemicindex and glycemic load values: 2008. Diabetes Care. 2008;31:2281–3.
32. The University of Sydney. Sydney University Glycemic Index ResearchService 2014. 2016. http://www.glycemicindex.com/. Accessed 17 Nov 2015.
33. Wolever TM, Nguyen PM, Chiasson JL, Hunt JA, Josse RG, Palmason C, et al.Determinants of diet glycemic index calculated retrospectively from dietrecords of 342 individuals with non-insulin-dependent diabetes mellitus.Am J Clin Nutr. 1994;59:1265–9.
34. de Onis M, Onyango AW, Borghi E, Siyam A, Nishida C, Siekmann J.Development of a WHO growth reference for school-aged children andadolescents. Bull World Health Organ. 2007;85:660–7.
35. Chobanian AV, Bakris GL, Black HR, Cushman WC, Green LA, Izzo JL, et al.The Seventh Report of the Joint National Committee on Prevention,Detection, Evaluation, and Treatment of High Blood Pressure: the JNC 7report. JAMA. 2003;289:2560–72.
36. Alberti G, Zimmet P, Kaufman F, Tajima N, Silink M, Arslanian S, et al. TheIDF consensus definition of the metabolic syndrome in children andadolescents. International Diabetes Federation: Brussels; 2007.
37. Zimmet P, Alberti KG, Kaufman F, Tajima N, Silink M, Arslanian S, et al. Themetabolic syndrome in children and adolescents - an IDF consensus report.Pediatr Diabetes. 2007;8:299–306.
38. Pereira MA, FitzerGerald SJ, Gregg EW, Joswiak ML, Ryan WJ, Suminski RR, etal. A collection of Physical Activity Questionnaires for health-relatedresearch. Med Sci Sports Exerc. 1997;29(Suppl 6):S1–205.
39. Craig CL, Marshall AL, Sjöström M, Bauman AE, Booth ML, Ainsworth BE, etal. International physical activity questionnaire: 12-country reliability andvalidity. Med Sci Sports Exerc. 2003;35:1381–95.
40. Hernandez B, Gortmaker SL, Colditz GA, Peterson KE, Laird NM, Parra-Cabrera S. Association of obesity with physical activity, television programsand other forms of video viewing among children in Mexico city. Int J ObesRelat Metab Disord. 1999;23:845–54.
41. Pols MA, Peeters PH, Bueno-De-Mesquita HB, Ocké MC, Wentink CA, KemperHC, et al. Validity and repeatability of a modified Baecke questionnaire onphysical activity. Int J Epidemiol. 1995;24:381–8.
42. WHO. Global Recommendations on Physical Activity for Health. Geneva,Switzerland: World Health Organization; 2010.
43. Damsgaard CT, Papadaki A, Jensen SM, Ritz C, Dalskov SM, Hlavaty P, et al.Higher protein diets consumed ad libitum improve cardiovascular riskmarkers in children of overweight parents from eight European countries. JNutr. 2013;143:810–7.
44. Rouhani MH, Kelishadi R, Hashemipour M, Esmaillzadeh A, Azadbakht L. Theeffect of low glycemic index diet on body weight status and bloodpressure in overweight adolescent girls: a randomized clinical trial. Nutr ResPract. 2013;7:385–92.
45. Gopinath B, Flood VM, Rochtchina E, Baur LA, Smith W, Mitchell P. Influenceof high glycemic index and glycemic load diets on blood pressure duringadolescence. Hypertension. 2012;59:1272–7.
46. Kong AP, Choi KC, Chan RS, Lok K, Ozaki R, Li AM, et al. A randomizedcontrolled trial to investigate the impact of a low glycemic index (GI) dieton body mass index in obese adolescents. BMC Public Health. 2014;14:180.
47. Mirza NM, Palmer MG, Sinclair KB, McCarter R, He J, Ebbeling CB, et al.Effects of a low glycemic load or a low-fat dietary intervention on bodyweight in obese Hispanic American children and adolescents: a randomizedcontrolled trial. Am J Clin Nutr. 2013;97:276–85.
48. Zakrzewski JK, Stevenson EJ, Tolfrey K. Effect of breakfast glycemic index onmetabolic responses during rest and exercise in overweight and non-overweight adolescent girls. Eur J Clin Nutr. 2012;66:436–42.
49. Rovner AJ, Nansel TR, Gellar L. The effect of a low-glycemic diet vs astandard diet on blood glucose levels and macronutrient intake in childrenwith type 1 diabetes. J Am Diet Assoc. 2009;109:303–7.
50. Fajcsak Z, Gabor A, Kovacs V, Martos E. The effects of 6-week low glycemicload diet based on low glycemic index foods in overweight/obesechildren–pilot study. J Am Coll Nutr. 2008;27:12–21.
51. Jones M, Barclay AW, Brand-Miller JC, Louie JC. Dietary glycaemic index andglycaemic load among Australian children and adolescents: results from the2011-2012 Australian Health Survey. Br J Nutr. 2016;116:178–87.
52. Forbes LE, Storey KE, Fraser SN, Spence JC, Plotnikoff RC, Raine KD, et al.Dietary patterns associated with glycemic index and glycemic load amongAlberta adolescents. Appl Physiol Nutr Metab. 2009;34:648–58.
53. Murakami K, McCaffrey TA, Livingstone MB. Dietary glycaemic index andglycaemic load in relation to food and nutrient intake and indices of bodyfatness in British children and adolescents. Br J Nutr. 2013;110:1512–23.
54. Murakami K, Miyake Y, Sasaki S, Tanaka K, Arakawa M. Dietary glycemicindex and glycemic load in relation to risk of overweight in Japanesechildren and adolescents: the Ryukyus Child Health Study. Int J Obes. 2011;35:925–36.
55. Mottillo S, Filion KB, Genest J, Joseph L, Pilote L, Poirier P, et al. Themetabolic syndrome and cardiovascular risk a systematic review and meta-analysis. J Am Coll Cardiol. 2010;28(56):1113–32.
56. Alberti KG, Eckel RH, Grundy SM, Zimmet PZ, Cleeman JI, Donato KA, et al.Harmonizing the metabolic syndrome: a joint interim statement of theInternational Diabetes Federation Task Force on Epidemiology and Prevention;National Heart, Lung, and Blood Institute; American Heart Association; WorldHeart Federation; International Atherosclerosis Society; and InternationalAssociation for the Study of Obesity. Circulation. 2009;120:1640–5.
57. Wolever T. Physiological mechanisms and observed health impacts relatedto the glycaemic index: some observations. Int J Obes. 2006;30:S72–S8.
58. Goletzke J, Herder C, Joslowski G, Bolzenius K, Remer T, Wudy SA, et al.Habitually higher dietary glycemic index during puberty is prospectivelyrelated to increased risk markers of type 2 diabetes in younger adulthood.Diabetes Care. 2013;36:1870–6.
59. Landsberg L. Insulin-mediated sympathetic stimulation: role in thepathogenesis of obesity-related hypertension (or, how insulin affects bloodpressure, and why). J Hypertens. 2001;19:523–8.
60. Goran MI, Gower BA. Longitudinal study on pubertal insulin resistance.Diabetes. 2001;50:2444–50.
61. Oliveira RG, Guedes DP. Physical Activity, Sedentary Behavior, CardiorespiratoryFitness and Metabolic Syndrome in Adolescents: Systematic Review and Meta-Analysis of Observational Evidence. PLoS One. 2016;11:e0168503.
62. Serra-Majem L, Ribas L, Pérez-Rodrigo C, García-Closas R, Peña-Quintana L,Aranceta J. Determinants of nutrient intake among children and adolescents:results from the enKid Study. Ann Nutr Metab. 2002;46(Suppl 1):31–8.
63. Hare-Bruun H, Nielsen BM, Grau K, Oxlund AL, Heitmann BL. Shouldglycemic index and glycemic load be considered in dietaryrecommendations? Nutr Rev. 2008;66:569–90.
64. Wolever TM. Is glycaemic index (GI) a valid measure of carbohydratequality? Eur J Clin Nutr. 2013;67:522–31.
Castro-Quezada et al. BMC Nutrition (2017) 3:44 Page 12 of 12