glycomics meets lipidomics – associations of n-glycans with
TRANSCRIPT
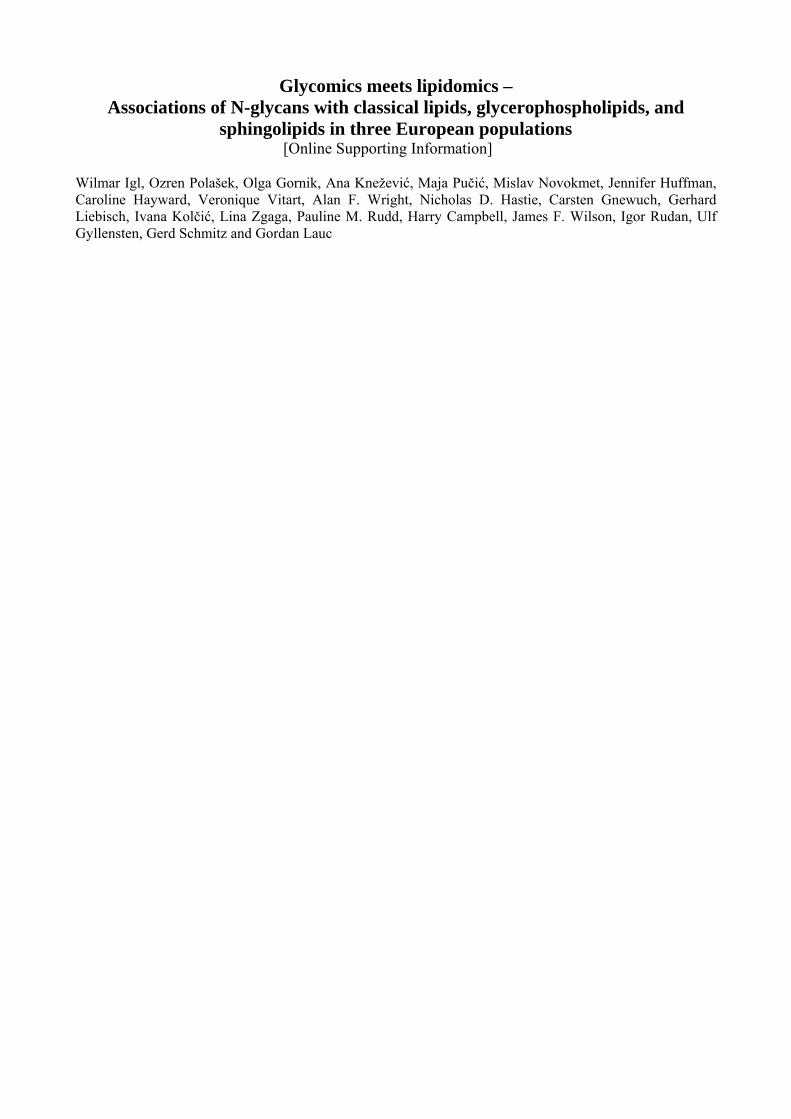
Glycomics meets lipidomics – Associations of N-glycans with classical lipids, glycerophospholipids, and
sphingolipids in three European populations [Online Supporting Information]
Wilmar Igl, Ozren Polašek, Olga Gornik, Ana Knežević, Maja Pučić, Mislav Novokmet, Jennifer Huffman, Caroline Hayward, Veronique Vitart, Alan F. Wright, Nicholas D. Hastie, Carsten Gnewuch, Gerhard Liebisch, Ivana Kolčić, Lina Zgaga, Pauline M. Rudd, Harry Campbell, James F. Wilson, Igor Rudan, Ulf Gyllensten, Gerd Schmitz and Gordan Lauc
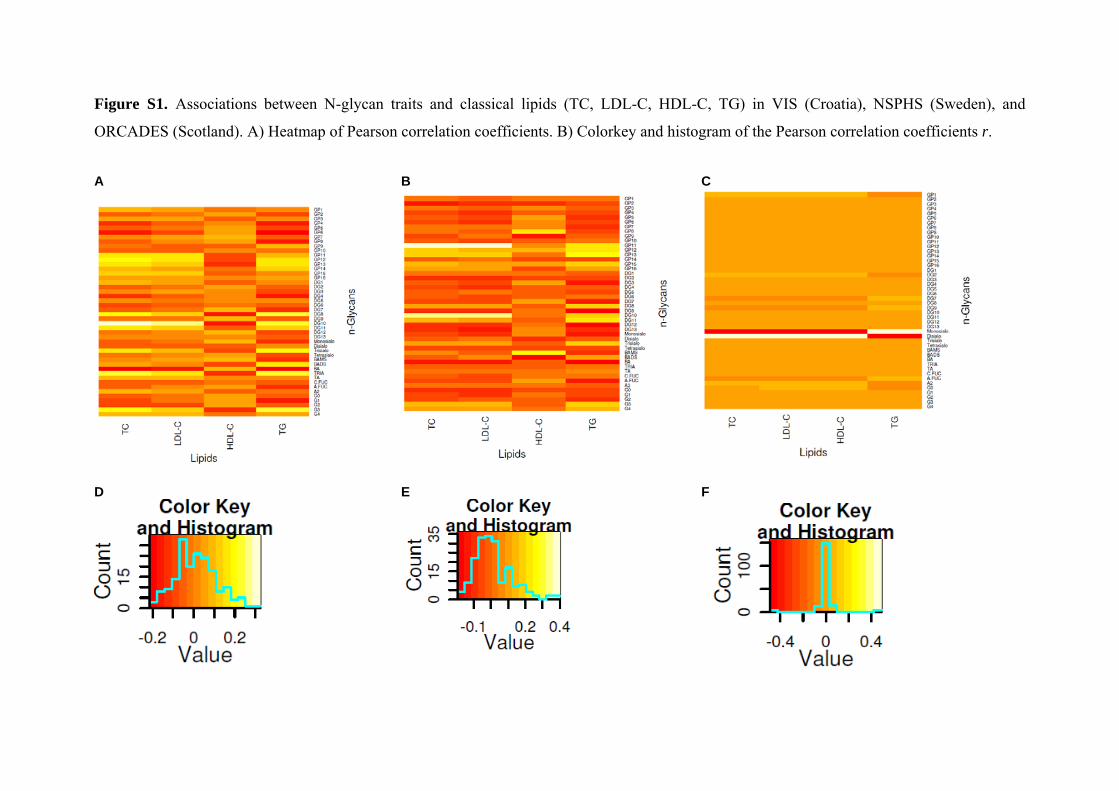
Figure S1. Associations between N-glycan traits and classical lipids (TC, LDL-C, HDL-C, TG) in VIS (Croatia), NSPHS (Sweden), and
ORCADES (Scotland). A) Heatmap of Pearson correlation coefficients. B) Colorkey and histogram of the Pearson correlation coefficients r.
A
B
C
D
E
F

Figure S2. Associations between glycan species and glycerophospholipids in the VIS cohort (Croatia). A) Heatmap of Pearson correlation coefficients.
B) Colorkey and histogram of the Pearson correlation coefficients r.
A
B
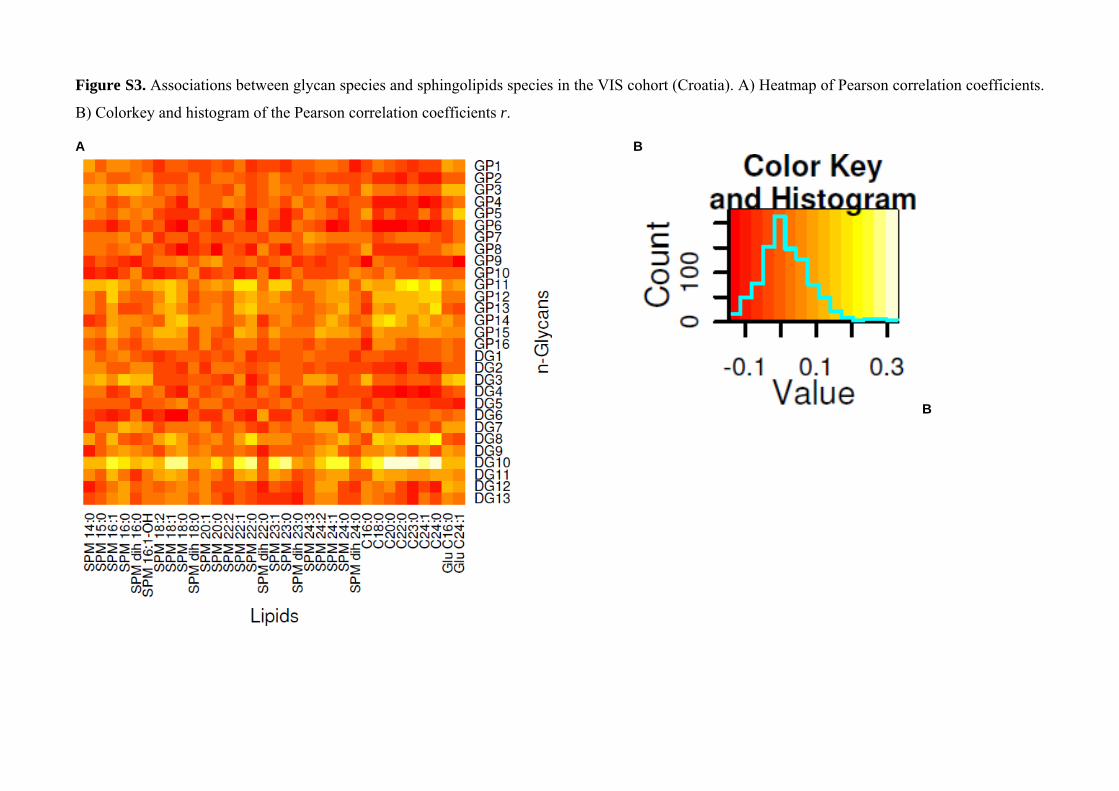
Figure S3. Associations between glycan species and sphingolipids species in the VIS cohort (Croatia). A) Heatmap of Pearson correlation coefficients.
B) Colorkey and histogram of the Pearson correlation coefficients r.
A
B
B

Figure S4. Associations between glycan summary scores and lipid summary scores in the VIS cohort (Croatia). A) Heatmap of Pearson correlation
coefficients. B) Colorkey and histogram of the Pearson correlation coefficients r.
A
B

Figure S5. Associations between glycan species and glycerophospholipids in the ORCADES cohort (Scotland). A) Heatmap of Pearson correlation
coefficients. B) Colorkey and histogram of the Pearson correlation coefficients r.
A
B

Figure S6. Associations between glycan species and sphingolipids species in the ORCADES cohort (Scotland). A) Heatmap of Pearson correlation
coefficients. B) Colorkey and histogram of the Pearson correlation coefficients r.
A
B

Figure S7. Associations between summary glycan scores and summary lipid scores in the ORCADES cohort (Scotland). A) Heatmap of Pearson
correlation coefficients. B) Colorkey and histogram of the Pearson correlation coefficients r.
A B

Figure S8. Associations between glycan species and glycerophospholipids in the NSPHS cohort (Sweden). A) Heatmap of Pearson correlation
coefficients. B) Colorkey and histogram of the Pearson correlation coefficients r.
A
B
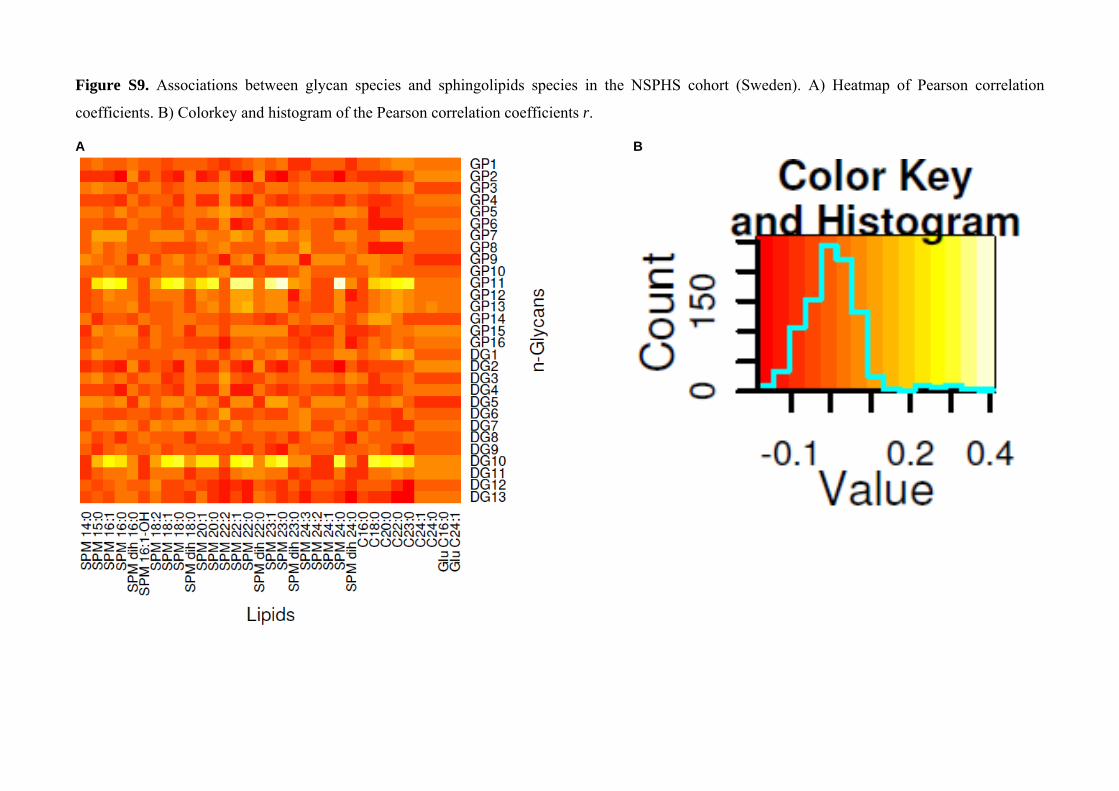
Figure S9. Associations between glycan species and sphingolipids species in the NSPHS cohort (Sweden). A) Heatmap of Pearson correlation
coefficients. B) Colorkey and histogram of the Pearson correlation coefficients r.
A B
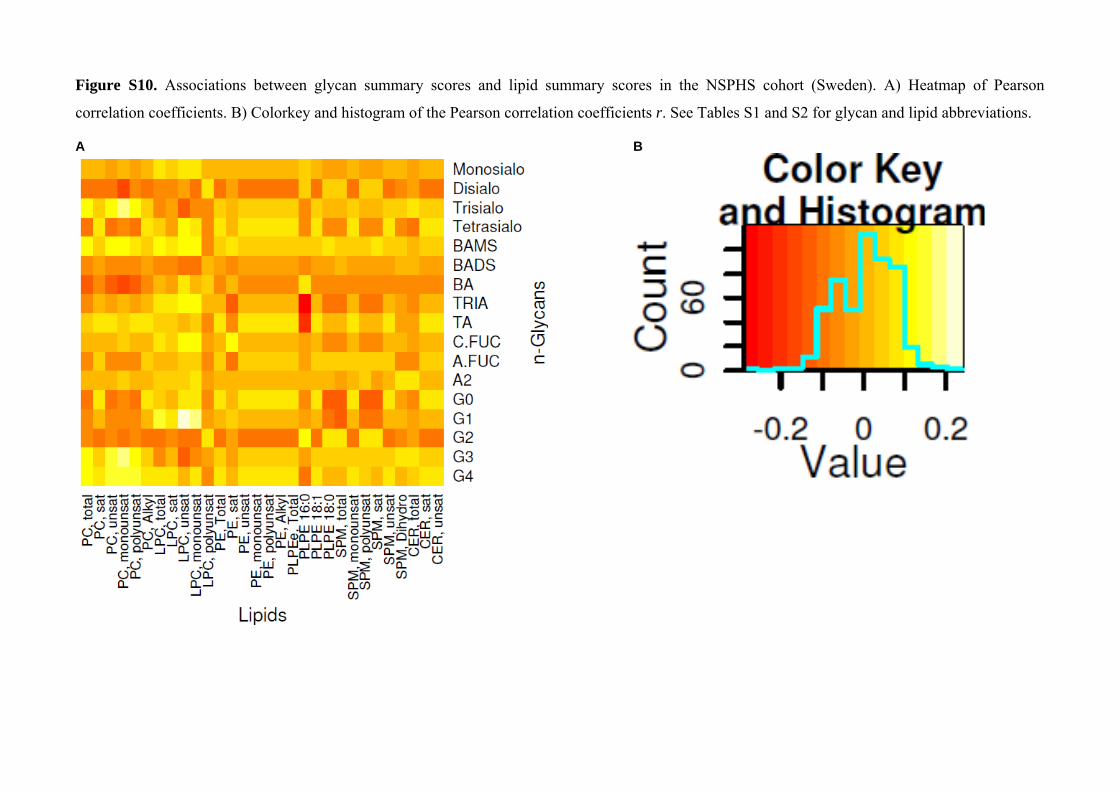
Figure S10. Associations between glycan summary scores and lipid summary scores in the NSPHS cohort (Sweden). A) Heatmap of Pearson
correlation coefficients. B) Colorkey and histogram of the Pearson correlation coefficients r. See Tables S1 and S2 for glycan and lipid abbreviations.
A B

Table S1. Glycan structures present in different HPLC peaks.
Peak Structure Peak Structure Peak Structure Peak Structure GP1 A2
GP7
FA2BG2 M7D3 A2G2S(3)1 A2G2S(6)1 M7D1
GP12
A2F1G2S2 A3G3S(3,3)2 A3G3S(3,6)2 A3G3S(6,6)2 A3BG3S(3,3)2 A3BG3S(3,6)2 A3BG3S(6,6)2
DG1 A2
GP2 A2B A1G1 FA2
DG2 A2B A1G1 FA2
GP3
M5 FA2B A2[6]G1 A2[6]BG1
DG3
M5 FA2B A2[6]G1 A2[6]BG1
GP8
A2BG2S(3)1 A2BG2S(6)1 M5A1G1S1 FA2G2S(3)1 FA2G2S(6)1 A3G3 FA2BG2S(3)1 FA2BG2S(6)1
GP13
A3G3F1S2 FA3G3S(3,3)2 FA3G3S(3,6)2 FA3G3S(6,6)2 FA3BG3S(3,3)2 FA3BG3S(3,6)2 FA3BG3S(6,6)2 A3G3S(3,3,6)3 A3G3S(3,6,6)3 A3G3S(6,6,6)3
GP4
A2[3]G1 A2[3]BG1 M4A1G1 FA2[6]G1 FA2[6]BG1 A1[6]G1S(3)1 A1[6]G1S(6)1 FA2[3]G1 FA2[3]BG1 M6D1, D2 A1[3]G1S(3)1 A1[3]G1S(6)1
DG4
M4A1G1 A2[3]G1 A2[3]BG1 FA2[6]BG1 FA2[3]G1 FA2[3]BG1
GP9
A2F1G2S(3)1 A2F1G2S(6)1 M8D2, D3 A2G2S(3,3)2 A2G2S(3,6)2 A2G2S(6,6)2 M8D1,D3
DG5
M6D1, D2 M6D3 A2G2 A2BG2
GP14
A3F1G3S(3,3,6)3 FA3F1G3S(6,6,6)3 A4G4S(6,6)2 A3F1G3S(3,6,6)3 A3F1G3S(6,6,6)3 A4G4S(6,6,6)3 A4F1G4S2 A4G4S3
DG6 FA2G2 M5A1G1 FA2BG2
GP5
M6D3 A2[6]G1S(3)1 A2[6]G1S(6)1 A2G2 A2[3]G1S(3)1 A2[3]G1S(6)1 A2BG2
GP10
A2BG2S(3,3)2 A2BG2S(3,6)2 A2BG2S(6,6)2 A3BG3S(3)1 A3BG3S(6)1 FA2G2S(3,3)2 FA2G2S(3,6)2 FA2G2S(6,6)2
DG7 M7D3 A2F1G2 M7D1
DG8
A3G3 A2F2G2 FA3G3 M8D2, D3 M8D1,D3
GP15 A4G4S4 A4F1G4S3
GP6
FA2[6]G1S(3)1 FA2[6]G1S(6)1 FA2[6]BG1S(3)1 FA2[6]BG1S(6)1 M4A1G1S1 FA2G2 FA2[3]G1S(3)1 FA2[3]G1S(6)1 A2BG1S1 FA2[3]BG1S(3)1 FA2[3]BG1S(6)1
GP16
A4G4S(6,6,6,6)4 A4G4S(3,6,6,6)4 A4BG4S4 FA4G4S4 A4F1G4S4 A4G4LacS4 A4F2G4S4 FA4F1G4S4
GP11
FA2BG2S(3,3)2 FA2BG2S(3,6)2 FA2BG2S(6,6)2 M9
DG9 FA3BG3 A3F1G3
DG10 M9 FA3F1G3
DG11
A4G4 A4BG4 A3F2G3 FA4G4
DG12 A4F1G4
DG13 A4G4Lac A4F2G4 FA4F1G4
Note: Structure abbreviations: all N-glycans have two core GlcNAcs; F at the start of the abbreviation indicates a core fucose 1-6 linked to the inner GlcNAc; Mx, number (x) of mannose on core GlcNAcs; D1 indicates that the 1-2 mannose is on the Man1-6Man1-6 arm, D2 on the Man1-3Man1-6 arm, D3 on the Man1-3 arm of M6 and on the Man1-2Man1-3 arm of M7 and M8; Ax, number of antenna (GlcNAc) on trimannosyl core; A2, biantennary with both GlcNAcs as 1-2 linked; A3, triantennary with a GlcNAc linked 1-2 to both mannose and the third GlcNAc linked 1-4 to the 1-3 linked mannose; A4, GlcNAcs linked as A3 with additional GlcNAc 1-6 linked to 1-6 mannose; B, bisecting GlcNAc linked 1-4 to 1-3 mannose; Gx, number (x) of 1-4 linked galactose on antenna; [3]G1 and [6]G1 indicates that the galactose is on the antenna of the 1-3 or 1-6 mannose; F(x), number (x) of fucose linked 1-3 to antenna GlcNAc; Lac(x), number (x) of lactosamine (Gal1-4GlcNAc) extensions; Sx, number (x) of sialic acids linked to galactose; the numbers 3 or 6 or in parentheses after S indicate whether the sialic acid is in an 2-3 or 2-6 linkage. If there is no linkage number, the exact link is unknown.

Table S2. Overview over the examined N-glycan traits.
Abbreviation Name Category Formula
GP1 .. GP6 Glycan Peak 1 .. Glycan Peak 6 Core glycans Calculated from HILIC profile
GP7 .. GP8 Glycan Peak 7 .. Glycan Peak 8 Monosialylated biantennary core glycans Calculated from HILIC profile
GP9 .. GP11 Glycan Peak 9 .. Glycan Peak 11 Disialylated biantennary core glycans Calculated from HILIC profile
GP12 .. GP14 Glycan Peak 12 .. Glycan Peak 14 Trigalactosylated core glycans Calculated from HILIC profile
GP15 .. GP16 Glycan Peak 15 .. Glycan Peak 16 Tetragalactosylated core glycans Calculated from HILIC profile
DG1 .. DG7 Disialylated Glycan 1 .. Disialylated Glycan 7 Biantennary core core glycans Calculated from HILIC after sialidase treatment
DG8 .. DG10 Disialylated Glycan 8 .. Disialylated Glycan 10 Triantennary core glycans Calculated from HILIC after sialidase treatment
DG11 .. DG13 Disialylated Glycan 1 .. Disialylated Glycan 13 Tetraantennary core glycans Calculated from HILIC after sialidase treatment
Monosialo Monosialylated Glycans Summary Score Calculated from WAX profile
Disialo Disialylated Glycans Summary Score Calculated from WAX profile
Trisialo Trisialylated Glycans Summary Score Calculated from WAX profile
Tetrasialo Tetrasialylated Glycans Summary Score Calculated from WAX profile
C-FUC Core fucosylated glycans Summary Score = DG6/(DG5+DG6)*100
A-FUC Antennary fucosylated glycans Summary Score = DG7/(DG5+DG7)*100
A2 Biantennary nongalactosylated glycan Summary Score = (GP1+DG1)/2
BA Biantennary glycans Summary Score = DG1 + DG2 + DG3 + DG4 + DG5 + DG6 + DG7
BAMS Monosialylated biantennary glycans Summary Score = (GP7 + GP8) / (DG5 + DG6 + DG7) * 100
BADS Disialylated biantennary glycans Summary Score = (GP9 + GP10 + GP11) / (DG5 + DG6 + DG7)*100
TRIA Triantennary glycans Summary Score = DG8 + DG9 + DG10
TA Tetraantennary glycans Summary Score = DG11 + DG12 + DG13
G0 Nongalactosylated glycans Summary Score = DG1 + DG2
G1 Monogalactosylated glycans Summary Score = DG3 + DG4
G2 Digalactosylated glycans Summary Score = DG5 + DG6 + DG7
G3 Trigalactosylated glycans Summary Score = GP12 + GP13 + GP14
G4 Tetragalactosylated glycans Summary Score = GP15 + GP16

Table S3. Overview over of examined lipid traits. Abbreviation Common Name Lipid Maps
Category Class Subclass ID
TC Total Cholesterol
[ST] Sterol Lipids [ST01] Sterols [ST0101] Cholesterol and derivatives [LMST01010001]
LDL-C Low-Density Lipoprotein Cholesterol
[ST] Sterol Lipids [ST01] Sterols [ST0101] Cholesterol and derivatives [LMST01010001]
HDL-C High-Density Lipoprotein Cholesterol
[ST] Sterol Lipids [ST01] Sterols [ST0101] Cholesterol and derivatives [LMST01010001]
TG Triglycerides
[GL] Glycerolipids [GL03] Triadylglycerols [GL0301] Triacylglycerols
GP Glycerophospholipid
[GP] Glycerophospholipids
PC Phosphatidylcholine
[GP] Glycerophospholipids [GP01] Glycerophosphocholines
LPC Lysophosphatidylcholine
[GP] Glycerophospholipids [GP01] Glycerophosphocholines [GP0105] Monoacylglycerophosphocholines
PE Phosphatidylethanolamine
[GP] Glycerophospholipids [GP02] Glycerophosphoethanolamine
PEPL Phosphatidylethanolamine-based plasmalogen
[GP] Glycerophospholipids [GP02] Glycerophosphoethanolamine [GP0203] 1Z-alkenyl,2-acylglycero-phosphoethanolamine
SP Sphingolipid
[SP] Sphingolipids
SM Sphingomyelin
[SP] Sphingolipids [SP03] Phosphosphingolipids [SP0301] Ceramide phosphocholines
CER Ceramide
[SP] Sphingolipids [SP02] Ceramides
GlcCER Glucosylceramide/ Glucocerebroside
[SP] Sphingolipids [SP05] Neutral glycosphingolipids [SP0501] Simple GLC series
Abbreviations which differ from the LipidMaps classification were used in the text to improve readability. Abbreviations are in order of presentation.