gómez-lobo and meléndez, april unrisdhttpauxpages)/bed... · gómez-lobo and meléndez, april...
TRANSCRIPT

Gómez-Lobo and Meléndez, April 2007
UNRISD UNITED NATIONS RESEARCH INSTITUTE FOR SOCIAL DEVELOPMENT
“Social policies and private sector participation in water supply – the case
of Colombia”
Andrés Gómez-Lobo, University of Chile, Chile
Marcela Meléndez, Inter-American Development Bank
prepared for the UNRISD project on
“Social Policy, Regulation and Private Sector Involvement in Water Supply”
DRAFT WORKING DOCUMENT Do not cite without the authors’ approval
1

The United Nations Research Institute for Social Development (UNRISD) is an autonomous agency engaging in multidisciplinary research on the social dimensions of contemporary problems affecting development. Its work is guided by the conviction that, for effective development policies to be formulated, an understanding of the social and political context is crucial. The Institute attempts to provide governments, development agencies, grassroots organizations and scholars with a better understanding of how development policies and processes of economic, social and environmental change affect different social groups. Working through an extensive network of national research centres, UNRISD aims to promote original research and strengthen research capacity in developing countries. Research programmes include: Civil Society and Social Movements; Democracy, Governance and Well-Being; Gender and Development; Identities, Conflict and Cohesion; Markets, Business and Regulation; and Social Policy and Development. A list of the Institute’s free and priced publications can be obtained by contacting the Reference Centre.
UNRISD, Palais des Nations 1211 Geneva 10, Switzerland
Tel: (41 22) 9173020 Fax: (41 22) 9170650
E-mail: [email protected] Web: http://www.unrisd.org
Copyright © United Nations Research Institute for Social Development (UNRISD). This is not a formal UNRISD publication. The responsibility for opinions expressed in signed studies rests solely with their author(s), and availability on the UNRISD Web site (http://www.unrisd.org) does not constitute an endorsement by UNRISD of the opinions expressed in them. No publication or distribution of these papers is permitted without the prior authorization of the author(s), except for personal use.
2

Contents 1. Introduction 2. The Colombian water section 2.1. Legal and institutional framework 2.2. Access to water and sanitation services 3. PSP in the Colombian water sector 4. Estimating the impact of PSP on poverty related issues 4.1. Water connections 4.2. Sewerage connections 4.3. Affordability 4.4. Quality 5. The role of subsidies 5.1. Utility subsidies in Colombia 5.2. Evaluation of the water subsidy 5.2.1. Focalisation 5.2.2. Affordability 5.3. The subsidy scheme and PSP 6. Conclusions References
3

1. Introduction Private sector participation (PSP) in Colombia was limited prior to 1991. The Colombian constitution did not allow PSP in the water sector. It was limited to supplying inputs or building infrastructure under contract from a public entity. The 1991 Constitution allowed for a stronger role of PSP in the water industry. However, significant PSP through management or concession contracts began in earnest only after the issuance of Law 142 in 1994. The first experience of this type occurred in 1994, with the award of a management contract to Aguas de Barcelona in the city of Cartagena, although minority private share ownership had already been introduced earlier in the city of Barranquilla, Florencia and Monteria. During the present decade PSP in the Colombian water sector has expanded significantly with the award of at least 19 additional contracts in other localities. There is a wide diversity in the scope of these experiences, some being merely management contracts while others involve investment commitments under a BOT framework and still others are outright concessions.
As of today, close to 10% of the water supply companies in Colombia are in private hands or of mixed private-public ownership. This figure however understates the real extension of PSP in water in Colombia since the private sector is involved predominantly in large companies. Thus, as a share of population supplied, the importance of the private sector is larger than 10% (19% by some sources (Owen 2006)). Clearly, the private sector is an important agent in the Colombian water sector.
Recognizing the importance of adequate water supply and sanitation for the alleviation of poverty, this chapter investigates the impact of PSP on the poor and how social policies are designed to help them. Although the data does not allow us to make conclusive judgements as to the role of social policies in making PSP amiable to the poor, it is probable that the particular subsidy scheme used in Colombia to reduce the financial burden of utility bills on poorer households was a contributing factor. This is particularly so when we consider that the errors of exclusion —poor deserving households who do not receive the benefit— is extremely low, at least among connected households. However, we also show that in the particular case of the water sector, this scheme is overly generous (approaching towards universal assistance), with significant leakages to non-deserving households (high errors of inclusion). In addition, many poor households are not connected and therefore do not benefit from the subsidy scheme.
This chapter is organized as follows. The following section presents a brief history of the Colombian water sector, and characterizes its general regulatory framework, including the institutional arrangements, and the tariff setting procedures. It also presents some general statistics of access to water and sewerage services. Next section describes the different PSP experiences in the Colombian water sector. Subsequently, we review the available information regarding the impacts of PSP on poverty related issues. In the next Section we discuss the subsidy scheme used in Colombia to make water more affordable to the poor, its targeting properties, and its potential role in explaining the empirical results discussed earlier. The paper concludes with some policy recommendations.
4

2. The Colombian water section 2.1. Legal and institutional framework The Constitution of 1991, and the Public Services Law 142/94 established a new legal and institutional framework for infrastructure services in Colombia that assign important roles both to the state and to the private sector. The 1991 Constitution identified public utilities as one of the core services that contribute to the well being of the population. It reiterated the ultimate responsibility of the state for ensuring the provision of these services to the citizens (Article 365) and its obligation to supervise and control their provision (Article 334), and it assigned an important role to the private sector, by stating that these services may be provided directly by the state or delegated to the private sector or community based organizations (Article 365).
Law 142/94 is a Public Utilities Law that covers all sectors within a consistent and unifying framework. It promoted the adoption of cost recovery tariffs for the utilities, and established limits on the extent of cross-subsidization between customers. It also provided the institutional framework under which the public utilities sectors currently operate. It created the Superintendence for Public Services (SSPD), in charge of ensuring the adequate control and supervision of the public utilities, and defined the functions of three Regulatory Commissions, one for water and sanitation (Regulatory Commission for Water and Sanitation, or CRA), another for electricity and gas (Regulatory Commission for Electricity and Gas, or CREG) and a third one for telecommunications (Regulatory Commission for Telecommunications, or CRT).
In Colombia, the line Ministries are responsible for policy formulation, as well as for the granting of concessions. In the case of the water and sanitation sector, the line ministry is the Ministry of Environment, Housing and Territory Development (MMAVDT for its acronym in Spanish). The advanced degree of decentralization in Colombia places, however, significant limits on the authority of the MMAVDT. As is common in many other countries, water and sanitation services in Colombia are a municipal responsibility. Municipal governments are responsible for guaranteeing service provision, and have the power to tax the services, define areas of service, and territorial planning issues, while the central government retains the responsibility of supervising the ex-post performance of all utilities nationwide and has the obligation to intervene in the management of utilities found to be in financial distress. This is done through the Superintendence for Public Services that supervises the performance of the public services providers and monitors their compliance with service and safety standards and other regulations issued by the Regulatory Commission of Water and Sanitation (CRA for its acronym in Spanish).1 CRA defines tariff-setting methodologies based on standard formulas and on investment plans by the operating companies and sets quality and technical standards to be followed by the utilities. Its two central functions are the regulation of monopoly power and the
1 The Superintendence of Public Services oversees market competition, certifies the dwelling categories of residential users in the allocation of subsidies, and ensures that the subsidies reach the poor, based on this categorization. It issues opinions to the Regulatory Commission and the line Ministry regarding the performance of service providers and their compliance with sector laws and regulations. It also investigates irregularities, conducts inspections, penalizes companies that fail to comply with the rules, and has the authority to intervene and liquidate non-performing public enterprises. Finally, it acts as an appeals body for consumer complaints against service providers. The Superintendent is appointed by the President.
5
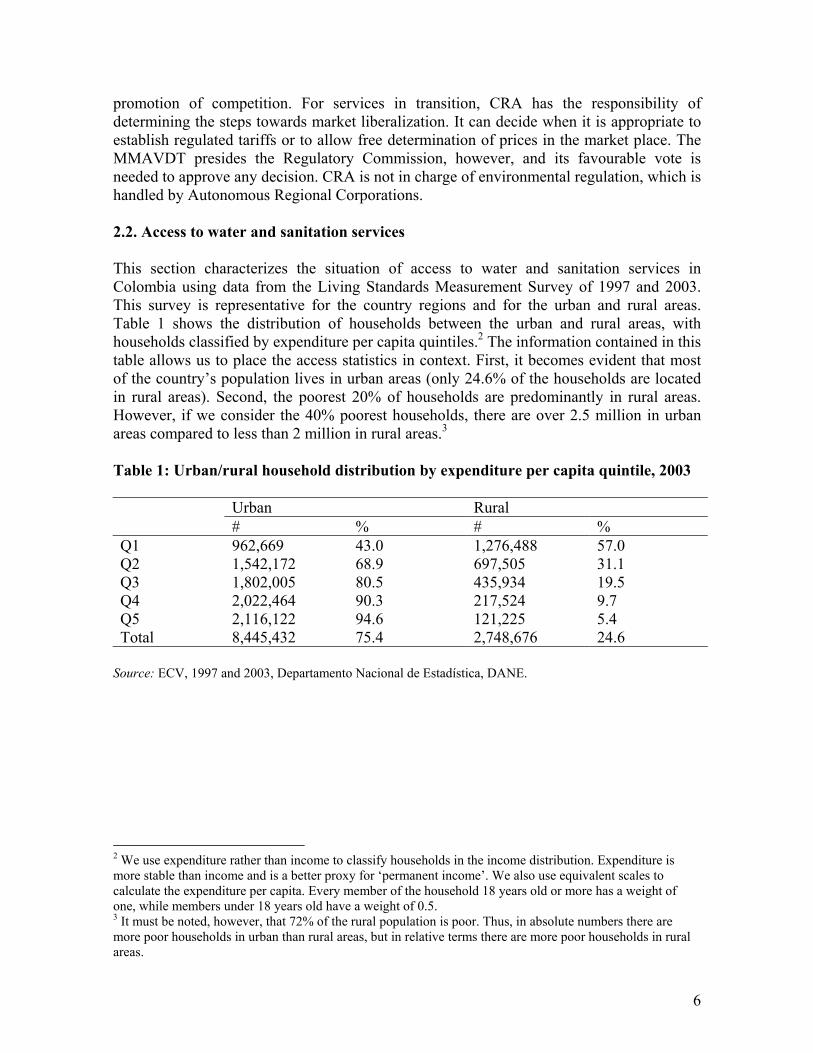
promotion of competition. For services in transition, CRA has the responsibility of determining the steps towards market liberalization. It can decide when it is appropriate to establish regulated tariffs or to allow free determination of prices in the market place. The MMAVDT presides the Regulatory Commission, however, and its favourable vote is needed to approve any decision. CRA is not in charge of environmental regulation, which is handled by Autonomous Regional Corporations. 2.2. Access to water and sanitation services This section characterizes the situation of access to water and sanitation services in Colombia using data from the Living Standards Measurement Survey of 1997 and 2003. This survey is representative for the country regions and for the urban and rural areas. Table 1 shows the distribution of households between the urban and rural areas, with households classified by expenditure per capita quintiles.2 The information contained in this table allows us to place the access statistics in context. First, it becomes evident that most of the country’s population lives in urban areas (only 24.6% of the households are located in rural areas). Second, the poorest 20% of households are predominantly in rural areas. However, if we consider the 40% poorest households, there are over 2.5 million in urban areas compared to less than 2 million in rural areas.3 Table 1: Urban/rural household distribution by expenditure per capita quintile, 2003 Urban Rural # % # % Q1 962,669 43.0 1,276,488 57.0 Q2 1,542,172 68.9 697,505 31.1 Q3 1,802,005 80.5 435,934 19.5 Q4 2,022,464 90.3 217,524 9.7 Q5 2,116,122 94.6 121,225 5.4 Total 8,445,432 75.4 2,748,676 24.6
Source: ECV, 1997 and 2003, Departamento Nacional de Estadística, DANE.
2 We use expenditure rather than income to classify households in the income distribution. Expenditure is more stable than income and is a better proxy for ‘permanent income’. We also use equivalent scales to calculate the expenditure per capita. Every member of the household 18 years old or more has a weight of one, while members under 18 years old have a weight of 0.5. 3 It must be noted, however, that 72% of the rural population is poor. Thus, in absolute numbers there are more poor households in urban than rural areas, but in relative terms there are more poor households in rural areas.
6

Table 2: Access to piped water and sewerage according to whether the household receives the service from a water provider in exchange for payment Water Sewerage Urban Rural Total Urban Rural Total
Q1 94.4% 40.8% 61.1% 77.8% 8.7% 34.9% Q2 96.9% 52.6% 82.2% 84.6% 15.9% 61.9% Q3 99.1% 58.1% 91.2% 89.0% 25.4% 76.8% Q4 98.8% 63.1% 94.9% 93.8% 28.8% 86.7%
1997
Q5 99.4% 78.9% 98.7 95.7% 32.2% 93.6% Q1 93.9% 48.1% 67.8% 77.0% 10.6% 39.1% Q2 96.7% 56.0% 84.1% 86.1% 16.1% 64.3% Q3 98.1% 59.2% 90.5% 91.2% 25.2% 78.3% Q4 98.5% 65.6% 95.3% 94.2% 27.8% 97.7%
2003
Q5 98.6% 53.9% 96.2% 95.7% 18.3% 91.5% Source: ECV, 1997 and 2003, Departamento Nacional de Estadística, DANE
Table 2 and Table 3 show access to water and sanitation services using two alternative definitions. Table 2 shows access statistics for households that report to receive the service from a provider, in exchange for payment. Table 3 uses a more flexible definition by including the households that report to have access to water and sanitation through any acceptable solution, as defined by the United Nations.4 Table 3: Access to water and sanitation through an acceptable solution as defined by the United Nations Water Sewerage Urban Rural Total Urban Rural Total
Q1 94.4% 43.4% 62.7% 93.4% 54.3% 69.1% Q2 96.9% 54.9% 83.0% 97.9% 70.2% 88.7% Q3 99.2% 62.8% 92.2% 99.5% 76.0% 95.0% Q4 98.8% 65.5% 95.2% 99.5% 81.0% 97.5%
1997
Q5 99.4% 82.4% 98.9% 100.0% 84.0% 99.4% Q1 97.5% 63.6% 78.2% 94.8% 62.9% 76.6% Q2 98.8% 70.6% 90.1% 97.8% 76.3% 91.1% Q3 99.1% 72.3% 93.9% 99.3% 80.4% 95.6% Q4 99.4% 76.2% 97.1% 99.6% 90.7% 98.7%
2003
Q5 99.2% 63.6% 97.2% 99.8% 85.2% 99.0% Note: acceptable solutions for water are: household connection, well, and public fountain. For sanitation: sewerage, septic tanks, latrine and others. Source: ECV, 1997 and 2003, Departamento Nacional de Estadística, DANE.
Table 2 shows that lack of access to water in Colombia is a problem almost exclusively for rural households. Access to sewerage services is also very low for rural 4 Water: household connection, well, and public fountain. Sanitation: sewerage, septic tanks, latrine and other.
7

households, although it is still quite low for urban households in the first two quintiles of the income distribution. From Table 3 it can be seen, however, that many households do have access to non-public sanitation services such as septic tanks and latrines.
While there is still a long way to go, the numbers do show some progress in connecting households to these services between 1997 and 2003.5 We still need to establish to what extent this progress is connected to the involvement of the private sector in the provision of water and sanitation services.
Table 4: Connected households with uninterrupted water service Water Urban Rural Total
Q1 61.8% 70.7% 65.5% Q2 71.3% 62.5% 69.5% Q3 73.2% 63.1% 72.0% Q4 77.0% 66.5% 76.3%
1997
Q5 84.1% 74.3% 83.8 Q1 63.0% 60.0% 61.8% Q2 68.7% 60.7% 67.1% Q3 75.7% 63.35 74.2% Q4 78.6% 63.9% 77.6%
2003
Q5 83.2 67.5% 82.7% Source: ECV, 1997 and 2003, Departamento Nacional de Estadística, DANE.
Table 4 shows, however, that not all households with access to piped water have continuous service (24 hours a day, 7 days a week). It is interesting to note that the percent of households in quintiles 1 and 2 (poorest 40% of the population) with uninterrupted service fell from 1997 to 2003, while the percent of connected households in these groups increased over the same time period.
Finally, Table 5 provides another view of water service quality in Colombia. These statistics are only available for 2003. They show that service quality is quite poor for a considerable share of households in all income quintiles, and especially for those located in rural areas.
5 We do not have an explanation of why in some quintiles coverage rates fall between 1997 and 2003. This may be due to a real fall in these rates, or to statistical errors due to different sample size and geographical coverage of each survey. This issue will be further discussed below.
8

Table 5: Households by quality characteristics of piped water, 2003 Urban Rural Total Q1 Sediments 11.3% 14.9% 13.3% Q2 9.0% 14.7% 10.7% Q3 8.8% 13.9% 9.8% Q4 7.2% 17.1% 8.2% Q5 8.0% 22.1% 8.7% Q1 Bad taste 7.0% 10.2% 8.8% Q2 6.1% 8.0% 6.7% Q3 4.3% 8.1% 5.1% Q4 4.6% 7.1% 4.9% Q5 3.8% 25.2% 5.0% Q1 Bad smell 5.1% 6.2% 5.8% Q2 3.6% 3.6% 3.65 Q3 3.2% 6.2% 3.8% Q4 2.8% 4.6% 2.9% Q5 2.9% 20.7% 3.8% Q1 Bad colour 11.9% 16.5% 14.6% Q2 10.9% 17.0% 12.8% Q3 11.1% 16.5% 12.1% Q4 11.1% 17.4% 11.8% Q5 9.9% 40.7% 11.6% Q1 None of the above 76.6% 69.3% 72.4% Q2 79.0% 71.5% 76.6% Q3 80.7% 73.0% 79.2% Q4 81.6% 68.5% 80.3% Q5 81.3% 45.3% 79.4%
Source: ECV 2003, Departamento Nacional de Estadística, DANE.
Before we discuss issues of PSP, it is worth reminding that about 50% of the population in Colombia still live under the poverty line. The inequality in the country is also very high (over 50% of Gini coefficient). According to the country’s public service regulator (Superservicios), there were 7.6 million people in 2005 who were still supplied with water which is unfit for human consumption in 2005. The people affected were generally living in areas where the system covered less than 10,000 residents (6.7 million), against 4% served by larger systems (0.9 million people) (Owen 2006). 3. PSP in the Colombian water sector6 There are two clearly defined stages in the PSP in the water and sanitation sector in Colombia. The first stage, between 1991 and 1997 consisted in individual Municipalities awarding contracts to private operators or the formation of mixed public-private companies to administer, operate and invest in their respective water companies. The second stage,
6 This section is based on CONPES (1995), CONPES (1997) and CONPES (2003).
9

from 1997 to the present, involved a more structured approach, with the central government playing a vital role in structuring and funding these processes.
The first stage was initiated by the city of Barranquilla, which in 1991 created a public share company to operate its water and sanitation infrastructure. In this company, private investors owned 11% of shares, while the Municipality owned the rest. Later the ownership share of private investors increased to 50%. Other cities adopted a similar model of PSP, including Montería, Florencia, and Santa Marta.
Cartagena incorporated a private operator into its mixed property company in 1994. This operator was given responsibility for managing and operating the water and sewerage services in the city. It was also committed to invest around US$9,67 million, augmenting the investment levels already committed by the regional authorities. The explicit objective of this contract was to increase coverage rates to 92% in water and 90% in sanitation.7
In Chipichape a completely private company was established in 1994 to operate and administer the water and sewerage services in that locality. This company charges customers for water and sewerage services and then pays EMCALI, owner of the infrastructure, a transport fee for using the water and sewerage mains and for the disposing of waste water.
Table 6 presents a summary of the main PSP experiences during this first stage of PSP in the water sector.
Table 6: Main PSP experiences before 1997
Municipality Population 1995 Type of PSP Year
Tunja 113,454 Concession 1996 Palmira 255,303 Municipal/ Private partnership NA Neiva 289,516 Municipal/ Private partnership 1996 Cartagena 780,527 Municipal/ Private partnership 1995 Santa Marta 329,556 NA NA Montería 303,468 Share emission 1994 Florencia 112,737 Share emission 1991 Barranquilla 1,126,729 Share emission 1991
Source: CONPES (1997), National Planning Department and DANE.
This first stage was characterized by a rather haphazard and individual approach to PSP. A review by CONPES (1997) identified several problems with the way PSP was being undertaken by different Municipalities during this period. These problems were:
The goals of each process were not clearly specified and the coverage targets set
were not based on the real capacity of generating funds from tariff charges. The scope and limits of PSP were not clearly defined. No evaluations were made of the state of the infrastructure, the investments required
to improve it, and the funding capacity from tariffs and other sources.
7 Since we do not have municipal level coverage rates we cannot evaluate whether these targets were met or not.
10

Tendering of these contracts was not very competitive. Although the Constitution and the Public Services Law 142/1994 required a competitive process to incorporate the private sector in the management and operation of water and sewerage services, Municipalities did not specify clearly the selection criteria for potential operators and offered a very short period of time for the preparation of bids. In 7 experiences analysed by Ochoa, et al. (1996), potential bidders had at most four months to present a bid, with the extreme case of 19 days in the case of Barranquilla. In 3 of the 7 cases only one bid was received.
As a reaction to the problems encountered with the above experiences, in 1997 the
national authorities developed what was called the Management Modernization Program (Programa de Modernización Empresarial, or PME). This program was aimed at promoting PSP in the water sector but on a more technically sound basis. The program was implemented by the MMAVDT and gave Municipalities technical, legal and financial advice in structuring a reform process of their water and sanitation services that includes the participation of the private sector.
Under PME, a Municipality receives technical advice and co-financing for the hiring of consultants in order to structure a reform process in which tariff levels, investment commitments and coverage targets are mutually consistent. If the Municipality wants to keep tariffs at a low level, then future cash flows cannot fund a very ambitious investment program and a management contract is the only viable alternative for PSP participation. If tariff levels are sufficiently high to fund some investment, then a concession contract where the private operator commits to fund certain investments can be a viable option. The central government also offers to partially fund priority investments for Municipalities that take part in the PME program. Specific targets for the improvement of services to low-income households are a central feature of the reforms structured under PME.
Some other features of the PME program include the creation of autonomous operating companies in participating Municipalities —in many cases services were ran by a special unit within the local government administration— and a commercial orientation of management and services. In addition, under PME the central authorities explicitly promote the association of neighbouring Municipalities in a given reform process. The objective is to exploit economies of scope and scale in the operation of services by tendering contracts over a more aggregate geographical area than just a municipality.
Contracts are competitively tendered and last between 10 to 30 years. The tendering variable is either the price bidders are willing to pay for each share of the company or the tariff offered to users.
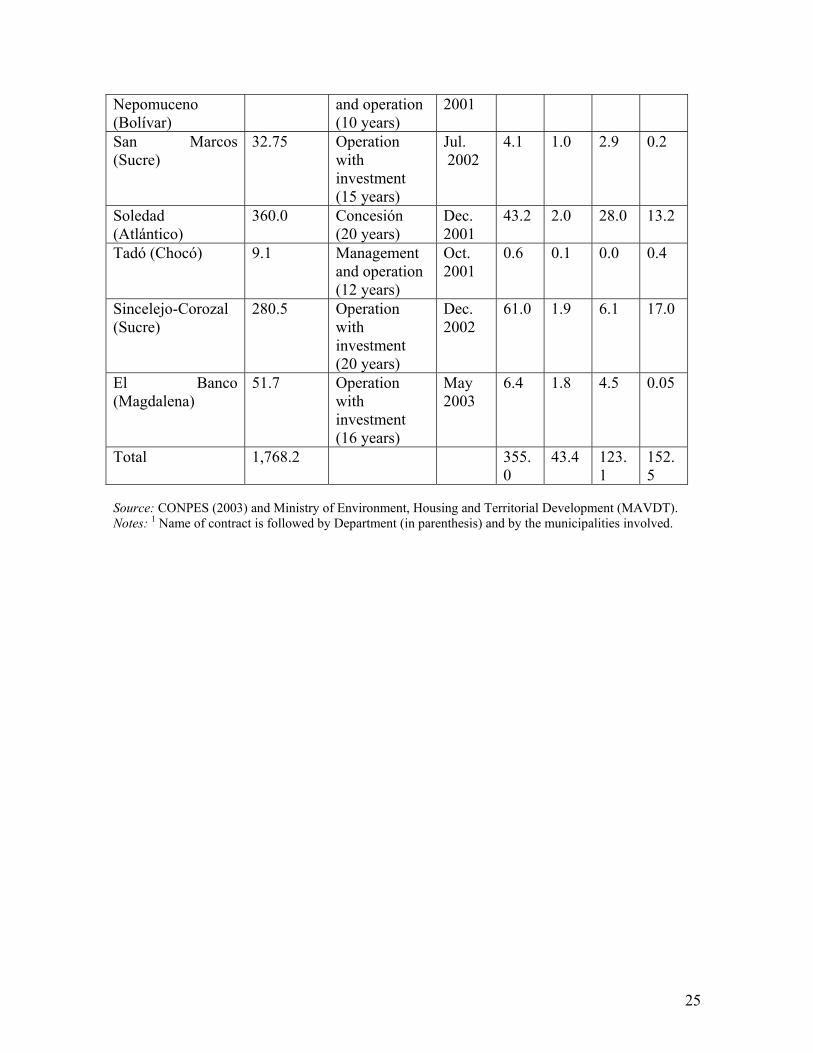
Since its creation in 1997 until early 2003, 19 contracts have been tendered under the PME framework.8 Given that some contracts cover more than one municipality, the number of municipalities involved is larger. A summary of these contracts is presented in Appendix 1. In practice almost all contracts tendered to date have mixed public/private investment commitments with US$152 million of the US$355 million total projected investment being funded by the private sector and benefiting 1.8 million individuals. The rest of the investment program is funded from national government funds or Municipal funds.
8 Four more contracts as well as two extensions to existing contracts have been signed since 2003 to date within the PME framework.
11

According to Fernández (2004) by 2003 there were over 100 municipalities with private participation in the water sector, accounting for 15% of the urban population. This is a much higher number than what can be observed from Table 7. The difference is made up of contracts awarded outside of the PME framework.
Table 7 presents the information available from the National Planning Department (DNP) regarding the institutional structure and ownership of water providers to date (2005). From this table we can see that 89 providers —close to 10% of the total— have some form of PSP, including those companies that have a concession or contract under the PME framework. Table 7: Types of water providers in Colombia, 2005 Type of organization Number Private company 62 Mixed property company 27 Municipal company 1 State owned company 196 Organization within Municipality 188 Share company wholly owned by public sector 12 Other (authorized organizations and others) 369 Total 855
Source: National Planning Department (DNP) of Colombia.
From this information we can conclude that there are at least three types of PSP schemes in operation in Colombia. First, a Municipality may have tendered a contract under the PME framework. We know for certain that these contracts were tendered after 1997.9 Second, a Municipality may have followed an independent process and have a mixed ownership company. Third, a Municipality may have followed an independent process and have a totally private operator providing services within its coverage area. To make matter more complex, there are Municipalities with more than one operator, some with PSP and others without.
4. Estimating the impact of PSP on poverty related issues Gómez-Lobo and Melendez (2006) use two waves of the Living Standards Households surveys (1997 and 2003), and econometric techniques from the modern policy evaluation literature, to identify the impacts of PSP in the Colombian water sector on access, quality and affordability. The Living Standards Household surveys include several questions regarding household connections to water supply and sewerage, expenditure on water and sewerage, and water supply quality.
The variables of interest are four: (a) whether a household has a connection to piped water supply, (b) whether the household has a connection to a sewerage network, (c) whether the monthly water bill (excluding sewerage) is above 3% of monthly household
9 There is one exception, the city of Cartagena. It had a contract with a private operator since 1995. However it later extended this contract under the PME framework.
12

expenditure, and (d) whether the households receives a continuous (24 hours, 7 days a week) water supply or not, as a proxy for quality.10
Since the main interest is the impact of PSP on low-income households, observations were ranked according to expenditure per capita deciles.11 Households in the first four deciles are considered poor.
Table 8 presents some summary statistics regarding the variables of interest. As previously shown, at the national level there has been an important increase in the percentage of households connected to piped water and sewerage networks. Although this increase in coverage has benefited households across the whole income distribution, it has been strongest among the lowest deciles. This is to be expected since the higher income households already had high coverage rates. Affordability is still an important issue given that households in the lowest expenditure decile pay more than 3%. Continuity of service has deteriorated for most households with the exception of those in the middle of the income distribution.
The above figures do not reveal the impact of PSP in the water sector. In order to identify the different effects of private ownership versus public ownership, on access (as measured by connection rates), affordability and quality, Gómez-Lobo and Melendez (2006) apply several econometric techniques. This is done to evaluate the robustness of the results to different comparison groups and estimation methods. Table 8: Summary statistics by expenditure per capita deciles Decile Proportion of
households with a water Connection
Proportion of households with a sewerage connection
Expenditure on water as a proportion of total household expenditure
Continuity of service (24 hours, 7 days a week)
1997 2003 1997 2003 1997 2003 1997 2003 1 0.54 0.62 0.26 0.32 0.049 0.048 0.68 0.63 2 0.69 0.74 0.44 0.47 0.027 0.029 0.63 0.61 3 0.78 0.82 0.57 0.59 0.021 0.025 0.69 0.64 4 0.87 0.87 0.67 0.71 0.020 0.024 0.71 0.70 5 0.91 0.89 0.73 0.75 0.017 0.022 0.68 0.72 6 0.91 0.92 0.80 0.82 0.017 0.020 0.76 0.76 7 0.94 0.95 0.84 0.87 0.017 0.019 0.75 0.78 8 0.96 0.96 0.89 0.88 0.014 0.016 0.78 0.78 9 0.98 0.95 0.93 0.88 0.014 0.014 0.83 0.79 10 0.99 0.98 0.94 0.95 0.012 0.012 0.85 0.87
Notes: All statistics are the average of each variable in each equivalent expenditure decile. Survey weights were used to estimate averages in each case. Source: ECV 1997 and 2003, Departamento Nacional de Estadística, DANE.
10 The 2003 survey has more information on the quality of water supply as shown on Table 5. However, in order to compare with the 1997 survey data only continuity of service is used, which is available in both years. 11 Households without expenditure information were dropped from the database. As noted above, equivalent scales were used to calculate household expenditure per capita.
13

From a methodological point of view, identifying the impact of PSP is not trivial. In the first place, the Living Standard survey is not representative at the municipal level. Therefore, it is not possible to form a pseudo panel of municipalities and compare the average of each variable between municipalities with and without PSP nor compare the before and after effect of municipalities that introduced PSP between 1997 and 2003.
In order to identify the impacts of PSP, Gómez-Lobo and Melendez (2006) use two strategies. First, several econometric estimation techniques are used and the results from each one are compared for robustness. Second, they use different sub-samples of data to make sure that the results are not due to systematic differences in the household and municipal characteristics of each observation.
As to the first strategy, one estimation method simply consists in a cross section regression using the 2003 data, with a dummy variable taking a value of one if the household resides in a municipality with PSP that year.12 The coefficient associated with this dummy variable will give an indication of the effect of PSP on the dependent variable. However, this estimation method has several drawbacks. The main one is that municipalities that introduced PSP may in some way be different from municipalities that did not introduced PSP. Thus, the coefficient may be picking up the effects of these characteristics rather than the effect of PSP per se. In order to avoid this problem, the next two estimation methods use data from the 1997 as well as the 2003 survey. These methods are a type of difference in difference estimator in which the change in the variable of interest between 1997 and 2003 for treated municipalities (with PSP) is compared to the change during the same period for non-treated municipalities (with-out PSP). The first application of this method uses the full sample of municipalities while the second application drops from the sample all those municipalities with non-PME type contracts.13 The final estimation method used was a propensity score matching estimator.14 What a matching estimator does is to compare the outcome of one household that was treated with one (or several) untreated ‘similar’ households. Similarity in this context refers to having common characteristics. With a matching estimator, observations without common support that is, treated observations that do not have a counterpart in a non-treated observation are not considered in the analysis.
The second estimation strategy consisted in using each estimation method discussed above to different sub-samples of the data. The first sub-sample included the household observations from all municipalities available in the survey. The second sub-sample dropped all observations from the main largest cities (Bogotá, Cali and Medellin) and the third sub-sample dropped all observations that belong to the largest municipality in each Department, thus leaving observations from the relatively smaller municipalities in each region. The idea of this second strategy is that by selecting a subset of the data the observations are more homogenous, thus making the treatment and control groups more comparable. By analyzing how results vary across each subset of the data we can evaluate the robustness of the results.
We present the results of Gómez-Lobo and Melendez (2006) for each of the four variables in turn. Since our main interest is the effect of PSP on the poor, the results are 12 A more detailed technical discussion can be found in Gómez-Lobo and Melendez (2006). 13 The information available was not clear as to when non-PME contracts were introduced in the relevant municipalities. Therefore, these municipalities were dropped from the sample in the third model estimated to evaluate whether this possible measurement was affecting the results. 14 See Rosenbaum and Rubin (1984;1985) and also Heckman, Ichimura and Todd (1997).
14

presented both using the full sample of households as well as the subset of households in the first four deciles of the income distribution. For each model we only present the estimated parameter relating to the presence of PSP. However, each model estimated included also a series of control variables. These were: dummy variables for each region (there are 9 regions in the country), number of persons in the household, income (in pesos of 2003), and dummy variables indicating an electricity connection, telephone, different types of dwelling wall material, garden in dwelling and garage.
In addition to household level controls we also included some municipal level variables for each observation. These included the population density and a poverty index, both calculated for each municipality.15 The poverty index is a measure of the ‘unsatisfied basic needs’ of the population and is crucial to control for different socioeconomic conditions in treated and untreated municipalities. The population density variable is also important to control for differences in service costs among municipalities.
4.1. Water connections The results of our analysis remain ambiguous regarding the real impact of PSP on access and affordability. The results depend on the method of estimation. A simple linear regression indicates that both across the full sample of observations and for the poor households in particular, the water connection rate of households in municipalities with PSP is about 0.05 percentage points higher than in non-PSP municipalities. This coefficient is statistically significant at a 1% confidence level.
However, as mentioned above, the results of this first model may be biased if there are systematic differences among the municipalities that had PSP and those that did not, which we do not control for in the regression or if the impacts of PSP are not homogenous among different types of municipalities or households. Therefore, a first step to check the robustness of these initial results is to compare them to the results using the difference in difference estimator. Using this method we find that in general PSP does not have a statistically significant effect on water coverage except when we restrict the sample to the relatively smaller municipalities. In this last case there is a positive and significant effect of 0.05 percentage points on coverage rates among all households and of 0.06 if only poor households are considered.
If we apply the DID estimator dropping all municipalities that had non-PME PSP at some date, the estimated impacts are positive and significant, both when all households are included as when the sample is restricted to poor households. In this case, what we are comparing are observations in PME municipalities with observations in municipalities that never had any type of PSP.
The above results for water connections can be summarized as follows. In general, there seems to be a positive and significant impact of PSP on coverage rates, although in some cases there is no discernible effect. Results from the labor supply literature seem to suggest that the difference in difference estimator is more robust than the other estimators (see Blundell and Costa Dias (2002)). Therefore, we can put somewhat more emphasis on the results from DID estimation. They imply that there is either no effect of PSP on water
15 The population density and poverty index by Municipality were obtained from the National Statistics Department of Colombia (DANE), and are based on calculations using the 1993 census data.
15

connection rates or a positive effect if the largest municipalities are dropped from the sample. 4.2. Sewerage connections Our results are less ambiguous for the sewerage connections.16 In general the estimated effects of PSP on sewerage connections are in almost all cases positive or statistically significant, especially among the poorer households. In addition, the absolute level of the estimated parameters are higher than in the case of water connections, indicating that the effects of PSP, if any, are stronger with respect to sewerage connections than to water connections. This may be reasonable considering that there was a larger initial deficit in sewerage connections in relation to water connections (see Table 2 and Table 8). Again, if we give more credibility to the DID estimators we find that PSP increases sewerage connections between 0.09 and 0.11 percentage points among the poor, and the impact is even higher when PME municipalities are compared to non-PSP municipalities. 4.3. Affordability Our results in this case are mixed. Using a simple regression with 2003 data and the first DID estimator show a positive and significant impact of PSP on affordability when all households are included. This implies that in municipalities that had PSP, a larger fraction of households paid water bills above 3% of monthly household expenditure. However, it is interesting to note that when the sample is restricted to poor households, this effect disappears with no statistically significant effect of PSP on affordability.
This last result is probably due to the contribution and subsidy scheme used in Colombia to protect poor households from high utility service bills, an issue that will be discussed further below. Although PSP brings about higher bills as a proportion of expenditure, households in the lower deciles receive a subsidy that helps to neutralize this effect.
Furthermore, if only PME municipalities are compared with non-PSP municipalities, the impact of PSP is negative and statistically significant, both for all households as well as for poor households. This implies that PME municipalities were associated with lower water bills to total expenditure than municipalities that never had private sector participation. However, with the propensity-score matching estimator the PSP variable is found in general to have no effect on affordability.
4.4. Quality We measured the quality of service by the continuity of water supply. In this case the results are quite consistent across estimation methods and sub-samples used. Except for some negative results with the first DID estimator, all the other parameter estimates are
16 The only case in which the PSP variable was not statistically significant among the poor households is with the propensity-score matching estimator, when the three largest urban centers are dropped from the sample.
16

positive and statistically significant. Moreover, among poor households the results show that PSP had a strong significant effect on the continuity of service compared to non-PSP municipalities in all cases and sub-samples. 5. The role of subsidies Overall, the results of Gómez-Lobo and Melendez (2006) indicate that PSP in the Colombian water sector has had mixed results. For example, our results are less robust for piped water connection rates, on which PSP either had a positive or neutral effect among the poor. With regards to affordability of service, as measured by the proportion of poor households that pay more than 3% of their monthly income on water bills, there is no statistically significant effect of PSP. However, PSP seems to have positive impact in terms of quality of services and sewerage connection.
To what extent are these positive results of PSP, especially those concerning affordability, due to the particular water subsidy scheme used in Colombia? First we describe the subsidy scheme and analyse its targeting properties. We then come back to the above question and discuss the implications of the subsidy scheme for the water sector and PSP in particular.
5.1. Utility subsidies in Colombia In order to address the financial hardship related to utility bills for poor households, a system of cross-subsidies is used in Colombia whereby the poorest households pay a tariff below the average cost of provision, while the higher income households and the industry and retail sectors pay a surcharge or ‘contribution’ to finance the subsidies granted. These cross subsidies have existed for a long time. However, the Law 142 of 1994 formalized these cross subsidies, setting limits to the amount of the surcharge and the subsidy for different types of dwellings.
The tool to focalise subsidies in Colombia is the socio-economic stratification of dwellings, a system by which all dwellings are categorized in one of six groups according to observable characteristics. Dwellings that by their objective characteristics are identified to be the poorest correspond to category 1. In category 6, at the other extreme of the distribution, are the dwellings identified as the wealthiest. According to the law, the maximum subsidy over the subsistence consumption level is 50% for category 1, 40% for category 2 and 15% for category 3, and the maximum contribution over the total consumption of categories 5 and 6 and of non-residential consumers is of 20%. The neutral tariff rate must reflect the efficient costs of service provision.
The cross subsidies are internal to each operator. When the amounts collected from clients paying contributions are not enough to fully finance the subsidy scheme —which is always the case— the deficit is financed by the national government, the local governments and/or special accounts called ‘solidarity and income redistribution funds’. These funds are accounts managed by central authorities to distribute surcharge surpluses across regions. However, in practice, surpluses generated in certain regions are rarely transferred to these funds and deficits are funded entirely by national or local governments.
Given that the ceilings established in the law for both subsidies and surcharges were lower than those in place at the moment the 1994 law was enacted, it has been necessary to implement a gradual adjustment program. In the electricity and telecommunications sectors
17

the tariff rebalancing process ended in 2000. In the water and sanitation sector, however, progress has been slower and the subsidy and surcharge rates are still often above the ceilings mandated by the law.
5.2. Evaluation of the water subsidy Using the households’ socio-economic category and the water expenditure data available from the Living Standards survey of 2003, as well as water prices from the corresponding water providers17, obtained through the Superintendence of Public Services, we were able evaluate the subsidy system in two dimensions: focalisation (or targeting properties) and the impact on affordability. 5.2.1. Focalisation To assess the focalisation properties of a subsidy system the starting point is to define what segment of society is poor enough to be subsidized. In a country like Colombia, where income is low even for households in the upper end of the distribution, this decision is unavoidably of a political character. Following Gómez-Lobo and Melendez (2006) we use the criteria that only the poorest 40% of the population should be subsidized. This threshold corresponds to where the official poverty line defined for Colombia would cross.
These are the two indices typically used in evaluating the focalisation properties of a subsidy. The error of inclusion is equal to the share of households that should not be receiving a subsidy but in practice do receive it. It is an indicator of the leakage of resources to non-deserving households. The error of exclusion, on the other hand, is equal to the share of households that should be subsidized based on their poverty level and are not receiving a subsidy. There is usually a trade-off between the errors of inclusion and exclusion as discussed in Gómez-Lobo and Conreras (2003).
Under a progressive subsidy system the poorer X% should receive more than X% of the subsidy resources. When this is so, the Lorenz curve of the subsidy distribution is above the 45o line. The quasi-gini coefficient is calculated as the area between the Lorenz curve and the 45o line divided by the area between the 45o line and the horizontal axis. When the Lorenz curve is above the 45o line its area is negative. The quasi-gini coefficient thus varies between -1 and 1, a value near 1 indicating a high proportion of the subsidy reaching the wealthier households, and a value near -1 indicating a progressive subsidy distribution. 5.2.2. Affordability Another way to evaluate the subsidy scheme is to compare the average water expenditure as share of total income with and without subsidy for each decile of the population.
The sample used in this evaluation is composed of 62% of the households connected to water in the urban areas of Colombia in 2003.18 With respect to the focalisation properties of the system, we find that the inclusion and exclusion errors are of 17 Water prices are two part tariffs composed of a fixed part, and two variable portions, one applying to the first 203 meters consumed, and another applying to water usage beyond that threshold. 18 Not all water providers report to the Superintendence of Public Services, as they should, so price data are not available for the full sample of urban households. Rural households are not included in this exercise because there is no information about their socioeconomic category in the survey.
18

58% and 0.3% respectively. While almost no poor connected households are left out, there is a large amount of resources going to subsidize the consumption of households that do not belong in the poorer segments of the population. In other words, such subsidies could be considered universal. The share of households in the highest income decile receiving a subsidy is near 65%. We also find a quasi-gini coefficient of water subsidies of -0,01 indicating that there is no progressiveness in the subsidy distribution.
Almost all households receive a subsidy, indicating that the scheme is more akin to a universal subsidy than a targeted subsidy. This occurs because most dwellings are classified in one of the three socio-economic categories liable to receive benefits. Therefore, the dwelling classification used in Colombia is not discriminating well between poor and non-poor households.19
However, we find that the subsidy scheme does help to reduce the financial burden of water bills on poor households. For example, the average bill for households in the 4th decile falls from 4,9% to 2,6% of household income as a result of the subsidy. Although for the 1st to 3rd decile the subsidy is not sufficient to make water bills fall below the 3% threshold —used above as the criteria to evaluate affordability when analysing the impact of PSP— it does reduce the financial burden of poor households significantly. It is also worth noting that household expenditure in water as a share of total income would remain at an acceptable level (below 3.5%) in the absence of subsidy, for the wealthier 60% of households. 5.3. The subsidy scheme and PSP Above we presented results that indicated that PSP had a neutral or positive effect on water and sewerage connection rates for poor households and a significant effect on continuity of service. What is surprising is that these results seem to have been achieved without compromising the affordability of water for poorer households. Could the subsidy scheme have contributed to this result? There is one very suggestive piece of evidence that this was in fact the case. Recall the effects of PSP on affordability that we already presented. What is interesting from these results is that PSP does seem to increase bills when the full sample of households is used, at least according to the first two estimation methods. However, when the sample is restricted to poor households this effect disappears. What these results indicate is that PSP may be associated with a rise in tariffs, but this does not seem to affect poorer households, presumably because the subsidy scheme neutralizes the effect of the rise in tariffs.
19 Gómez-Lobo and Contreras (2003) find similar results using the 1997 survey for Colombia.
19

Table 9: Evaluation of the subsidy system – the case of water
Variable D1 D2 D3 D4 D5 D6 D7 D8 D9 D19 TotalFocalization
% households receiving subsidy 98.6% 99.6% 98.7% 99.5% 98.5% 98.7% 97.7% 96.2% 91.4% 64.6%Distribution of subsidized households across decils. 6.0% 7.8% 8.5% 10.1% 10.5% 11.7% 11.4% 12.2% 12.1% 9.6%Distribution of subsidy across deciles 7.0% 9.5% 10.6% 11.5% 12.5% 11.7% 11.1% 11.2% 9.3% 5.6%Average subsidy (USD 2003) 3.22 3.39 3.43 3.14 3.30 2.78 2.68 2.53 2.11 1.60Average contribution (USD 2003) 8.78 3.87 3.02 4.98 3.70 5.01 3.66 5.67 4.89 6.86Inclusion error 58.0%Exclusion error 0.3%Quasi-Gini coefficient -0.01
AffordabilityAverage household expenses in water as a share of total income (with subsidy) 9.5% 3.7% 3.1% 2.6% 2.3% 2.0% 1.8% 1.6% 1.4% 1.0%Average household expenses in water as a share of total income (without subsidy) 14.7% 6.1% 4.9% 4.1% 3.4% 2.9% 2.5% 2.1% 1.6% 1.0%Average subsidy as a share of income 8.1% 2.5% 1.8% 1.5% 1.2% 0.9% 0.7% 0.5% 0.4% 0.2%
Population characteristicsMinimum income per capita (USD 2003) 0.45 25.90 39.45 52.19 66.59 83.69 105.90 138.03 191.58 319.99 0.45Maximum income per capita (USD 2003) 25.80 39.45 52.17 66.55 83.69 105.88 137.98 191.52 319.95 8,123.54 8,123.54Average income per capita (USD 2003) 16.91 32.70 46.29 59.67 74.82 93.77 120.72 162.98 243.22 669.63 201.79Standard deviation 7.01 3.92 3.61 4.18 5.13 6.18 9.48 15.70 35.17 511.59 293.22
61.9%63.4%
Households included in calculation as share of total householdsHouseholds included in calculations as a share of total connected households Source: ECV 2003, Superintendence of Public Services and calculations by the authors.
20

6. Conclusions In this paper we summarize research that analyse the social impact of private participation in the water sector in Colombia, through its contribution to access and /or improved water and sanitation services for the poorer segments of the population.
Overall, the obtained results indicate that PSP has had mixed results. For example, our analysis is less robust for the access rates, where PSP either had a positive or neutral effect on connection rates among the poor. For affordability of service, we find that there is no statistically significant effect of PSP. However PSP does seem to increase the quality of service and sewerage connection rates. We also demonstrated that the unique subsidy scheme for public services applied in Colombia seems to have been instrumental mitigating affordability issues.
An overview of the subsidy system in place shows an effort on the side of the government to ensure water and sanitation services at prices affordable to the poorest. It also shows, however, a significant amount of resources going to households that may not need them, at the cost of a deficit that places stress on the cash flows of public and private service providers and probably discourages private investments.
While the spirit of the subsidy scheme is to ensure that households that cannot afford to pay the full price for the basic services will still have access to them, in practice its ability to target resources to their best use is questionable, due to both the weakness of the socio-economic household categorization as focalisation instrument and the capacity of the connected households to pay for the services. In addition, non-connected households —which account from between 18% and 38% of households in the lowest four income deciles (see Table 3.8)— do not receive any benefit from the subsidy scheme.
21

References Andres, L. (2004), ‘The Impacts of Privatization on Firms in the Infrastructure Sector in Latin American Countries’, mimeo, University of Chicago. Andres, L., V. Foster and L. Guasch (2006), ‘The impact of privatization on the performance of the infrastructure sector: the case of electricity distribution in Latin American countries’, World Bank Policy Research Working Paper 3936. Blundell, R., C. Meghir, M. Costa Dias and J. Van Reenen (2004), ‘Evaluating the employment impact of a mandatory job search program’, Journal of the European Economic Association, 2(4), June, 569-606. Cardenas, M. and M. Meléndez (2004), ‘Provisión de servicios públicos e infraestructura en zonas marginadas y no interconectadas’ [Provisión of public services and infrastructure in marginal and not interconnected areas], forthcoming in Cuadernos de Fedesarrollo, Bogotá, Colombia. Clarke, G., K. Kosec and S. Wallsten (2004), ‘Has Private Participation in Water and Sewerage Improved Coverage? Empirical Evidence from Latin America’, World Bank Policy Research Paper Nº3445, November, The World Bank, Washington D.C. CONPES (1995), Participación del Sector Privado en Infraestructura Física, Documento CONPES 2775, April. CONPES (1997), La participación privada en Agua Potable y Saneamiento Básico: Política y Estrategia, Documento CONPES 2912, May. CONPES (2003), Importancia Estratégica del Programa de Modernización Empresarial en el Sector de Agua Potable y Saneamiento Básico, Documento CONPES 3253, November. Estache, A. (2005), ‘Privatization in Latin America: the good, the ugly and the unfair’, mimeo. Fernández, D. (2004), Recent Economic Developments in Infrastructure (REDI) in the water sector – Colombia, Final Report, The World Bank, February. Galiani, S., P. Getler and E. Schargrodsky (2005), ‘Water for Life: The Impact of the Privatization of Water Services on Chile Mortality’, Journal of Political Economy, 113(1), pp. 83-120. Gómez-Lobo, A. and D. Contreras (2004), “Water Subsidy policies: A comparison of the Chilean and Colombian Schemes”, The World Bank Economic Review, vol. 17, No. 3, pp. 391-407. Gómez-Lobo, A. and M. Melendez (2006), ‘Social Policy, Regulation and Private Sector Participation: the case of Colombia’, Working Paper, UNIRSD, Geneva.
22

Heckmen, J., H. Ichimura and P. Todd (1997), ‘Matching as an Econometric Evaluation Estimator’, Review of Economic Studies, 64, 605-654. Leuven, E. and B. Sianesi (2003), ‘PSMATCH2: Satat module to perform full Mahalanobis and propensity score matching, common support graphing and covariate imbalance testing”, http://ideas.repec.org/c/boc/bocode/s432001.html. Version 3.0.0. Meléndez, M. (2004), “Subsidies in the provisión of energy, water and telecommunications service”, mimeo, Fedesarrollo, Bogotá, Colombia. Owen, D. L. (2006). Pinsent Masons Water Yearbook, 2006-2007, London: Masons Solicitors. Rosenbaum, P. and D.B. Rubin (1984), ‘Reducing Bias in Observational Studies Using Subclassification on the Propensity Score’, Journal of the American Statistical Association, 79, 516-524. Rosenbaum, P. and D.B. Rubin (1985), ‘Constructing a Control Group Using Multivariate Matched Sampling methods that Incorporate the Porpensity Score’, The American Statistician, 39(1), 33-38.
23

Appendix 1: Summary of contracts tendered until 2003 under the PME framework
Investments (US$ millions)Contract 1 Population (x1,000)
PSP type Start date Tota
l Nat. Mun
. Pri.
ASOAGUA (La Guajira): Barrancas, Distracción, El Molino, Villanueva
42.7 Operation with investment (12 years)
Nov. 2000
0.8 0.3 0.3 0.2
ASOSASA (Atlántico): Sabana grande y Santo Tomás
44.0 Operation with investment (10 years)
Jun. 2002
4.6 0.8 3.4 0.4
Buenaventura (Valle del Cauca)
350.0 Management and operation (20 years)
Jan. 2002
62.0 15.0 19.0 28.0
Cumaral (Meta) 9.2 Construction-operation (10 years)
Jan. 2002
1.5 0.7 0.5 0.3
El Charco (Nariño) 5.3 Management and operation
Jan. 2002
1.6 0.7 0.6 0.3
Guapi (Cauca) 14.0 Management and operation (20 years)
Jan. 2002
1.0 0.2 0.4 0.4
Istmina (Chocó) 13.5 Management and operation (12 years)
Oct. 2001
1.7 0.1 0.1 1.5
Maicao (Guajira) 100.0 Concession (30 years)
Jan. 2001
51.3 6.8 16.5 28.0
Montería (Córdoba)
320.0 Concession (20 years)
Jan. 2000
70.0 4.0 28.0 38.0
Nátaga (Huila) 1.8 Construction-operation (10 years)
Apr. 2001
2.8 2.2 0.6 ---
Pondera (Atlántico)
9.1 Construction-operation (10 years)
Aug. 2002
1.2 0.6 0.7 0.0
Puerto Carreño (Vichada)
7.5 Management and operation (20 years)
Jan. 2002
2.2 0.3 1.5 0.4
Riohacha (Guajira) 90.0 Management and operation (20 years)
Nov. 2000
36.1 4.4 7.5 24.2
San Juan 27.0 Management Dec. 3.0 0.4 2.6 0.0
24
Nepomuceno (Bolívar)
and operation (10 years)
2001
San Marcos (Sucre)
32.75 Operation with investment (15 years)
Jul. 2002
4.1 1.0 2.9 0.2
Soledad (Atlántico)
360.0 Concesión (20 years)
Dec. 2001
43.2 2.0 28.0 13.2
Tadó (Chocó) 9.1 Management and operation (12 years)
Oct. 2001
0.6 0.1 0.0 0.4
Sincelejo-Corozal (Sucre)
280.5 Operation with investment (20 years)
Dec. 2002
61.0 1.9 6.1 17.0
El Banco (Magdalena)
51.7 Operation with investment (16 years)
May 2003
6.4 1.8 4.5 0.05
Total 1,768.2 355.0
43.4 123.1
152.5
Source: CONPES (2003) and Ministry of Environment, Housing and Territorial Development (MAVDT). Notes: 1 Name of contract is followed by Department (in parenthesis) and by the municipalities involved.
25

26