gmodel agmet-4419; no.of pages11 article in press ...nature.berkeley.edu › biometlab › pdf ›...
TRANSCRIPT

G
A
Tp
DWD
a
ARRA
D
KEPWCRMLB
1
mLi
(
0d
ARTICLE IN PRESSModel
GMET-4419; No. of Pages 11
Agricultural and Forest Meteorology xxx (2011) xxx–xxx
Contents lists available at ScienceDirect
Agricultural and Forest Meteorology
journa l homepage: www.e lsev ier .com/ locate /agr formet
he challenges of measuring methane fluxes and concentrations over a peatlandasture
ennis Baldocchi ∗, Matteo Detto1, Oliver Sonnentag2, Joe Verfaillie, Yit Arn Teh,hendee Silver, N. Maggi Kelly
epartment of Environmental Science, Policy and Management, 130 Mulford Hall, University of California, Berkeley, Berkeley, CA 94720, USA
r t i c l e i n f o
rticle history:eceived 6 December 2010eceived in revised form 21 March 2011ccepted 15 April 2011
edicated to T. Andy Black.
eywords:ddy covarianceeatlandetland
attleiceethane
aser spectrometeriogeochemistry
a b s t r a c t
We report on methane (CH4) concentrations and efflux densities that were measured over a drainedand grazed, peatland pasture in the Sacramento-San Joaquin River Delta of California over a threeyear period. The site was ideal for micrometeorological flux measurements due to its very flattopography, its exposure to vigorous winds and its extended fetch along the predominant winddirection. Nevertheless, the interpretation of methane fluxes with eddy covariance proved to beextremely complicated by a number of geographical, biophysical, biogeochemical and site managementfactors.
Initial inspection of the data revealed unexpected results—methane concentrations and efflux densitieswere greatest during the night rather than during the day. To explain this odd diurnal behavior in methaneefflux densities and concentration, we tested two hypotheses. The prime hypothesis presupposed thatthe stable stratification of the nocturnal boundary layer elongated the flux footprint and enabled theflux tower to sense wetter fields at the western edge of the pasture, flooded drainage ditches, and/ora tidal marsh upwind of the pasture—these land forms emitted methane at rates 10–100 times greaterthan the drained portion of the peatland. And, this methane was emitted into a shallower volume of theatmosphere due to the collapse of the nocturnal boundary layer, causing methane concentrations to risefaster. The alternative hypothesis attributed the higher nocturnal methane fluxes to cattle, as they mayhave congregated near the tower at night.
We investigated these hypotheses with: (1) a series of micrometeorological field measurements atcompanion sites upwind and downwind of the pasture; (2) a series of chamber-based flux measurementson the representative land classes; (3) through the lens of a one-dimensional planetary boundary layer(pbl), box model; and (4) via inspection of digital camera images for the presence or absence of cattle.
Together, these pieces of data suggest that elevated methane fluxes and concentrations at night weredue to the combined correlation between: (1) the collapse of the nocturnal boundary layer; (2) theelongation of the flux and concentration footprints; and (3) the preferential sampling of an elevatedmethane source, be it the cattle, wet proportions of the field or some combination. On the other hand,our flux measurements were not perturbed by methane emanating from the tidal marsh that was severalpeat
kilometers upwind of the. Introduction
The atmosphere’s methane burden plays a major role in deter-
Please cite this article in press as: Baldocchi, D., et al., The challenges of meAgric. Forest Meteorol. (2011), doi:10.1016/j.agrformet.2011.04.013
ining the atmosphere’s climate and chemistry (Crutzen andelieveld, 2001; Khalil et al., 2007; Ramanathan et al., 1985); its a greenhouse gas whose concentration has doubled since pre-
∗ Corresponding author. Tel.: +1 510 642 2874; fax: +1 510 643 5098.E-mail addresses: [email protected] (D. Baldocchi), [email protected]
M. Detto), [email protected] (O. Sonnentag).1 Present address: Smithsonian Institute, Panama.2 Present address: Harvard University, Cambridge, MA, USA.
168-1923/$ – see front matter © 2011 Elsevier B.V. All rights reserved.oi:10.1016/j.agrformet.2011.04.013
land pasture site.© 2011 Elsevier B.V. All rights reserved.
industrial times and whose warming potential is more than twentytimes carbon dioxide.
Single-celled archaea are the dominant sources of methane.They inhabit anaerobic microsites in the soil and water-saturatedzones laden with carbon (C), like freshwater marshes, peatlands,rice paddies and the stomachs of cows and termites. Archaeaproduce methane via two major routes (Conrad, 1996; Schimel,2004; Whalen, 2005). One group of methanogens produces CH4by using hydrogen (H2) as an electron donor to reduce the CO2
asuring methane fluxes and concentrations over a peatland pasture.
that evolves from fermented organic matter. Another major groupof methanogens uses acetate (CH3COOH), formed from fermentedorganic matter, as a source of energy and splits it into CH4 andCO2. Conversely, methane is consumed under aerobic conditions

ING Model
A
2 d Fore
bcidoncpmHaatPhtoaB
vaftaeMasmf(2
mdaoCap2tTttrs2ppa
cpRldcIflpUraa
ARTICLEGMET-4419; No. of Pages 11
D. Baldocchi et al. / Agricultural an
y methanotrophic bacteria. Factors governing CH4 production andonsumption in freshwater marshes, peatlands and rice paddiesnclude climate (temperature, light), biogeochemistry (plant pro-uctivity, carbon pool, soil oxygen concentration, and the presencer absence of alternative electron acceptors like iron, sulfate anditrate), plant functional type (absence or presence of plants withonductive xylem, aerenchyma), soil physical properties (texture,orosity, bulk density, water filled pore space) and hydrology (soiloisture, water table depth, lateral flow rate) (Brinson et al., 1981;olden, 2005; von Fischer and Hedin, 2007; Whalen, 2005; Whitingnd Chanton, 1993). Methane transport between soil sedimentsnd the atmosphere can be facilitated by ebullition (e.g. bubbleransport) and xylem transport (Chanton et al., 1989; Holzapfel-schorn and Seiler, 1986). Conversely, methane transport can beindered by slow diffusion across the water–air interface, throughhe tortuous soil column and via consumption by aerobic methan-trophs in aerated soil and water layers (Conrad, 1996), and bynaerobic methane oxidizers in anoxic conditions (Knittel andoetius, 2009; Oremland and Culbertson, 1992).
The Sacramento-San Joaquin River Delta region is an idealenue for studying CH4 fluxes because it is replete in marshesnd drained, agricultural peatlands. High CH4 effluxes are expectedrom marshes in the Sacramento-San Joaquin River Delta becausehey overlay C-rich and anaerobic soils, the region experiences
long and warm growing season, and the ecosystem experi-nces high rates of net primary productivity (Brinson et al., 1981;iller et al., 2001; Zhao et al., 2009). Drained peatlands cre-
te a complex landscape with methane-emitting hot and coldpots. This is because they overlay shallow water tables withethane-producing anaerobic zones, they are flooded periodically
or irrigation, the fields are crossed with flooded drainage ditchesTeh et al., 2011) and many fields are grazed with cattle (Detto et al.,010).
There are societal and policy-based reasons for studyingethane exchange in the Delta, too. The Delta is a major con-
uit of water to the agricultural fields of the San Joaquin Valleynd the burgeoning population of southern California. The futuref Delta, however, is very uncertain and a subject to great debate.urrent land management practices are not sustainable in the Deltas drainage over the last 130 years has caused more than 10 m ofeat to be lost via subsidence, respiration and erosion (Drexler et al.,009; Miller et al., 2008). Consequently, this landscape is vulnerableo sea level rise and flooding if the system of levees fail (Mount andwiss, 2005; Syvitski et al., 2009). Efforts are underway to restorehese drained peatlands to their native state with the reintroduc-ion of wetland vegetation. While pilot studies show that ecologicalestoration is successful in sequestering carbon and building peatoils, it also produces methane at enhanced rates (Miller et al.,008). Hence, baseline information on methane fluxes from drainedeatlands is needed to advise how methane fluxes may change ifeatland pastures and farmland are restored to native vegetationnd wetlands.
We are entering a new era where quasi-continuous, eddyovariance measurement of methane exchange are possible overeatlands and wetlands (Detto et al., 2010; Hendriks et al., 2008;inne et al., 2007). This ability is associated with recent techno-
ogical advances in commercially-available and affordable, tunableiode laser spectrometers that are suitable for measuring methaneoncentrations at sufficiently high sampling rates (Baer et al., 2002).n this light, we have been measuring methane concentration andux densities with the eddy covariance technique over a peatlandasture in the Sacramento-San Joaquin River Delta of California,
Please cite this article in press as: Baldocchi, D., et al., The challenges of meAgric. Forest Meteorol. (2011), doi:10.1016/j.agrformet.2011.04.013
SA since April, 2007. The overarching objective of this paper is toeport on the interpretation of temporal variability in CH4 fluxesnd concentrations measurements, across hourly, daily, seasonal,nd annual time scales. Our ultimate goal is to produce data that
PRESSst Meteorology xxx (2011) xxx–xxx
are relevant to the science, land management and policy issues wearticulated above.
In conducting this study, we found that the interpretation ofmethane fluxes by eddy covariance measurements was much morecomplicated than measurements of carbon dioxide and water vaporfluxes (Baldocchi, 2003) even though this site was ideal from amicrometeorological perspective (Detto et al., 2010). This compli-cation was produced by the presence of a heterogeneous field ofmethane sources upwind of the flux tower (Detto et al., 2010; Tehet al., 2011). To interpret the three-year time series at the peatlandpasture site, we found it necessary to augment our eddy covarianceflux measurements at the anchor site by: (1) conducting a series offlux density and concentration measurements at two companionsites—a rice paddy that was downwind and a tidal marsh that wasupwind; (2) making a series of chamber-based flux measurementsover the representative land forms; (3) interpreting our methaneflux and concentration data through the lens of a one-dimensionalplanetary boundary layer (pbl), box model; and (4) inspecting a cor-responding time series of digital images for the presence or absenceof cattle.
2. Materials and methods
2.1. Site
The primary air sampling and flux measurement site was overa drained, peatland pasture on Sherman Island. This site is locatedon the west side of the Delta and at the confluence of the Sacra-mento and San Joaquin Rivers (lat: 38.0373N; long: 121.7536W;Elevation −12.1 m), near Antioch, CA (Fig. 1). The field samplingsite was below sea-level (−10 m). The air sampling started in April,2007, and continued until September, 2010. A second sampling sitewas established 11.6 km downwind on Twitchell Island in April,2009 over a rice paddy (38◦6.524′N; 121◦39.181′W). We estab-lished a third sampling site during the spring of 2010 that wasdownwind from a tidal marsh (38◦1.946′N; 121◦46.332′W) and1.62 km upwind of the peatland pasture.
The climate is Mediterranean, with wet cool winters and dryhot summers; mean annual rainfall is 325 mm and mean annualair temperature is 15.6 ◦C. And predominant winds come fromthe west. In general, we sampled air that passed over an exten-sive and very flat fetch (over 3000 m) of peatland pasture afterit entered the Delta from the Pacific Ocean and crossed a large(∼3–5 km) tidal marsh (Fig. 1), a potential source of methane(Hirota et al., 2007; Wang et al., 2009). The predominant flux foot-prints for daytime and nighttime conditions are shown in Fig. 2.The typical extent of daytime flux footprint was on the orderof 250 m and confined to the well drained portions of the pad-dock. In comparison, the nighttime flux footprint extended about750 m upwind of the tower and crossed drainage ditches and awetter portion of the pasture (Detto et al., 2010). A set of cor-responding flux measurements made with chambers found thatthe drained crowns within the daytime flux footprint emittedmethane at a mean rate of 0.96 ± 0.19 nmol m−2 s−1 (Teh et al.,2011). The presence and absence of drainage ditches in our fluxfootprint is important because they are known to be hot-spots formethane production; the ditches emitted methane at a mean rateof 449 ± 75 nmol m−2 s−1 (Teh et al., 2011).
The pasture was vegetated with pepperweed (Lepidium lati-folium), a perennial herb, and foxtail barley (Hordeum murinum),an annual grass; both are non-native, invasive species and com-
asuring methane fluxes and concentrations over a peatland pasture.
mon throughout the region. The soil was a silt loam, with 5–10%carbon, in the upper 60 cm. It overlaid a deep organic peat layer,which was over 20 m thick (Drexler et al., 2009). The water tableranged between 0.50 and 0.70 m below the soil surface and kept

ARTICLE IN PRESSG Model
AGMET-4419; No. of Pages 11
D. Baldocchi et al. / Agricultural and Forest Meteorology xxx (2011) xxx–xxx 3
F d, thed
tmd
2
aAdsptpla
tq
FfitpbtT
ig. 1. Map of the sampling sites at the drained-peatland pasture on Sherman Islanenote the location of the flux towers.
he remnant peat in a saturated and anaerobic state, which favoredethane production. The upper portion of vadose zone remained
rained and aerobic by a system of drainage ditches.
.2. Instrumentation
Methane concentrations were measured with a Los Gatos tun-ble diode laser spectrometer (DLT-100 Fast Methane Analyzer).ir was pulled through a 40 micron and two 2 micron filters with ary scroll pump at a rate of 35 L min−1 before entering the 0.408 Lampling cell. The instrument interrogated the air stream 10 timeser second and 30 min averages were produced. Methane concen-rations were sampled at a height of 3 m above the drained peatlandasture, and the rice paddy. And, we sampled air on the levee over-
ooking the tidal marsh at a height of 6.98 m with a second methane
Please cite this article in press as: Baldocchi, D., et al., The challenges of meAgric. Forest Meteorol. (2011), doi:10.1016/j.agrformet.2011.04.013
nalyzer during the spring of 2010.The CH4 sensor used off-axis integrated cavity output spec-
roscopy (Baer et al., 2002; O’Keefe et al., 1999). A mid-infrareduantum cascade laser was tuned across the 6057 cm−1 wavenum-
ig. 2. Flux footprints along the predominant wind direction at the Sherman Islandeld site. The larger ellipse represents the nocturnal footprint and the smaller one ishe daytime footprint. The nocturnal footprint overlays poorly drained areas of theasture (noted by the dark spots, representing surface water) and drainage ditches,oth which represent methane hot spots. The footprint model was computed usinghe model of Detto et al. (2008).his figure was adapted from Detto et al. (2010) and Teh et al. (2010).
rice paddy on Twitchell Island and the marsh site upwind of the pasture. The stars
ber (1651 nm) CH4 absorption band. The laser light was reflectedbetween two curved mirrors multiple times to produce an opticalpath-length that was several km long. Light attenuation was mea-sured directly and CH4 concentrations were computed using Beer’sLaw. To minimize pressure broadening, the cell pressure was main-tained near 21.1 kPa with a mass flow controller. Because the laserwas developed for commercial telecommunication purposes it didnot require cooling by liquid nitrogen, making it conducive for con-tinuous and unattended measurements. Together, these attributesproduced an instrument that was based on fundamental physics,was highly accurate (±1%), precise (0.1%), experienced little drift(∼10 ppb per week) and no interference by other trace greenhousegases, like water vapor and CO2.
Field calibrations were performed on a regular interval (weeklyto bi-weekly) using a primary standard gas that was traceable to theNOAA ESRL laboratory in Boulder Colorado; lab tests with a stan-dard calibration gas produced concentration measurements with aprecision of ±0.8 ppb out of a background of 1900 ppb when sam-pled at 1 Hz. The sensor signal, however, was noisier when sampledat 10 Hz (∼±3 ppb). Consequently, the summation of instrumentand geophysical noise was on the order of ±6 ppb when averagedover 30 min (Detto et al., 2010, 2011).
A suite of meteorological variables were measured in con-junction with the CH4 concentrations. Wind and turbulence wasmeasured with a three-dimensional sonic anemometer (Gill Wind-master Pro). Water vapor and carbon dioxide mole densities weremeasured with an open-path, infrared spectrometer (LICOR 7500,Lincoln, NE). Air temperature and humidity were measured with anaspirated and shielded thermistor and capacitance sensor (VaisalaHMP 45, Helsinki, Finland). Soil temperature was measured witha profile of copper-constantan thermocouples. Soil moisture wasmeasured with a network of capacitance (ML2, Theta Probe, Delta-TDevices, Cambridge, UK) and time domain reflectometers (Mois-ture point PRB-K probes, Environmental Sensors Inc., Sydney, BC,Canada) sensors. Water table was measured with a pressure sensor(PDCR 1830-8388, Druck Pressure Transducer, Campbell Scientific,Logan, UT) immersed in a well, next to the meteorological tower.
The CH4 sensor was integrated into an eddy covariance sys-tem to measure CH4 fluxes (Detto et al., 2010, 2011). Methane
asuring methane fluxes and concentrations over a peatland pasture.
efflux densities (FCH4 = �̄aw′�′c,nat) were computed in terms of the
covariance between vertical wind velocity (w) and mixing ratio (�c)fluctuations, times the density in dry air (�a). These covarianceswere corrected for density fluctuations due to water vapor (�q)
IN PRESSG Model
A
4 d Forest Meteorology xxx (2011) xxx–xxx
u
F
osi
tetdiaa
qwpoabfmtNse
f(efl
cppowiintA
3
cwfdtdwctl
3a
Ar
Year-Day
20112010200920082007
[CH
4], p
pb
1750
2000
2250
2500
2750
3000
3250
3500Mean-Daily Methane Concentration
CH4 at Trinidad, CA
Year-Day20112010200920082007
da
ily a
ve
rag
e F
CH
4 (
nm
ol m
-2 s
-1)
0
100
200
300
400
Year-Day
20112010200920082007
Pre
cip
itation (
mm
d-1
)
0
20
40
60
80
ARTICLEGMET-4419; No. of Pages 11
D. Baldocchi et al. / Agricultural an
sing the method of Detto and Katul (2007):
CH4 = �̄aw′�′c,nat = �̄a
[w′�′
c,nat + �̄c
�̄aw′�′
q
](1)
We also corrected the covariances for time lags in the transportf air through the sampling tube and spectral attenuation of theampling system. Details on computations are discussed in papersn other papers (Detto et al., 2010, 2011).
Because methane fluxes span such a wide range, it is importanto assess the flux detection limit of our eddy covariance system. Westimated that the minimum detection limit of the eddy flux sys-em was on the order of ±4 nmol m−2 s−1 (Detto et al., 2011). Thisetection limit was comparable to minimum CH4 fluxes reported
n a number of methane flux studies that used the eddy covari-nce method (Hendriks et al., 2008; Rinne et al., 2007; Shurpalind Verma, 1998; Verma et al., 1992).
We subjected the methane flux time series to a number ofuality assurance checks. First, we filtered and excluded datahen the methane sensor or pump were not working, if the sam-ling rate had been reset at 1 Hz instead of 10 Hz after a powerutage, if rain blocked the transmission of sound on the sonicnemometers or if the methane concentration was below ambientackground conditions (<1740 ppb). We also excluded data whenriction velocity was below 0.15 m s−1 or exceeded 1.2 m s−1, when
ethane effluxes were extreme (>1500 nmol m−2 s−1) and whenhe standard deviation in methane concentration exceeded 35 ppb.evertheless, we did not find methane effluxes to be especially
ensitive to friction velocity at night, as has been reported for CO2xchange (Aubinet et al., 2000).
Background measurements of CH4 concentration were acquiredrom the NOAA ESRL laboratory field station at Trinidad Head41.0537◦N 124.1534◦W), in northern California (Dlugokenckyt al., 2003). These CH4 concentrations are derived from weeklyask samples of air in the marine boundary layer.
To monitor field phenology and the presence or absence ofows, we installed a web camera (model DCS-900; D-Link Cor-oration, Taipei, Taiwan) and pointed it towards the west, therevailing wind direction (Sonnentag et al., 2011). The presencer absence of cows within the vicinity of the meteorological toweras determined from the digital images through object-oriented
mage analysis. The index we developed was binary and detectedf cows were present (1) or absent (0) in the image. The index didot reflect if the cows were close or far to the air sampling sys-em. Additional information on the image analysis is provided inppendix A.
. Results and discussion
Over the course of this experiment we collected meteorologi-al data for 61,392 thirty-minute intervals. Within this time frame,e collected 49,616 periods of data when the methane sensor was
unctioning and collected 32,212 periods of data when the windirection was favorable and the sensors were functioning. To digesthis large body of data, we first examine the seasonal variation inaily integrals of methane flux densities and concentrations. Then,e inspect the mean diurnal patterns of methane flux densities and
oncentrations for the dominant seasons. The intent is to describeheir temporal behavior and identify the mechanisms that modu-ate the dynamics of methane concentrations and flux densities.
.1. Seasonal and diurnal variations in methane concentrationsnd fluxes
Please cite this article in press as: Baldocchi, D., et al., The challenges of meAgric. Forest Meteorol. (2011), doi:10.1016/j.agrformet.2011.04.013
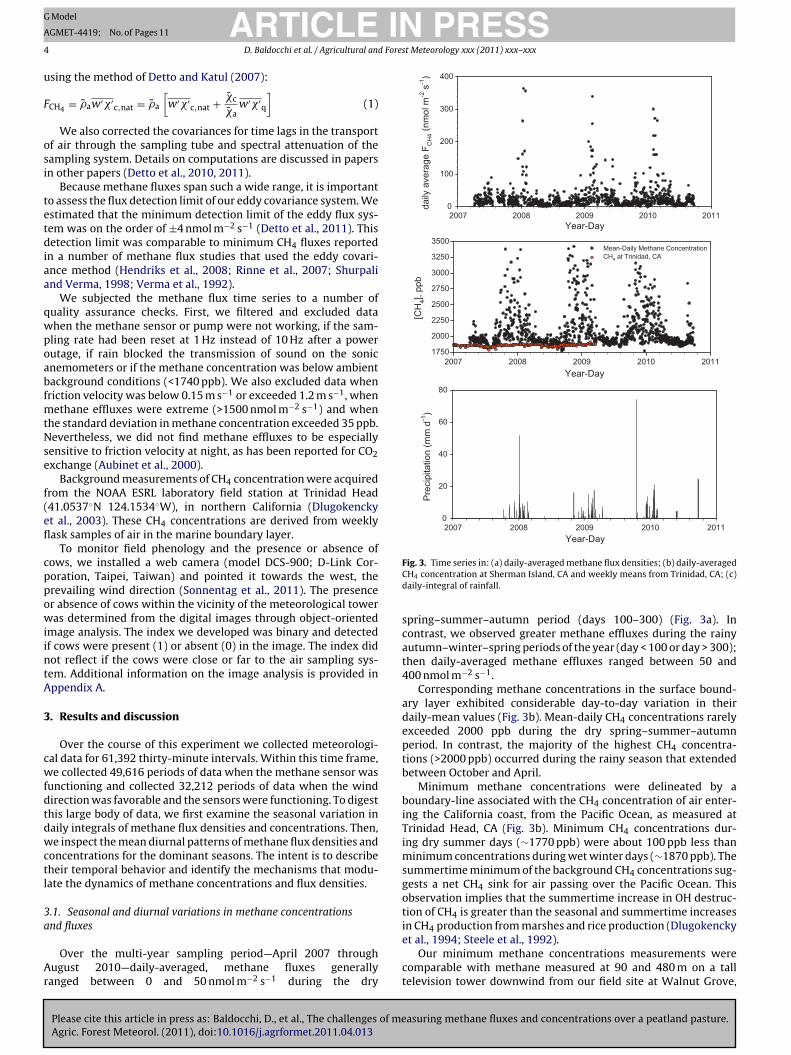
Over the multi-year sampling period—April 2007 throughugust 2010—daily-averaged, methane fluxes generallyanged between 0 and 50 nmol m−2 s−1 during the dry
Fig. 3. Time series in: (a) daily-averaged methane flux densities; (b) daily-averagedCH4 concentration at Sherman Island, CA and weekly means from Trinidad, CA; (c)daily-integral of rainfall.
spring–summer–autumn period (days 100–300) (Fig. 3a). Incontrast, we observed greater methane effluxes during the rainyautumn–winter–spring periods of the year (day < 100 or day > 300);then daily-averaged methane effluxes ranged between 50 and400 nmol m−2 s−1.
Corresponding methane concentrations in the surface bound-ary layer exhibited considerable day-to-day variation in theirdaily-mean values (Fig. 3b). Mean-daily CH4 concentrations rarelyexceeded 2000 ppb during the dry spring–summer–autumnperiod. In contrast, the majority of the highest CH4 concentra-tions (>2000 ppb) occurred during the rainy season that extendedbetween October and April.
Minimum methane concentrations were delineated by aboundary-line associated with the CH4 concentration of air enter-ing the California coast, from the Pacific Ocean, as measured atTrinidad Head, CA (Fig. 3b). Minimum CH4 concentrations dur-ing dry summer days (∼1770 ppb) were about 100 ppb less thanminimum concentrations during wet winter days (∼1870 ppb). Thesummertime minimum of the background CH4 concentrations sug-gests a net CH4 sink for air passing over the Pacific Ocean. Thisobservation implies that the summertime increase in OH destruc-tion of CH4 is greater than the seasonal and summertime increasesin CH4 production from marshes and rice production (Dlugokencky
asuring methane fluxes and concentrations over a peatland pasture.
et al., 1994; Steele et al., 1992).Our minimum methane concentrations measurements were
comparable with methane measured at 90 and 480 m on a talltelevision tower downwind from our field site at Walnut Grove,

ARTICLE ING Model
AGMET-4419; No. of Pages 11
D. Baldocchi et al. / Agricultural and Fores
Time
24201612840
CH
4 (
pp
b)
1900
2000
2100
2200
2300
2400
2500
Days 100-300
Days < 100 or > 300
Time24201612840
CH
4 F
lux (
nm
ol m
-2 s
-1)
0
10
20
30
40
50
60
70
Days 100-300
Days < 100 or > 300
Sherman Island, 2007-2010, Westerly Winds
Fig. 4. Mean diurnal pattern of methane effluxes (a) and concentrations (b) for thedry spring-summer time period (days 100–300) and rainy period (days 300–100)for years 2007–2010. The data were filtered for conditions when winds came fromthe westerly sector (200–330◦), retaining 52% of the data (32,212 thirty-minuteso
Cd(n(
dc(rcmetettwcvtleidp5
ampling periods over a span of 61,392 periods). Standard errors are superimposedn the means.
A (Zhao et al., 2009). The amplitude of the seasonal oscillation inaily minimum methane was similar to that observed in Hungary∼100 ppb) and greater than that typically observed across a globaletwork of marine boundary layer sampling stations (∼30 ppb)Dlugokencky et al., 1994).
Fig. 4 distills other key information in Fig. 3 by reporting meaniurnal patterns in methane efflux densities (Fig. 4a) and con-entrations (Fig. 4b) for the two distinct seasons, the dry perioddays 100–300) and the rain period (days < 100 or days > 300),espectively. The mean diurnal behavior of methane effluxes andoncentrations from the peatland pasture was unexpected. Lowestethane efflux densities occurred during the midday and the great-
st efflux densities occurred after sunset and remained elevatedhroughout the night, during both the dry and wet periods. The low-st methane effluxes (0–10 nmol m−2 s−1) were observed duringhe day and the dry period. These methane effluxes were represen-ative of the well-drained portions of the field and were compatibleith measurements from a companion spatial study made with
hambers (Teh et al., 2011). Conversely, the higher methane effluxalues (>50 nmol m−2 s−1) that were observed at night duringhe dry period bisected the magnitude between methane ratesost from the drained and saturated portions of the field (Teht al., 2011). Greatest methane efflux densities were observed dur-
Please cite this article in press as: Baldocchi, D., et al., The challenges of meAgric. Forest Meteorol. (2011), doi:10.1016/j.agrformet.2011.04.013
ng the rain period. For example, hourly-mean methane effluxensities ranged between 8 and 63 nmol m−2 s−1 during the weteriod and hourly-mean methane effluxes ranged between 4 and6 nmol m−2 s−1 during the dry period. This observation is con-
PRESSt Meteorology xxx (2011) xxx–xxx 5
sistent with the expectation that wetter soils promote methaneproduction and discourage methane consumption (Whalen, 2005).
At night, it was common to see mean CH4 concentrationsexceeding 2000 ppb during the dry period and reaching 2400 ppbduring the wet period. In contrast, mean methane concentrationsduring the day were below 1900 ppb during the dry season andnear 2000 ppb during the wet season.
These pronounced diurnal patterns, with strong nocturnal peaksin methane efflux densities and concentration, are the antithesis oftypical diurnal patterns reported from Arctic and Boreal wetlandsin Sweden, Finland, Canada and Minnesota (Jackowicz-Korczynskiet al., 2010; Rinne et al., 2007; Shurpali and Verma, 1998), Cali-fornian rice paddies (McMillan et al., 2007) and Dutch peatlands(Hendriks et al., 2007, 2008); these comparative studies tend toreport methane effluxes that peak during the day or are invari-ant over diurnal time scales. The data shown in Fig. 4 also differgreatly from the diurnal courses of methane fluxes made at thissite with chambers—such effluxes were relatively invariant withtime at a variety of land classes (Teh et al., 2011). The nocturnalpeak in methane efflux densities is counter-intuitive if one expectsa diurnal pattern to be modulated by temperature, which peaksduring the day.
The highest nocturnal methane effluxes are especially notable,and merit additional scrutiny, because they exceed the geometricmean methane emission rates from an assortment of fresh-water marshes (Bridgham et al., 2006) and ombrotrophic andminerotrophic peatlands in Scandinavia (Maljanen et al., 2010;Saarnio et al., 2007). These nocturnal peaks also merit more scrutinybecause the areal extent of the hot-spot ditches is less than 10% ofthe area in the fetch.
3.2. Diagnosing why mean methane effluxes and concentrationspeak at night
To explain why our diurnal time series in mean methane effluxand concentration is unique we propose and test two competinghypotheses. The first hypothesis involves the temporal modula-tion and covariation of the planetary boundary layer and the fluxfootprint. At night, the atmosphere becomes stably-stratified asthe surface cools by radiating longwave energy (Mahrt, 1999).This phenomenon is accompanied with a collapse in the depthof the planetary boundary layer (Cleugh and Grimmond, 2001), areduction in wind speed, and an extension of the flux and con-centration footprints (Schmid, 2002; Vesala et al., 2008). If theelongated nocturnal flux footprint is seeing an elevated methanesource area compared to the day, as suggested by Fig. 2, wehypothesize that larger methane effluxes and concentrations mayresult. This hypothesis is most plausible during the dry summerperiod when the western reach of the paddock and the drainageditches that transect the pasture were often flooded (Fig. 2).Then these areas were landscape-scale, ‘hot-spots’ for CH4 pro-duction; mean methane emissions rates from the drainage ditches(449 ± 75 nmol m−2 s−1) greatly exceeded those of all other land-forms by up to 2 orders of magnitude (Teh et al., 2011). Thishypothesis is least plausible during the winter when rain wets theentire field, in a more or less uniform manner.
The pasture was grazed year-round, too. So our alternativehypothesis invokes the role of cattle as significant methane sources(Laubach and Kelliher, 2005). If the cattle congregated within thenear-field diffusion region of the measurement tower at night theycould produce elevated methane effluxes and concentrations.
We test the plausibility of the former hypothesis by evaluating
asuring methane fluxes and concentrations over a peatland pasture.
our methane fluxes and concentrations through the lens of a one-dimensional planetary boundary layer (pbl) box model. We testedthe alternative hypothesis by measuring methane effluxes at aux-iliary sites without cows. To accomplish this task, a set of methane

ARTICLE IN PRESSG Model
AGMET-4419; No. of Pages 11
6 D. Baldocchi et al. / Agricultural and Forest Meteorology xxx (2011) xxx–xxx
pbl = 100 m
time (s)
10000010000100010010
CH
4 (
ppb
)
1800
1900
2000
2100
2200
2300
2400
F=10 nmol m-2
s-1
F=50
F=100
Fbz
fldpot
3
edo
�
c
dIpatlo
oeedtoFb1ba
bCaCC
Fig. 6. Computation of CH4 concentrations using a one-dimensional box model fora stable and steady nocturnal boundary layer. The figure is plotted as a function of
ig. 5. Time series in computed methane concentration with the one-dimensionalox model. This case is for a 100 m deep box and the methane concentration at timeero was 1890 ppb. Methane was emitted at rates of 10, 50 and 100 nmol m−2 s−1.
ux measurements were conducted over: (a) a flooded rice paddy,ownwind from the pasture, and (b) a marshland, upwind of theasture. We also inspected our web camera images for the presencer absence of cows when daytime methane efflux and concentra-ion measurements were anomalous.
.2.1. Nocturnal turbulence and the planetary boundary layerThe potential range of nocturnal CH4 concentrations and
ffluxes can be evaluated theoretically by considering a one-imensional box model, which quantifies the time rate of changef CH4 (c) as a function of the vertical flux divergence:
a�c
�t= −F0
zi(2)
In the integral form, Eq. (2) can be expressed as:
(t) = c(t0) + F0
�azi(t − t0) (3)
In Eq. (2), �a is the mole density of dry air, F0 is the CH4 effluxensity at the surface and zi is the depth of the inversion layer.
n equation 3, the initial methane concentration (C(t0)) was 1890pb and the equation was integrated over a 10 h time span. Wessumed that the top of the ‘box’ was delineated by the height ofhe nocturnal boundary layer (zi) and that the flux across this upperid was nil. Consequently, the flux divergence is defined by the ratiof the surface flux density, F0, and zi.
Assuming that the nocturnal boundary layer collapses to a depthf 100 m in the Delta region (Cleugh and Grimmond, 2001; Zhaot al., 2009), we calculated that CH4 concentrations would notxceed 2000 ppb after 10,000 s (2.77 h) if the CH4 efflux of theaytime pasture footprint (∼10 nmol m−2 s−1) is representative ofhe landscape sensed by the CH4 sensor at night (Fig. 5). This setf computations is not supported by the observations shown inig. 4. On the other hand, our field observations are bounded byox model computations based on methane efflux rates of 50 and00 nmol m−2 s−1, as they produce CH4 concentrations that riseetween 100 and 300 ppb above initial conditions, respectively,fter 10,000 s.
Because our assumptions regarding depth of the nocturnaloundary layer and lack of entrainment are uncertain, we plotted
Please cite this article in press as: Baldocchi, D., et al., The challenges of meAgric. Forest Meteorol. (2011), doi:10.1016/j.agrformet.2011.04.013
H4 concentrations as a function of CH4 efflux and planetary bound-ry layer depth to circumscribe the relationship between largeH4 concentrations, boundary layer depth and areally-integratedH4 efflux. We found that CH4 concentrations exceeded 2300 ppb
flux density (FCH4, nmol m−2 s−1) and height of the planetary boundary layer. Thecolor contours represent methane concentration. These computations were derivedafter a time integral of 10 h.
(relative to the 1890 ppb initial condition) only during a dis-tinct combination of conditions—when low boundary layer heights(50—350 m) corresponded with relatively high methane effluxes(50—250 nmol m−2 s−1) (Fig. 6).
These computations lead us to conclude that the large noctur-nal methane concentrations may be explained by an elevated arealsource emitting methane into a shallow boundary layer. At thisstage, we cannot dismiss if the elevated methane source was asso-ciated with the elongation of the flux footprint over the wet areasof the paddock and the ditches as determined from our compli-mentary chamber studies (Teh et al., 2011). Nor, can we dismisswhether elevated methane effluxes (50–250 nmol m−2 s−1), thatwere inferred from the pbl model, were an artifact of the additivemethane efflux from the herd of cattle.
3.2.2. Methane concentrations and flux densities at sites withextensive and homogeneous methane source fields, and withoutcows
Next, we examine mean diurnal patterns of methane effluxesand concentrations measured at the rice paddy down-wind fromthe pasture and the marsh upwind of the pasture to: (1) observemethane concentrations and fluxes at natural methane producingsites without cows; and (2) to examine if the mean diurnal pat-terns in methane flux densities and concentrations at these sitesresemble those observed over the peatland pasture.
The mean diurnal pattern of methane efflux density over thedownwind, rice paddy was relatively invariant over 24 h when thedata were binned and averaged for periods corresponding withthe dry period (days 100–300) or the rainy period (days < 100 ordays > 300) (Fig. 7a). On the other hand, methane concentrationsexperienced much diurnal modulation, like those measured at thepeatland pasture site (Fig. 7b).
The westerly fetch of the flux footprint at the rice paddy sitewas over 400 m so the sensor sampled air from the same methaneproducing source-field during the day and night, year-round; landfurther upwind of the rice was cultivated crops, which were notemitters of methane. Consequently, the temporal invariance inmethane exchange over the rice provides a second piece of evidence
asuring methane fluxes and concentrations over a peatland pasture.
suggesting that the elevated nocturnal methane fluxes observedover the peatland pasture may result from an elongation of the fluxfootprint, under a shallow and stable nocturnal boundary layer, thatextends over upwind sources of methane. It is also noteworthy that

ARTICLE IN PRESSG Model
AGMET-4419; No. of Pages 11
D. Baldocchi et al. / Agricultural and Forest Meteorology xxx (2011) xxx–xxx 7
Time
24201612840
CH
4 (
ppb)
2000
2200
2400
2600 Days 100-300
Days < 100 or > 300
Time
24201612840
CH
4 F
lux (
nm
ol m
-2 s
-1)
0
20
40
60
Days 100-300
Days < 100 or > 300
Twitchell Island, Rice, 2009-2010, Westerly Winds
Fig. 7. Mean diurnal pattern of methane concentrations and effluxes over the ricepaddy for the spring–summer time growing season period (days 100–300) and fal-low, flooded autumn–winter period (days 300–100) for years 2009–2010. The datawS
ertf
p2t(dpfNosc1iataedcmflt
Sherman Island, D 98-124, 2010
Time Hours
24201612840
FC
H4 (
nm
ol m
-2 s
-1)
-50
0
50
100
150
200
250
300
Tidal Marsh
Peatland Pasture
Time (hours)
24201612840
CH
4 (
pp
b)
1800
1900
2000
2100
2200
Tidal Marsh
Peatland Pasture
Fig. 8. Mean diurnal patterns in methane efflux and concentration from the tule
ere filtered for conditions when winds came from the westerly sector (200–330◦).tandard errors are superimposed on the means.
levated methane concentrations were observed at night from theice site, without cows. One plausible explanation for this observa-ion is the fact that the rice field on Twitchell Island was downwindrom a group of natural gas wells, which may leak some methane.
Next, we conducted a set of measurements upwind of theasture, and downwind from a tidal marsh during the spring of010, until the solar panels were stolen by vandals. Data fromhe 26 day experiment showed moderate methane efflux densitiesbetween 0 and 40 nmol m−2 s−1, on average). The methane fluxensities from the tidal marsh matched those emanating from theasture during the day, but were exceeded by nocturnal effluxesrom the pasture that, on average, approached 150 nmol m−2 s−1.o distinct diurnal pattern in methane exchange (Fig. 8a) wasbserved from the tidal marsh, as compared to the correspondinget of measurements made at peatland pasture; methane con-entrations downwind of the tidal marsh were generally below900 ppb and they tended to reach a maximum at mid morn-
ng rather than at night (Fig. 8b). This third piece of evidencellows us to accept the hypothesis that the anchor tower onhe peatland pasture sensed elevated fluxes and concentrationst night because the elongation of the nocturnal flux footprintnabled the tower to sense elevated methane sources from theitches and flooded portions of the field (Teh et al., 2011), or byattle. It does not support the alternative hypothesis that tidal
Please cite this article in press as: Baldocchi, D., et al., The challenges of meAgric. Forest Meteorol. (2011), doi:10.1016/j.agrformet.2011.04.013
arsh, which was further upwind and produced smaller methaneuxes, contributed to the elevated nighttime fluxes and concentra-ions.
marsh, upwind of the peatland, and the peatland pasture for the same period, days98–124, 2010. Data were selected for periods with favorable wind direction.
3.2.3. Cattle, a mobile and intermittent methane sourceDuring our frequent, daytime, site visits, we observed that the
cattle often grazed near the far western side of the paddock andtended to be outside the flux footprint of the predominant winds.So we initially discounted their effect on our efflux and concentra-tion measurements. Our thorough analysis of the data, however,forced us to re-consider the effects of grazing cattle on our methaneconcentration and flux measurements.
The paddock was about 0.38 km2 in area and was grazed byabout 100 cattle. If we assume that the cattle emitted between10 and 20 mol of CH4 per steer per day (Laubach et al., 2008;McGinn et al., 2009; van Haarlem et al., 2008), we compute a poten-tial areal efflux density of CH4 by the cattle to range between 30and 60 nmol m−2 s−1. These values suggest that the cattle had thepotential to disturb our signal when they were close to the fluxtower (e.g. within the near-field diffusion regime).
Using the object-oriented image processing methods to inspectthe time series of digital images (Appendix A) we developed anindex to deduce when cattle were present or absent in the imagesfor the population of data. Fig. 9 shows that cattle were leastprevalent during the afternoons of the dry period and most preva-lent during the afternoons of the rainy period. There was also atendency for cattle to congregate near the tower towards sun-set of the dry period; the data suggest less so during the rainperiod. Unfortunately, the cow-cam was not capable of detect-
asuring methane fluxes and concentrations over a peatland pasture.
ing the presence of cattle after sunset. But anomalous correlationsbetween methane and carbon dioxide proved to be good indica-tors of the presence of cattle at night and were used to screen

ARTICLE IN PRESSG Model
AGMET-4419; No. of Pages 11
8 D. Baldocchi et al. / Agricultural and Forest Meteorology xxx (2011) xxx–xxx
Table 1Computation of annual methane effluxes with different assumptions on how the data are averaged and integrated.
Variable footprint Small footprint Large footprint Large–small footprint Small footprintDay and night, with cows Day only, with cows Night only, with cows Night-Day, with cows Day only, without cows
gC m−2 y−1 8.66 ± 6.65 4.2 ± 1.93 13.1mol m−2 y−1 0.721 ± 0.554 0.353 ± 0.161 1.08
Sherman Island, Westerly Winds
time-hour
24201612840
co
w in
de
x
0.0
0.1
0.2
0.3
0.4
0.5
0.6
0.7
Day > 100 and Day < 300
Day < 100 or Day > 300
Ft
o2
ipbie(oiat
tb
Fit
ig. 9. The mean diurnal pattern of the fraction of cows in the region of interest inhe digital camera image. Details on the cow index are reported in Appendix A.
ur data in other analyzes (Detto et al., 2010, 2011; Teh et al.,011).
With an ability to detect the presence and absence of cattle dur-ng the day, we filtered our data for periods when no cattle wereresent and winds were directed from the westerly fetch viewedy the camera. We then re-computed the mean diurnal pattern
n methane flux density. Fig. 10 shows slightly smaller methanefflux densities during the middle portion of day during the dry4.2 ± 1.88 nmol m−2 s−1) and wet (10.5 ± 6.1 nmol m−2 s−1) peri-ds. These values are significantly smaller than values reportedn Fig. 4 that contain elevated emissions from cows (5.77 ± 1.59nd 17.8 ± 9.35 nmol m−2 s−1, for the dry and rainy periods, respec-
Please cite this article in press as: Baldocchi, D., et al., The challenges of meAgric. Forest Meteorol. (2011), doi:10.1016/j.agrformet.2011.04.013
ively).Fig. 10 also shows greatly elevated methane flux densities, in
he absence of cows, as time approached sunset and the atmosphereecame thermally stratified. Based on the set of experiments, model
Peatland Pasture, No Cows, West Winds
Time-Hours
24201612840
FC
H4 (
nm
ol m
-2 s
-1)
-10
0
10
20
30
40
50
60
70
Days 100-300
Days < 100 & > 300
ig. 10. Mean diurnal pattern in methane efflux when cows were absent in themage. The data were screened for the dry and periods and when winds came fromhe westerly sector that was viewed by the camera.
± 6.67 8.77 2.68 ± 1.42± 0.556 0.73 0.223 ± 0.119
calculations and analysis of digital camera imagery, we cannotdiscount the combined effects of breathing cattle, the collapsednocturnal boundary layer and the elongation of flux footprint overthe methane hot spots in the field as co-varying factors contribut-ing to elevated methane concentrations and efflux densities aftersunset.
3.3. Constraining annual methane emission budgets
If we integrate the mean diurnal patterns and computea mean annual methane efflux without any discriminationfor cattle or elongated footprints we arrive at a value of0.721 ± 0.554 mol m−2 y−1 or 8.66 ± 6.65 gC–CH4 m−2 y−1 (Table 1).For comparison, we estimated that the mean methane efflux fromthe landscape was 9.5 ± 3.4 gC–CH4 m−2 y−1 using a network of soilchambers (Teh et al., 2011); this estimate was derived from weeklychamber-based efflux measurements that sampled the representa-tive land classes (crown, slope, hummock/hollow, drainage ditches)and was upscaled using remote sensing information that assessedtheir proportion of the total land area.
Rather than integrating all methane flux measurements, withall their attendant biases, the present study gave us guidance forproducing conditional averages, which we use to bound the annualmethane budget for the portion of the peatland sampled by theeddy covariance system. The mean daytime efflux of methane was11.2 ± 5.1 nmol m−2 s−1, after weighting the dry and rainy periodsand favorable wind directions over three years (Fig. 4). If we acceptthat this value as representative of the 24 h average of methane thatwas emitted from the drained portion of the pasture, and that theemissions from the cows are minimal and diluted by the well mixedand deep daytime boundary layer, we compute an annual emis-sion of 0.353 ± 0.161 mol m−2 y−1 or 4.2 ± 1.93 gC–CH4 m−2 y−1
(Table 1). In contrast, the mean nocturnal methane efflux was34.51 ± 17.6 nmol m−2 s−1, after weighting according to the wetand rainy periods. If we accept that this mean as representativeof the methane emitted from the nocturnal flux footprint, whichconstitutes the aerated and wet portions of the field, and cows,we compute an annual emission of 1.08 ± 0.556 mol m−2 y−1 or13.1 ± 6.67 gC–CH4 m−2 y−1. And, we can estimate the methaneemitted by the cattle and wetter patches by taking the differ-ences between the day and night flux densities, with their differentflux footprints, and sum that value over one year. This yieldsa mean difference of 23.3 nmol m−2 s−1 and an annual sum of0.73 mol m−2 y−1 or 8.77 gC–CH4 m−2 y−1 (Table 1).
If we use a smaller pool of data, sorted according to favorablewind directions and periods when no cows were detected in thecamera image and assume these daytime conditions were repre-sentative of the whole day and year we calculate that the meanmethane efflux density from the well-drained portion of the pas-ture was 0.223 ± 0.119 mol m−2 y−1 or 2.68 ± 1.42 gC–CH4 m−2 y−1.Hence, we deduce that the drained portion of the peatland pasturewas a very small source of methane. But we recognize that strongsources of methane exist in the region from cows, flooded areasof the field and drainage ditches. And that their presence can bias
asuring methane fluxes and concentrations over a peatland pasture.
ones measurements and interpretation if ignored.Year-long eddy covariance studies on methane emissions are
relatively rare. For perspective, we cite three comparable cases.Hendriks et al. (2007) reported a loss of about 30 g C–CH4 m−2 y−1

ING Model
A
d Fores
flJflptp
4
mgmsmt2tv2
ootiettml1
itttaatnbnwms
ttmpttCoi2tdw
otam
ARTICLEGMET-4419; No. of Pages 11
D. Baldocchi et al. / Agricultural an
rom a peatland in the Netherlands. Rinne et al. (2007) reported aoss of about 9 g C–CH4 m−2 y−1 from a boreal fen in Finland. Andackowicz-Korczynski et al. observed 24 g C–CH4 m−2 y−1 were lostrom an subArctic peatland. Our sums for the dry part of the peat-and pasture are below these values and our sums for the wetterortion of the pasture resembles the boreal fen but remain lowerhan the amount of methane lost from the Dutch and the subarcticeatlands.
. Conclusion
Measuring greenhouse gas fluxes, which are produced solely byicrobes, is much more complicated than measuring greenhouse
ases that are routed through plants (e.g. CO2 and H2O), even overicrometeorologically ideal sites. Microbes produce hot and cold
ources across a landscape that may vary by two to three orders ofagnitude within a few meters, thereby challenging the assump-
ion of a horizontally homogeneous source or sink (Baldocchi,003). This effect is not so evident over plant canopies, as theyend to fill space if there is adequate soil moisture and their spatialariability tends to be on the order of ±10–30% (Hollinger et al.,004).
The odd diurnal behavior in methane efflux and concentrationbserved over a peatland pasture forced us to conduct a seriesf micrometeorology field and modeling experiments that testedwo plausible explanatory hypotheses. One explanatory hypothesisnvolved the collapse of the nocturnal boundary and the subsequentxtension of the flux footprint under stable thermal stratifica-ion. The alternative explanation revolved around the hypothesishat cattle congregated around the tower at night and emitted
ethane at rates that outpaced efflux densities provided by theandscape—this herd was capable of emitting, on average, about00 nmol m−2 s−1 of methane.
The box budget computations, combined with digital cameramages and field studies conducted upwind and downwind fromhe pasture, suggest that elevated methane fluxes and concentra-ions at night were due to the combined correlation between: (1)he collapse of the boundary layer; (2) the elongation of the fluxnd concentration footprints; and (3) the preferential sampling ofn elevated methane source, be it the cattle, wet proportions ofhe field or some combination. We cannot disprove that cattle didot congregate near the flux tower after sunset on a semi-regularasis, but there was a tendency for them to approach the towerear sunset. On the other hand, our experiments indicate that weere not seeing elevated methane fluxes emanating from the tidalarsh that was several kilometers upwind of the peatland pasture
ite.The findings reported here have important implications on
he applicability and interpretation of eddy flux measurementso study methane and carbon dioxide exchange in intensively-
anaged peatland pastures. Cattle are typically present in peatlandastures, world-wide, and their presence complicates the interpre-ation of nocturnal methane effluxes. Extra pre-caution is neededo interpret methane fluxes and annual budgets at these sites.onsequently, the finding reported here may have implicationsn future interpretation of carbon dioxide emission records fromntensively-grazed pastures (Gilmanov et al., 2007; Schulze et al.,009; Soussana et al., 2007). We, thereby, recommend that practi-ioners conduct additional flux measurements at sites upwind andown wind and collect and inspect web camera imagery to decidehen to accept and reject data.
The main drawback of our use of the web camera is that it
Please cite this article in press as: Baldocchi, D., et al., The challenges of meAgric. Forest Meteorol. (2011), doi:10.1016/j.agrformet.2011.04.013
nly obtained data during the day. For future studies in pas-ures and rangelands where the presence of cattle might pose
challenge for the interpretation of eddy covariance measure-ents, we recommend the use of a ‘game-cam’. This type of digital
PRESSt Meteorology xxx (2011) xxx–xxx 9
camera was specifically designed for rugged outdoor applications inremote locations. Recently, game-cams have been used for pheno-logical research given their repeat photography capabilities (Kurcand Benton, 2010). Game-cams are the simple digital camerasand their configuration requires only basic photographic under-standing. Most game-cams allow for motion detection-triggeredphotography in addition to repeat photography, but the real advan-tage of some game-cams is the use an infrared flash to take blackand white images at night. Considering that our object-orientedapproach ignored spectral image attributes, we believe that futurestudies could employ our approach to detect cow absence and pres-ence during the day and at night.
These CH4 concentration and flux measurements reported herehave implications on land management. The first issue relates tothe need to restore agricultural lands in the Delta to native vege-tation, to stymie continued subsidence and safeguard the integrityof the levee system and protect the fresh water conveyance systemupon which California relies (Mount and Twiss, 2005). Conversionof agricultural land back to native wetlands have the potentialto produce larger CH4 sources (Miller et al., 2008), compared tothe drained peatlands. Drained peatlands are shown to be smallmethane sources, but they are unsustainable in their present stateas they are losing carbon. The second issue relates to the role ofcows as strong methane emitters in grazed pastures. In this casethe cows may be a larger source of methane than the land on whichthey graze. So it is incumbent upon researchers to evaluate theirmethane losses, too, if one is concerned about the methane burdenupon the atmosphere. In our future work we intend to apply back-ward Lagrangian diffusion modeling (Flesch et al., 1995; Laubachet al., 2008; McGinn et al., 2009) to our extensive database andrefine our estimate of the amount of methane emitted by the cattle.The third issue relates to global warming. These wetlands formedas the glaciers melted, sea level rose and vegetation was entombedin an anaerobic environment (Malamud-Roam et al., 2006). Fur-ther sea-level rise with the melting of the Greenland ice sheet andAntarctica will form more temperate wetlands, which may have apositive feedback on the climate system by emitting more CH4 intothe atmosphere.
Acknowledgements
This work was funded by NSF-ATM grant number AGS-0628720and the California Department of Water Resources grant #006550.We thank Mr. Ted Hehn for his able assistance in conducting thefield measurements and servicing the instruments during the initialphase of the project. We thank Dr. Ed Dlugokencky and NOAA ESRLfor the weekly of CH4 concentration from Trinidad Head, CA. Wethank the California Department of Water Resources for permissionto place our study site on their land and the land managers whomaintained the rice study.
We thank Los Gatos Research for the loan of a mobile flux systemfor use during the spring of 2010.
Appendix A.
The diurnal and seasonal variation in the Cow Cam Index,detected with a digital camera. First, the JPEG files were convertedto ENVI Image Files for analysis with the Feature Extraction Modulein the ENVI/IDL image processing environment (ITT Visual Informa-tion Solutions). Next, we performed a principal component analysison each image, and the first principle component was segmentedinto image objects within a defined region-of-interest. Then, the
asuring methane fluxes and concentrations over a peatland pasture.
image objects were classified into “cow” and “non-cow” based onvarious spatial and texture attributes (Fig. A.1). Spectral attributeswere ignored to minimize potential misclassification due to diur-nal and seasonal effects of illumination changes (e.g., images taken

ARTICLE IN PRESSG Model
AGMET-4419; No. of Pages 11
10 D. Baldocchi et al. / Agricultural and Forest Meteorology xxx (2011) xxx–xxx
s (a)
avi“obeWc
R
A
B
B
B
B
C
C
C
C
D
D
D
D
D
D
D
Fig. A.1. Digital camera image with cow
t dusk with the camera facing the Sun may result in very darkegetation with spectral attributes similar to cows). For each result-ng binary (cow vs. non-cow) region-of-interest we calculated acow-fraction” (fcow) with values from 0 to 1. Finally, the presencer absence of cows for a given region-of-interest was determinedy median fcow (fcow-median) for images with a fcow > 0, with pres-nce = 1 for fcow > fcow-aveage and absence = 0 for fcow < fcow-median.ith this simple approach misclassifications were minimized and
ows present at greater distance (>50 m) were ignored.
eferences
ubinet, M., Grelle, A., Ibrom, A., Rannik, U., Moncrieff, J., Foken, T., Kowalski, A.,Martin, P., Berbigier, P., Bernhofer, C., Clement, R., Elbers, J., Granier, A., Grun-wald, T., Morgenstern, K., Pilegaard, K., Rebmann, C., Snijders, W., Valentini, R.,Vesala, T., 2000. Estimates of the annual net carbon and water exchange of Eur-operan forests: the EUROFLUX methodology. Advances in Ecological Research30, 113–175.
aer, D.S., Paul, J.B., Gupta, J.B., O’Keefe, A., 2002. Sensitive absorption mea-surements in the near-infrared region using off-axis integrated-cavity-outputspectroscopy. Applied Physics B-Lasers and Optics 75 (2–3), 261–265.
aldocchi, D.D., 2003. Assessing the eddy covariance technique for evaluating carbondioxide exchange rates of ecosystems:past, present and future. Global ChangeBiology 9, 479–492.
ridgham, S.D., Megonigal, J.P., Keller, J.K., Bliss, N.B., Trettin, C., 2006. The carbonbalance of North American wetlands. Wetlands 26 (4), 889–916.
rinson, M.M., Lugo, A.E., Brown, S., 1981. Primary productivity. decomposition andconsumer activity in fresh-water wetlands. Annual Review of Ecology and Sys-tematics 12, 123–161.
hanton, J.P., Martens, C.S., Kelley, C.A., 1989. Gas-transport from methane-saturated. Tidal fresh-water and wetland sediments. Limnology and Oceanog-raphy 34 (5), 807–819.
leugh, H.A., Grimmond, C.S.B., 2001. Modelling regional scale surface energyexchanges and cbl growth in a heterogeneous, urban-rural landscape. Boundary-Layer Meteorology 98 (1), 1–31.
onrad, R., 1996. Soil microorganisms as controllers of atmospheric trace gases (H2,CO, CH4, OCS, N2O, and NO). Microbiological Reviews 60 (4), 609–640.
rutzen, P., Lelieveld, J., 2001. Human impacts on atmospheric chemistory. AnnualReview of Earth and Planetary Sciences 29 (1), 17–45.
etto, M., Katul, G., Mancini, M., Montaldo, N., Albertson, J.D., 2008. Surface het-erogeneity and its signature in higher-order scalar similarity relationships.Agricultural and Forest Meteorology 148 (6–7), 902–916.
etto, M., Baldocchi, D., Katul, G.G., 2010. Scaling properties of biologically activescalar concentration fluctuations in the atmospheric surface layer over a man-aged peatland. Boundary-Layer Meteorology 136 (3), 407–430.
etto, M., Baldocchi, D., Anderson, F., Verfaillie, J., Xu, L., 2011. Comparing laser-based open- and closed-path gas analyzers to measure methane fluxes usingthe eddy covariance method. Agricultural and Forest Meteorology, submittedfor publication.
etto, M., Katul, G.G., 2007. Simplified expressions for adjusting higher-orderturbulent statistics obtained from open path gas analyzers. Boundary-LayerMeteorology 122 (1), 205–216.
lugokencky, E.J., Houweling, S., Bruhwiler, L., Masarie, K.A., Lang, P.M., Miller, J.B.,Tans, P.P., 2003. Atmospheric methane levels off: temporary pause or a newsteady-state? Geophysical Research Letters 30 (19), 1992.
lugokencky, E.J., Steele, L.P., Lang, P.M., Masarie, K.A., 1994. The growth-rate
Please cite this article in press as: Baldocchi, D., et al., The challenges of meAgric. Forest Meteorol. (2011), doi:10.1016/j.agrformet.2011.04.013
and distribution of atmospheric methane. Journal of Geophysical Research-Atmospheres 99 (D8), 17021–17043.
rexler, J.Z., de Fontaine, C.S., Deverel, S.J., 2009. The legacy of wetland drainageon the remaining peat in the Sacramento San Joaquin Delta, California, USA.Wetlands 29 (1), 372–386.
and with demarcation of the cows (b).
Flesch, T.K., Wilson, J.D., Yee, E., 1995. Backward-time lagrangian stochastic dis-persion models and their application to estimate gaseous emissions. Journal ofApplied Meteorology 34 (6), 1320–1332.
Gilmanov, T.G., Soussana, J.E., Aires, L., Allard, V., Ammann, C., Balzarolo, M., Barcza,Z., Bernhofer, C., Campbell, C.L., Cernusca, A., Cescatti, A., Clifton-Brown, J., Dirks,B.O.M., Dore, S., Eugster, W., Fuhrer, J., Gimeno, C., Gruenwald, T., Haszpra, L.,Hensen, A., Ibrom, A., Jacobs, A.F.G., Jones, M.B., Lanigan, G., Laurila, T., Lohila,A., Manca, G., Marcolla, B., Nagy, Z., Pilegaard, K., Pinter, K., Pio, C., Raschi, A.,Rogiers, N., Sanz, M.J., Stefani, P., Sutton, M., Tuba, Z., Valentini, R., Williams,M.L., Wohlfahrt, G., 2007. Partitioning European grassland net ecosystem CO2
exchange into gross primary productivity and ecosystem respiration using lightresponse function analysis. Agriculture Ecosystems & Environment 121 (1–2),93–120.
Hendriks, D.M.D., Dolman, A.J., van der Molen, M.K., van Huissteden, J., 2008. Acompact and stable eddy covariance set-up for methane measurements usingoff-axis integrated cavity output spectroscopy. Atmospheric Chemistry andPhysics 8 (2), 431–443.
Hendriks, D.M.D., van Huissteden, J., Dolman, A.J., van der Molen, M.K., 2007. Thefull greenhouse gas balance of an abandoned peat meadow. Biogeosciences 4,411–424.
Hirota, M., Senga, Y., Seike, Y., Nohara, S., Kunii, H., 2007. Fluxes of carbon dioxide,methane and nitrous oxide in two contrastive fringing zones of coastal lagoon,Lake Nakaumi, Japan. Chemosphere 68 (3), 597–603.
Holden, J., 2005. Peatland hydrology and carbon release: why small-scale processmatters. Philosophical transactions of the royal society a-mathematical physicaland engineering sciences 363 (1837), 2891–2913.
Hollinger, D.Y., Aber, J., Dail, B., Davidson, E.A., Goltz, S.M., Hughes, H., Leclerc, M.Y.,Lee, J.T., Richardson, A.D., Rodrigues, C., Scott, N.A., Achuatavarier, D., Walsh,J., 2004. Spatial and temporal variability in forest-atmosphere CO2 exchange.Global Change Biology 10 (10), 1689–1706.
Holzapfel-Pschorn, A., Seiler, W., 1986. Methane emission during a cultivation periodfrom an Italian rice paddy. Journal of Geophysical Research-Atmospheres 91(D11), 1803–1814.
Jackowicz-Korczynski, M., Christensen, T.R., Bäckstrand, K., Crill, P., Friborg,T., Mastepanov, M., Ström, L., 2010. Annual cycle of methane emissionfrom a subarctic peatland. Journal of Geophysical Research 115 (G2),G02009.
Khalil, M.A.K., Butenhoff, C.L., Rasmussen, R.A., 2007. Atmospheric methane: trendsand cycles of sources and sinks. Environmental Science & Technology 41 (7),2131–2137.
Knittel, K., Boetius, A., 2009. Anaerobic oxidation of methane: progress with anunknown process. Annual Review of Microbiology 63, 311–334.
Kurc, S.A., Benton, L.M., 2010. Digital image-derived greenness links deep soil mois-ture to carbon uptake in a creosotebush-dominated shrubland. Journal of AridEnvironments 74 (5), 585–594.
Laubach, J., Kelliher, F.M., 2005. Measuring methane emission rates of a dairy cowherd (II): results from a backward-Lagrangian stochastic model. Agricultural andForest Meteorology 129 (3–4), 137–150.
Laubach, J., Kelliher, F.M., Knight, T.W., Clark, H., Molano, G., Cavanagh, A., 2008.Methane emissions from beef cattle – a comparison of paddock-and animal-scale measurements. Australian Journal of Experimental Agriculture 48 (1–2),132–137.
Mahrt, L., 1999. Stratified atmospheric boundary layers. Boundary Layer Meteorol-ogy 90, 375–396.
Malamud-Roam, F.P., Lynn Ingram, B., Hughes, M., Florsheim, J.L., 2006. Holocenepaleoclimate records from a large California estuarine system and its water-shed region: linking watershed climate and bay conditions. Quaternary ScienceReviews 25 (13–14), 1570–1598.
Maljanen, M., Sigurdsson, B.D., Guomundsson, J., Oskarsson, H., Huttunen, J.T.,Martikainen, P.J., 2010. Greenhouse gas balances of managed peatlands in
asuring methane fluxes and concentrations over a peatland pasture.
the Nordic countries – present knowledge and gaps. Biogeosciences 7 (9),2711–2738.
McGinn, S.M., Beauchemin, K.A., Flesch, T.K., Coates, T., 2009. Performance of adispersion model to estimate methane loss from cattle in pens. Journal of Envi-ronmental Quality 38 (5), 1796–1802.

ING Model
A
d Fores
M
M
M
M
O
O
R
R
S
S
S
S
S
S
ARTICLEGMET-4419; No. of Pages 11
D. Baldocchi et al. / Agricultural an
cMillan, A.M.S., Goulden, M.L., Tyler, S.C., 2007. Stoichiometry of CH4 and CO2 fluxin a California rice paddy. Journal of Geophysical Research-Biogeosciences 112(G1), G01017.
iller, L.G., Kalin, R.M., McCauley, S.E., Hamilton, J.T.G., Harper, D.B., Millet, D.B.,Oremland, R.S., Goldstein, A.H., 2001. Large carbon isotope fractionation associ-ated with oxidation of methyl halides by methylotrophic bacteria. Proceedingsof the National Academy of Sciences of the United States of America 98 (10),5833–5837.
iller, R.L., Fram, M., Fujii, R., Wheeler, G., 2008. Subsidence reversal in a re-established wetland in the Sacramento-San Joaquin Delta, CA, USA. San FranciscoEstuary and Watershed Science 6, 1–20.
ount, J., Twiss, R., 2005. Subsidence, seal level rise and seismicity in theSacramento-San Joaquin Delta. San Francisco Estuary and Watershed Science3, 18.
’Keefe, A., Scherer, J.J., Paul, J.B., 1999. CW integrated cavity output spectroscopy.Chemical Physics Letters 307, 343–349.
remland, R.S., Culbertson, C.W., 1992. Importance of methane-oxidizing bacteriain the methane budget as revealed by the use of a specific inhibitor. Nature 356(6368), 421–423.
amanathan, V., Cicerone, R.J., Singh, H.B., Kiehl, J.T., 1985. Trace gas trends and theirpotential role in climate change. Journal of Geophysical Research-Atmospheres90 (ND3), 5547–5566.
inne, J., Riutta, T., Pihlatie, M., Aurela, M., Haapanala, S., Tuovinen, J.P., Tuittila,E.S., Vesala, T., 2007. Annual cycle of methane emission from a boreal fen mea-sured by the eddy covariance technique. Tellus Series B-Chemical and PhysicalMeteorology 59 (3), 449–457.
aarnio, S., Morero, M., Shurpali, N.J., Tuittila, E., Mäkilä, M., Alm, J., 2007. AnnualCO2 and CH4 fluxes of pristine boreal mires as a background for the lifecycleanalysis of peat energy. Boreal Environment Research 7, 101–113.
chimel, J., 2004. Playing scales in the methane cycle: From microbial ecology to theglobe. Proceedings of the National Academy of Sciences of the United States ofAmerica 101 (34), 12400–12401.
chmid, H.P., 2002. Footprint modeling for vegetation atmosphere exchange stud-ies: a review and perspective. Agricultural and Forest Meteorology 113 (1–4),159–183.
chulze, E.D., Luyssaert, S., Ciais, P., Freibauer, A., Janssens, I.A., Soussana, J.F., Smith,P., Grace, J., Levin, I., Thiruchittampalam, B., Heimann, M., Dolman, A.J., Valentini,R., Bousquet, P., Peylin, P., Peters, W., Rodenbeck, C., Etiope, G., Vuichard, N., Wat-tenbach, M., Nabuurs, G.J., Poussi, Z., Nieschulze, J., Gash, J.H., 2009. Importanceof methane and nitrous oxide for Europe’s terrestrial greenhouse-gas balance.
Please cite this article in press as: Baldocchi, D., et al., The challenges of meAgric. Forest Meteorol. (2011), doi:10.1016/j.agrformet.2011.04.013
Nature Geoscience 2 (12), 842–850.hurpali, N., Verma, S., 1998. Micrometeorological measurements of methan flux in
a Minnesota peatland during two growing seasons. Biogeochemistry 40, 1–15.onnentag, O., Detto, M., Vargas, R., Ryu, Y., Runkle, B.R.K., Kelly, M., Baldocchi,
D.D., 2011. Tracking the structural and functional development of a perennial
PRESSt Meteorology xxx (2011) xxx–xxx 11
pepperweed (Lepidium latifolium L.) infestation using a multi-year archive ofwebcam imagery and eddy covariance measurements. Agricultural and ForestMeteorology 151, 916–926.
Soussana, J.F., Allard, V., Pilegaard, K., Ambus, P., Amman, C., Campbell, C., Ceschia,E., Clifton-Brown, J., Czobel, S., Domingues, R., Flechard, C., Fuhrer, J., Hensen,A., Horvath, L., Jones, M., Kasper, G., Martin, C., Nagy, Z., Neftel, A., Raschi, A.,Baronti, S., Rees, R.M., Skiba, U., Stefani, P., Manca, G., Sutton, M., Tubaf, Z., Valen-tini, R., 2007. Full accounting of the greenhouse gas (CO2, N2O, CH4) budget ofnine European grassland sites. Agriculture Ecosystems & Environment 121 (1–2),121–134.
Steele, L.P., Dlugokencky, E.J., Lang, P.M., Tans, P.P., Martin, R.C., Masarie, K.A., 1992.Slowing down of the global accumulation of atmospheric methane during the1980s. Nature 358 (6384), 313–316.
Syvitski, J.P.M., Kettner, A.J., Overeem, I., Hutton, E.W.H., Hannon, M.T., Brakenridge,G.R., Day, J., Vorosmarty, C., Saito, Y., Giosan, L., Nicholls, R.J., 2009. Sinking deltasdue to human activities 2 (10), 681–686.
Teh, Y. et al., 2010. Large greenhouse gas emissions from agricultural and restoredpeatlands driven by management. Ecosystems, submitted for publication.
Teh, Y., Silver, W., Sonnentag, O., Detto, M., Kelly, M., Baldocchi, D., 2011. Largegreenhouse gas emissions from a temperate peatland pasture. Ecosystems 14,311–325.
van Haarlem, R.P., Desjardins, R.L., Gao, Z., Flesch, T.K., Li, X., 2008. Methane andammonia emissions from a beef feedlot in western Canada for a twelve-dayperiod in the fall. Canadian Journal of Animal Science 88 (4), 641–649.
Verma, S.B., Ullman, F.G., Billesbach, D., Clement, R.J., Kim, J., Verry, E.S.,1992. Eddy-correlation measurements of methane flux in a north-ern peatland ecosystem. Boundary-Layer Meteorology 58 (3), 289–304.
Vesala, T., Kljun, N., Rannik, U., Rinne, J., Sogachev, A., Markkanen, T., Sabelfeld, K.,Foken, T., Leclerc, M.Y., 2008. Flux and concentration footprint modelling: stateof the art. Environmental Pollution 152 (3), 653–666.
von Fischer, J.C., Hedin, L.O., 2007. Controls on soil methane fluxes: tests of biophys-ical mechanisms using stable isotope tracers. Global Biogeochemical Cycles 21,GB2007.
Wang, D., Chen, Z., Xu, S., 2009. Methane emission from Yangtze estuarine wetland,China. Journal of Geophysical Research 114 (G2), G02011.
Whalen, S.C., 2005. Biogeochemistry of methane exchange between natural wet-lands and the atmosphere. Environmental Engineering Science 22 (1), 73–94.
Whiting, G.J., Chanton, J.P., 1993. Primary production control of methane emission
asuring methane fluxes and concentrations over a peatland pasture.
from wetlands. Nature 364, 793–794.Zhao, C.F., Andrews, A.E., Bianco, L., Eluszkiewicz, J., Hirsch, A., MacDonald, C.,
Nehrkorn, T., Fischer, M.L., 2009. Atmospheric Inverse Estimates of MethaneEmissions from Central California. Journal of Geophysical Research, Atmo-spheres 114, doi:10.1029/2008JD011671.