go for the gold medal in your chemical engineering career for the gold.pdf · go for the gold medal...
TRANSCRIPT

Go For the Gold Medal in your
Chemical Engineering Career Todd J. Willman, PE, MBA
Director of Engineering - EPI Engineering Director of Development - EPCON International

Chemical Engineering Disciplines
Thermo- Physical
Properties
2
Mass Transfer
1
Reaction Kinetics
6
Process
Safety
Environ-mental
3
Heat Transfer
4
Fluid
Flow
5
Process Control
Process Economics
Foundational Discipline
Core Engineering Disciplines
Global Objectives

How to Obtain the Gold Medal
• Choose your Event – What is your passion in Chemical Engineering?
– Work on this passion even if it’s on your own time
– Choose mentors who have experience in your passion
• Practice Hard – Focus on the fundamentals
– Choose your mentors
• Have a Vision! – Develop short and long term visions
– Don’t listen to the wrong voices (ear plugs sometimes required)
• Go for the Gold! – Usually at least 4 years of hard work
– Sometimes it will take several Olympics to realize Gold
– Stay with it – you are in the race until you step off the track

Practical Application of Fluid Flow
• Process Systems – Increased Throughput
• Energy Systems – Reduced Fuel, Electrical, Chemical
and Water Costs + Increased Throughput – Steam Networks, Letdown Valves/Turbines
– Condensate and BFW Systems
• Water Systems – Reduced Electrical, Chemical and
Water Costs + Increased Throughput – Cooling Water Distribution Systems
– Process Water Distribution Systems
• Safety Systems – Personnel and Asset Protection – Fire Water Distribution Systems
– Flare Header Gathering Systems
– Pressure Relief Valves

In 1984, EPCON Software developed the first ever suite of engineering software applications and have overtime molded its software into industry leading solutions.
• Over the past 28 years, EPCON Software has accumulated multiple patents that protect its award-winning technology
• EPCON’s flagship product Engineer’s Aide SiNET is the most widely used pipe flow analysis software in the world
• EPCON Software is also technology partners with the American Petroleum Institute and the Gas Processors Association
• Over the past decade many EPCON Software clients such as Dow Chemical, 3M,
Eastman Chemical, Shell Chemicals LP, ConocoPhillips, Chevron, BP, Citgo, Texas Petrochemicals and Lyondell have requested that our team of experts model, simulate, analyze, and optimize their respective utility systems using our software technology.
• Due to high demand of our service, EPCON Software created EPI Engineering in 2002 and expanded into specialized services specifically for utility systems
Background of EPCON & EPI

Energy Steam Systems
Condensate
Fuel Systems
Water Cooling Water
Boiler Feedwater
Clarified Water
Safety Flare Headers
Firewater
Safety Showers
EPI Engineering Study Types
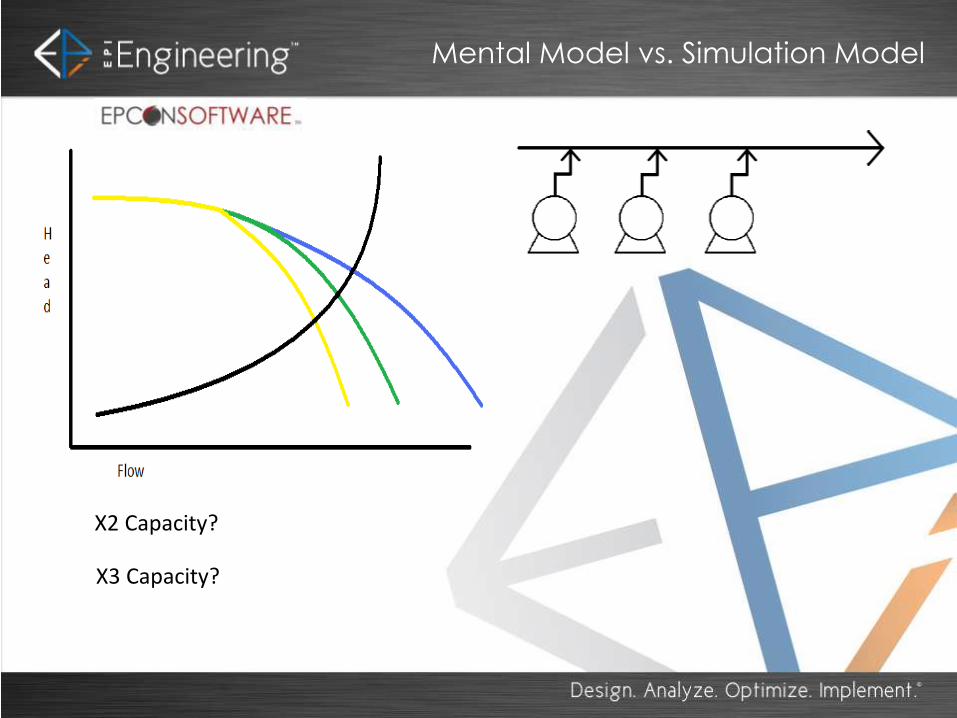
Mental Model vs. Simulation Model
X2 Capacity?
X3 Capacity?

Steam/Condensate System Analysis
Petrochemical Plant Case Study: 3 steam and 2 condensate systems modeled $ 6MM/yr in steam/condensate leak savings identified

Cooling Water System Analysis
Petrochemical Plant Case Study: 3 large cooling water systems modeled at one facility $ 1MM/yr in water and electrical savings identified $10MM one time savings from capital cost avoidance

𝑃1 +
𝜌𝑣12
2𝑔𝑐144+𝜌𝑍1144= 𝑃2 +
𝜌𝑣22
2𝑔𝑐144+𝜌𝑍2144− 𝐹
1,2
+𝑊
The Extended Bernoulli Equation
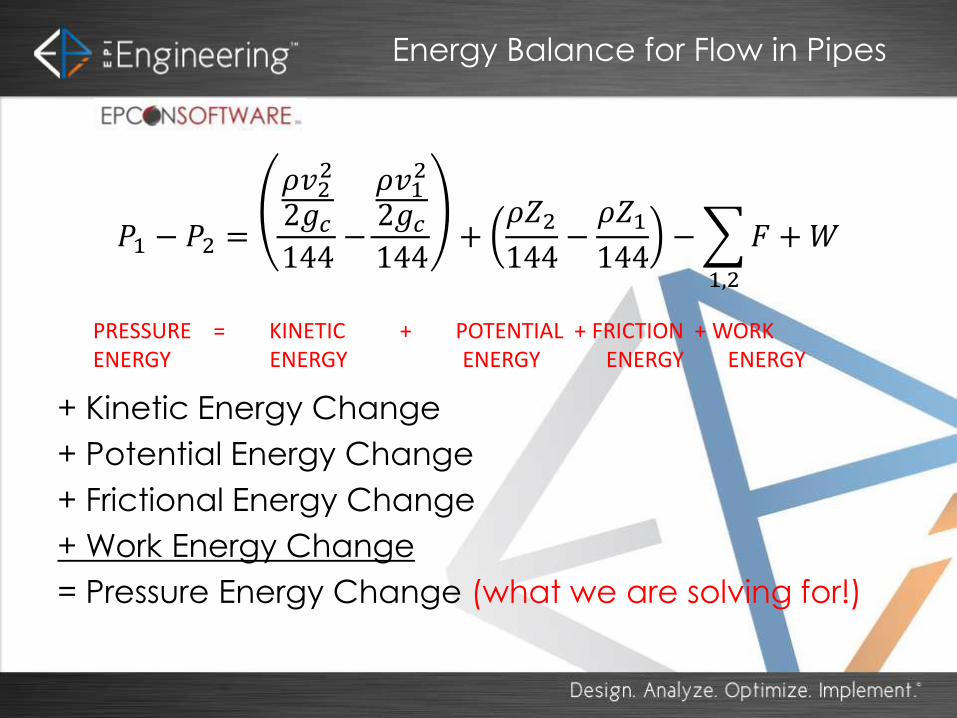
Energy Balance for Flow in Pipes
+ Kinetic Energy Change
+ Potential Energy Change
+ Frictional Energy Change
+ Work Energy Change
= Pressure Energy Change (what we are solving for!)
PRESSURE = KINETIC + POTENTIAL + FRICTION + WORK ENERGY ENERGY ENERGY ENERGY ENERGY
𝑃1 − 𝑃2 =
𝜌𝑣22
2𝑔𝑐144−
𝜌𝑣12
2𝑔𝑐144+𝜌𝑍2144−𝜌𝑍1144− 𝐹
1,2
+𝑊

Frictional Energy Loss
To calculate pressure drop from pipe friction and minor losses
F=Frictional Energy Loss in Pipes (lbf/in2)
f= Moody or Darcy Friction Factor (dimensionless)
L= Pipe Length (ft)
D= Pipe Diameter (ft)
K= K Value for Flow Resistance (dimensionless)
v= Average Velocity (ft/sec)
gc= Acceleration of Gravity (32 ft/sec2)
C

Turbulent vs. Laminar Flow

Moody Friction Factor

K- Values for Fittings and Hand Valves

16
TPC Group Case Study
• TPC Group Houston Operations was evaluating the potential expansion of several existing production units as well as building new production units.
• The need was identified to assess the capacity of existing utility systems including steam, condensate, compressed air, nitrogen, natural gas, fuel gas, cooling water, and firewater systems.
• Detailed simulation models of each utility system were developed and tuned to match existing plant data in order to identify available capacity of each system and understand current limitations.

17
Benefits of this Study
• The analysis also provided significant insight into energy
savings opportunities throughout the current plant
operations.
• All plant utility systems were modeled and evaluated
which have not been looked at in detail since their original
design
• The end result of the studies provided identified cost
reduction opportunities of >$5MM, of which some have
already been implemented.
• This presentation will discuss specific examples of the
analysis and show corresponding results in both the steam
and water systems.

18
Steam System Savings
• 750# Steam Leaks (estimated) – 10,000 lb/hr
• 150# Steam Leaks (quantified) – 69,930 lb/hr
• 15# Steam Leaks (quantified) – 44,668 lb/hr
• Total Steam Leaks - $124,598 lb/hr
• Estimated total cost of steam leaks - $6,300,000/yr
• Estimated savings with 80% reduction - $5,000,000/yr

19
Cooling Water System Energy Savings
Type Basis $ Amount Type
Cooling Water
Pump HP 2500 HP $483,000 Annual
Fire Water Pump HP 200 HP $38,000 Annual
Total Savings $521,000 Annual

20
Cooling Water System Water Savings
Type Basis $ Amount Type
CIWA Raw Water 800
gal/min $227,000 Annual
Clarified/Filtered
Water
600
gal/min ($62,000) Annual
Total Savings $165,000 Annual

21
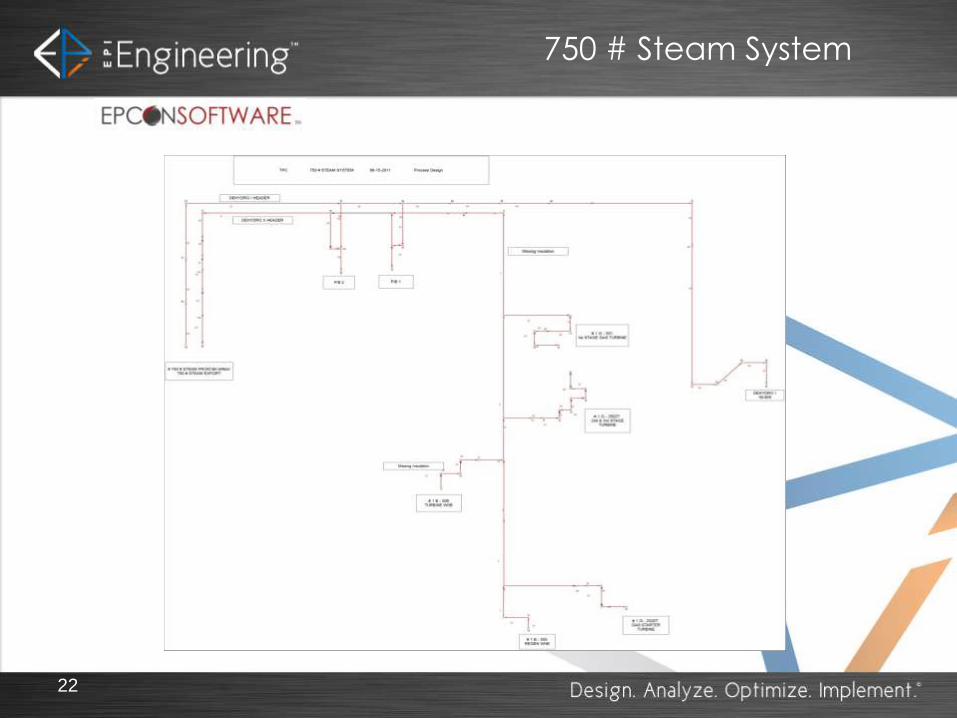
Steam System Modeling
• Detailed walk-down of system piping required to build
simulation models.
• All flowmeters and users identified and quantified using
data historian.
• Detailed steam balance accomplished for one point in
time on the data historian under typical operations.
• Additional flows required to validate the model to match
field data represent steam leaks.
• Detailed flow simulation models built and validated to
plant data by EPI Engineering using EPCON’s industry
leading Flow Simulation Software, Engineer’s Aide SiNET.
22
750 # Steam System
23
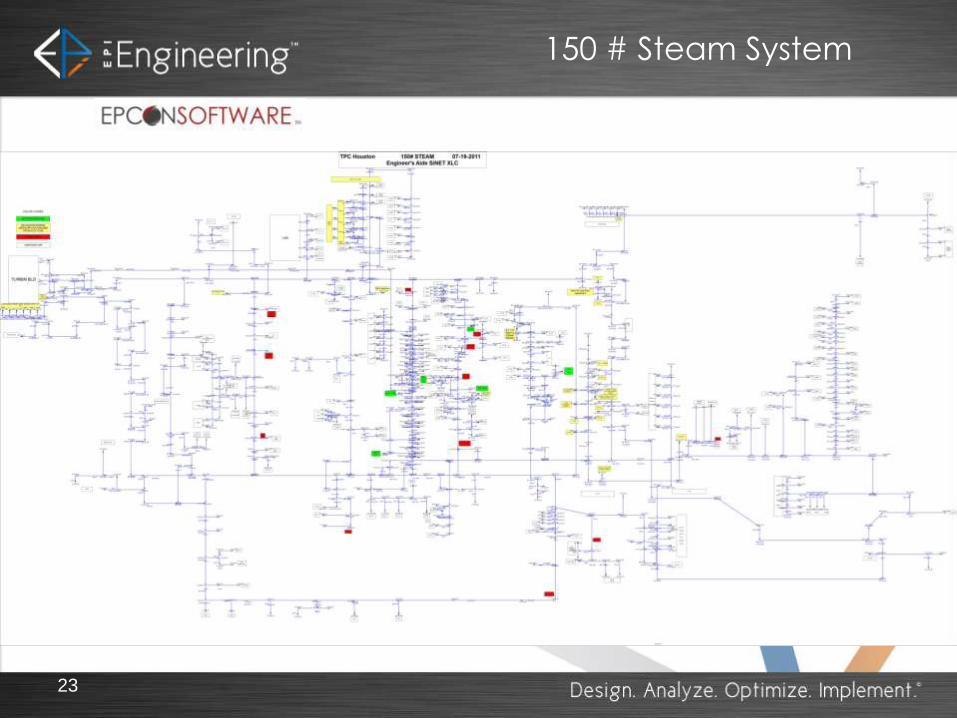
150 # Steam System

24
15# Steam System
25
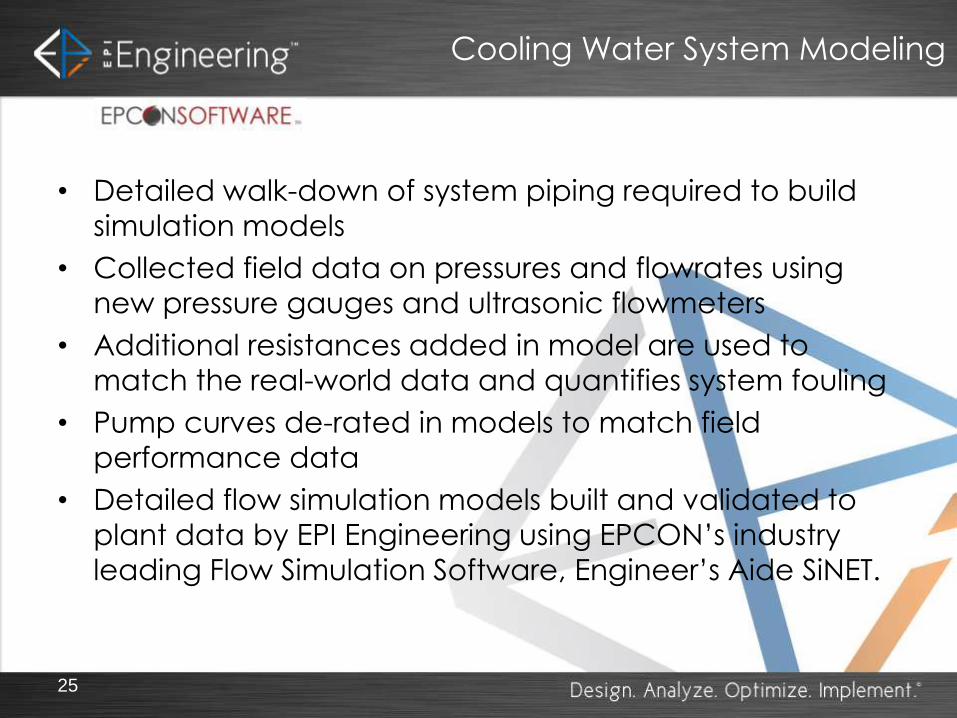
Cooling Water System Modeling
• Detailed walk-down of system piping required to build
simulation models
• Collected field data on pressures and flowrates using
new pressure gauges and ultrasonic flowmeters
• Additional resistances added in model are used to
match the real-world data and quantifies system fouling
• Pump curves de-rated in models to match field
performance data
• Detailed flow simulation models built and validated to
plant data by EPI Engineering using EPCON’s industry
leading Flow Simulation Software, Engineer’s Aide SiNET.

26
CT-10-17-18 Cooling Water Systems

27
CT-3-7-14 Cooling Water Systems

28
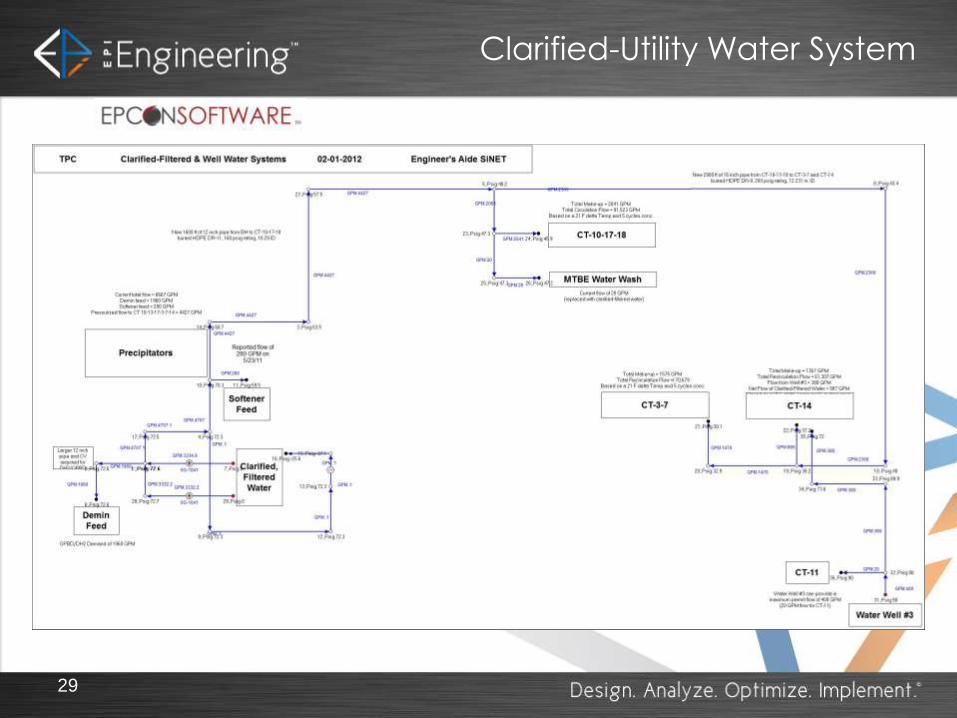
Clarified-Utility Water System
• A new clarified-utility water system was proposed to achieve the water savings and provide improved water quality for cooling water make-up
• Piping was routed to follow an existing underground HDPE firewater pipe now being installed around the facility
• Existing, clarified-utility water pumps were utilized to minimize capital costs
• Will allow for lowering flowrates to exchangers with the majority receiving 50-100% above their design flow to alleviate fouling from CIWA water used as cooling water make-up and avoid the major capital expense of a new cooling tower
29
Clarified-Utility Water System
30
Flow Simulation Benefits
• Quantified steam/condensate leaks ($5MM+) for justification of repair
• Identified cooling water pump energy savings and capital cost avoidance savings to quickly justify and pay for the study
• Identified water savings to justify converting cooling water make-up from CIWA to clarified water
• Reduced exchanger fouling and improved process performance from use of clarified water as cooling tower make-up.
• Reduction in planned capital costs ($500,000 in earlier study and recently $10MM in avoidance of a new cooling tower)

Total Facility Energy Study High Pressure Steam System
Model ties into the plant
data management system to
allow running any snapshot
of time to dynamically
analyze system performance

Total Facility Energy Study Low Pressure Steam System
One section of piping was
identified as too small to
allow excess 25# steam to
go from the supplier to the
user side of the system. This
resulted in blowing off of 25#
steam on the supplier side of
the system requiring letting
down of 250# steam to 25#
steam on the user side of the
system.

Total Facility Energy Study Compressed Air System

P Energy Units mmbtu/h Turb Turb Turb Turb Turb Total Total
Generation Steam Network Matrix LD LD LD LD LD LD C Heat Work Total Total Consumption
Boiler Process Import Pres 750 150 65 50 15 5 vent Consump Use Use Use Prod delta
1,341.9 750 1,341.9 1,114.3 0.0 0.0 0.0 0.0 57.9 1,241.0 101.0 1,342.0 1,341.9 -0.1
work 101.0 0.0 0.0 0.0 0.0 mmbtu/h 101.0
LD LD 45.9 0.0 0.0 0.0 0.0 22.9 HP 39,698.3
150 0.0 5.8 0.0 183.9 68.5 532.2 1,142.3 12.5 1,154.8 1,160.1 5.3
work 0.0 0.0 7.8 4.7 mmbtu/h 12.5
LD LD 70.7 94.5 137.2 0.0 49.6 HP 4,932.2
65 0.0 0.0 0.0 0.0 29.5 66.7 0.0 66.7 76.4 9.7
work 0.0 0.0 0.0 mmbtu/h 0.0
LD LD 0.0 37.2 0.0 HP 0.0
50 0.0 0.0 0.0 89.0 108.7 0.0 108.7 94.5 -14.2
work 0.0 0.0 mmbtu/h 0.0
LD LD 19.8 0.0 0 HP 0.0
15 0.0 0.0 347.5 397.8 0.0 397.8 378.1 -19.7
work 0.0 mmbtu/h 0.0
LD LD 0 50.2 0 HP 0.0
5 69.5 69.5 69.5 68.5 -1.0
LD LD
Total mmbtu/h 1,341.9 1,160.1 76.4 94.5 378.1 68.5 122.7 1,125.6 2,956.5 113.6 3,070.0 3,119.6 -20.0
H btu/lb 1,347.5 1,239.5 1,238.3 1,226.1 1,200.3 1,159.3 Total Workmmbtu/h 113.6
psia 764.7 164.7 79.7 64.7 29.7 19.7 HP 44,630.5
temp F 711.0 438.9 414.6 386.2 322.2 233.9 Consump Heat Work Vent Total Cons Generation
Gross 1,125.6 113.6 122.7 1,361.9 1,341.9 -20.0
Total Facility Energy Study Steam & Energy Balance

Total Stm Tot mmbtuh Temp Pres
996 mpph 1,346 mm 711.0 F 750 psig
N0 11 No 11 Stm
92.5% 332 mpph LD
84.4% 449 mm 34 mpph
31 mm 46 mm Stm Turb In
41 mm 902 mpph Consum Vent
149 mm 1,215 mm Consumers Vent/Loss
238 mm Gen In 43 mpph 17 mpph
work 30 mw 58 mm 23 mm
Q eff
mmbtuh 95%
65.92 197.76 Gen Out Motors Export
5 mpph LD Turb Out 28 mw Work 23 mw 5 mw
No 11 Total 902 mpph
10.29 30.7 644 F Heat 1,114 mm 423 F Flow Q Temp SuperHt Pres
1,083.2 1,083.2 150 work 101 mm 936 mpph 1,160 mm 439 F 65 F 150 psig
418.0 1,248.6
LD 65 LD 50 LD 15 Turb 65 Turb 15 Turb 5
57 mpph 77 mpph 115 mpph 4.7 mpph 155 mpph 59 mpph
71 mm 94 mm 137 mm 5.80 mm 191.7 mm 73 mm
Consum Vent
416 F 386 F 402 F Out 65 327 F Out 15 Out 5 399 F Consumers Vent/Loss
4.7 mpph 155 mpph 59 mpph 425 mpph 40 mpph
heat 5.76 mm heat 183.9 mm 68.5 mm 532 mm 50 mm
work 0.05 mm work 7.8 mm 4.7 mm
Flow Q Temp SuperHt Pres
65 62 mpph 76 mm 415 F 104 F 65 psig
Boiler 11GenST
Total Facility Energy Study Steam & Energy Balance

Total Facility Water Study Boiler Feed Water System

Total Facility Water Study Condensate System

Total Facility Safety Study Flare System
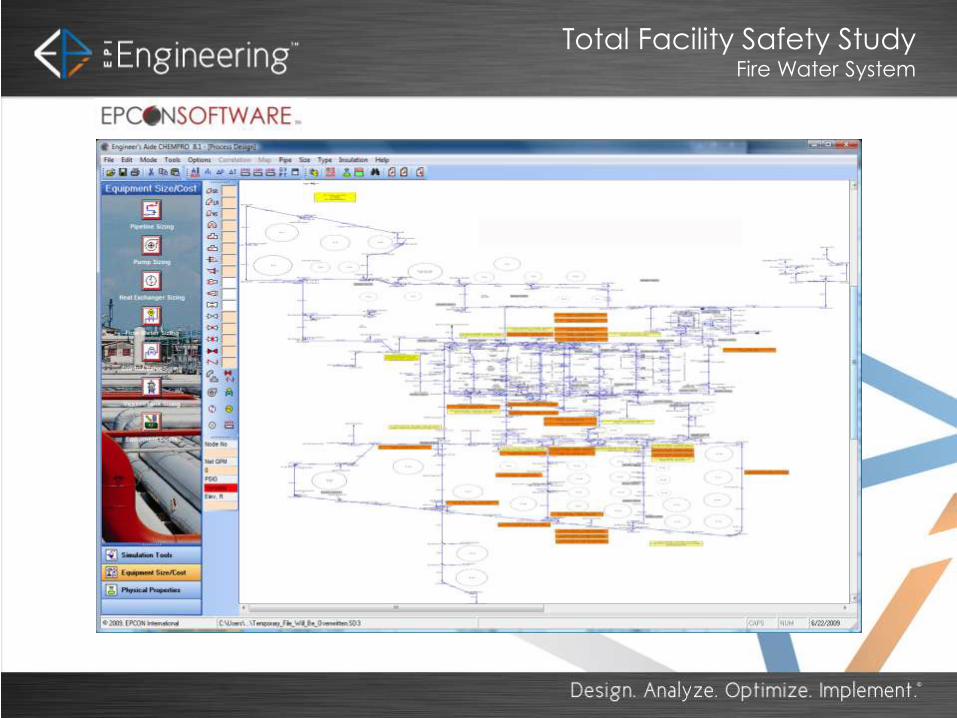
Total Facility Safety Study Fire Water System
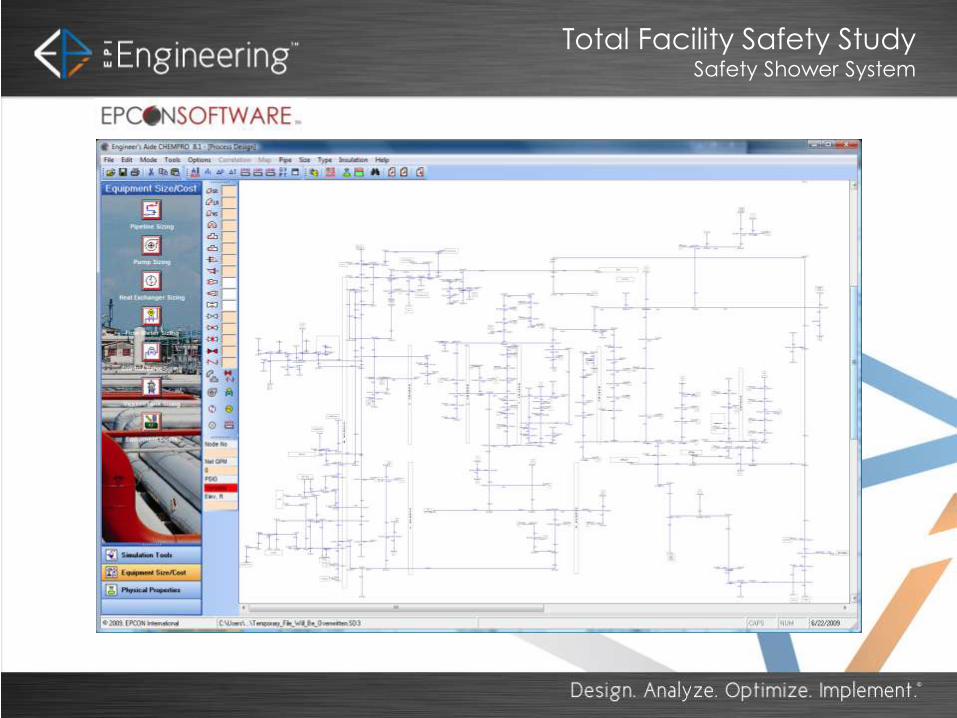
Total Facility Safety Study Safety Shower System