goal-directed pedestrian prediction - cv-foundation.org · goal-directed pedestrian prediction eike...
TRANSCRIPT

Goal-Directed Pedestrian Prediction
Eike Rehder
Institute for Measurement and Control Systems
Karlsruhe, Germany
Horst Kloeden
BMW Forschung und Technik GmbH
Munich, Germany
Abstract
Recent advances in road safety have lead to a constant
decline of injured traffic participants in Europe per year.
Still, the number of injured pedestrians remains nearly con-
stant. As a countermeasure, active pedestrian safety is the
focus of current research, for which accurate pedestrian
prediction is a prerequisite. In this scope, we propose a
method for dynamics- and environment-based pedestrian
prediction. We introduce the pedestrian’s destination as a
latent variable and thus convert the prediction problem into
a planning problem. The planning is executed based on the
current dynamics of the pedestrian. The distribution over
the destinations is modeled using a Particle Filter. Experi-
mental results show a significant improvement over existing
approaches such as Kalman Filters.
1. Introduction
Recent advances in pedestrian detection provide a solid
foundation for active pedestrian safety in automated vehi-
cles. Still, for implementation of such systems the missing
component is accurate pedestrian prediction.
In the past, pedestrian prediction has only been studied
in limited scope. Most works focus on dynamical models to
predict pedestrian motion [8, 7, 10] . However, pedestrians
have the ability to switch their state of motion within an
instance, making dynamical models unreliable for longer
prediction horizons.
Moreover, purely dynamical models disregard the fact
that pedestrian motion is mostly driven by some intention
or goal. In the context of traffic, usually this is to reach a
certain destination within a given time frame. Few studies
have addressed this particular problem of intention-driven
prediction [18, 9, 2, 3]. These previous works, however,
deal with prediction in static environments and thus prede-
fine possible goals.
Apart from the intention, the surrounding poses a sec-
ond major influence on pedestrian motion. This is apparent
for the case where an obstacle blocks a pedestrian’s path.
While some authors model spatial influence on pedestrian
motion, they all execute their prediction in static environ-
ments [18, 4] or at least for a static observer [9]. This sig-
nificantly simplifies the task, as motion patterns in a specific
scene can be observed and re-identified. For a moving ob-
server however, this is no option as the scenes will only be
observed at the time of prediction.
In this work we estimate a probability distribution over
the future positions of a pedestrian by means of path plan-
ning techniques. A pedestrian is represented by his state
vector Xt which consists of the position (xt, yt) and orien-
tation ψt at time instance t, Xt = (xt, yt, ψt)⊤. Addition-
ally, a map with information on the environment is available
in form of an occupancy grid Θt that is recorded on-line.
To represent the pedestrian’s intention, we introduce
short term destinations XT as latent variables. This enables
us to use planning-based prediction, so that we can estimate
the distribution p(XT |Xt, XT ,Θt) from probabilistic plan-
ning.
At later time instances, we make use of the initial pre-
diction to refine our estimate over the destinations. This
is achieved by comparison between predicted and observed
behavior of the pedestrian.
The main contributions of this work are
• the introduction of destinations as latent variables that
are estimated on-line,
• the use of an entirely probabilistic planning-based pre-
diction of arbitrary path distributions under considera-
tion of dynamics
• the use of location features that are observed from the
environment on-line.
In the following, we will go through the approach step by
step. In Section 2, we give a brief overview over the related
work. In Section 3 we introduce the planning based predic-
tion framework. Results of the presented method are evalu-
ated in Section 4 and we conclude the paper in Section 5.
50
2. Related Work
Pedestrian prediction has received some attention in re-
search, especially in the context of intelligent transportation
systems. In this section, we give a brief overview over state
of the art prediction methods.
In general, the problem can be separated into two classes,
short term prediction with focus on motion within the next
second and long term prediction up to tens of seconds.
For short term prediction, Baysian Filters are widely
used, in particular the Kalman Filter (KF) [15] and the Par-
ticle Filter (PF) [1]. An extension to the standard KF pre-
diction is the use of interacting multiple models [10, 12].
Also Gaussian Process Dynamical Models have been ap-
plied with various input features such as scene flow, motion
histograms [7] or even body pose [13]. The body pose has
also been used for prediction together with decision trees
[16]. A special case of short term prediction is the change
of a particular variable such as walking versus standing [17]
or entering the lane [11]. However, all of these approaches
only focus on the dynamical model of the pedestrian and do
not take the environment into account. Since a pedestrian
can change his dynamics rapidly, these models are only suit-
able for short term prediction.
In long term prediction, information from previously ob-
served trajectories is used. Ziebart et al. use observed tra-
jectories within a room to infer a goal-directed planning
policy for human motion as well as goal prior distributions
[18]. Kitani et al. extend this approach with various envi-
ronment features [9]. Chen et al. predict long term trajecto-
ries from trajectory clustering and matching [2, 3]. In [8],
longest common subsequences are used to match observed
trajectories to trajectories from a database for prediction.
Chung et al. use observed trajectories to learn specific spa-
cial effects that influence human motion in a known envi-
ronment [4].
3. Goal-Directed Pedestrian Prediction
In this work we focus on the task of long term pedes-
trian prediction as the estimation of a probability distribu-
tion. Specifically, we are interested in the distribution over
the pedestrian’s future states p(XT |Xt,Θt) given past ob-
servations Xt and a map Θt. We introduce the pedestrian’s
destinationXT he wishes to reach at time T as a latent vari-
able to improve prediction. The distribution over the desti-
nations is estimated online.
3.1. Distribution Approximation
The distribution over the pedestrian’s state
p(XT |Xt,Θt) is approximated using a grid represen-
tation. For this, we discretize the space in pedestrian
position (xt, yt) and pedestrian orientation ψt.
The grid representation allows for a parameter-free ap-
proximation of arbitrary distributions. This especially ac-
counts for multi-modal path distributions which are much
harder to approximate in parameterized models.
For state transitions we make the Markov assumption so
that p(Xt+1|Xt) = p(Xt+1|Xt). For the sake of legibility,
we abbreviate p(Xt|Xt−1) with Φt. Let t = 0 be the time
instance at which the prediction is executed, from tracking
we assume to have an estimate of the current position dis-
tribution p(X0).
3.2. Dynamicsbased Prediction
Given the representation as explained in 3.1, we are in-
terested in the transition from the distribution of the pedes-
trian’s state at a previous time instance t − 1 to the distri-
bution at a later time instance t. This transition represents
the probability distribution of the pedestrian’s motion, rep-
resented by
Xt = Xt−1 + u(vt, ψt), (1)
where u(vt, ψt) is the vector of motion computed from the
pedestrian’s speed vt and orientation ψt. In this work, we
use the unicycle model for pedestrian’s motion, i.e.
u(vt, ψt) = (∆tvt cosψt,∆tvt sinψt, 0)⊤, (2)
where ∆t denotes the discrete time interval for which the
prediction should be applied.
Since both the pedestrians state and motion are subject to
uncertainty, the distribution p(Xt|Xt−1) is computed from
the convolution of the two input distributions
p(Xt|Xt−1) = p(Xt−1)⊗ p(u(vt, ψt)). (3)
For this work, we model velocity vt and orientation ψtas independent variables. We assume the velocity to be nor-
mally distributed with given mean and variance. The ori-
entation is von-Mises-distributed with given mean and con-
centration parameter κ∆ψ . Also, we model motion that is
not aligned with the pedestrian’s orientation as von-Mises-
distributed with zero mean and concentration parameter κv
p(∆x,∆y,∆ψ) ∝ exp(− (∆x−∆tv cos(ψ))2
2σv2 )
· exp(− (∆y−∆tv sin(ψ))2
2σv2 )
· exp(κ∆ψ cos(∆ψ))
· exp(κv cos(∠(∆y,∆x)− ψ)), (4)
where (δx, δy, δψ) denote the increment of (x, y, ψ) in one
time step.
From discretization of (4) to the grid, we obtain a con-
volution filter mask A. Given the previous distribution grid
Φt−1, we can approximate (3) by
Φt ∝ A⊗ Φt−1. (5)
51

Φt−1
⊗
A
=
Φt
Figure 1: Convolution of an initial distribution with a dis-
tribution of motion together and resulting distribution.
The grid Φt can be seen as the distribution over the
pedestrian’s state that he will have reached after t time steps.
Due to the relatively small number of non-zero entries in Φtand A, the convolution can be computed efficiently using a
sparse convolution. For continuous prediction, the convolu-
tion (5) can be applied iteratively.
An example for such a convolution is shown in Figure 1.
In the first step, the pedestrian’s position is normally dis-
tributed around the center of the grid while he is assumed
to be oriented to the right. Using the motion model from
(4) as a filter mask (center), we obtain the right distribution
for the following time instance. As it can be seen from the
image, the mode of the distribution has shifted to the right
while the overall shape is now kidney-like.
3.3. GoalDirected Prediction
Human actions are usually driven by specific goals. In
the case of pedestrian motion this goal is to reach a cer-
tain destination within a certain time. We therefore intro-
duce the latent variable of the destination at time instance
T , which is now our goalXT for the planning-based predic-
tion. For now, we assume the distribution over XT , p(XT ),to be known. We discretize this distribution to obtain the
grid ΦT .
The grid ΦT is used as an initial distribution for a back-
ward prediction step. For this, we invert the distribution (4)
to get the inverse filter mask A−1. We now apply the same
scheme as in (5) in backward direction
Φt−1 ∝ A−1 ⊗ Φt. (6)
The result of an iterative application of (6) represents the
distribution over the pedestrian’s state at time instance t so
that he will reach the state XT at time instance T .
In a next step we assume starting state X0 and goal state
XT to be independent. Under this assumption, a pedes-
trian’s path from X0 towards XT can be computed as the
multiplication of (5) and (6).
Let Φ+t be the distribution over Xt at time instance t,
obtained from forward planning (5) and Φ−
t accordingly
the distribution from the backward prediction (6). We now
compute the distribution of the pedestrian’s state given his
start and goal state with
p(Xt|X0, XT ) ∝ Φ+t Φ
−
t . (7)
This result is crucial as this means that we can apply the for-
ward facing prediction and backward facing prediction iter-
atively and by multiplication of the results obtain the tran-
sition distribution of all intermediate time instances. For
uncertain arrival times T , multiple predictions can be ob-
tained from a shift of the backward facing predictions in
time dimension. Thus, marginalization over the arrival time
is easily implemented.
3.4. Location Prior
Apart from the dynamics and the destination of a pedes-
trian, the environment also plays an important role in pedes-
trian motion. One example is an obstacles blocking the di-
rect path towards the destination. Furthermore, a pedestrian
will behave differently when walking on the road compared
to walking on the sidewalk.
For this reason effects of the environment should also be
modeled in the prediction. Given information on the sur-
rounding in form of a map Θt, a location prior p(Xt|Θt) is
introduced that represents the probability that a pedestrian
will enter a certain state given the location of that state. In
our prediction framework, this is modeled as
Φ+t ∝ p(Xt|Θt)
(
A⊗ Φ+t−1
)
and (8)
Φ−
t−1 ∝ p(Xt|Θt)(
A−1 ⊗ Φ−
t
)
. (9)
In context of the discrete grid, the probability distribution
p(Xt|Θt) can be understood as the probability that a pedes-
trian will enter a certain cell in the grid given its location
features, e.g. a pedestrian will less likely enter a cell if it is
occupied by another object.
Figure 2 shows the effects of such a prior on the predic-
tion. In this simulative example, four non-traversable ob-
jects were introduced (Fig. 2a). If the pedestrian tries to
walk from the upper left area towards the lower right, his
path will have to avoid the obstacles (Fig. 2b). The dis-
tribution over the pedestrians location at one time instance
in between the start and end time is depicted in Fig. 2c to
visualize the multi-modal outcome of the prediction.
In real situations however, the prior distribution may not
be binary only. Instead, multiple cues such as objects, road,
sidewalk, etc. may influence a pedestrian’s behavior. Thus,
we estimate the prior p(Xt|Θt) as a grid according to the
discretization of Φt. The estimate is applied cell-wise, i.e.
we assume the probabilities of all cells to be independent.
For computation, we utilize a grid Θt, containing a mul-
titude of features. Let θi be a vector of location features of
52
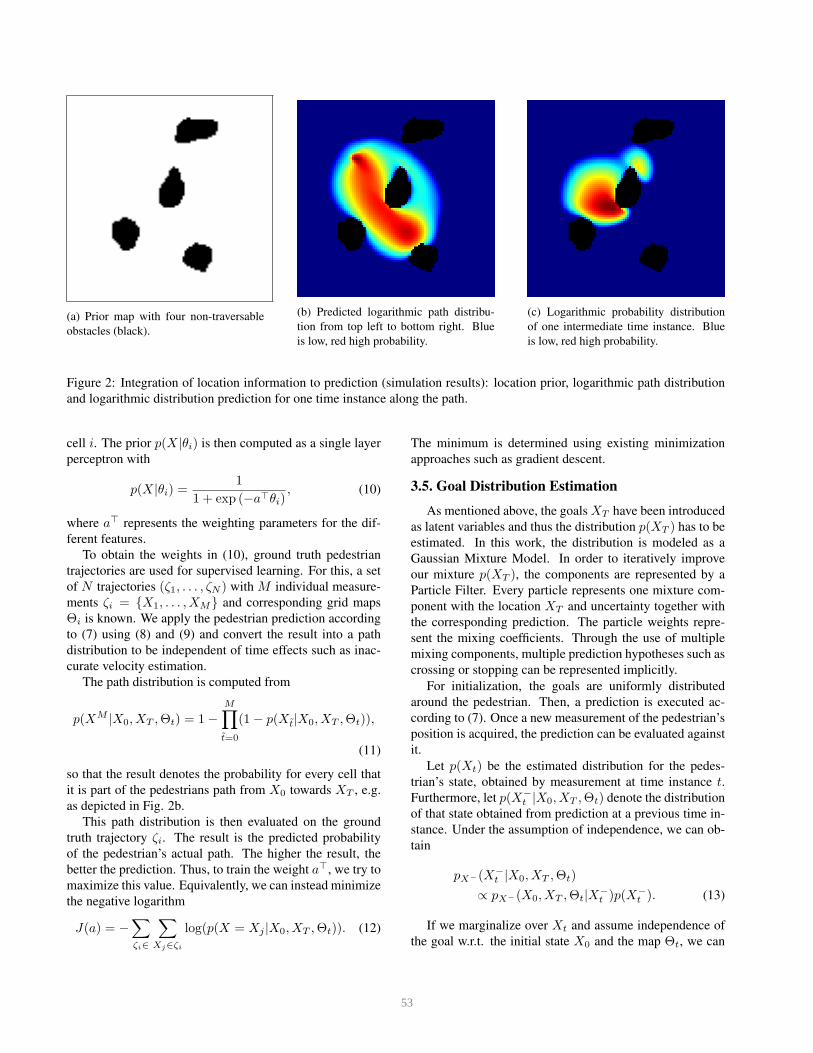
(a) Prior map with four non-traversable
obstacles (black).
(b) Predicted logarithmic path distribu-
tion from top left to bottom right. Blue
is low, red high probability.
(c) Logarithmic probability distribution
of one intermediate time instance. Blue
is low, red high probability.
Figure 2: Integration of location information to prediction (simulation results): location prior, logarithmic path distribution
and logarithmic distribution prediction for one time instance along the path.
cell i. The prior p(X|θi) is then computed as a single layer
perceptron with
p(X|θi) =1
1 + exp (−a⊤θi), (10)
where a⊤ represents the weighting parameters for the dif-
ferent features.
To obtain the weights in (10), ground truth pedestrian
trajectories are used for supervised learning. For this, a set
of N trajectories (ζ1, . . . , ζN ) with M individual measure-
ments ζi = {X1, . . . , XM} and corresponding grid maps
Θi is known. We apply the pedestrian prediction according
to (7) using (8) and (9) and convert the result into a path
distribution to be independent of time effects such as inac-
curate velocity estimation.
The path distribution is computed from
p(XM |X0, XT ,Θt) = 1−
M∏
t̃=0
(1− p(Xt̃|X0, XT ,Θt)),
(11)
so that the result denotes the probability for every cell that
it is part of the pedestrians path from X0 towards XT , e.g.
as depicted in Fig. 2b.
This path distribution is then evaluated on the ground
truth trajectory ζi. The result is the predicted probability
of the pedestrian’s actual path. The higher the result, the
better the prediction. Thus, to train the weight a⊤, we try to
maximize this value. Equivalently, we can instead minimize
the negative logarithm
J(a) = −∑
ζi∈
∑
Xj∈ζi
log(p(X = Xj |X0, XT ,Θt)). (12)
The minimum is determined using existing minimization
approaches such as gradient descent.
3.5. Goal Distribution Estimation
As mentioned above, the goalsXT have been introduced
as latent variables and thus the distribution p(XT ) has to be
estimated. In this work, the distribution is modeled as a
Gaussian Mixture Model. In order to iteratively improve
our mixture p(XT ), the components are represented by a
Particle Filter. Every particle represents one mixture com-
ponent with the location XT and uncertainty together with
the corresponding prediction. The particle weights repre-
sent the mixing coefficients. Through the use of multiple
mixing components, multiple prediction hypotheses such as
crossing or stopping can be represented implicitly.
For initialization, the goals are uniformly distributed
around the pedestrian. Then, a prediction is executed ac-
cording to (7). Once a new measurement of the pedestrian’s
position is acquired, the prediction can be evaluated against
it.
Let p(Xt) be the estimated distribution for the pedes-
trian’s state, obtained by measurement at time instance t.
Furthermore, let p(X−
t |X0, XT ,Θt) denote the distribution
of that state obtained from prediction at a previous time in-
stance. Under the assumption of independence, we can ob-
tain
pX−(X−
t |X0, XT ,Θt)
∝ pX−(X0, XT ,Θt|X−
t )p(X−
t ). (13)
If we marginalize over Xt and assume independence of
the goal w.r.t. the initial state X0 and the map Θt, we can
53

(a) Camera image [8] (b) Occupancy grid for obstacles.
(c) Occupancy grid for sidewalks. (d) Final location prior distribution map.
Figure 3: Occupancy grids and resulting location prior map. Dark tones encodes low, bright tones high probability.
obtain
p(XT ) ∝
∫
pX−(X0, XT ,Θt|Xt)p(Xt)dXt. (14)
The distribution (14) is now evaluated for the individual
particles and the result is used for reweighting. Unlikely
particles are discarded and randomly resampled at other lo-
cations.
4. Experimental Results
The proposed method is evaluated on the dataset pre-
sented in [8]. Pedestrian bounding boxes are taken from the
ground truth labels. The pedestrian trajectories are com-
puted from stereo imaging [14] and optimized for outlier
rejection.
For the mapping of the environment, we construct stan-
dard occupancy grids [5] from disparity images. In addition
to this, we make the assumption of a linear road model with
predefined width and synthetically compute grid maps for
road, sidewalk and curb features without sensor evidence.
This assumption holds for most of the sequences but should
be replaced by online perception for arbitrary environments.
Both training and test sequences are split into multiple
smaller trajectories with a duration of four seconds with
maximum overlap of two seconds.
In the training phase, all model parameters, i.e. the mo-
tion model (4) and the prior distribution, were optimized by
minimization of (12). Location features were a bias term for
a uniform prior and features computed from the grid maps
mentioned above. These features, apart from the raw maps
themselves, were softened versions obtained from Gaussian
blur with different variances in order to model preferred dis-
tances to objects etc. [18].
As a reference, Figure 3 shows a camera image with cor-
responding occupancy grid map and sidewalk grid map to-
gether with the resulting prior map.
As performance metric we evaluate the predicted proba-
bility of the ground truth path. We do not rely on measures
such as mean squared distance to the mode or expectancy as
this measure does not represent the flexibility of our multi-
modal approach. The results of all trajectories for all test
samples were averaged.
4.1. Path Prediction
In a first step we evaluate the performance of the predic-
tion with given goal states for different environmental fea-
tures. This is of interest as a better prediction towards the
goal will lead to a better estimate of the pedestrian’s goal in
the later goal inference step.
We train the prior distribution according to (10) with dif-
ferent feature vectors θi. The minimization of (12) is ex-
54
Time [s]0 0.5 1 1.5 2 2.5 3
Pro
babili
ty
0.4
0.6
0.8
1
Predicted Probability of Trajectory
AllCurbObstaclesUniformRoadSidewalk
(a) Predicted trajectory distribution evaluated at ground
truth trajectory using different location features.
All
Cur
b
Obs
tacles
Unifo
rmRoa
d
Sidew
alk
Pro
ba
bili
ty
0.5
0.55Mean of Predicted Probability
(b) Geometric mean of predicted trajectory probability
for different location features.
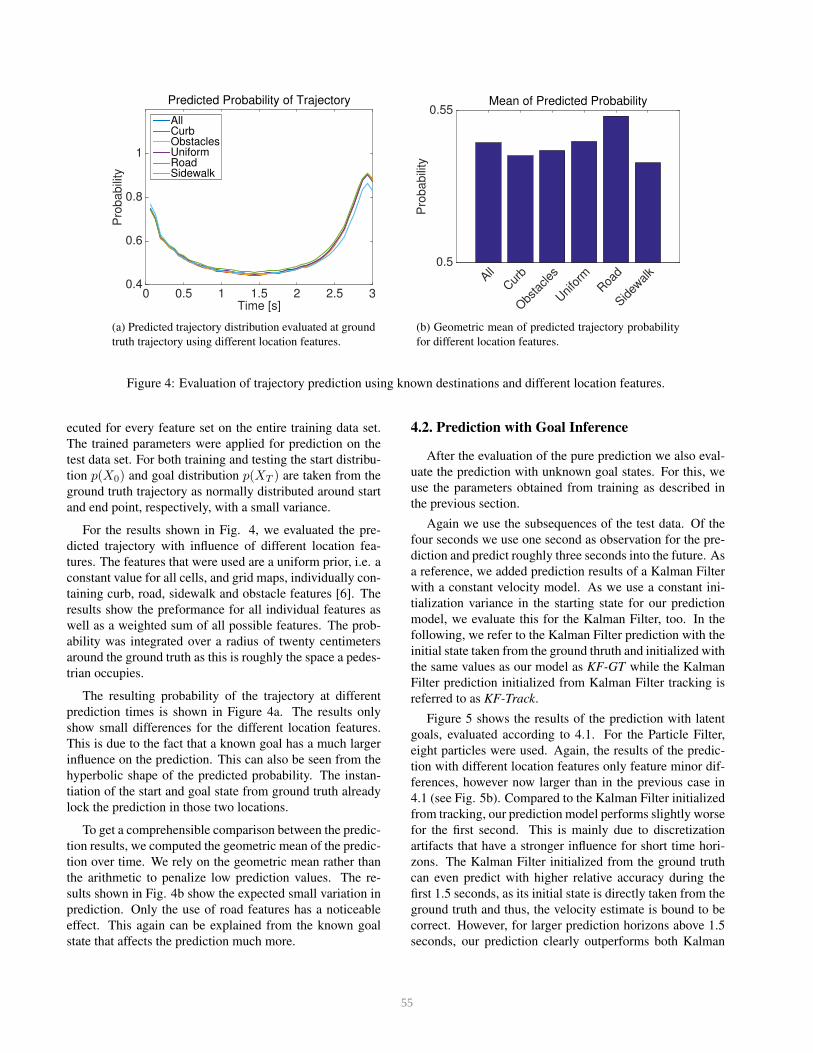
Figure 4: Evaluation of trajectory prediction using known destinations and different location features.
ecuted for every feature set on the entire training data set.
The trained parameters were applied for prediction on the
test data set. For both training and testing the start distribu-
tion p(X0) and goal distribution p(XT ) are taken from the
ground truth trajectory as normally distributed around start
and end point, respectively, with a small variance.
For the results shown in Fig. 4, we evaluated the pre-
dicted trajectory with influence of different location fea-
tures. The features that were used are a uniform prior, i.e. a
constant value for all cells, and grid maps, individually con-
taining curb, road, sidewalk and obstacle features [6]. The
results show the preformance for all individual features as
well as a weighted sum of all possible features. The prob-
ability was integrated over a radius of twenty centimeters
around the ground truth as this is roughly the space a pedes-
trian occupies.
The resulting probability of the trajectory at different
prediction times is shown in Figure 4a. The results only
show small differences for the different location features.
This is due to the fact that a known goal has a much larger
influence on the prediction. This can also be seen from the
hyperbolic shape of the predicted probability. The instan-
tiation of the start and goal state from ground truth already
lock the prediction in those two locations.
To get a comprehensible comparison between the predic-
tion results, we computed the geometric mean of the predic-
tion over time. We rely on the geometric mean rather than
the arithmetic to penalize low prediction values. The re-
sults shown in Fig. 4b show the expected small variation in
prediction. Only the use of road features has a noticeable
effect. This again can be explained from the known goal
state that affects the prediction much more.
4.2. Prediction with Goal Inference
After the evaluation of the pure prediction we also eval-
uate the prediction with unknown goal states. For this, we
use the parameters obtained from training as described in
the previous section.
Again we use the subsequences of the test data. Of the
four seconds we use one second as observation for the pre-
diction and predict roughly three seconds into the future. As
a reference, we added prediction results of a Kalman Filter
with a constant velocity model. As we use a constant ini-
tialization variance in the starting state for our prediction
model, we evaluate this for the Kalman Filter, too. In the
following, we refer to the Kalman Filter prediction with the
initial state taken from the ground thruth and initialized with
the same values as our model as KF-GT while the Kalman
Filter prediction initialized from Kalman Filter tracking is
referred to as KF-Track.
Figure 5 shows the results of the prediction with latent
goals, evaluated according to 4.1. For the Particle Filter,
eight particles were used. Again, the results of the predic-
tion with different location features only feature minor dif-
ferences, however now larger than in the previous case in
4.1 (see Fig. 5b). Compared to the Kalman Filter initialized
from tracking, our prediction model performs slightly worse
for the first second. This is mainly due to discretization
artifacts that have a stronger influence for short time hori-
zons. The Kalman Filter initialized from the ground truth
can even predict with higher relative accuracy during the
first 1.5 seconds, as its initial state is directly taken from the
ground truth and thus, the velocity estimate is bound to be
correct. However, for larger prediction horizons above 1.5
seconds, our prediction clearly outperforms both Kalman
55

Prediction Time [s]0 0.5 1 1.5 2 2.5
Pro
ba
bili
ty
0
0.2
0.4
0.6
0.8
1Predicted Probability of Trajectory
AllCurbObstaclesUniformRoadSidewalkKF-GTKF-Track
(a) Predicted trajectory distribution evaluated at
ground truth trajectory using different location fea-
tures.
All
Cur
b
Obs
tacles
Unifo
rmRoa
d
Sidew
alk
KF-GT
KF-Tra
ck
Pro
babili
ty
0
0.1
0.2
0.3Mean of Predicted Probability
(b) Geometric mean of predicted trajectory probabil-
ity for different location features.
Figure 5: Evaluation of trajectory prediction using estimation of latent destinations and different location features.
Prediction Time [s]0 0.5 1 1.5 2 2.5
Pro
ba
bili
ty
0
0.2
0.4
0.6
0.8
1
Predicted Probability of Path
AllCurbObstaclesUniformRoadSidewalkKF-GTKF-Track
(a) Predicted path distribution evaluated at ground
truth trajectory using different location features.
All
Cur
b
Obs
tacles
Unifo
rmRoa
d
Sidew
alk
KF-GT
KF-Tra
ck
Pro
babili
ty
0
0.1
0.2
0.3
0.4Mean of Predicted Probability
(b) Geometric mean of predicted path probability for
different location features.
Figure 6: Evaluation of path prediction using estimation of latent destinations and different location features.
Filter versions.
When evaluating the predicted path of a pedestrian as
in (7), the differences become much clearer (Fig. 6). For
evaluation, we again integrate over a slightly enlarged area,
this time to compute the mean instead of the actual inte-
gral. Regarding the prediction of all positions of the pedes-
trian along the path, this results in slightly underestimated
prediction in the first 0.5 seconds as seen in Figure 6a, but
overall leads to more robust evaluation. For the path, again,
the use of road or sidewalk features result in the best pre-
diction. Also, note that the prediction accuracy drops af-
ter about two seconds of prediction time. At this time, the
pedestrian will be close to reaching his goal, so the goal lo-
cation becomes more prominent in prediction. Thus, small
miss-estimations in the goal distribution will lead to inaccu-
rate prediction close to the maximum prediction time.
For reference, sample scenes taken from a drive with in-
ner city scenarios are shown in Figure 7. The left column
shows camera images taken from a driving vehicle, the right
column shows the prior map in desaturated colors together
with path predictions. Note the strong influence of the sur-
rounding on the prediction as well as the multiple possible
destinations that are estimated for some pedestrians.
56

(a) Prediction of pedestrian on sidewalk. Possibility of stepping on the street is still tracked in Particle Filter, passing
through the fence is excluded from path possibilities.
(b) Prediction for multiple pedestrians. Note the exclusion of obstacles in the predicted paths as well as the multiple
hypotheses for the most remote pedestrian.
(c) Prediction of pedestrians crossing. Future walking direction on sidewalk is correctly inferred.
Figure 7: Prediction of pedestrians, scenes taken in inner city, manually annotated pedestrians together with their path pre-
dictions in context of location prior map. Prior: brighter means higher probability, path: more red encodes higher probability.
5. Conclusion
In this work we presented a method for probabilistic
goal-directed pedestrian prediction. By estimation of the
pedestrian’s destination as a latent variable the prediction
problem was converted into a planning problem. Under
this assumption the influence of the environment was in-
cluded in the prediction phase. In contrast to other predic-
tion methods, no model interpretation such as different dy-
namic states or behavior models is needed, but instead this
is solved implicitly.
The modular structure of the model allows for simple
addition of other sources of information. Different mo-
tion models, such as constant acceleration etc., can be in-
cluded by modification of the filter masks. Dynamical envi-
ronments such as passing cars can be modeled using time-
varying location priors. The reweighting or resampling step
of the goal distribution could also be improved using con-
textual information.
Overall the prediction already shows a high level of per-
formance with its particular strength in long term predic-
tion.
57

References
[1] Y. Abramson and B. Steux. Hardware-friendly pedestrian
detection and impact prediction. In Intelligent Vehicles Sym-
posium, 2004 IEEE, pages 590–595, June 2004.
[2] Z. Chen, D. C. K. Ngai, and N. H. C. Yung. Pedestrian be-
havior prediction based on motion patterns for vehicle-to-
pedestrian collision avoidance. In Intelligent Transportation
Systems, 2008. ITSC 2008. 11th International IEEE Confer-
ence on, pages 316–321, Oct 2008.
[3] Z. Chen and N. H. C. Yung. Improved multi-level pedestrian
behavior prediction based on matching with classified mo-
tion patterns. In Intelligent Transportation Systems, 2009.
ITSC ’09. 12th International IEEE Conference on, pages 1–
6, Oct 2009.
[4] S.-Y. Chung and H.-P. Huang. A mobile robot that under-
stands pedestrian spatial behaviors. In Intelligent Robots
and Systems (IROS), 2010 IEEE/RSJ International Confer-
ence on, pages 5861–5866, Oct 2010.
[5] A. Elfes. Using occupancy grids for mobile robot perception
and navigation. Computer, 22(6):46–57, June 1989.
[6] H. Harms, E. Rehder, and M. Lauer. Grid map based curb
and free space estimation using dense stereo vision. In In-
telligent Vehicles Symposium Proceedings, 2015 IEEE, June
2015.
[7] C. Keller and D. Gavrila. Will the pedestrian cross? a study
on pedestrian path prediction. Intelligent Transportation Sys-
tems, IEEE Transactions on, 15(2):494–506, April 2014.
[8] C. G. Keller, C. Hermes, and D. M. Gavrila. Will the pedes-
trian cross? probabilistic path prediction based on learned
motion features. In Pattern Recognition, pages 386–395.
Springer, 2011.
[9] K. M. Kitani, B. D. Ziebart, J. A. Bagnell, and M. Hebert.
Activity forecasting. In Computer Vision–ECCV 2012, pages
201–214. Springer, 2012.
[10] H. Kloeden, D. Schwarz, R. H. Rasshofer, and E. M. Biebl.
Fusion of cooperative localization data with dynamic object
information using data communication for preventative vehi-
cle safety applications. Advances in Radio Science, 11:67–
73, 2013.
[11] S. Kohler, M. Goldhammer, S. Bauer, K. Doll, U. Brun-
smann, and K. Dietmayer. Early detection of the pedestrian’s
intention to cross the street. In Intelligent Transportation
Systems (ITSC), 2012 15th International IEEE Conference
on, pages 1759–1764, Sept 2012.
[12] J. F. P. Kooij, N. Schneider, F. Flohr, and D. M. Gavrila.
Context-based pedestrian path prediction. In Computer
Vision–ECCV 2014, pages 618–633. Springer International
Publishing, 2014.
[13] R. Quintero, J. Almeida, D. Llorca, and M. Sotelo. Pedes-
trian path prediction using body language traits. In Intel-
ligent Vehicles Symposium Proceedings, 2014 IEEE, pages
317–323, June 2014.
[14] B. Ranft and T. Strauss. Modeling arbitrarily oriented slanted
planes for efficient stereo vision based on block matching. In
Intelligent Transportation Systems (ITSC), 2014 IEEE 17th
International Conference on, pages 1941–1947, Oct 2014.
[15] N. Schneider and D. M. Gavrila. Pedestrian path prediction
with recursive bayesian filters: A comparative study. In Pat-
tern Recognition, pages 174–183. Springer, 2013.
[16] H. Sidenbladh, M. J. Black, and L. Sigal. Implicit proba-
bilistic models of human motion for synthesis and tracking.
In Computer Vision-ECCV 2002, pages 784–800. Springer,
2002.
[17] C. Wakim, S. Capperon, and J. Oksman. A markovian model
of pedestrian behavior. In Systems, Man and Cybernetics,
2004 IEEE International Conference on, volume 4, pages
4028–4033 vol.4, Oct 2004.
[18] B. Ziebart, N. Ratliff, G. Gallagher, C. Mertz, K. Peterson,
J. Bagnell, M. Hebert, A. Dey, and S. Srinivasa. Planning-
based prediction for pedestrians. In Intelligent Robots and
Systems, 2009. IROS 2009. IEEE/RSJ International Confer-
ence on, pages 3931–3936, Oct 2009.
58