goal setting for digital measurement success
TRANSCRIPT

Goal Setting for Digital Marketing Success
eMetrics
@kaydenkelly
Secret Sauce
Kayden KellyCEO / Founder
16 years in the making...(aka DMF)
@kaydenkelly

- Top 3 Roadblocks -
1.Company Centric2.Acquisition Focused3.“Mission Impossible” Goals
That inhibit goal setting and measurement, which generally reduce competitive advantage by making companies slow to identify and respond to internal weaknesses and external threats. Plus, it creates a lack of focus and effective prioritization.

@kaydenkelly
How do we remove these roadblocks?
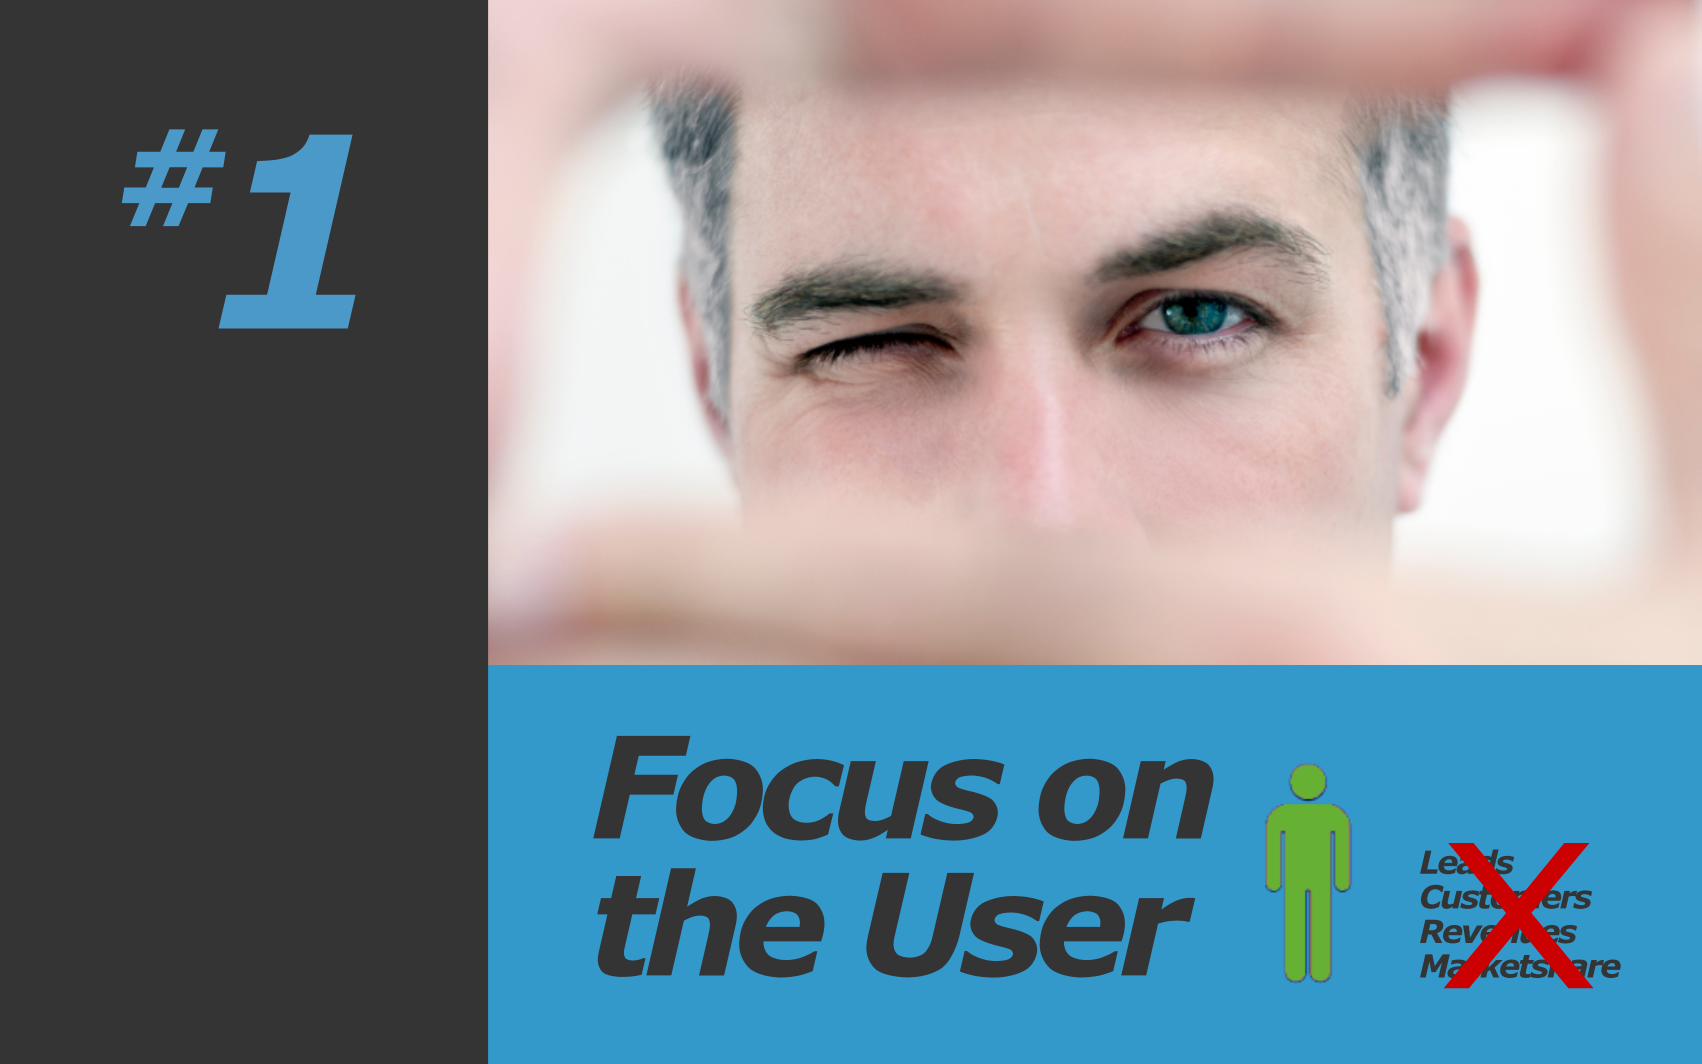
Focus on the User
1#
LeadsCustomersRevenuesMarketshareX

Get in their shoesFind and removebarriers & gaps in your customer decision journey

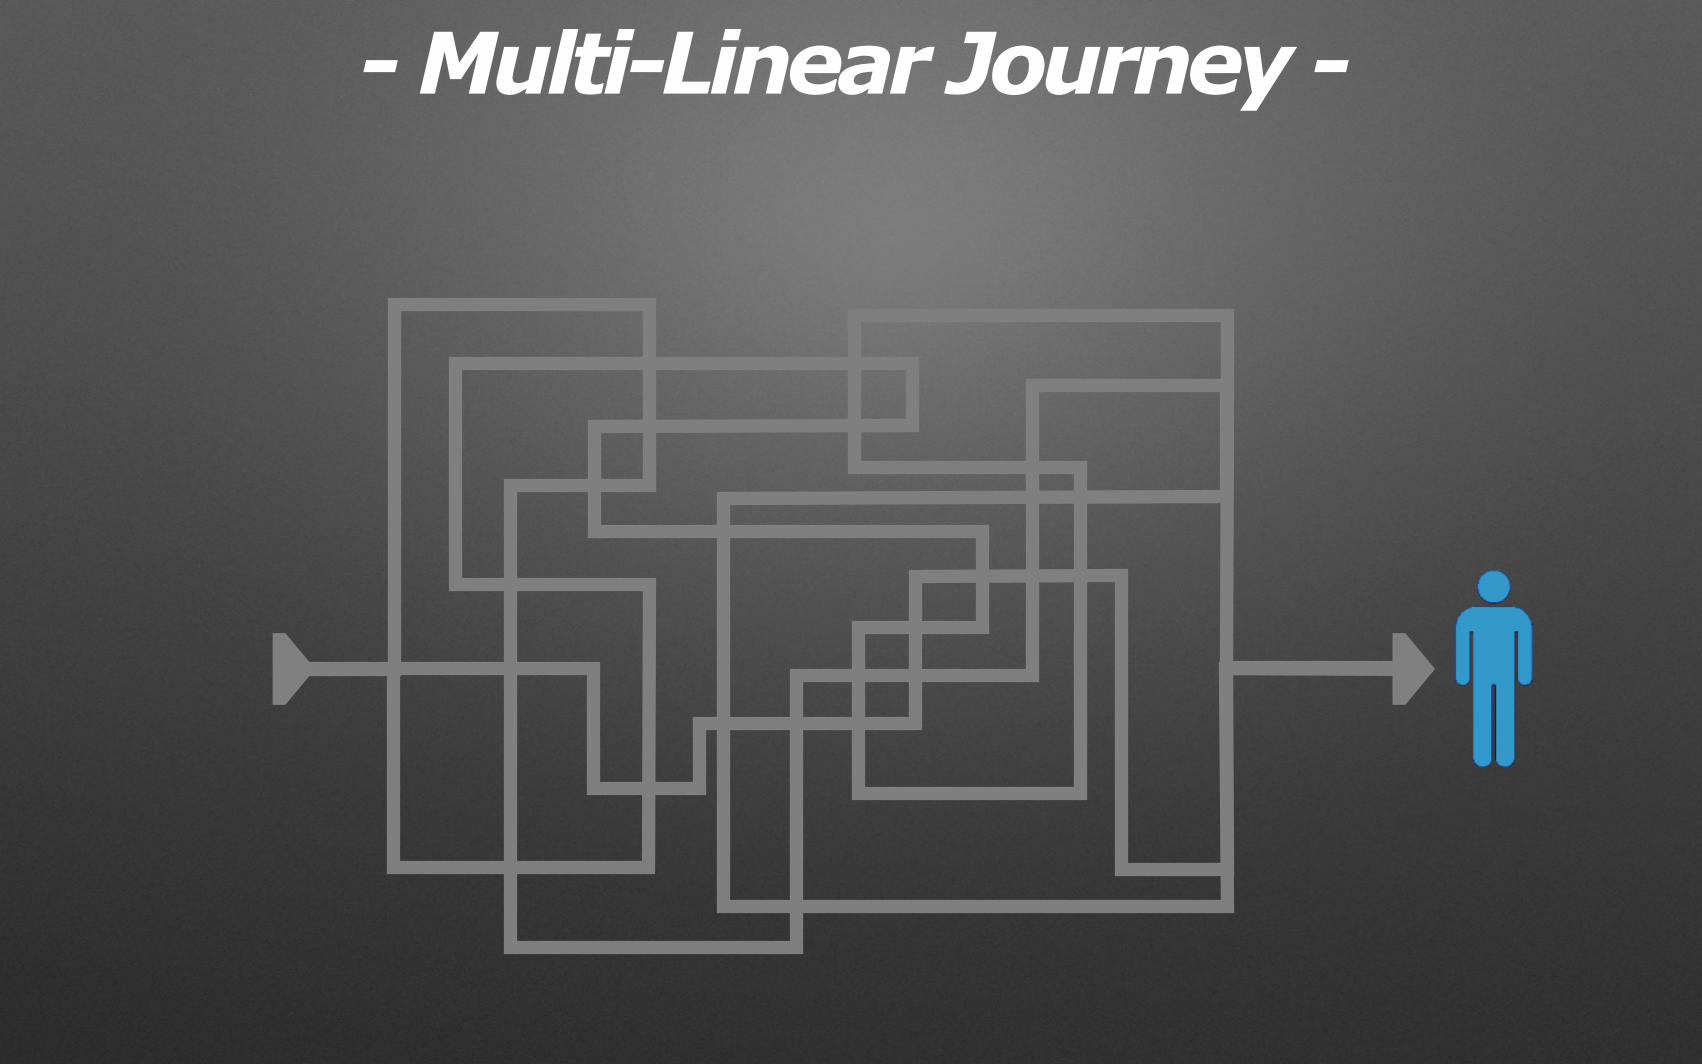
Map the Journey

- Multi-Linear Journey -

- Multi-Linear Journey -

- Multi-Linear Journey -

- Multi-Linear Journey -
- Multi-Linear Journey -

- Multi-Linear Journey -CHAOS

AWARENESS
- Multi-Linear Journey -CHAOS
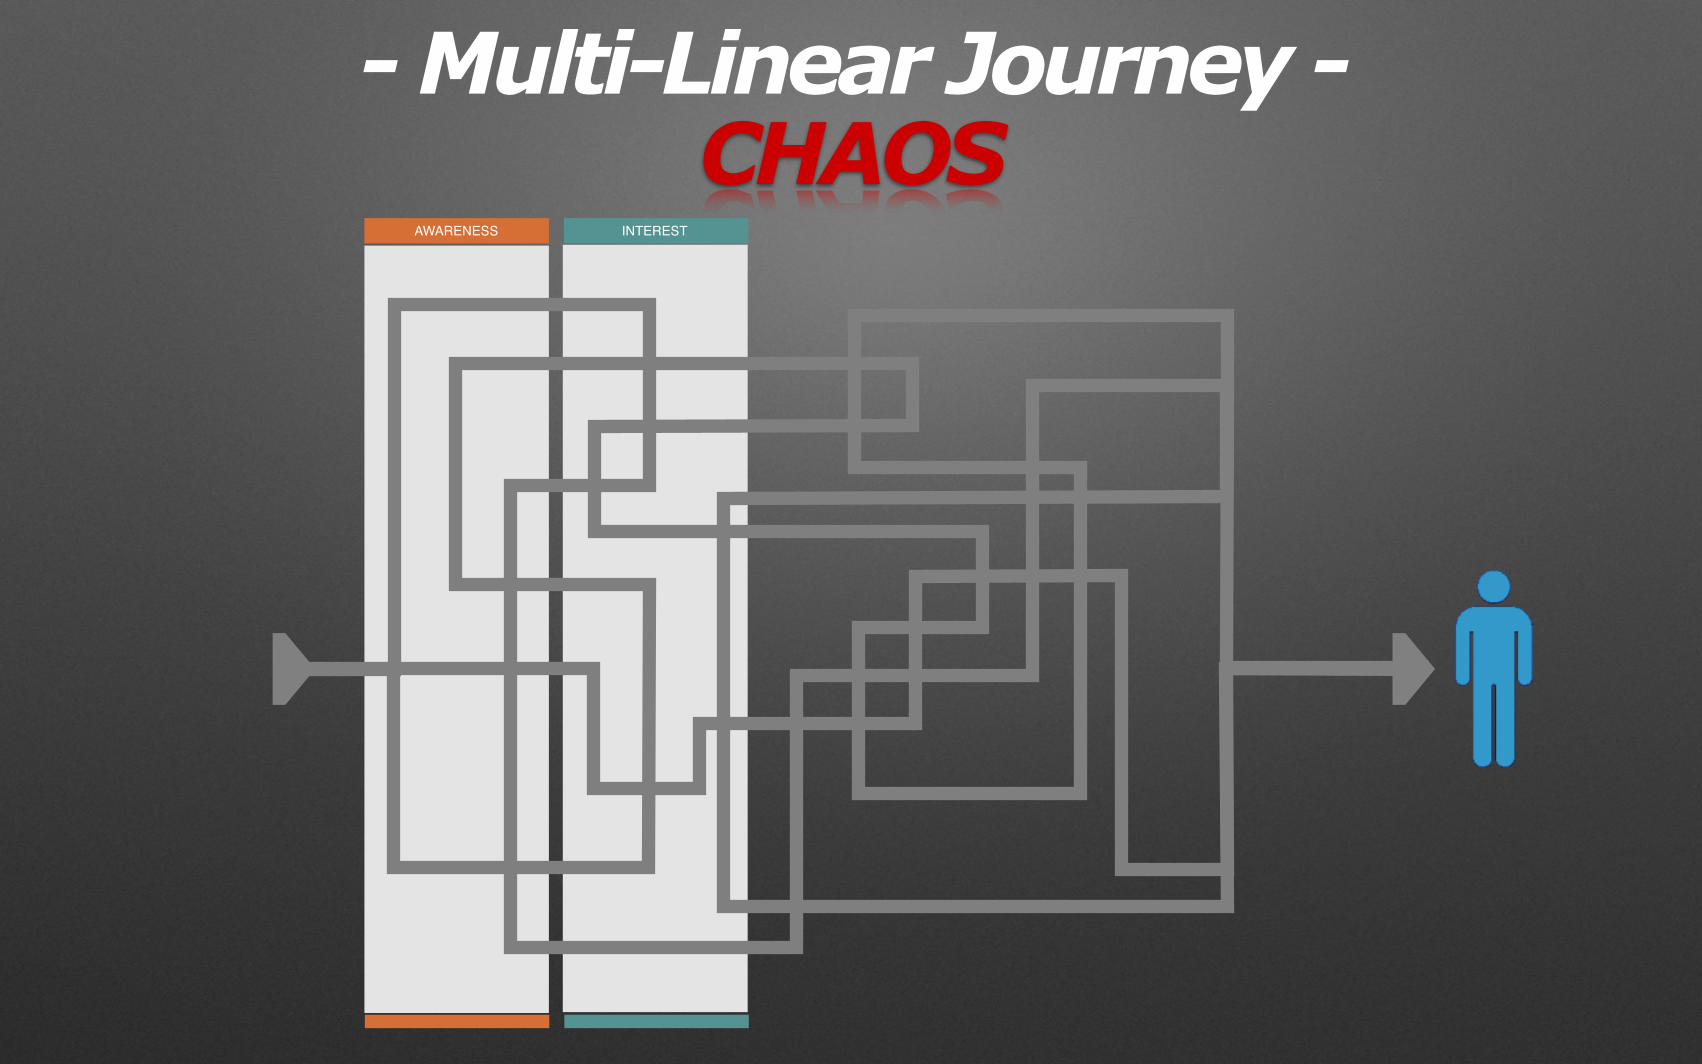
AWARENESS INTEREST
- Multi-Linear Journey -CHAOS

EVALUATIONAWARENESS INTEREST
- Multi-Linear Journey -CHAOS

DECIDE/PURCHASEEVALUATIONAWARENESS INTEREST
- Multi-Linear Journey -CHAOS

RETENTIONDECIDE/PURCHASEEVALUATIONAWARENESS INTEREST
- Multi-Linear Journey -CHAOS

RETENTIONDECIDE/PURCHASEEVALUATIONAWARENESS INTEREST
Build Brand Awareness
Increase Account Registrations
Increase Downloads
Increase Revenues
Increase Repeat Purchases
- Linear Journey -

RETENTIONDECIDE/PURCHASEEVALUATIONAWARENESS INTEREST
Build Brand Awareness
Increase Account Registrations
Increase Downloads
Increase Revenues
Increase Repeat Purchases
- Linear Journey -

RETENTIONDECIDE/PURCHASEEVALUATIONAWARENESS INTEREST
Build Brand Awareness
Increase Account Registrations
Increase Downloads
Increase Revenues
Increase Repeat Purchases
- Linear Journey -

RETENTIONDECIDE/PURCHASEEVALUATIONAWARENESS INTEREST
Build Brand Awareness
Increase Account Registrations
Increase Downloads
Increase Revenues
Increase Repeat Purchases
- Linear Journey -

RETENTIONDECIDE/PURCHASEEVALUATIONAWARENESS INTEREST
Build Brand Awareness
Increase Account Registrations
Increase Downloads
Increase Revenues
Increase Repeat Purchases
- Linear Journey -

RETENTIONDECIDE/PURCHASEEVALUATIONAWARENESS INTEREST
Build Brand Awareness
Increase Account Registrations
Increase Downloads
Increase Revenues
Increase Repeat Purchases
- Linear Journey -
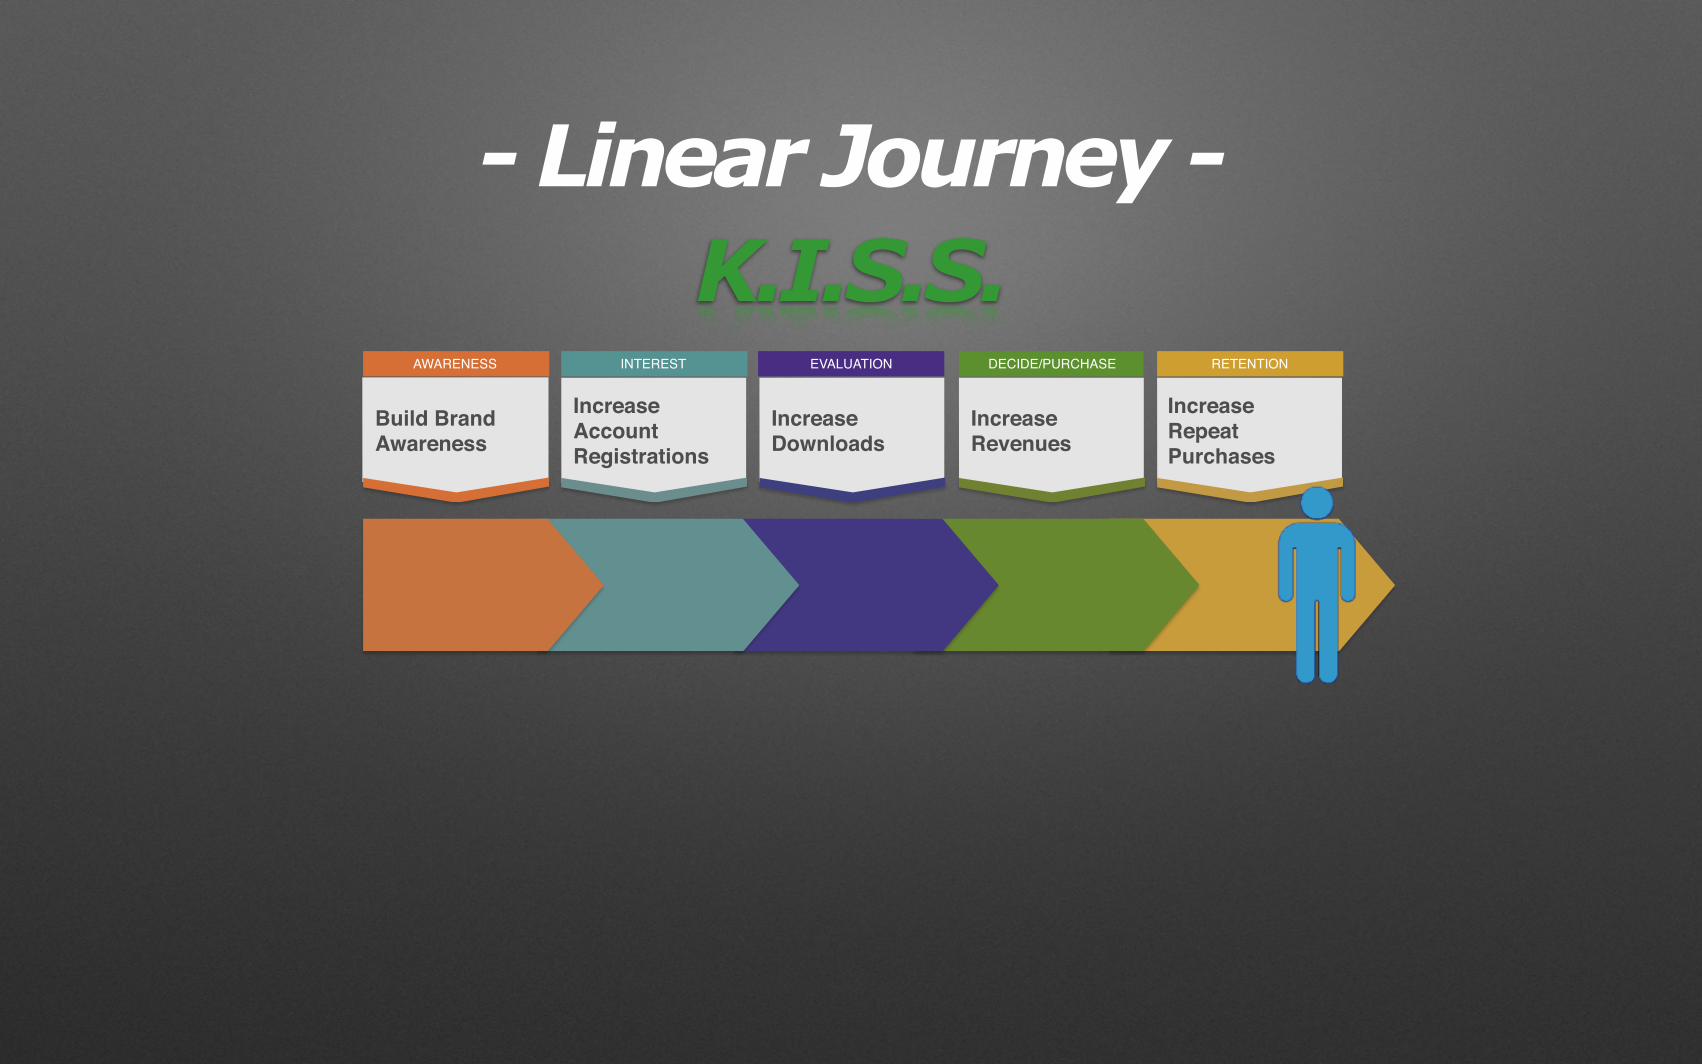
RETENTIONDECIDE/PURCHASEEVALUATIONAWARENESS INTEREST
K.I.S.S.Build Brand Awareness
Increase Account Registrations
Increase Downloads
Increase Revenues
Increase Repeat Purchases
- Linear Journey -

Leading Indicators
2#

RETENTIONDECIDE/PURCHASEEVALUATIONAWARENESS INTEREST
Build Brand Awareness
Increase Account Registrations
Increase Downloads
Increase Revenues
Increase Repeat Purchases
Lagging Indicators

RETENTIONDECIDE/PURCHASEEVALUATIONAWARENESS INTEREST
Build Brand Awareness
Increase Account Registrations
Increase Downloads
Increase Revenues
Increase Repeat Purchases
Lagging Indicators

RETENTIONDECIDE/PURCHASEEVALUATIONAWARENESS INTEREST
Build Brand Awareness
Increase Account Registrations
Increase Downloads
Increase Revenues
Increase Repeat Purchases
$
Lagging Indicators
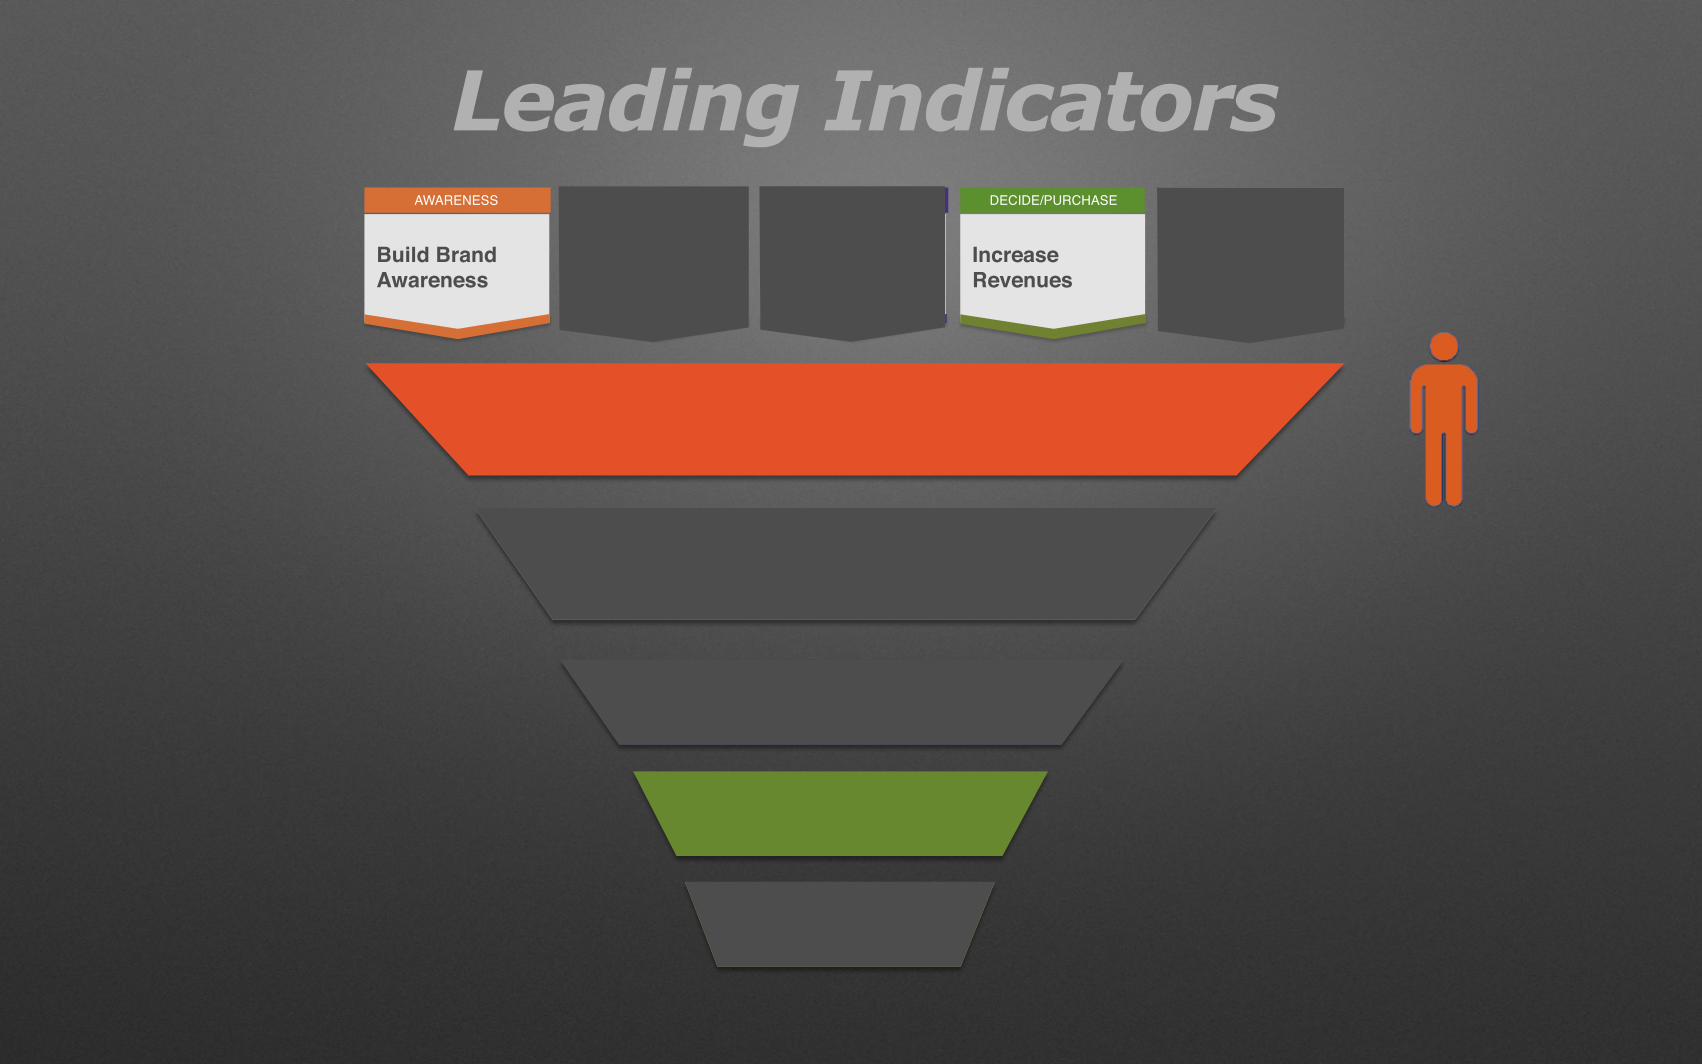
Leading IndicatorsRETENTIONDECIDE/PURCHASEEVALUATIONAWARENESS INTEREST
Build Brand Awareness
Increase Account Registrations
Increase Downloads
Increase Revenues
Increase Repeat Purchases

Leading IndicatorsRETENTIONDECIDE/PURCHASEEVALUATIONAWARENESS INTEREST
Build Brand Awareness
Increase Account Registrations
Increase Downloads
Increase Revenues
Increase Repeat Purchases

Leading IndicatorsRETENTIONDECIDE/PURCHASEEVALUATIONAWARENESS INTEREST
Build Brand Awareness
Increase Account Registrations
Increase Downloads
Increase Revenues
Increase Repeat Purchases

Leading IndicatorsRETENTIONDECIDE/PURCHASEEVALUATIONAWARENESS INTEREST
Build Brand Awareness
Increase Account Registrations
Increase Downloads
Increase Revenues
Increase Repeat Purchases

Leading IndicatorsRETENTIONDECIDE/PURCHASEEVALUATIONAWARENESS INTEREST
Build Brand Awareness
Increase Account Registrations
Increase Downloads
Increase Revenues
Increase Repeat Purchases

Leading IndicatorsRETENTIONDECIDE/PURCHASEEVALUATIONAWARENESS INTEREST
Build Brand Awareness
Increase Account Registrations
Increase Downloads
Increase Revenues
Increase Repeat Purchases
Address before downstream
impact

Benchmark & Forecast Realistic Goals
3#

RETENTIONPURCHASEEVALUATIONAWARENESS INTEREST
Benchmark
Historical Benchmark Data (2+ years - by Stage)
Monthly data helps us to identify & incorporate seasonality

RETENTIONPURCHASEEVALUATIONAWARENESS INTEREST
Benchmark
Historical Benchmark Data (2+ years - by Stage)
Monthly data helps us to identify & incorporate seasonality
Financial modeling techniques that incorporate assumptions
(aka Forecasting Levers...by Stage)
Forecast
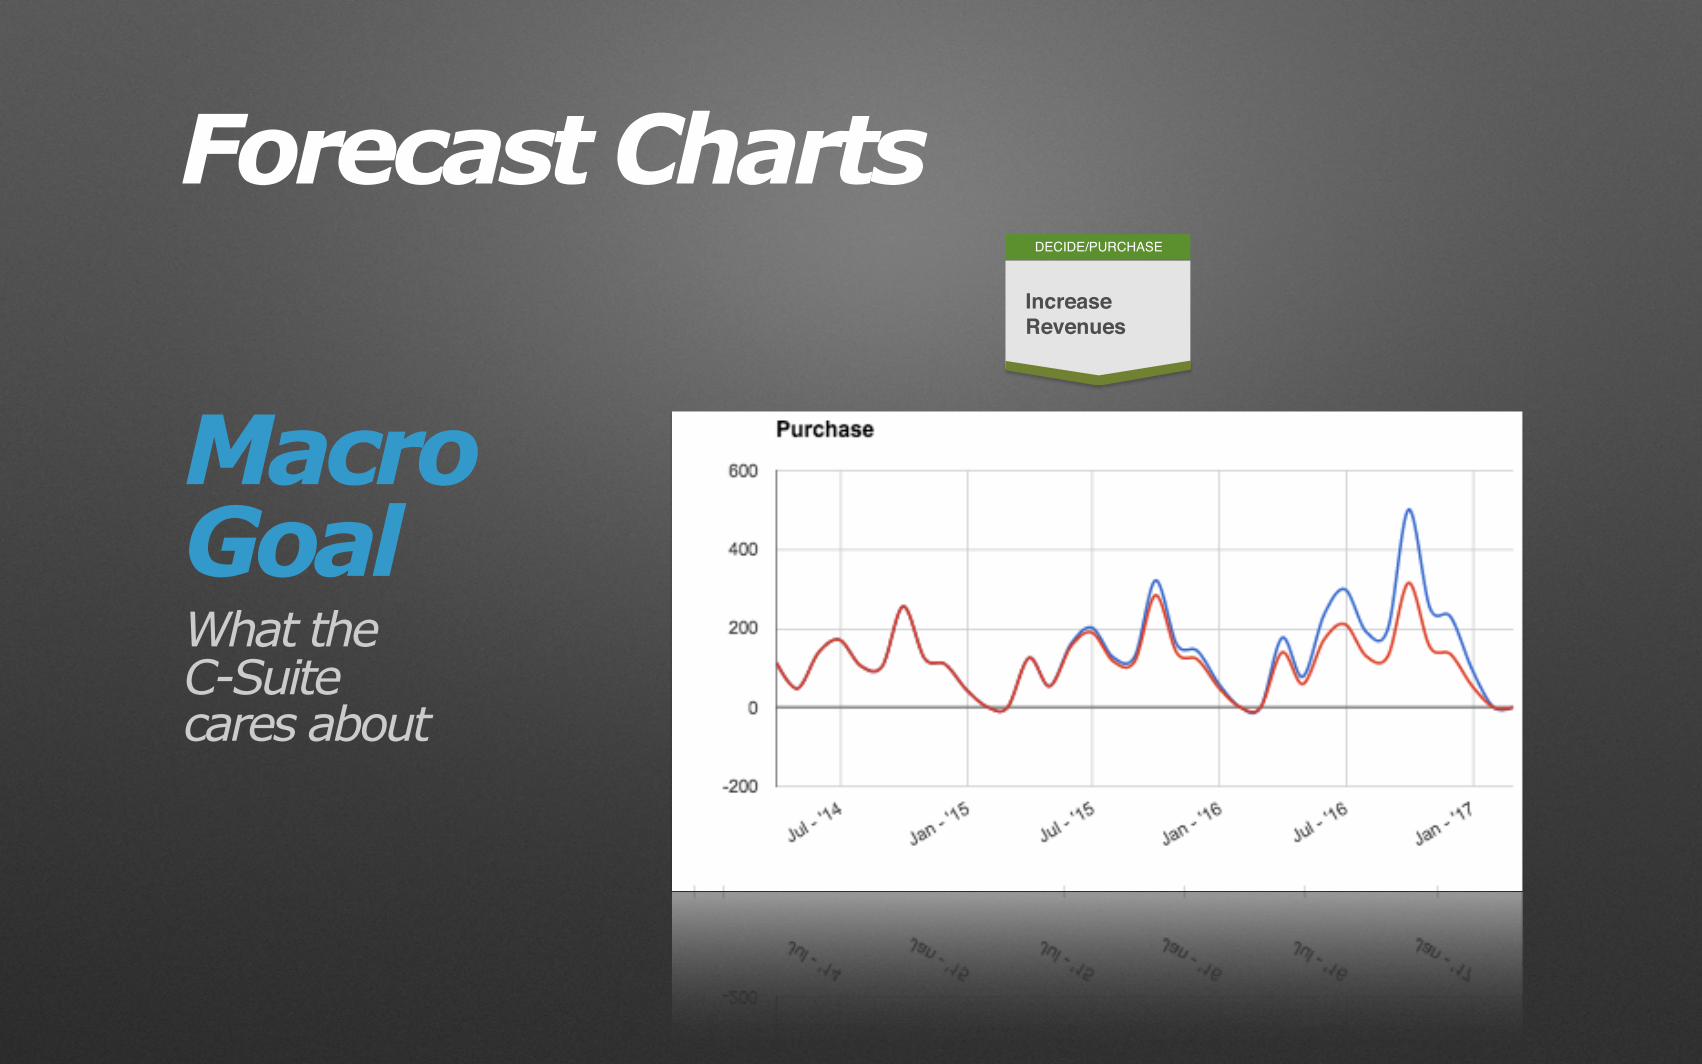
Macro Goal
DECIDE/PURCHASE
Increase Revenues
What the C-Suite cares about
Forecast Charts

RETENTIONDECIDE/PURCHASEEVALUATIONAWARENESS INTEREST
Build Brand Awareness
Increase Account Registrations
Increase Downloads
Increase Revenues
Increase Repeat Purchases
Micro GoalsUse Forecasts to Evaluate Goals & Set Targets

RETENTIONDECIDE/PURCHASEEVALUATIONAWARENESS INTEREST
Build Brand Awareness
Increase Account Registrations
Increase Downloads
Increase Revenues
Increase Repeat Purchases
Micro GoalsUse Forecasts to Evaluate Goals & Set Targets

RETENTIONDECIDE/PURCHASEEVALUATIONAWARENESS INTEREST
Build Brand Awareness
Increase Account Registrations
Increase Downloads
Increase Revenues
Increase Repeat Purchases
Micro GoalsUse Forecasts to Evaluate Goals & Set Targets

RETENTIONDECIDE/PURCHASEEVALUATIONAWARENESS INTEREST
Build Brand Awareness
Increase Account Registrations
Increase Downloads
Increase Revenues
Increase Repeat Purchases
Micro GoalsUse Forecasts to Evaluate Goals & Set Targets

RETENTIONDECIDE/PURCHASEEVALUATIONAWARENESS INTEREST
Build Brand Awareness
Increase Account Registrations
Increase Downloads
Increase Revenues
Increase Repeat Purchases
Micro GoalsUse Forecasts to Evaluate Goals & Set Targets

RETENTIONDECIDE/PURCHASEEVALUATIONAWARENESS INTEREST
Build Brand Awareness
Increase Account Registrations
Increase Downloads
Increase Revenues
Increase Repeat Purchases
Micro GoalsUse Forecasts to Evaluate Goals & Set Targets

Measurement Strategy Tips- PART 1 -
Define S.M.A.R.T. Goals across Journey- PART 2 -
Avoid Goal Setting Pitfalls- PART 3 -
Better Goal Monitoring & Analysis- PART 4 -
Actionable Reporting Tips

Define SMART Goals across the Journey
- PART 1 -
AWARENESS
Build Brand Awareness
INTEREST
Increase Account Registrations
EVALUATION
Increase Downloads
DECIDE/PURCHASE
Increase Revenues
RETENTION
Increase Repeat Purchases
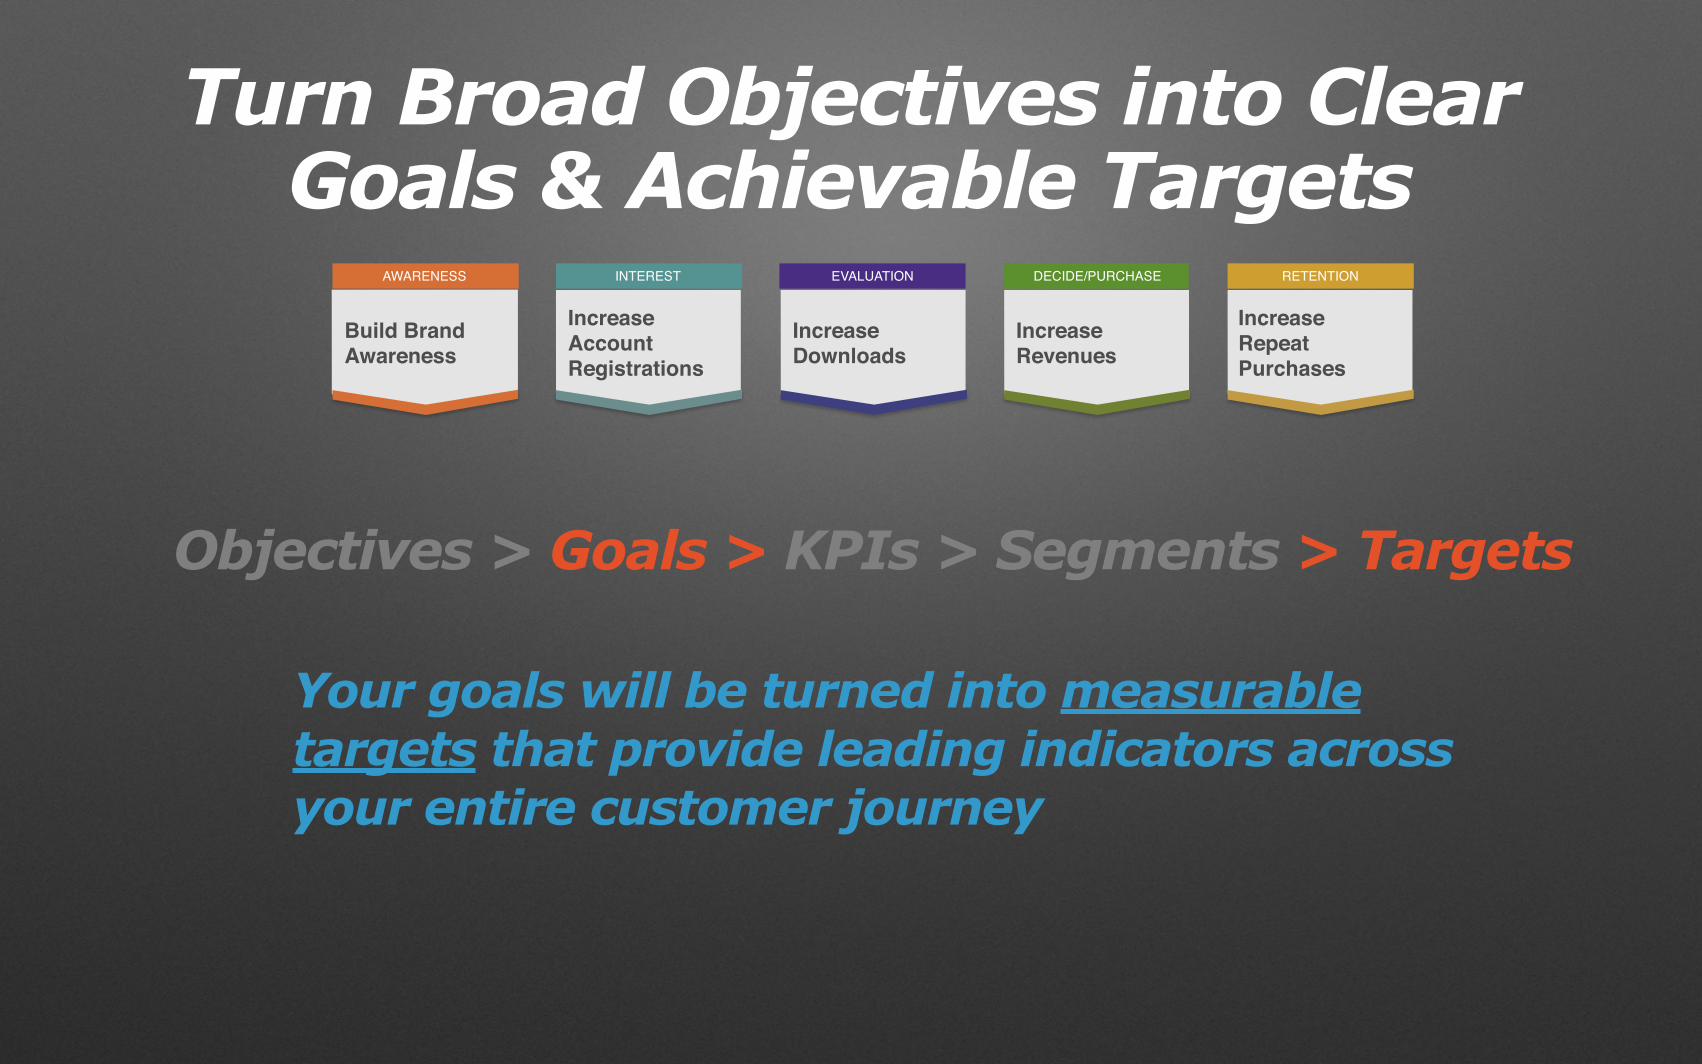
Your goals will be turned into measurable targets that provide leading indicators across your entire customer journey
Objectives > Goals > KPIs > Segments > Targets
Turn Broad Objectives into Clear Goals & Achievable Targets

AWARENESS
Build Brand Awareness
INTEREST
Increase Account Registrations
EVALUATION
Increase Downloads
DECIDE/PURCHASE
Increase Revenues
RETENTION
Increase Repeat Purchases
Your goals will be turned into measurable targets that provide leading indicators across your entire customer journey
Objectives > Goals > KPIs > Segments > Targets
Turn Broad Objectives into Clear Goals & Achievable Targets
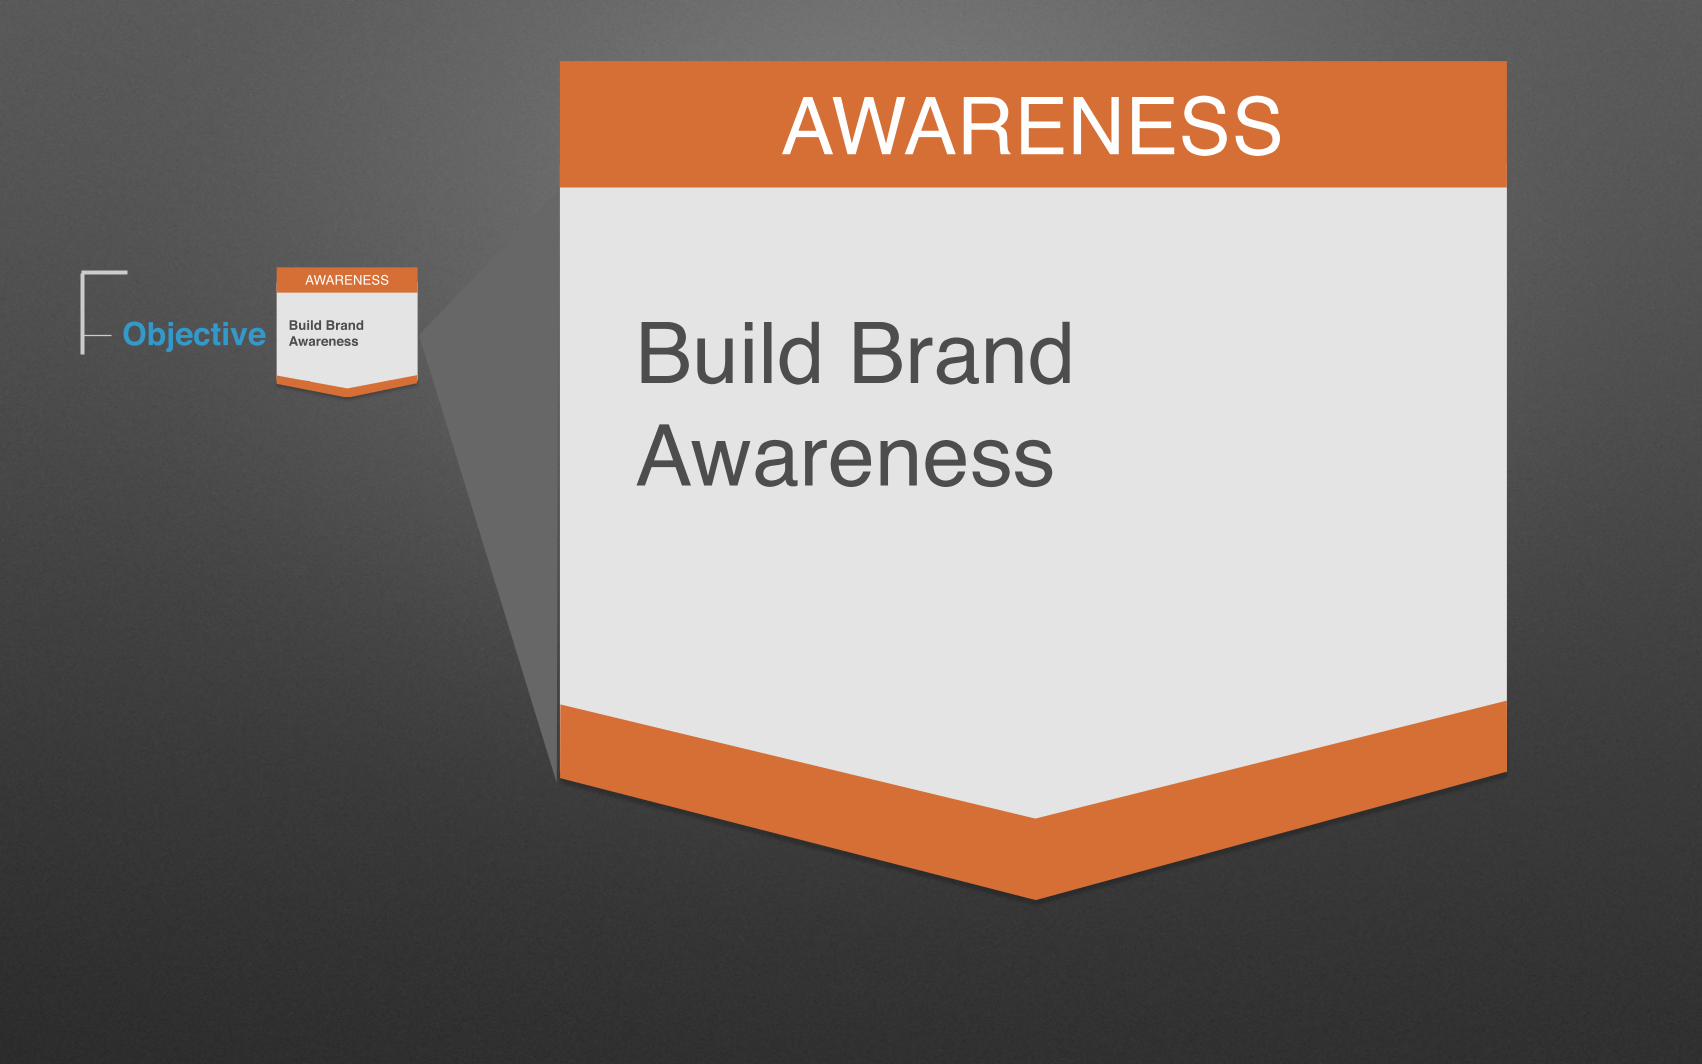
Objective
AWARENESS
Build Brand Awareness
AWARENESS
Build Brand Awareness

Key Insight:SpecificMeasurableAttainableRelevantTimely
Objective
Goal
AWARENESS
Increase (7) Content Group Organic Visits by 20% by 1/2016
AWARENESS
Build Brand Awareness
Increase (7) Content Group Organic Visits by 20% by 1/2016

Objective
Goal
KPI
AWARENESS
(1) X, (2) X, (3) X, (4) X Content Group Organic Visits
AWARENESS
Build Brand Awareness
Increase (7) Content Group Organic Visits by 20% by 1/2016
(1) X, (2) X, (3) X, (4) X Content Group Organic Visits

Objective
Goal
KPI
Segment
AWARENESS
Metric = LP Visits to X Content Group PagesMedium = OrganicCountry = USA
AWARENESS
Build Brand Awareness
Increase (7) Content Group Organic Visits by 20% by 1/2016
(1) X, (2) X, (3) X, (4) X Content Group Organic Visits
Metric = LP Visits to X Content Group PagesMedium = OrganicCountry = USA

Objective
Goal
KPI
Segment
Target
AWARENESS
Jan 2016: 300,000(Organic Search Visits)
AWARENESS
Build Brand Awareness
Increase (7) Content Group Organic Visits by 20% by 1/2016
(1) X, (2) X, (3) X, (4) X Content Group Organic Visits
Metric = LP Visits to X Content Group PagesMedium = OrganicCountry = USA
Jan 2016: 300,000(Organic Search Visits)

Objective
Goal
KPI
Segment
Target
AWARENESS
Google Analytics www.domain.com View
Source
AWARENESS
Build Brand Awareness
Increase (7) Content Group Organic Visits by 20% by 1/2016
(1) X, (2) X, (3) X, (4) X Content Group Organic Visits
Metric = LP Visits to X Content Group PagesMedium = OrganicCountry = USA
Jan 2016: 300,000(Organic Search Visits)
Google Analytics www.domain.com View

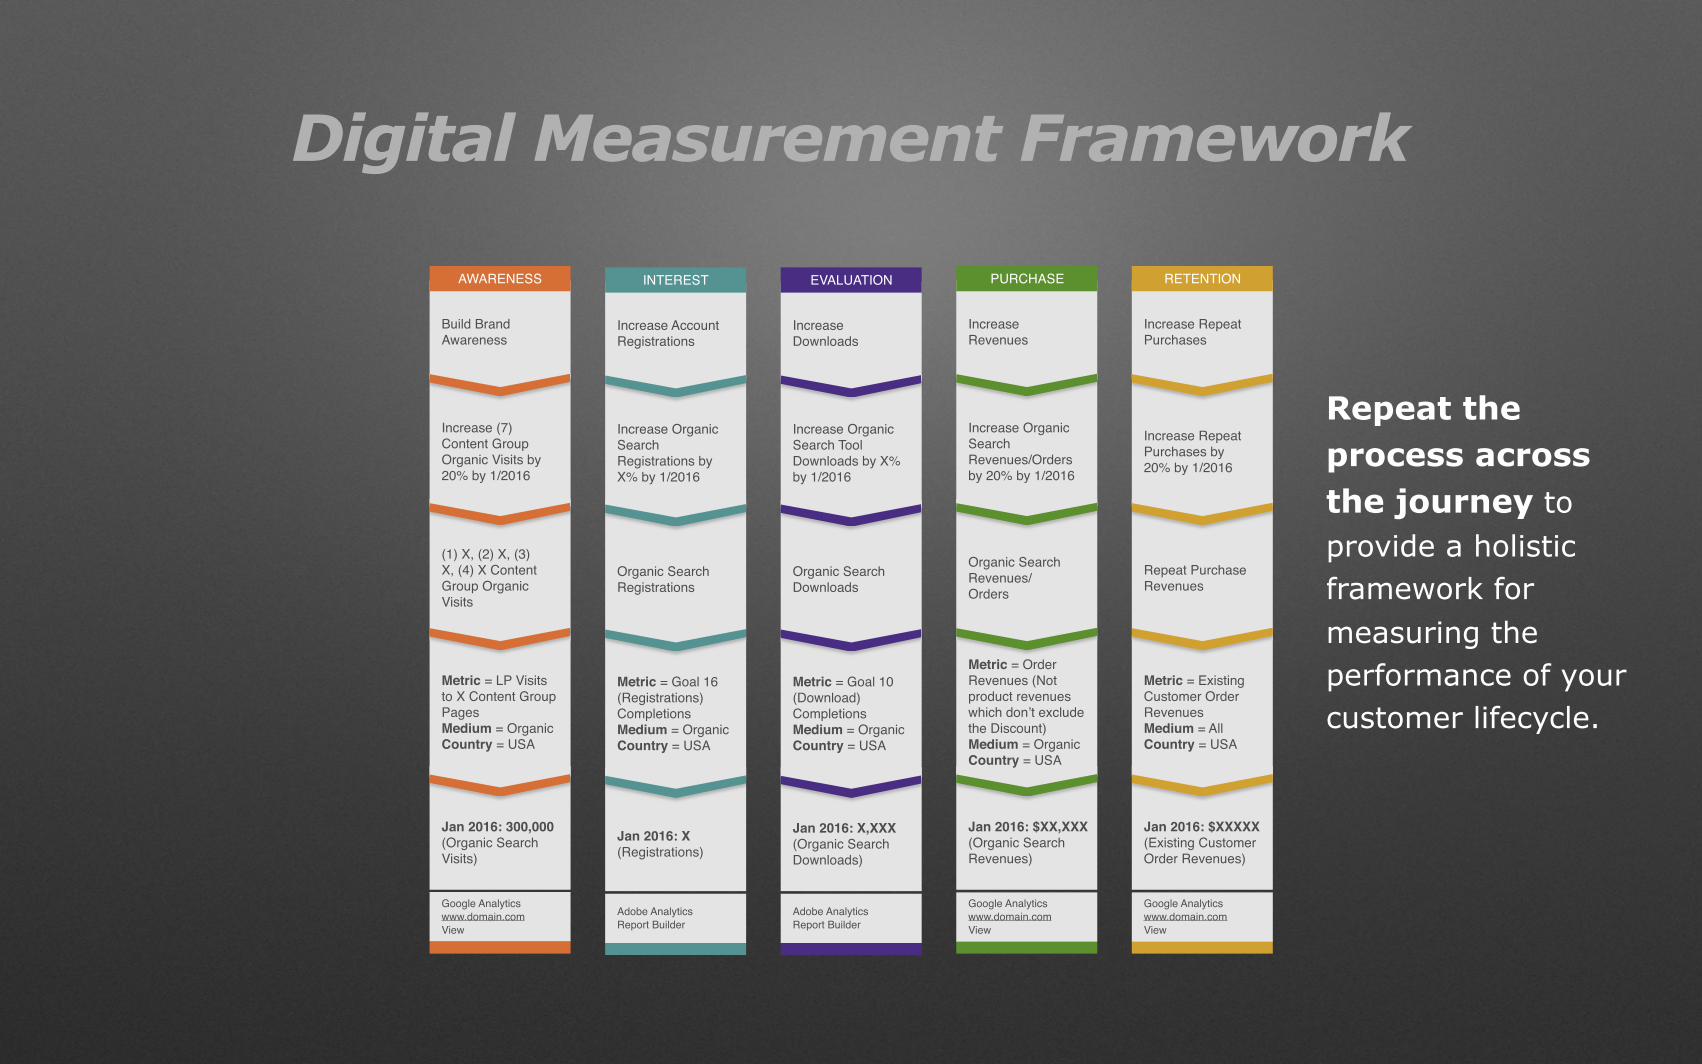
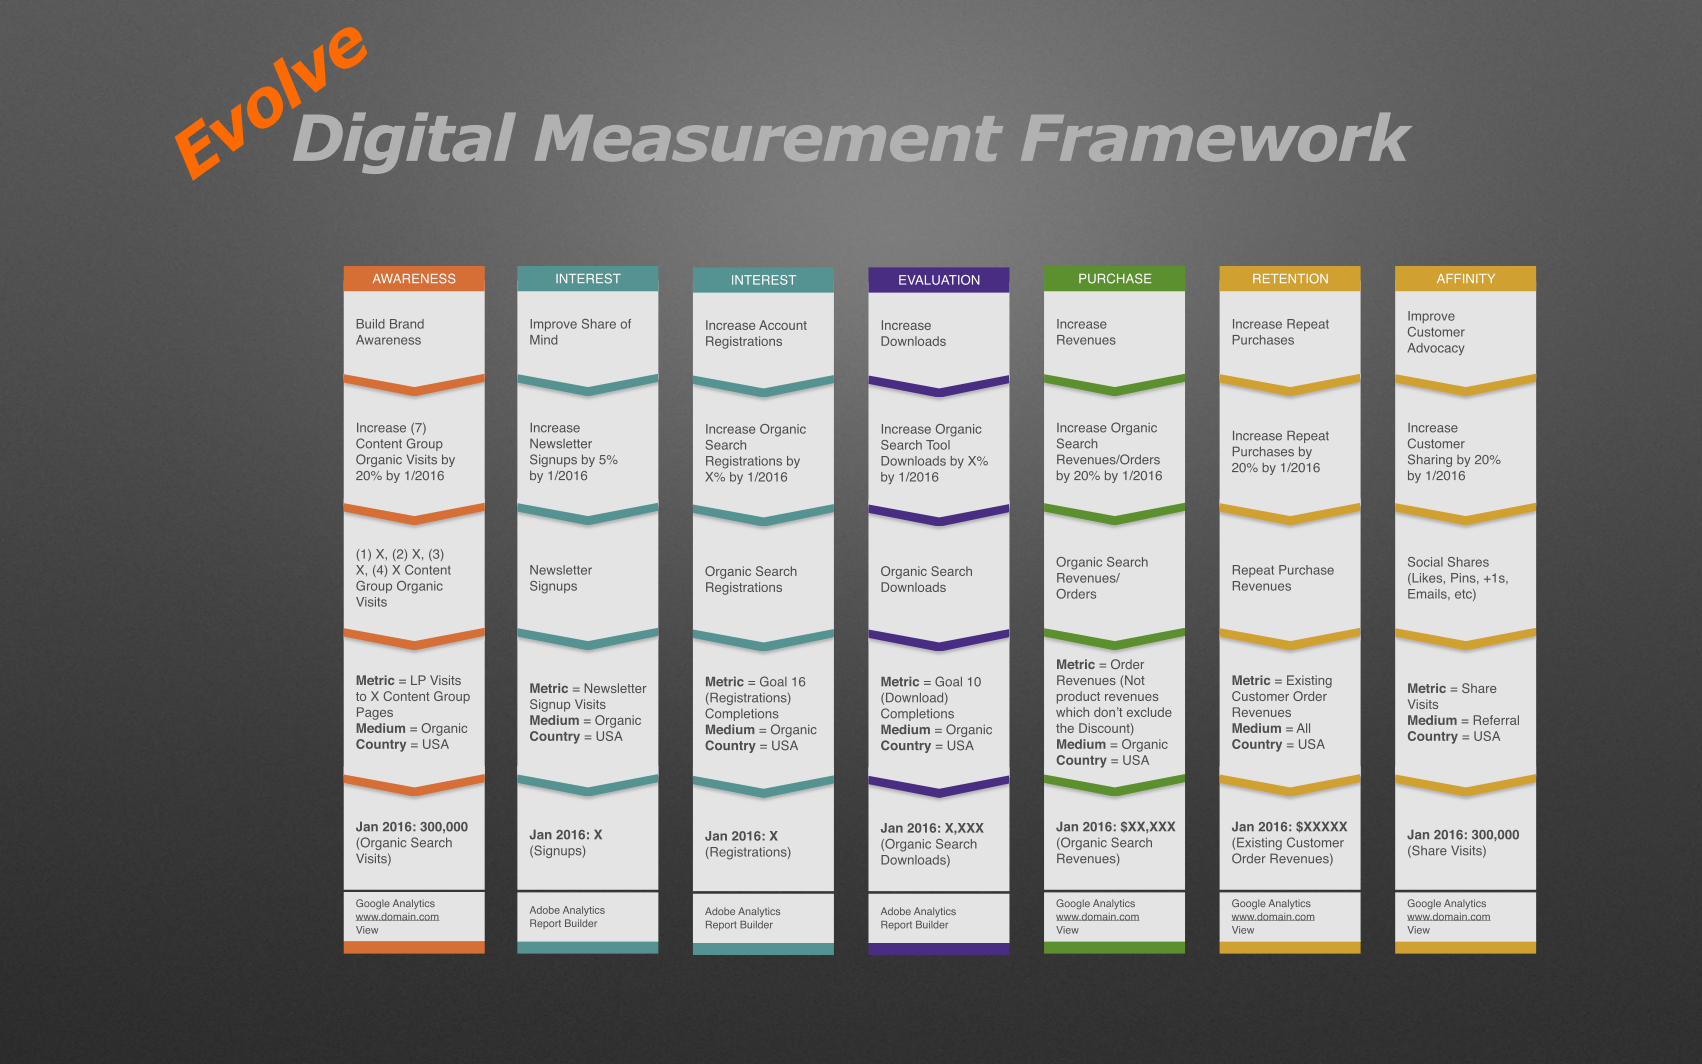
Digital Measurement Framework
AWARENESS
Build Brand Awareness
Increase (7) Content Group Organic Visits by 20% by 1/2016
(1) X, (2) X, (3) X, (4) X Content Group Organic Visits
Metric = LP Visits to X Content Group PagesMedium = OrganicCountry = USA
Jan 2016: 300,000(Organic Search Visits)
Google Analytics www.domain.com View
INTEREST
Increase Account Registrations
Increase Organic Search Registrations by X% by 1/2016
Organic Search Registrations
Metric = Goal 16 (Registrations) CompletionsMedium = OrganicCountry = USA
Jan 2016: X(Registrations)
Adobe Analytics Report Builder
Repeat the process across the journey to provide a holistic framework for measuring the performance of your customer lifecycle.

Digital Measurement Framework
AWARENESS
Build Brand Awareness
Increase (7) Content Group Organic Visits by 20% by 1/2016
(1) X, (2) X, (3) X, (4) X Content Group Organic Visits
Metric = LP Visits to X Content Group PagesMedium = OrganicCountry = USA
Jan 2016: 300,000(Organic Search Visits)
Google Analytics www.domain.com View
INTEREST
Increase Account Registrations
Increase Organic Search Registrations by X% by 1/2016
Organic Search Registrations
Metric = Goal 16 (Registrations) CompletionsMedium = OrganicCountry = USA
Jan 2016: X(Registrations)
Adobe Analytics Report Builder
EVALUATION
Increase Downloads
Increase Organic Search Tool Downloads by X% by 1/2016
Organic Search Downloads
Metric = Goal 10 (Download) CompletionsMedium = OrganicCountry = USA
Jan 2016: X,XXX(Organic Search Downloads)
Adobe Analytics Report Builder
PURCHASE
Increase Revenues
Increase Organic Search Revenues/Orders by 20% by 1/2016
Organic Search Revenues/Orders
Metric = Order Revenues (Not product revenues which don’t exclude the Discount)Medium = OrganicCountry = USA
Jan 2016: $XX,XXX(Organic Search Revenues)
Google Analytics www.domain.com View
Repeat the process across the journey to provide a holistic framework for measuring the performance of your customer lifecycle.
Digital Measurement Framework
AWARENESS
Build Brand Awareness
Increase (7) Content Group Organic Visits by 20% by 1/2016
(1) X, (2) X, (3) X, (4) X Content Group Organic Visits
Metric = LP Visits to X Content Group PagesMedium = OrganicCountry = USA
Jan 2016: 300,000(Organic Search Visits)
Google Analytics www.domain.com View
INTEREST
Increase Account Registrations
Increase Organic Search Registrations by X% by 1/2016
Organic Search Registrations
Metric = Goal 16 (Registrations) CompletionsMedium = OrganicCountry = USA
Jan 2016: X(Registrations)
Adobe Analytics Report Builder
EVALUATION
Increase Downloads
Increase Organic Search Tool Downloads by X% by 1/2016
Organic Search Downloads
Metric = Goal 10 (Download) CompletionsMedium = OrganicCountry = USA
Jan 2016: X,XXX(Organic Search Downloads)
Adobe Analytics Report Builder
PURCHASE
Increase Revenues
Increase Organic Search Revenues/Orders by 20% by 1/2016
Organic Search Revenues/Orders
Metric = Order Revenues (Not product revenues which don’t exclude the Discount)Medium = OrganicCountry = USA
Jan 2016: $XX,XXX(Organic Search Revenues)
Google Analytics www.domain.com View
RETENTION
Increase Repeat Purchases
Increase Repeat Purchases by 20% by 1/2016
Repeat Purchase Revenues
Metric = Existing Customer Order Revenues Medium = AllCountry = USA
Jan 2016: $XXXXX(Existing Customer Order Revenues)
Google Analytics www.domain.com View
Repeat the process across the journey to provide a holistic framework for measuring the performance of your customer lifecycle.
Basic
INTEREST
Increase Account Registrations
Increase Organic Search Registrations by X% by 1/2016
Organic Search Registrations
Metric = Goal 16 (Registrations) CompletionsMedium = OrganicCountry = USA
Jan 2016: X(Registrations)
Adobe Analytics Report Builder
EVALUATION
Increase Downloads
Increase Organic Search Tool Downloads by X% by 1/2016
Organic Search Downloads
Metric = Goal 10 (Download) CompletionsMedium = OrganicCountry = USA
Jan 2016: X,XXX(Organic Search Downloads)
Adobe Analytics Report Builder
PURCHASE
Increase Revenues
Increase Organic Search Revenues/Orders by 20% by 1/2016
Organic Search Revenues/Orders
Metric = Order Revenues (Not product revenues which don’t exclude the Discount)Medium = OrganicCountry = USA
Jan 2016: $XX,XXX(Organic Search Revenues)
Google Analytics www.domain.com View
RETENTION
Increase Repeat Purchases
Increase Repeat Purchases by 20% by 1/2016
Repeat Purchase Revenues
Metric = Existing Customer Order Revenues Medium = AllCountry = USA
Jan 2016: $XXXXX(Existing Customer Order Revenues)
Google Analytics www.domain.com View
AWARENESS
Build Brand Awareness
Increase (7) Content Group Organic Visits by 20% by 1/2016
(1) X, (2) X, (3) X, (4) X Content Group Organic Visits
Metric = LP Visits to X Content Group PagesMedium = OrganicCountry = USA
Jan 2016: 300,000(Organic Search Visits)
Google Analytics www.domain.com View
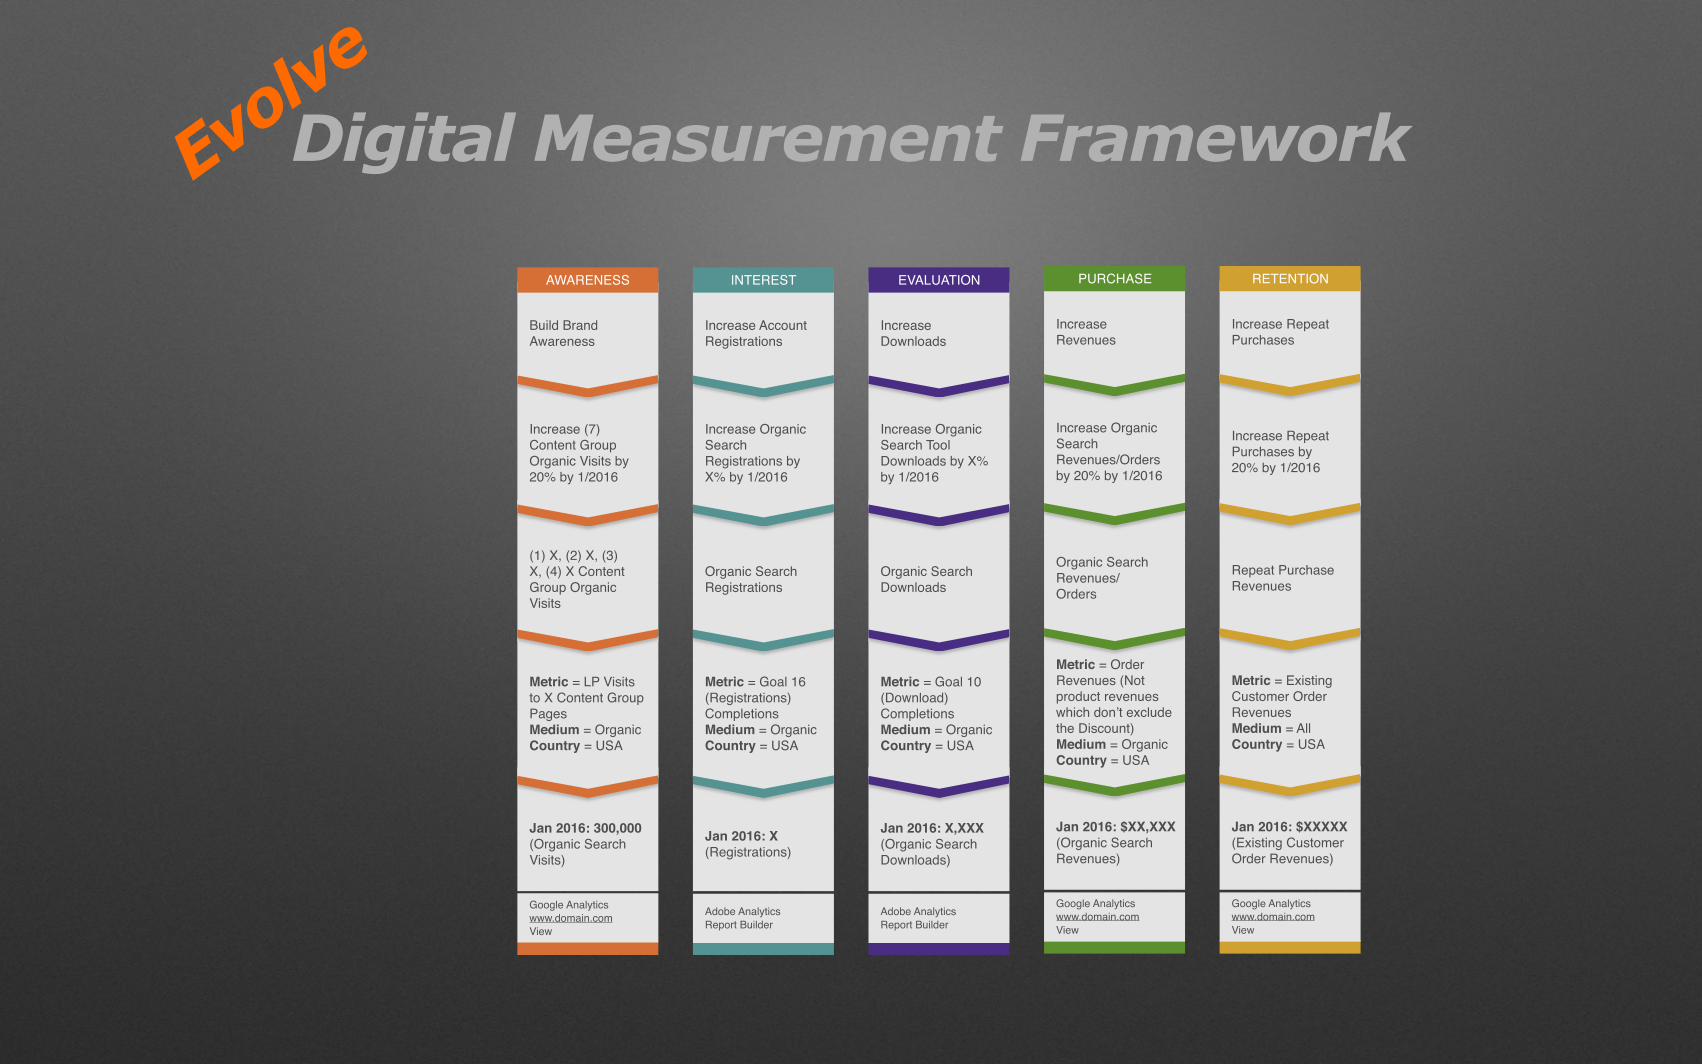
Digital Measurement FrameworkEvolve

INTEREST
Increase Account Registrations
Increase Organic Search Registrations by X% by 1/2016
Organic Search Registrations
Metric = Goal 16 (Registrations) CompletionsMedium = OrganicCountry = USA
Jan 2016: X(Registrations)
Adobe Analytics Report Builder
EVALUATION
Increase Downloads
Increase Organic Search Tool Downloads by X% by 1/2016
Organic Search Downloads
Metric = Goal 10 (Download) CompletionsMedium = OrganicCountry = USA
Jan 2016: X,XXX(Organic Search Downloads)
Adobe Analytics Report Builder
PURCHASE
Increase Revenues
Increase Organic Search Revenues/Orders by 20% by 1/2016
Organic Search Revenues/Orders
Metric = Order Revenues (Not product revenues which don’t exclude the Discount)Medium = OrganicCountry = USA
Jan 2016: $XX,XXX(Organic Search Revenues)
Google Analytics www.domain.com View
RETENTION
Increase Repeat Purchases
Increase Repeat Purchases by 20% by 1/2016
Repeat Purchase Revenues
Metric = Existing Customer Order Revenues Medium = AllCountry = USA
Jan 2016: $XXXXX(Existing Customer Order Revenues)
Google Analytics www.domain.com View
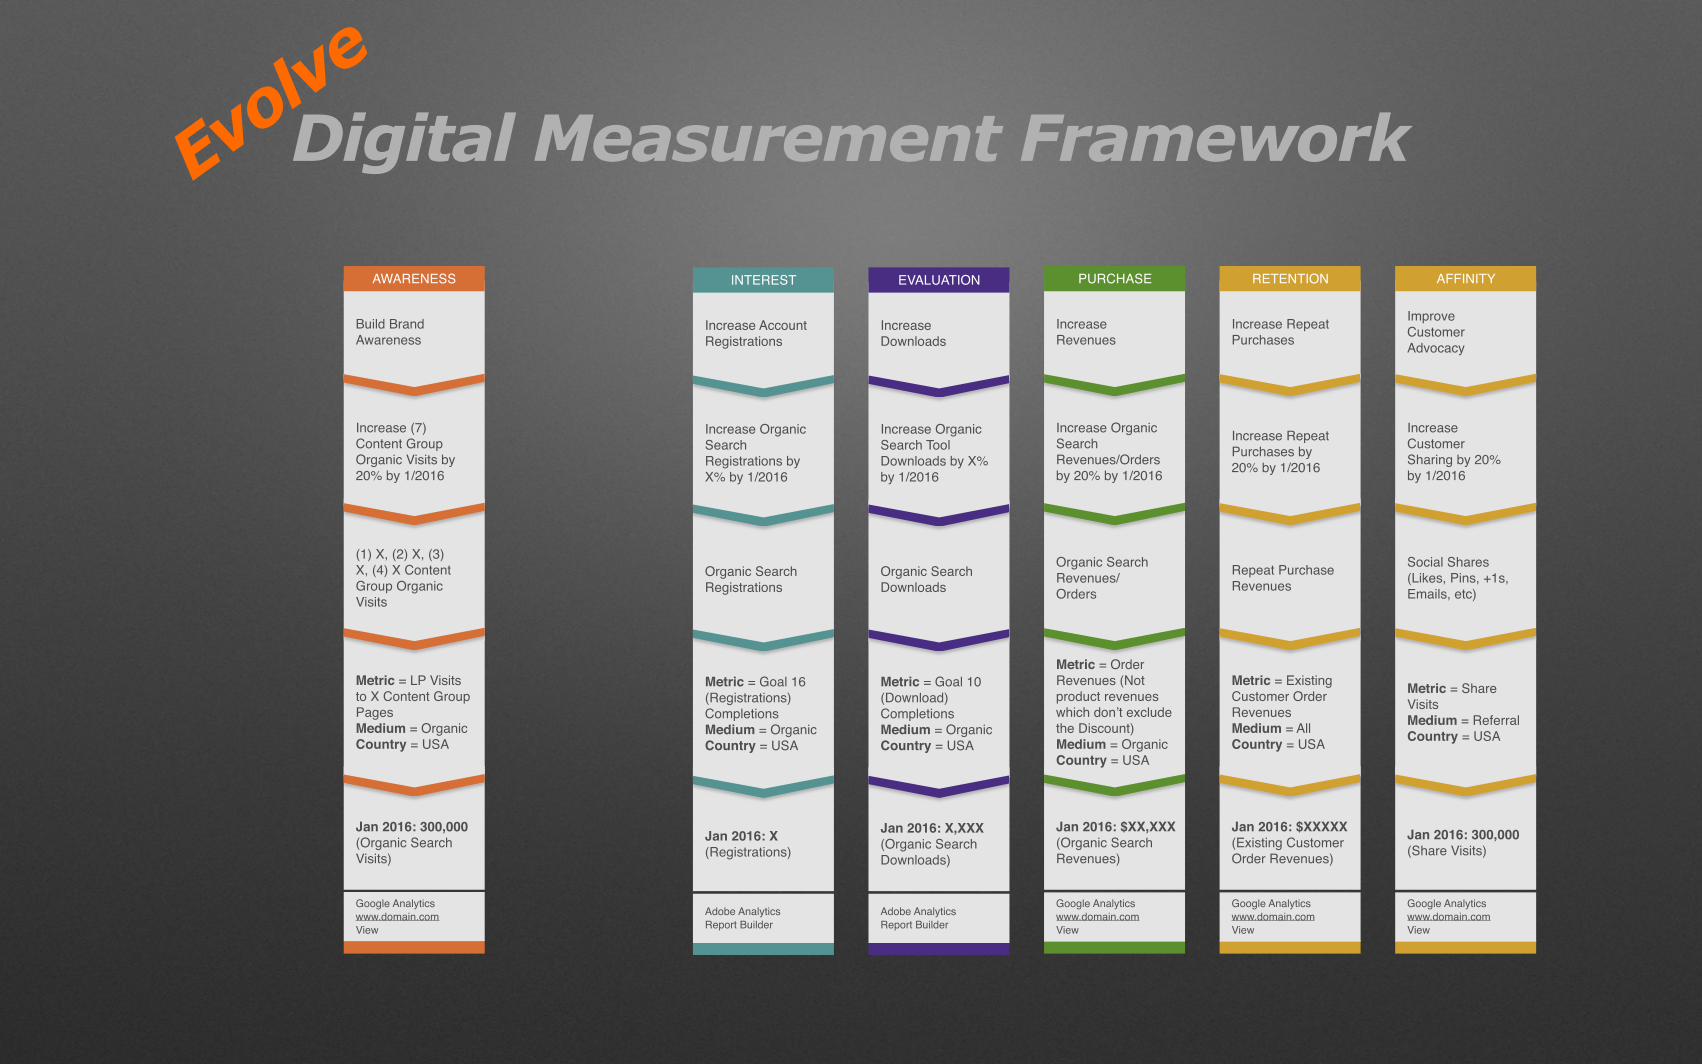
AFFINITY
Improve Customer Advocacy
Increase Customer Sharing by 20% by 1/2016
Social Shares (Likes, Pins, +1s, Emails, etc)
Metric = Share Visits Medium = ReferralCountry = USA
Jan 2016: 300,000(Share Visits)
Google Analytics www.domain.com View
AWARENESS
Build Brand Awareness
Increase (7) Content Group Organic Visits by 20% by 1/2016
(1) X, (2) X, (3) X, (4) X Content Group Organic Visits
Metric = LP Visits to X Content Group PagesMedium = OrganicCountry = USA
Jan 2016: 300,000(Organic Search Visits)
Google Analytics www.domain.com View
Digital Measurement FrameworkEvolve
INTEREST
Increase Account Registrations
Increase Organic Search Registrations by X% by 1/2016
Organic Search Registrations
Metric = Goal 16 (Registrations) CompletionsMedium = OrganicCountry = USA
Jan 2016: X(Registrations)
Adobe Analytics Report Builder
EVALUATION
Increase Downloads
Increase Organic Search Tool Downloads by X% by 1/2016
Organic Search Downloads
Metric = Goal 10 (Download) CompletionsMedium = OrganicCountry = USA
Jan 2016: X,XXX(Organic Search Downloads)
Adobe Analytics Report Builder
PURCHASE
Increase Revenues
Increase Organic Search Revenues/Orders by 20% by 1/2016
Organic Search Revenues/Orders
Metric = Order Revenues (Not product revenues which don’t exclude the Discount)Medium = OrganicCountry = USA
Jan 2016: $XX,XXX(Organic Search Revenues)
Google Analytics www.domain.com View
RETENTION
Increase Repeat Purchases
Increase Repeat Purchases by 20% by 1/2016
Repeat Purchase Revenues
Metric = Existing Customer Order Revenues Medium = AllCountry = USA
Jan 2016: $XXXXX(Existing Customer Order Revenues)
Google Analytics www.domain.com View
AFFINITY
Improve Customer Advocacy
Increase Customer Sharing by 20% by 1/2016
Social Shares (Likes, Pins, +1s, Emails, etc)
Metric = Share Visits Medium = ReferralCountry = USA
Jan 2016: 300,000(Share Visits)
Google Analytics www.domain.com View
INTEREST
Improve Share of Mind
Increase Newsletter Signups by 5% by 1/2016
Newsletter Signups
Metric = Newsletter Signup VisitsMedium = OrganicCountry = USA
Jan 2016: X(Signups)
Adobe Analytics Report Builder
AWARENESS
Build Brand Awareness
Increase (7) Content Group Organic Visits by 20% by 1/2016
(1) X, (2) X, (3) X, (4) X Content Group Organic Visits
Metric = LP Visits to X Content Group PagesMedium = OrganicCountry = USA
Jan 2016: 300,000(Organic Search Visits)
Google Analytics www.domain.com View
Digital Measurement FrameworkEvolve

INTEREST
Increase Account Registrations
Increase Organic Search Registrations by X% by 1/2016
Organic Search Registrations
Metric = Goal 16 (Registrations) CompletionsMedium = OrganicCountry = USA
Jan 2016: X(Registrations)
Adobe Analytics Report Builder
EVALUATION
Increase Downloads
Increase Organic Search Tool Downloads by X% by 1/2016
Organic Search Downloads
Metric = Goal 10 (Download) CompletionsMedium = OrganicCountry = USA
Jan 2016: X,XXX(Organic Search Downloads)
Adobe Analytics Report Builder
PURCHASE
Increase Revenues
Increase Organic Search Revenues/Orders by 20% by 1/2016
Organic Search Revenues/Orders
Metric = Order Revenues (Not product revenues which don’t exclude the Discount)Medium = OrganicCountry = USA
Jan 2016: $XX,XXX(Organic Search Revenues)
Google Analytics www.domain.com View
RETENTION
Increase Repeat Purchases
Increase Repeat Purchases by 20% by 1/2016
Repeat Purchase Revenues
Metric = Existing Customer Order Revenues Medium = AllCountry = USA
Jan 2016: $XXXXX(Existing Customer Order Revenues)
Google Analytics www.domain.com View
AFFINITY
Improve Customer Advocacy
Increase Customer Sharing by 20% by 1/2016
Social Shares (Likes, Pins, +1s, Emails, etc)
Metric = Share Visits Medium = ReferralCountry = USA
Jan 2016: 300,000(Share Visits)
Google Analytics www.domain.com View
AWARENESS
Increase Search Visibility
Achieve 40+ New Top 3 Rankings for Target Content Themes by 1/2016
Top 10 Rankings
Ranking = Top 3 Keywords = 60 Target Keywords in Each of 5 ThemesMedium = OrganicSource = Google.comCountry = USA
Jan 2016: 40+ New Top 3 Rankings for Content Theme 1, 2, 3, 4, 5
Moz Ranking Data for www.domain.com
INTEREST
Improve Share of Mind
Increase Newsletter Signups by 5% by 1/2016
Newsletter Signups
Metric = Newsletter Signup VisitsMedium = OrganicCountry = USA
Jan 2016: X(Signups)
Adobe Analytics Report Builder
AWARENESS
Build Brand Awareness
Increase (7) Content Group Organic Visits by 20% by 1/2016
(1) X, (2) X, (3) X, (4) X Content Group Organic Visits
Metric = LP Visits to X Content Group PagesMedium = OrganicCountry = USA
Jan 2016: 300,000(Organic Search Visits)
Google Analytics www.domain.com View
Digital Measurement FrameworkEvolve

Avoid Goal Setting Pitfalls
- PART 2 -

Goal Setting Pitfall- #1 -
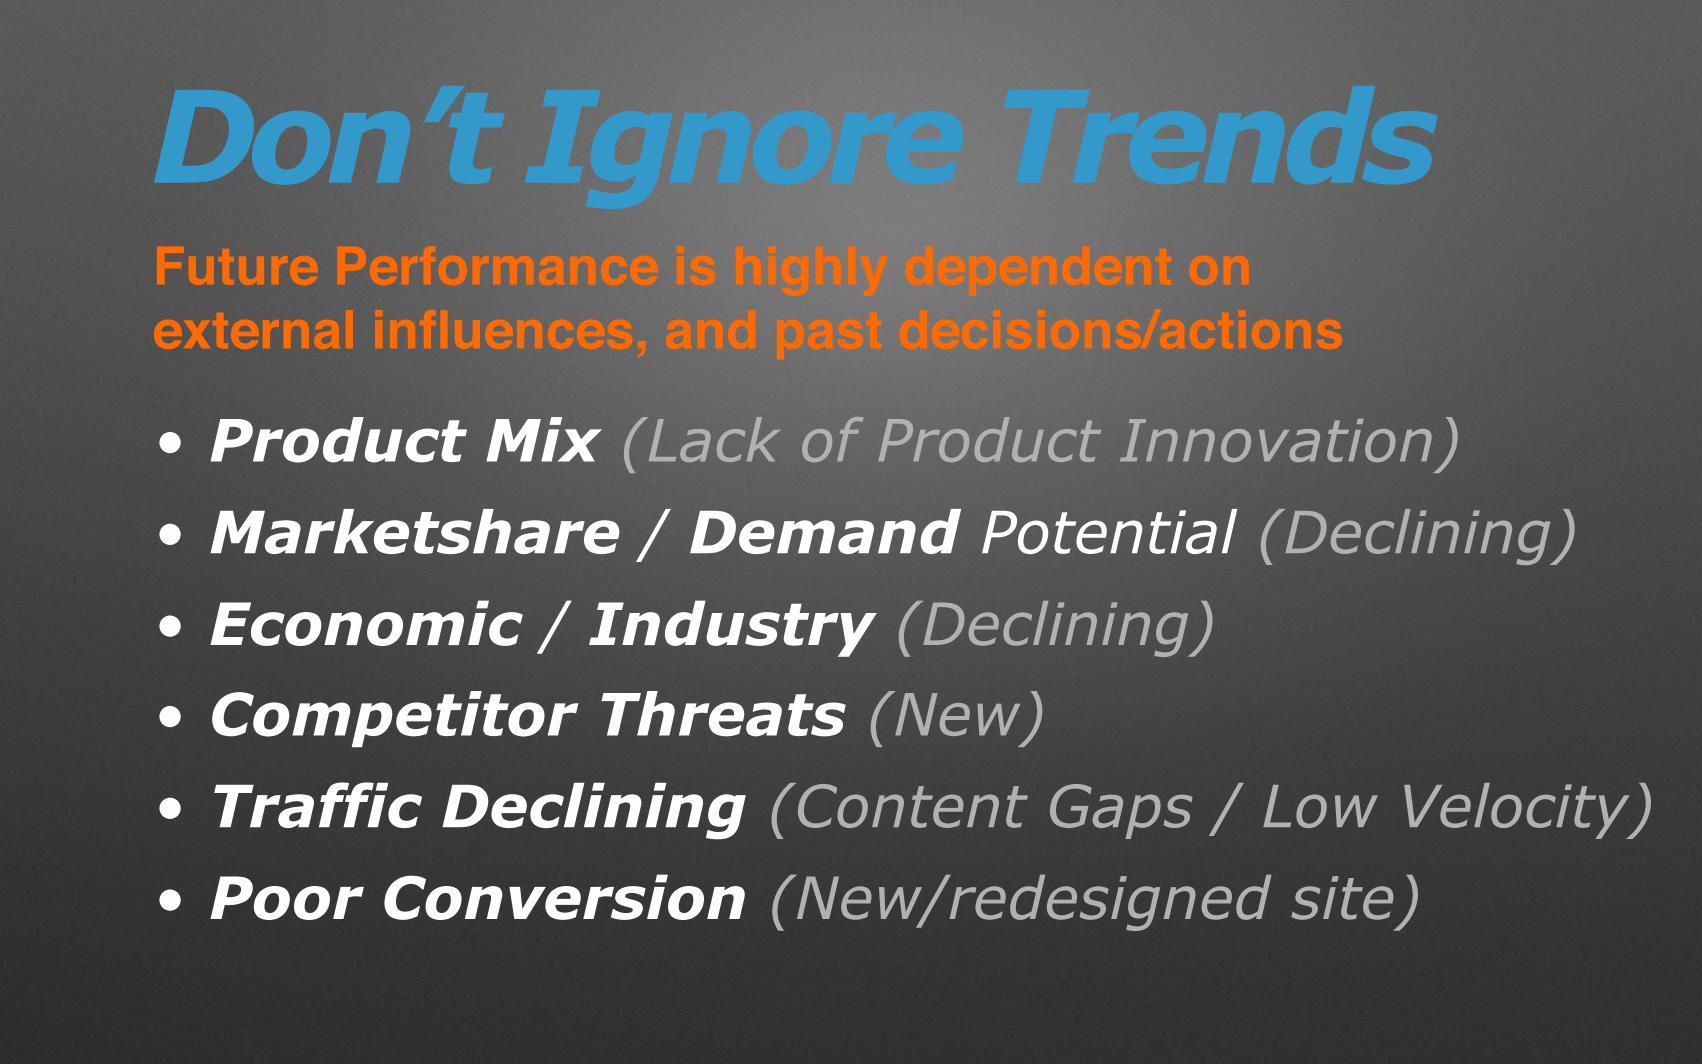
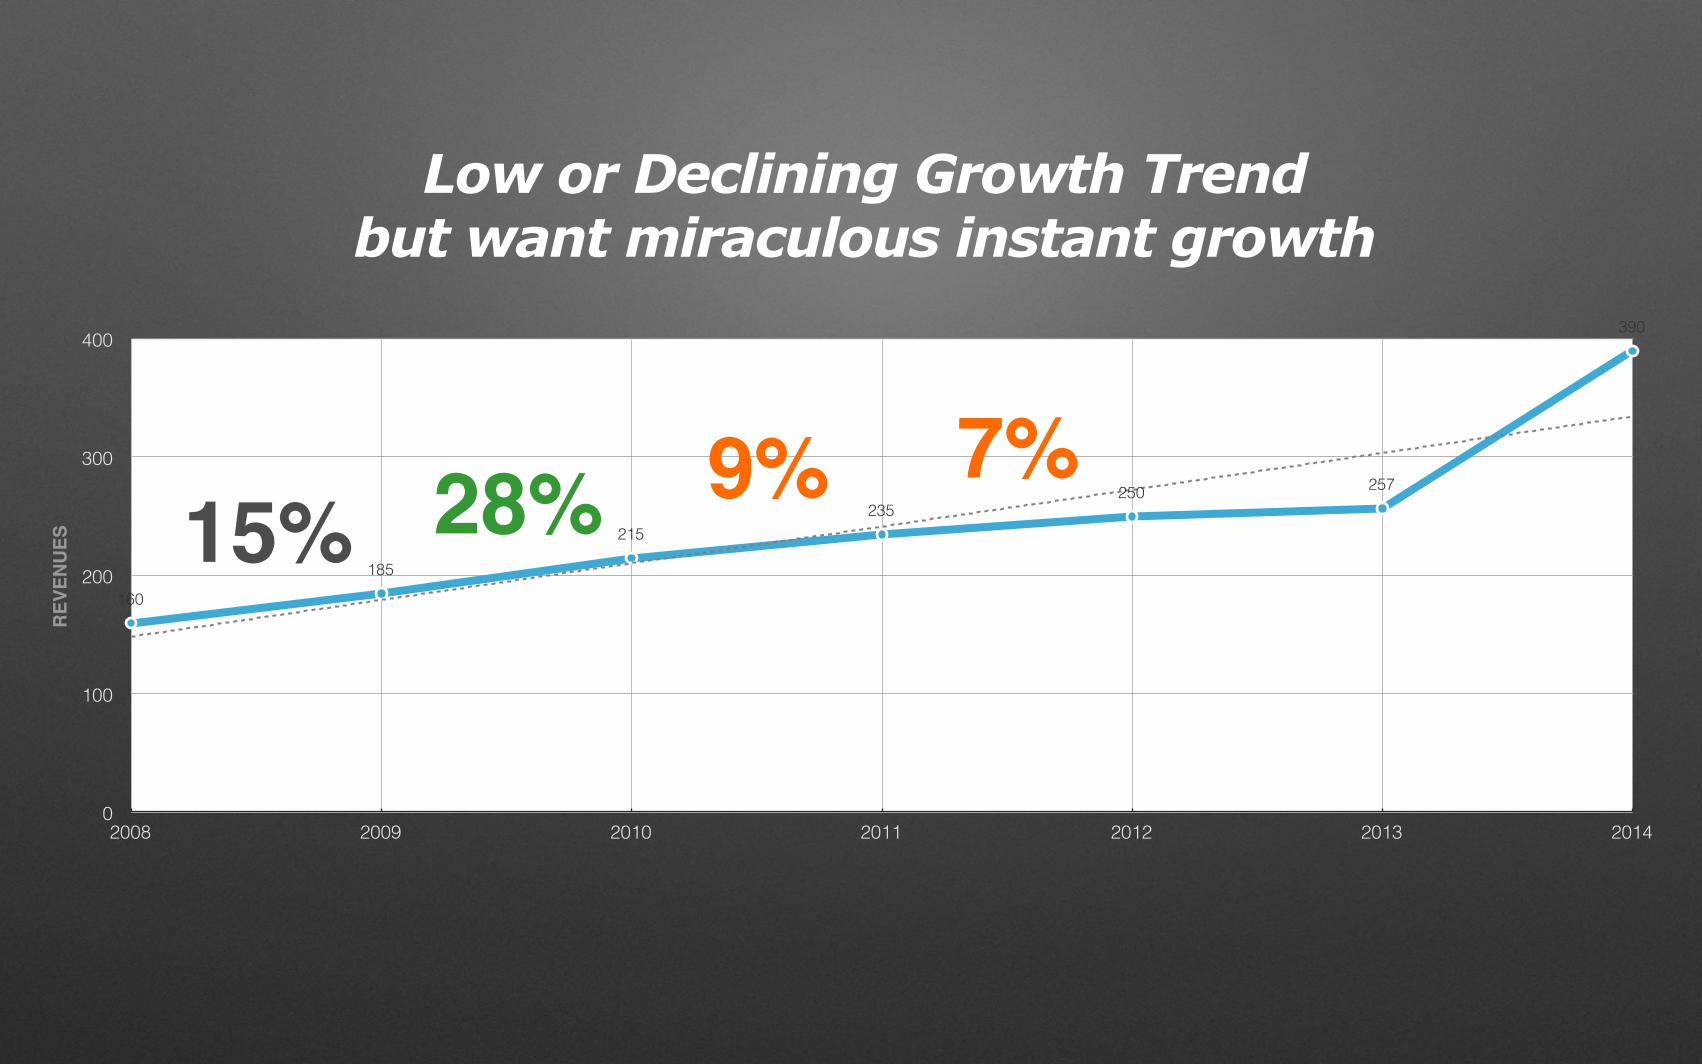
Don’t Ignore Trends
• Product Mix (Lack of Product Innovation)• Marketshare / Demand Potential (Declining)• Economic / Industry (Declining)• Competitor Threats (New)• Traffic Declining (Content Gaps / Low Velocity)• Poor Conversion (New/redesigned site)
Future Performance is highly dependent on external influences, and past decisions/actions

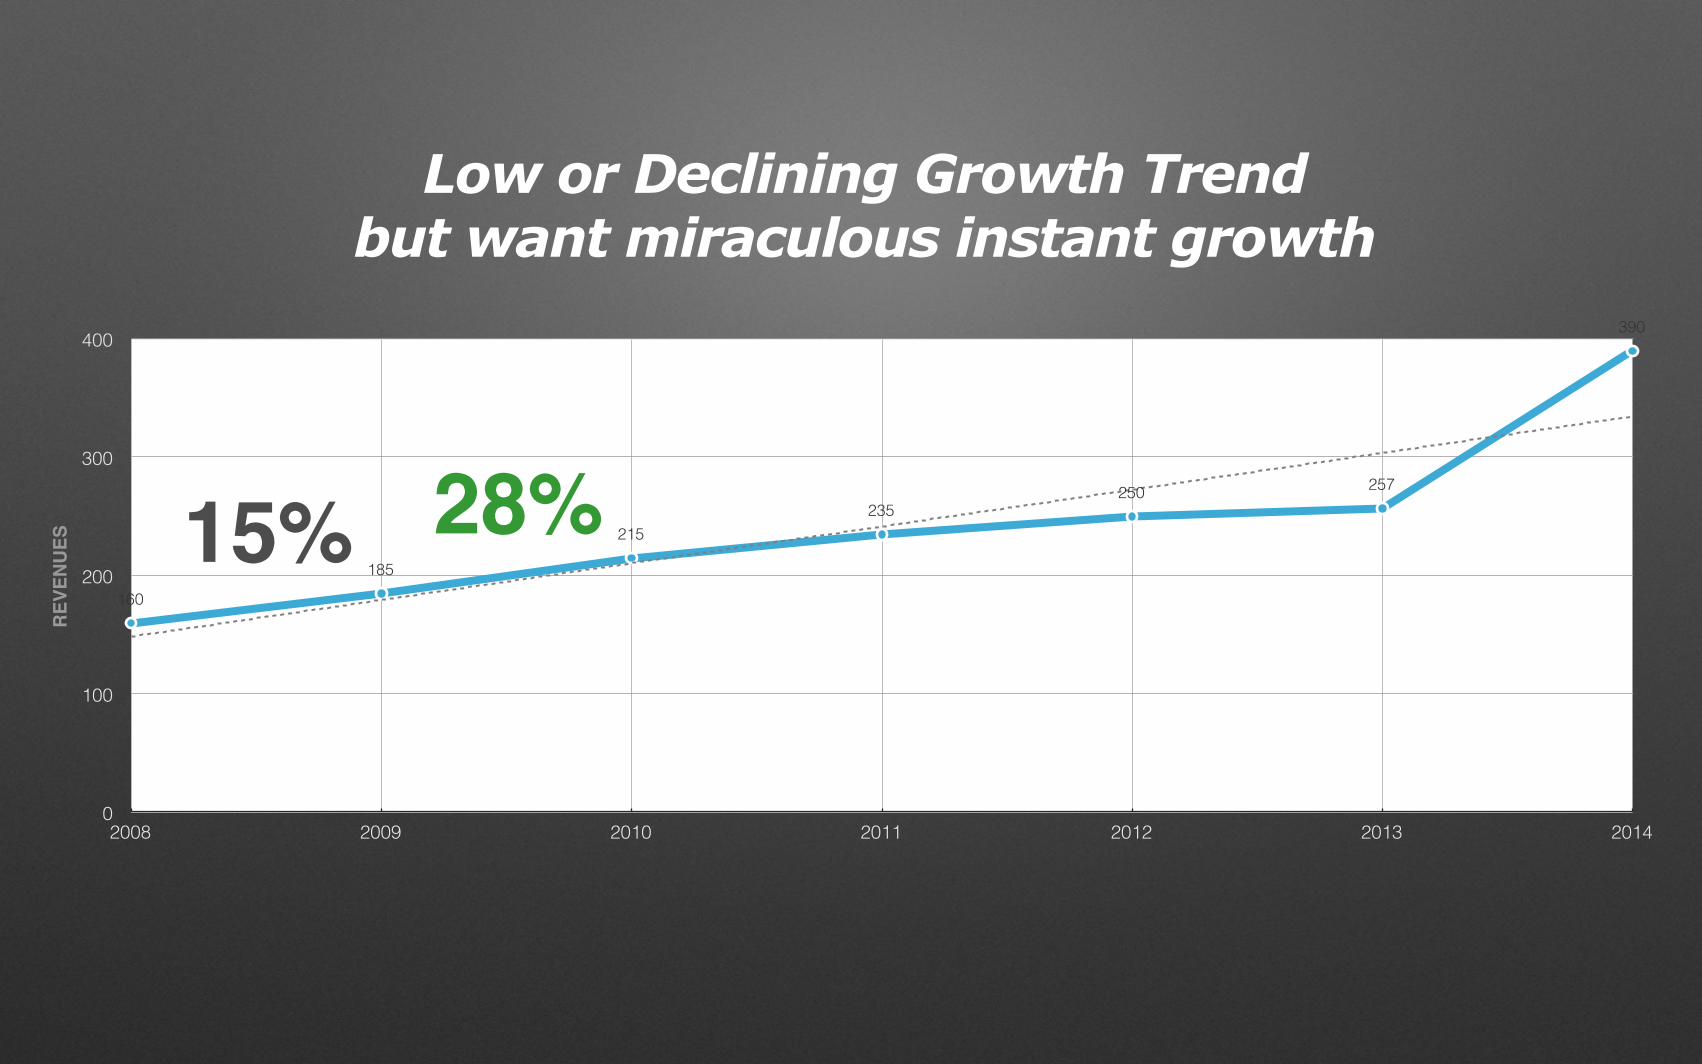
0
100
200
300
400
2008 2009 2010 2011 2012 2013 2014
160
185
215235
250 257
390
REV
ENU
ES 15%
Low or Declining Growth Trendbut want miraculous instant growth
0
100
200
300
400
2008 2009 2010 2011 2012 2013 2014
160
185
215235
250 257
390
REV
ENU
ES 15% 28%
Low or Declining Growth Trendbut want miraculous instant growth
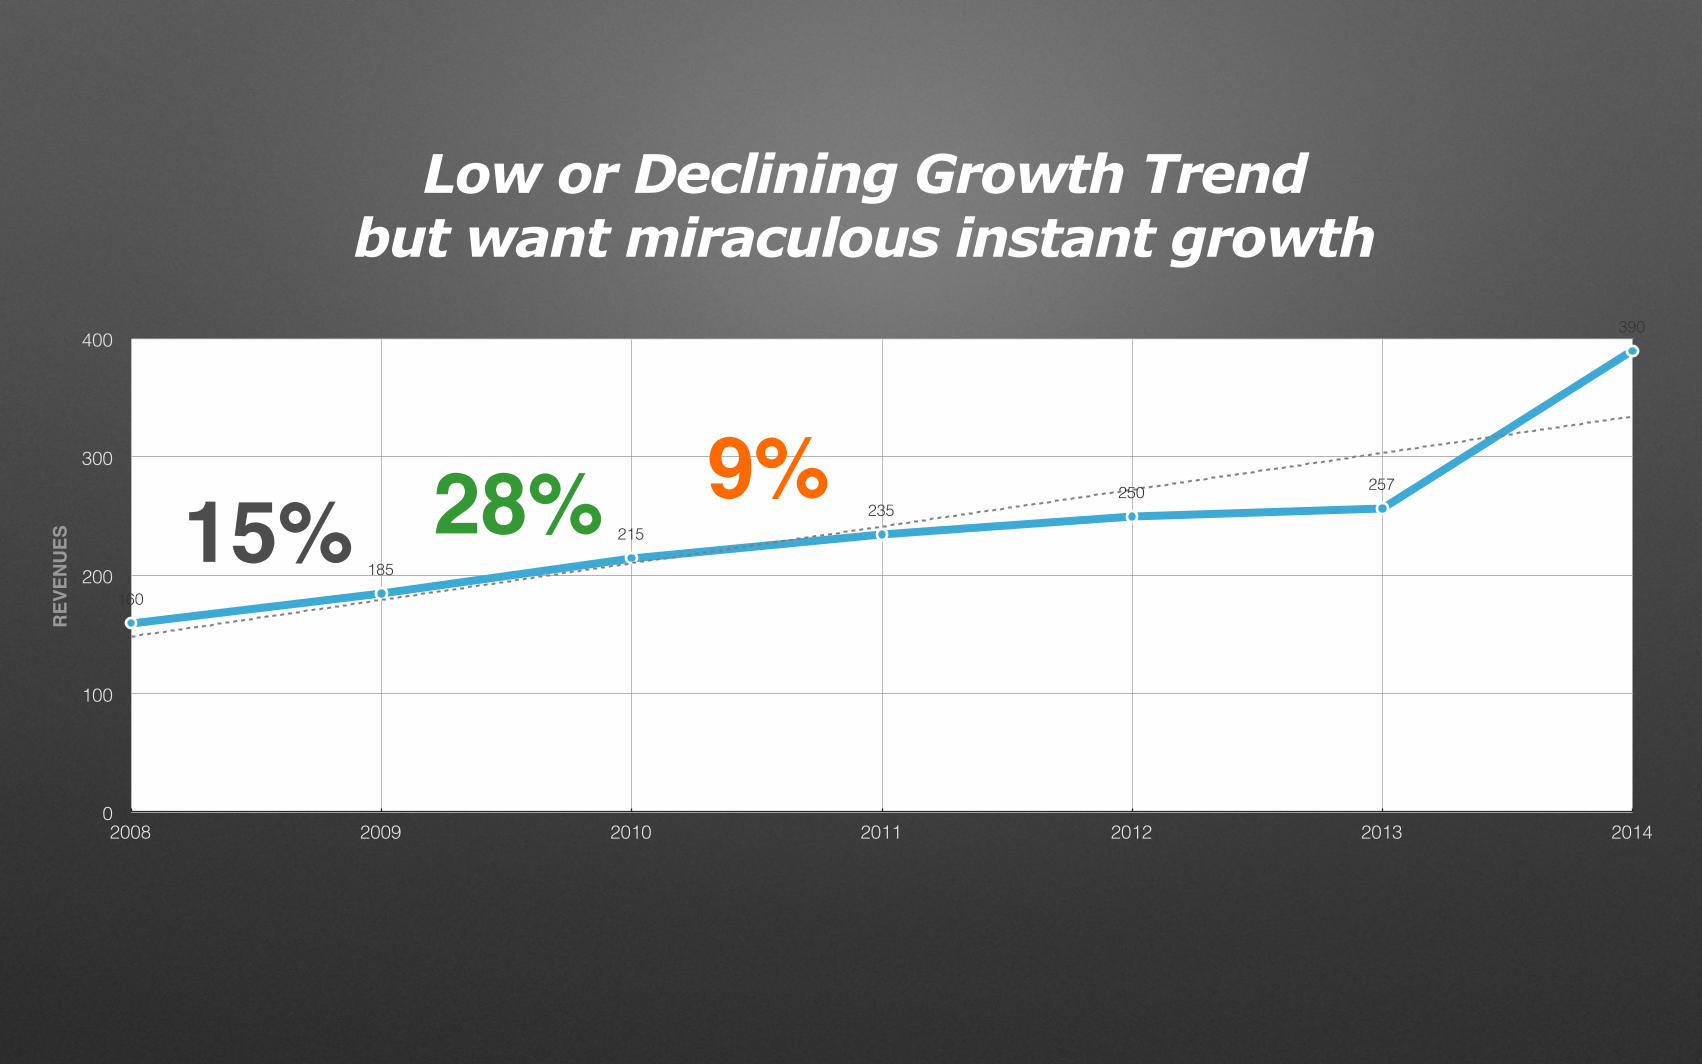
0
100
200
300
400
2008 2009 2010 2011 2012 2013 2014
160
185
215235
250 257
390
REV
ENU
ES 15% 28% 9%
Low or Declining Growth Trendbut want miraculous instant growth
0
100
200
300
400
2008 2009 2010 2011 2012 2013 2014
160
185
215235
250 257
390
REV
ENU
ES 15% 28% 9% 7%
Low or Declining Growth Trendbut want miraculous instant growth

0
100
200
300
400
2008 2009 2010 2011 2012 2013 2014
160
185
215235
250 257
390
REV
ENU
ES 15% 28% 9% 7% 3%
Low or Declining Growth Trendbut want miraculous instant growth

0
100
200
300
400
2008 2009 2010 2011 2012 2013 2014
160
185
215235
250 257
390
REV
ENU
ES 15% 28% 9% 7% 3%
Low or Declining Growth Trendbut want miraculous instant growth
50%

0
100
200
300
400
2008 2009 2010 2011 2012 2013 2014
160
185
215235
250 257
390
REV
ENU
ES 15% 28% 9% 7% 3%
Highly unlikely without Dramatic Changes & Investment
50% X
0
75
150
225
300
2008 2009 2010 2011 2012 2013 2014
160
185
215
235250 257
272
REV
ENU
ES
15% 28% 9% 7% 3%
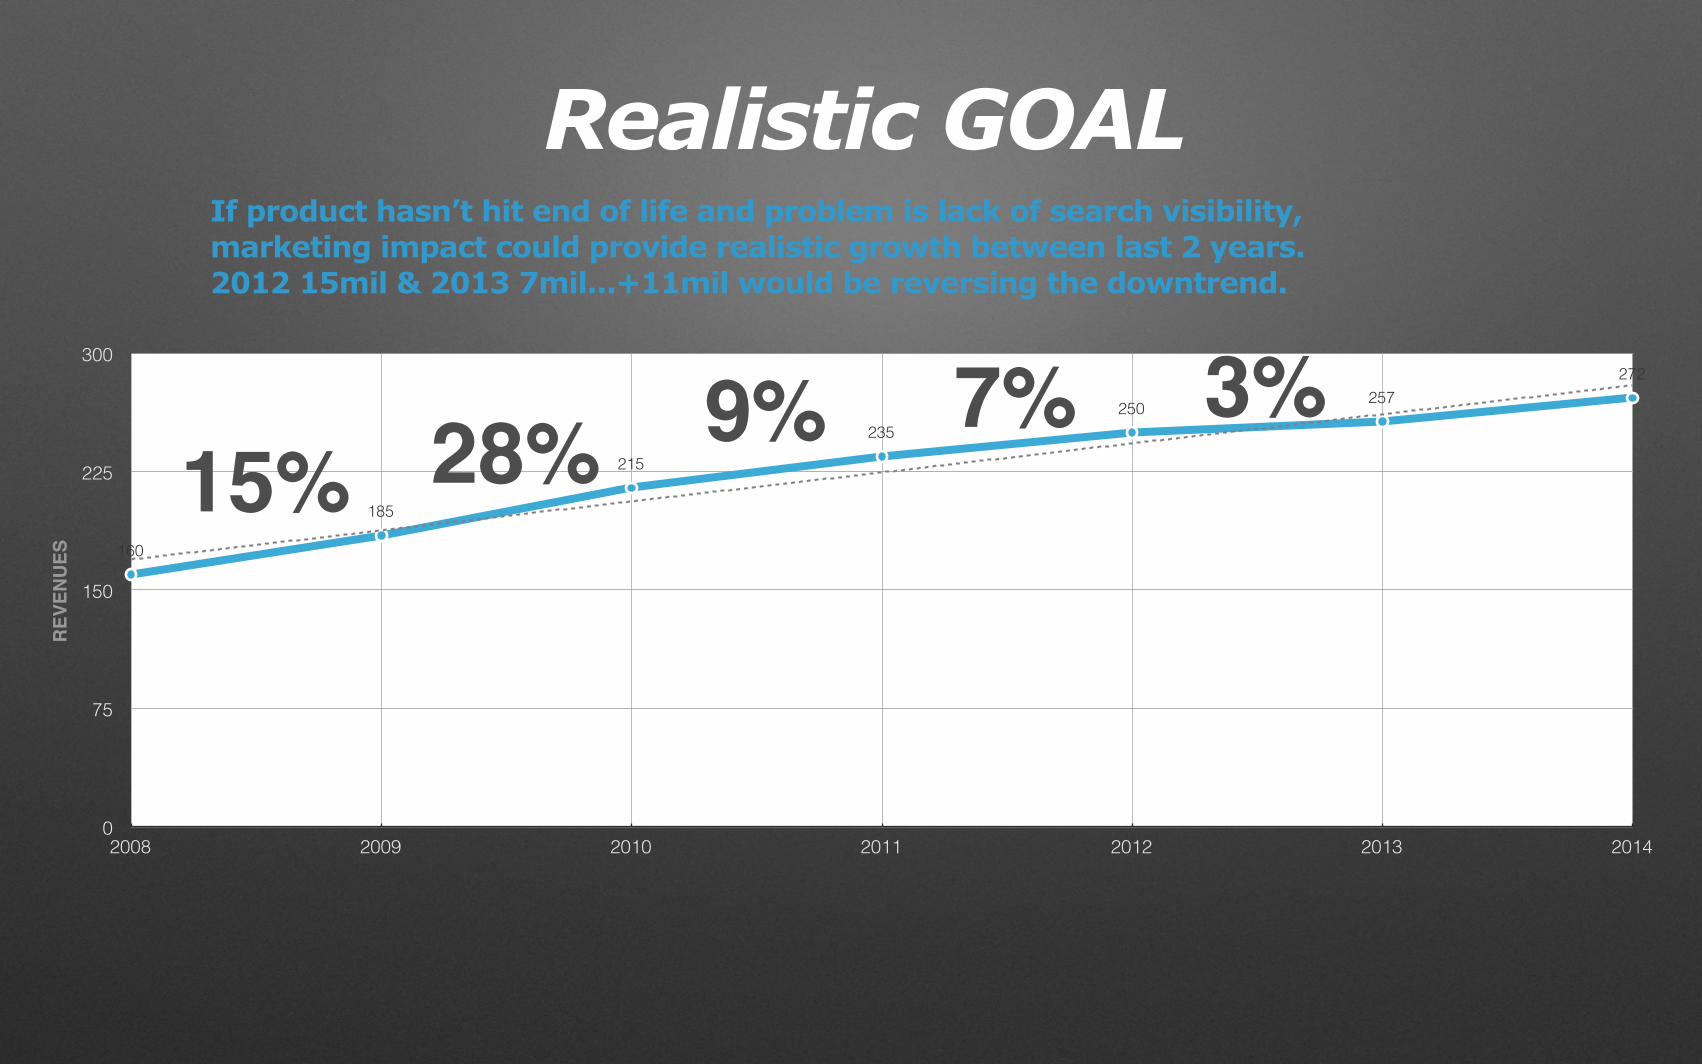
If product hasn’t hit end of life and problem is lack of search visibility, marketing impact could provide realistic growth between last 2 years. 2012 15mil & 2013 7mil...+11mil would be reversing the downtrend.
Realistic GOAL

0
75
150
225
300
2008 2009 2010 2011 2012 2013 2014
160
185
215
235250 257
272
REV
ENU
ES
15% 28% 9% 7% 3% ✓6% If product hasn’t hit end of life and problem is lack of search visibility, marketing impact could provide realistic growth between last 2 years. 2012 15mil & 2013 7mil...+11mil would be reversing the downtrend.
Realistic GOAL

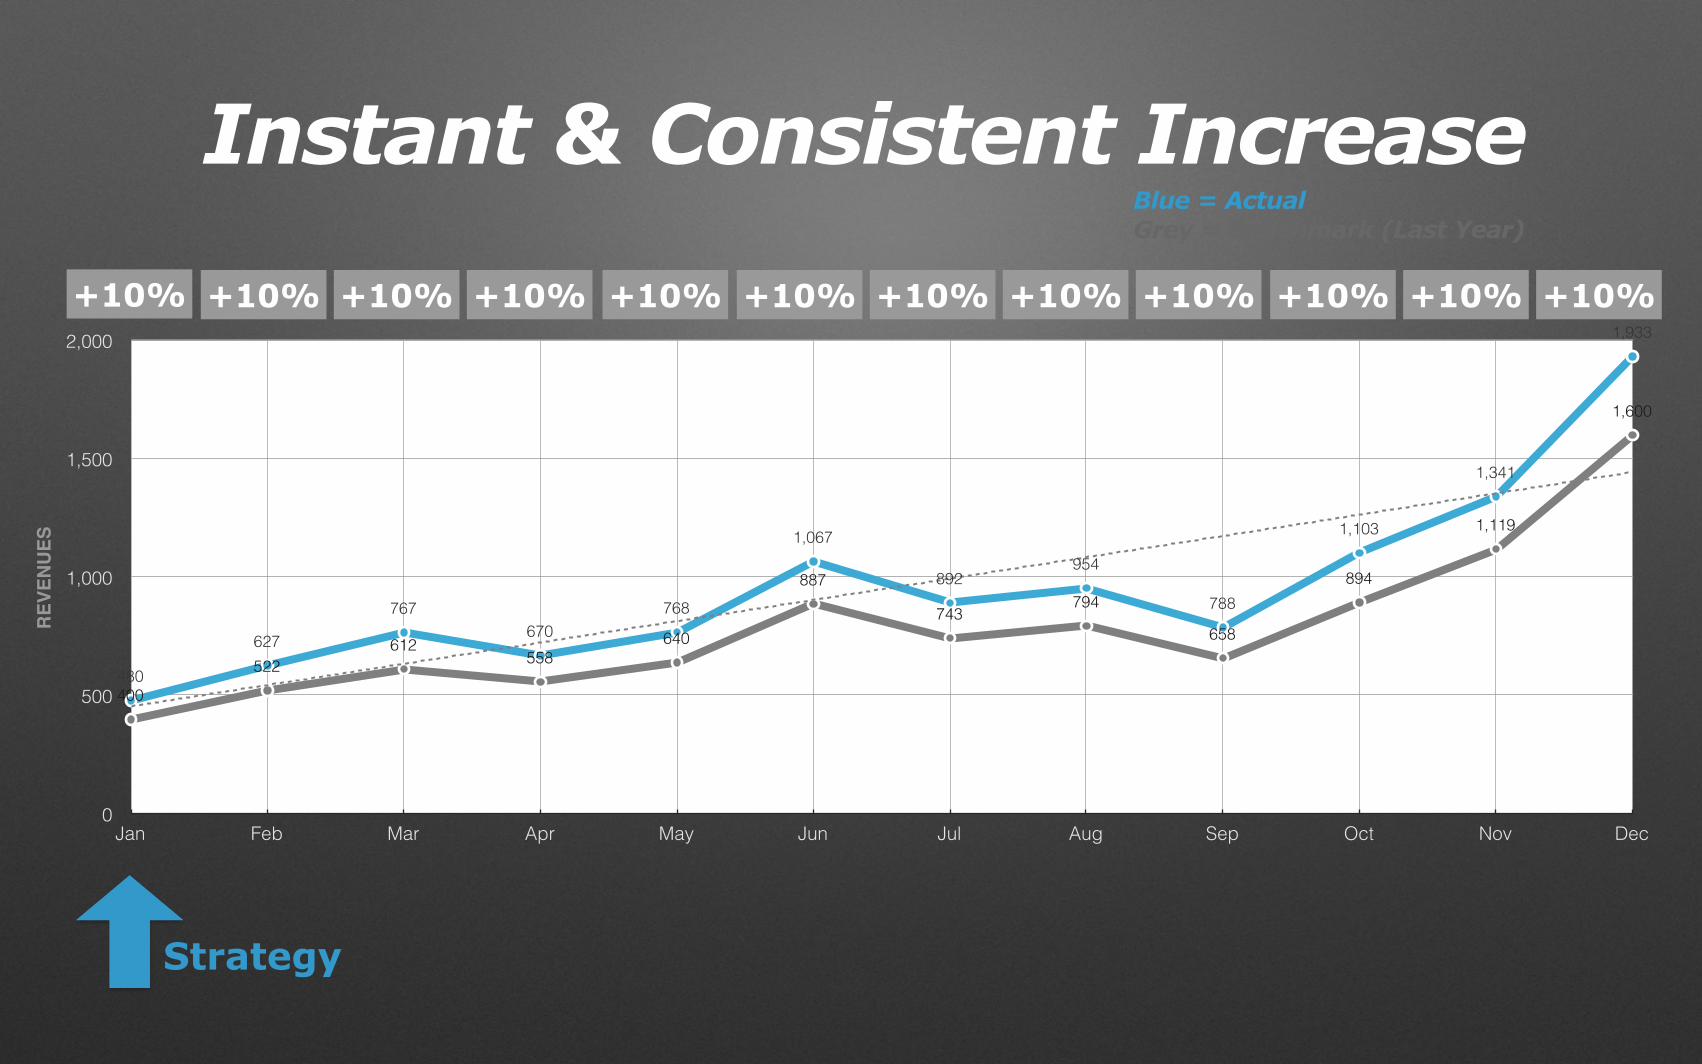
Goal Setting Pitfall- #2 -

0
500
1,000
1,500
2,000
Jan Feb Mar Apr May Jun Jul Aug Sep Oct Nov Dec
400
522612
558640
887
743794
658
894
1,119
1,600
480
627
767670
768
1,067
892954
788
1,103
1,341
1,933
REV
ENU
ES
+10% +10% +10% +10% +10% +10% +10% +10% +10% +10% +10% +10%
Instant & Consistent IncreaseBlue = ActualGrey = Benchmark (Last Year)
0
500
1,000
1,500
2,000
Jan Feb Mar Apr May Jun Jul Aug Sep Oct Nov Dec
400
522612
558640
887
743794
658
894
1,119
1,600
480
627
767670
768
1,067
892954
788
1,103
1,341
1,933
REV
ENU
ES
Strategy
+10% +10% +10% +10% +10% +10% +10% +10% +10% +10% +10% +10%
Instant & Consistent IncreaseBlue = ActualGrey = Benchmark (Last Year)

0
500
1,000
1,500
2,000
Jan Feb Mar Apr May Jun Jul Aug Sep Oct Nov Dec
400
522612
558640
887
743794
658
894
1,119
1,600
480
627
767670
768
1,067
892954
788
1,103
1,341
1,933
REV
ENU
ES
Strategy
+10% +10% +10% +10% +10% +10% +10% +10% +10% +10% +10% +10%
Instant & Consistent Increase
Tactical Implementation
Blue = ActualGrey = Benchmark (Last Year)
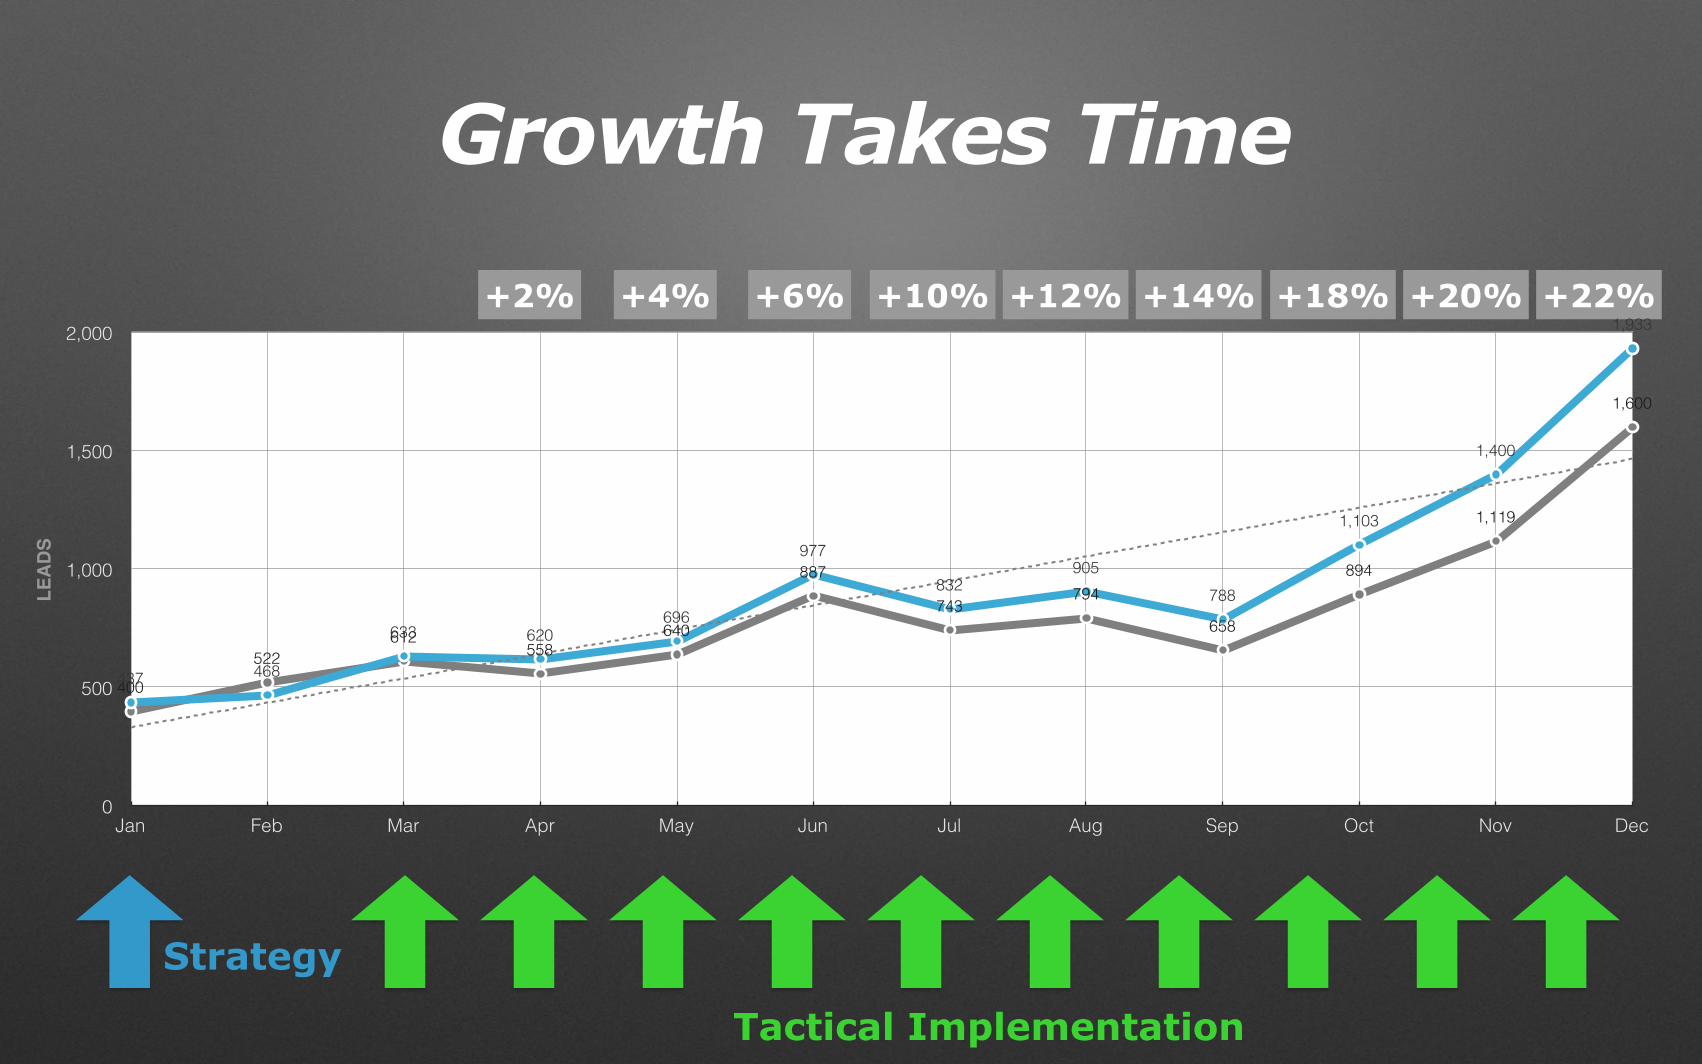
Strategy
Tactical Implementation
+2% +4% +6% +10% +12% +14% +18% +20% +22%
Growth Takes Time
0
500
1,000
1,500
2,000
Jan Feb Mar Apr May Jun Jul Aug Sep Oct Nov Dec
400
522612
558640
887
743794
658
894
1,119
1,600
437 468
633 620696
977
832905
788
1,103
1,400
1,933
LEA
DS
Better Goal Monitoring & Analysis
- PART 3 -

Show Trajectory- Early -
0
500
1,000
1,500
2,000
Jan Feb Mar Apr May Jun Jul Aug Sep Oct Nov Dec
400
522612
558640
887
743794
658
894
1,119
1,600
480
627
767LEA
DS
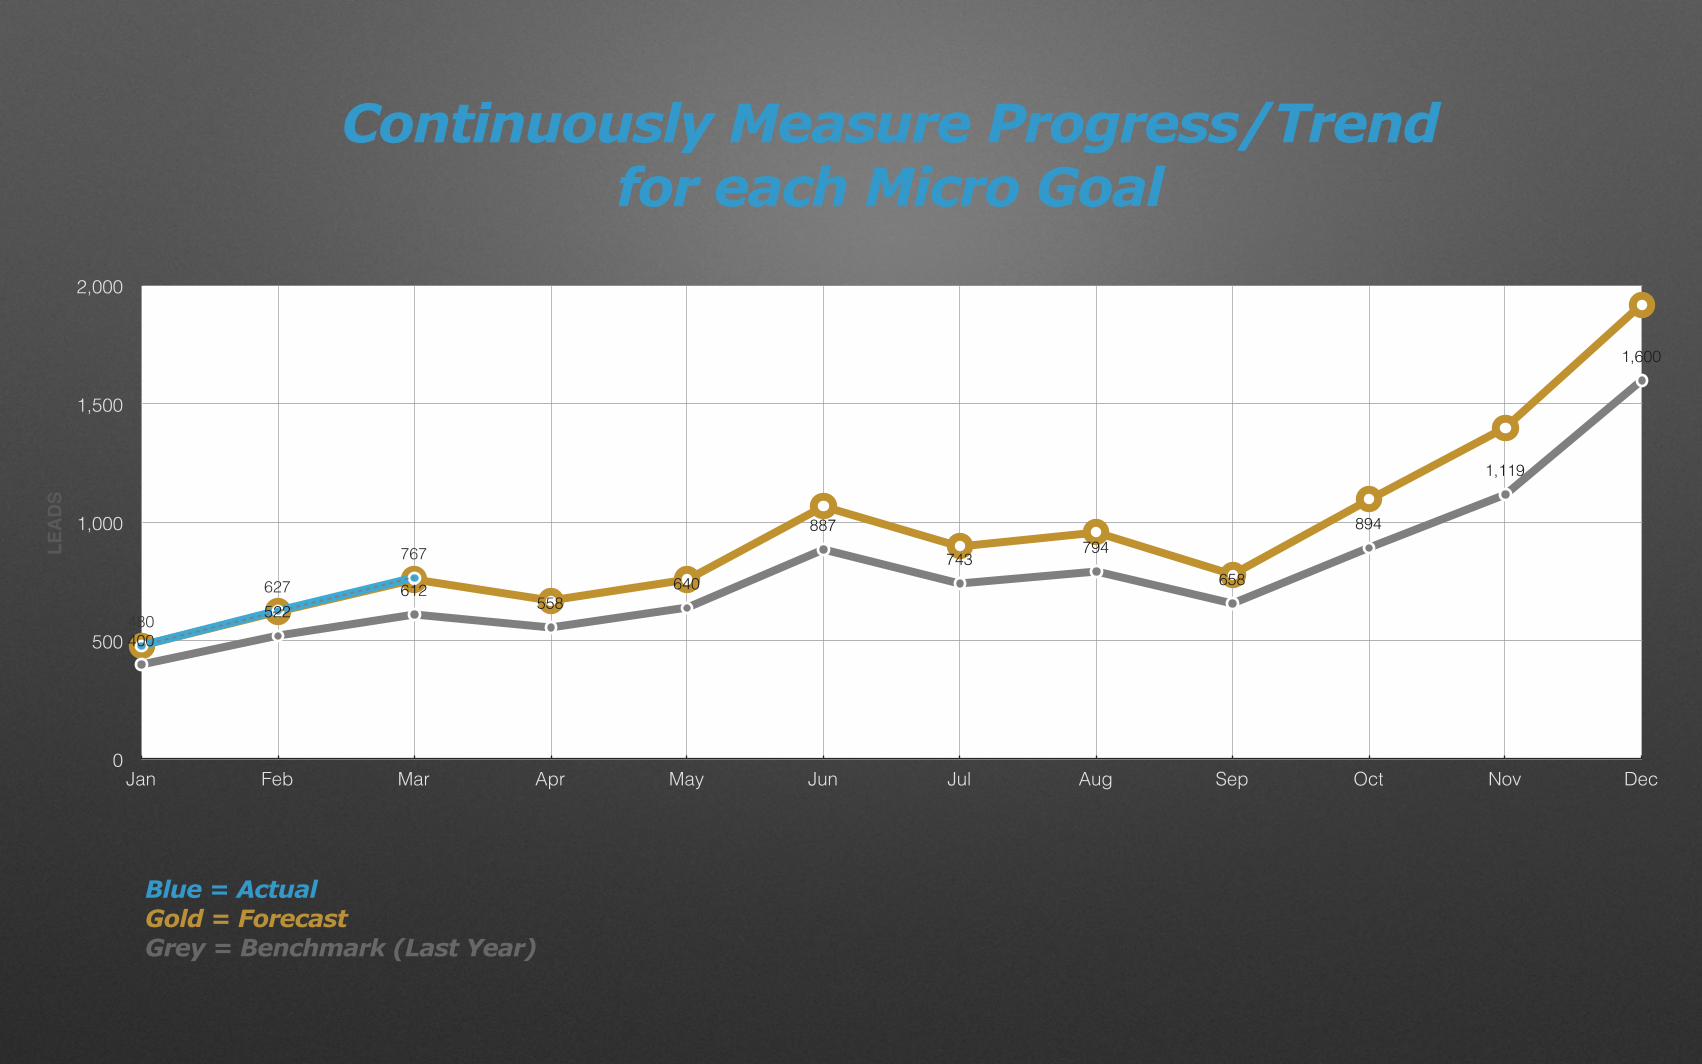
Continuously Measure Progress/Trendfor each Micro Goal
Blue = ActualGold = ForecastGrey = Benchmark (Last Year)

0
500
1,000
1,500
2,000
Jan Feb Mar Apr May Jun Jul Aug Sep Oct Nov Dec
400
522612
558640
887
743794
658
894
1,119
1,600
480
627
767670
LEA
DS
Continuously Measure Progress/Trendfor each Micro Goal

0
500
1,000
1,500
2,000
Jan Feb Mar Apr May Jun Jul Aug Sep Oct Nov Dec
400
522612
558640
887
743794
658
894
1,119
1,600
480
627
767670
768LEA
DS
Continuously Measure Progress/Trendfor each Micro Goal
Beware the Dip- Detect Early -
0
500
1,000
1,500
2,000
Jan Feb Mar Apr May Jun Jul Aug Sep Oct Nov Dec
400
522612
558640
887
743794
658
894
1,119
1,600
480
627
767670
768 755LEA
DS
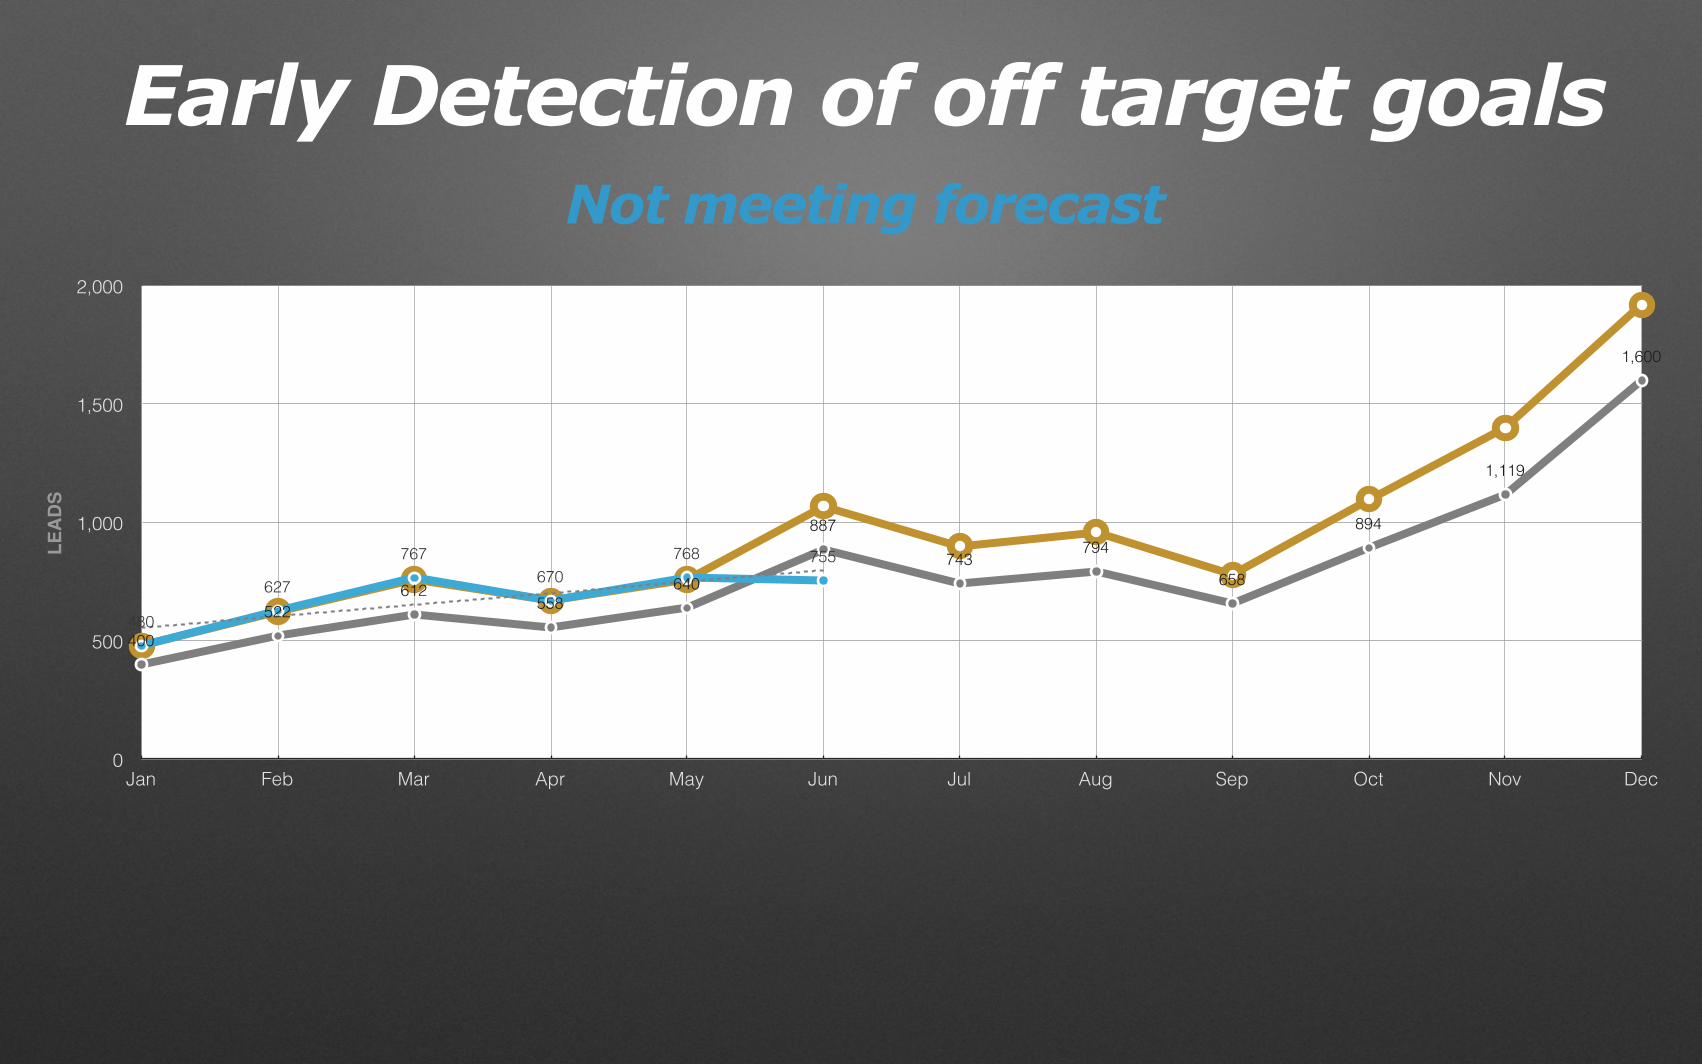
Not meeting forecast
Early Detection of off target goals

0
500
1,000
1,500
2,000
Jan Feb Mar Apr May Jun Jul Aug Sep Oct Nov Dec
400
522612
558640
887
743794
658
894
1,119
1,600
480
627
767670
768 755689
LEA
DS
Notify, request resources, implement solutionsRaise Alarm

0
500
1,000
1,500
2,000
Jan Feb Mar Apr May Jun Jul Aug Sep Oct Nov Dec
400
522612
558640
887
743794
658
894
1,119
1,600
480
627
767670
768 755689
850
LEA
DS
Get back on track

0
500
1,000
1,500
2,000
Jan Feb Mar Apr May Jun Jul Aug Sep Oct Nov Dec
400
522612
558640
887
743794
658
894
1,119
1,600
480
627
767670
768 755689
850800
1,111
LEA
DS
Get back on track

0
500
1,000
1,500
2,000
Jan Feb Mar Apr May Jun Jul Aug Sep Oct Nov Dec
400
522612
558640
887
743794
658
894
1,119
1,600
480
627
767670
768 755689
850800
1,111
1,555
2,000
LEA
DS
Get back on track

Actionable Reporting Tips
- PART 4 -
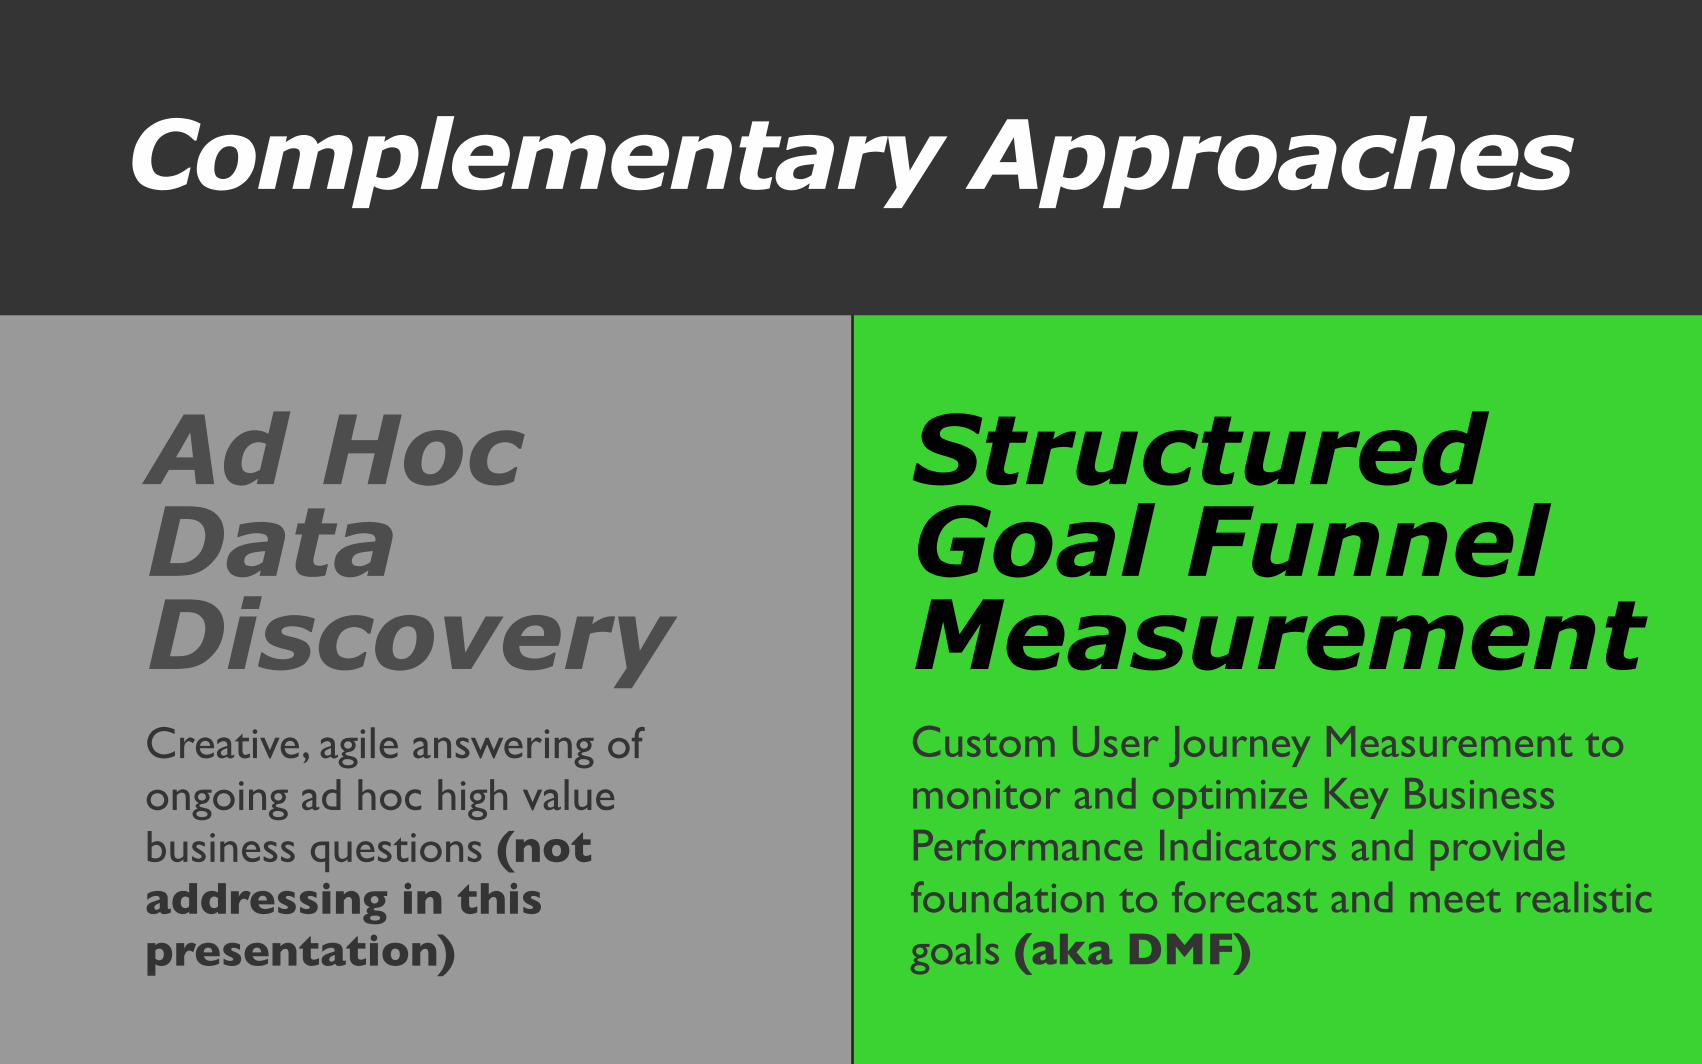
Ad Hoc Data Discovery
Structured Goal Funnel Measurement
Complementary Approaches
Custom User Journey Measurement to monitor and optimize Key Business Performance Indicators and provide foundation to forecast and meet realistic goals (aka DMF)
Creative, agile answering of ongoing ad hoc high value business questions (not addressing in this presentation)

Align with role
1Tip #

Digital Reporting by Role
Executive SimpleStrategy • Executive Report• Executive Dashboard
• Progress• Successes• Challenges• Trends
Who Focus Detail ReportsNeed
This is a conceptual visualization of the digital measurement reporting structure by role with the common reporting focus, level of detail, user needs and types of reports clarified at a high level. This is the starting point for reporting by role and can be highly customized to meet your exact needs.

Digital Reporting by Role
Executive SimpleStrategy • Executive Report• Executive Dashboard
• Progress• Successes• Challenges• Trends
Manager Tactics Moderate
• Digital Measurement Report• Department Reports*• Department Dashboards*• Ad Hoc Reports• Plus, Executive Reports
• Priorities• Insights• Interactive
Who Focus Detail ReportsNeed
Analyst Data/Analysis Complex
• Analyst Dashboards• Custom Reports• Data Exports• Intelligence Alerts • Data Source (UI) Access• Plus, Exec and Mgr Reports
• Detailed Data• Deep Dive
Analysis
Note: Department specific and other role reporting breakdowns, is optional, as necessaryThis is a conceptual visualization of the digital measurement reporting structure by role with the common reporting focus, level of detail, user needs and types of reports clarified at a high level. This is the starting point for reporting by role and can be highly customized to meet your exact needs.

Interactive & Automated
2Tip #
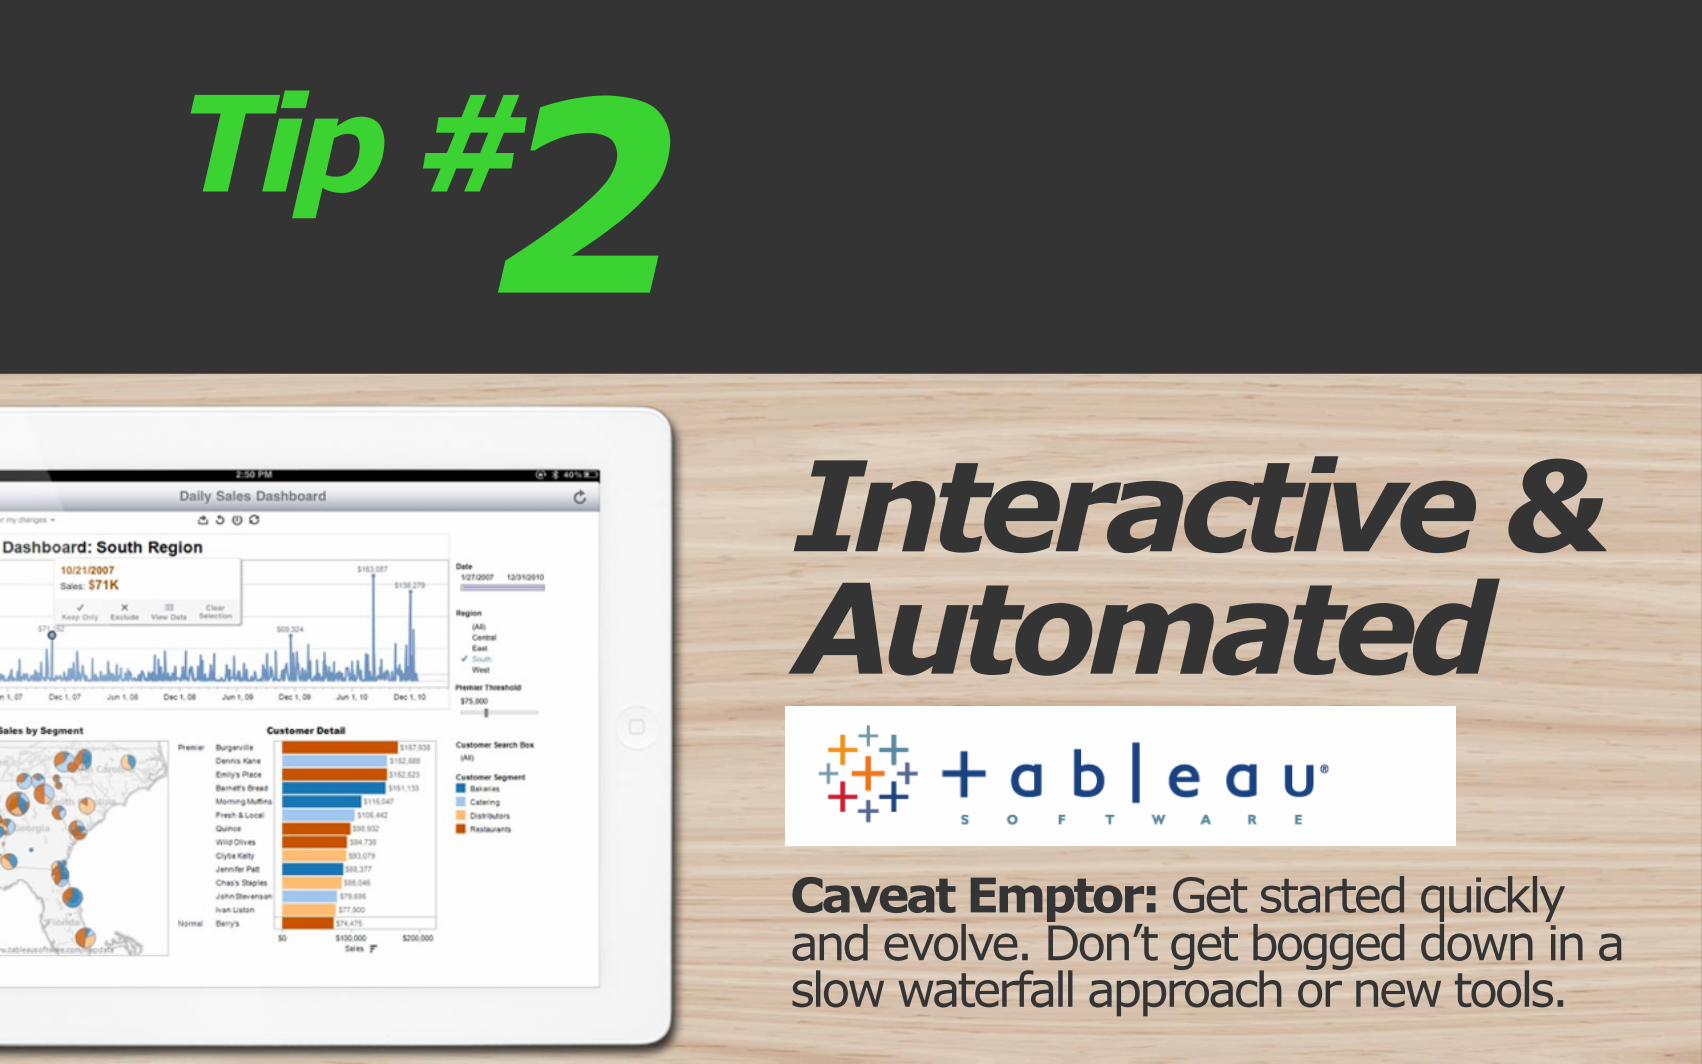
Interactive & Automated
2Tip #
Caveat Emptor: Get started quickly and evolve. Don’t get bogged down in a slow waterfall approach or new tools.
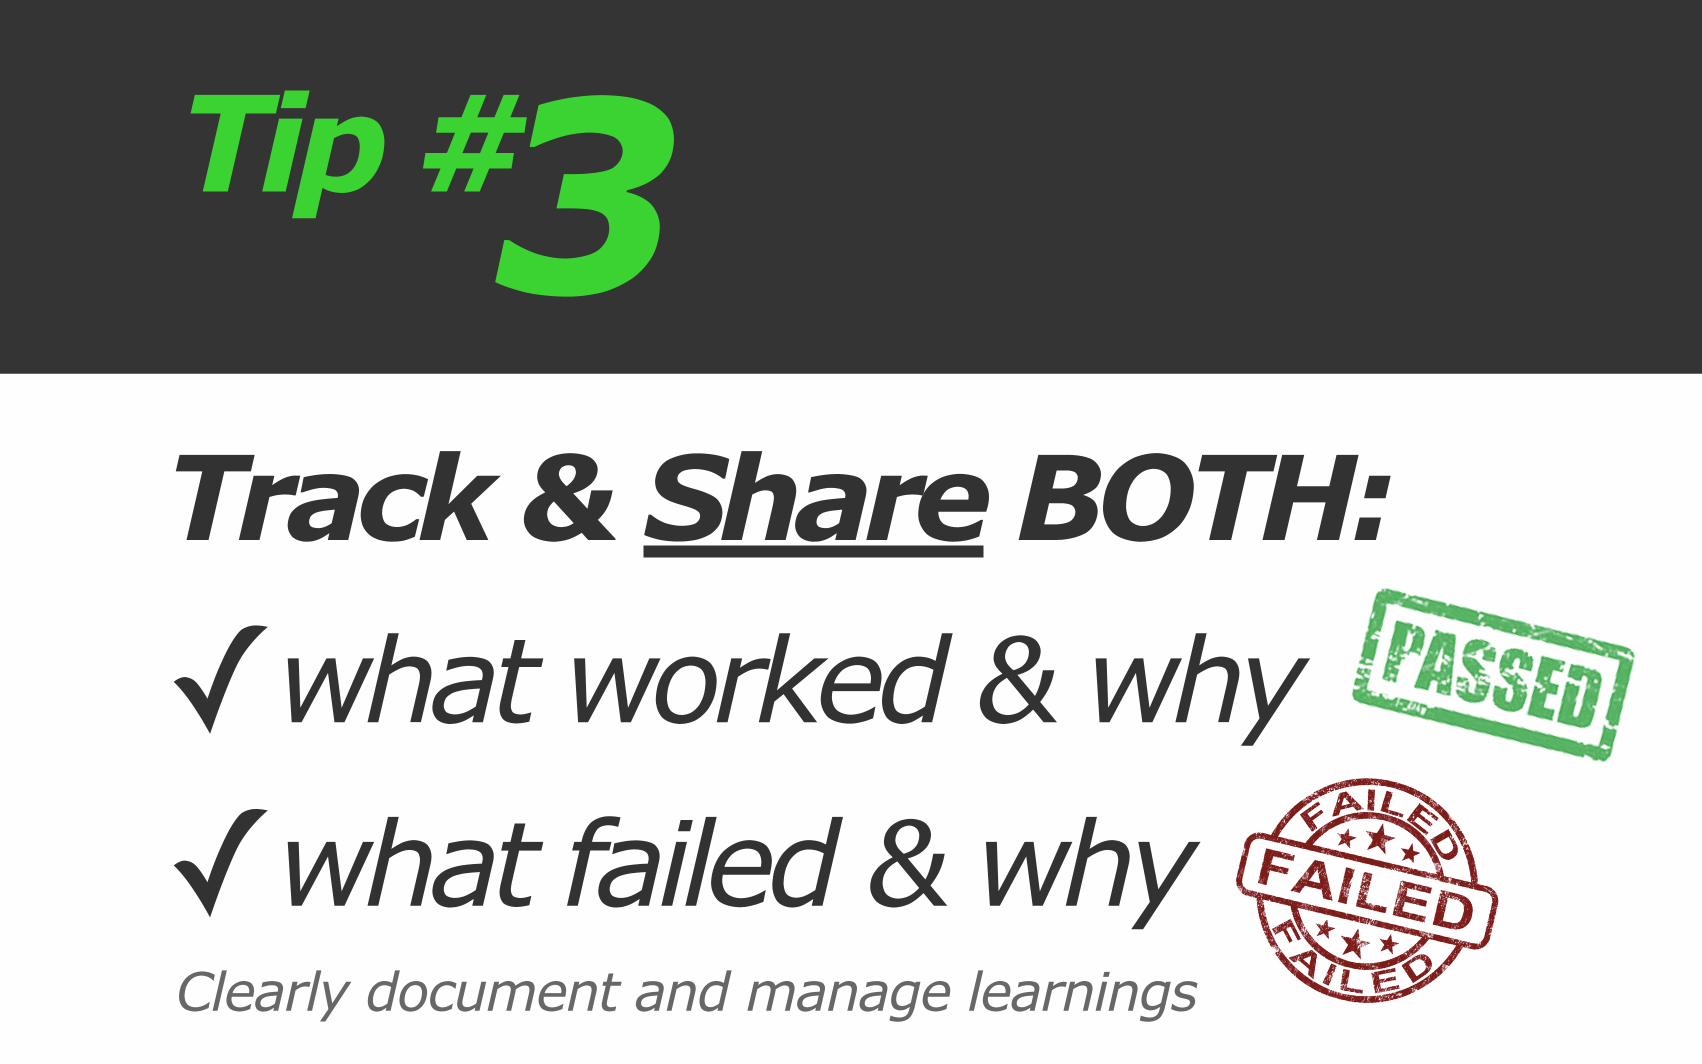
Track & Share BOTH: ✓what worked & why✓what failed & why
3Tip #
Clearly document and manage learnings

Keys to Success
1. User Centric2. Leading Indicators3. Realistic Goals

• Easier to manage
• Fosters team alignment & engagement
• Shines light on internal weaknesses & external threats
• Complete view of “problem” before tactical solutions
• Data driven priorities to maximize value of limited resources
• Setup to succeed & show incremental progress (ROAI)
• Get increased resources/budget based on results
GREAT Rewards

Be S.M.A.R.T. & K.I.S.S.
to be proactive and inform better decisions
GOAL!!!

Discovery (Research & Interviews)Provide Digital Measurement Framework (DMF) Draft (Objectives, Goals, KPIs, Segments)Iterate with Stakeholders to Refine/Customize DMFPerform Historical Performance Benchmarking & Forecast TargetsAdd Targets, Dates, Data to DMF & Make Goals S.M.A.R.T.Define Executive Level ReportingDefine Manager/Department/Role Level ReportingDefine Analyst Level Reporting(Optional) Define Custom DashboardsImplement Reporting (setup automated reporting, integrate data, and start preparing manual reports that include analysis and more)Reporting Initiation/Scheduling (initiate automated and manual delivery on specified frequency on monthly, weekly, daily and real-time as specified to specific roles/contacts as specified in report mapping)Evolve Reporting (adapt reporting as goals change, external factors change, analytics maturity matures, and level of digital marketing optimization increases. Typically, refine/change reporting annually or quarterly)
1
2
3
4
5
6
7
8
9
10
11
How to Get StartedTa
keaw
ay
Questions?
Kayden KellyCEO / Founder
Thank you...
@kaydenkelly

Phone (888) 252-7866 Email [email protected] www.blastam.com
Roseville Office6020 West Oaks Blvd, Suite 260
Rocklin, CA 95765
San Francisco Office625 Second Street, Suite 280
San Francisco, CA 94107
New York Office261 Madison Ave, 9th Floor
New York, NY 10016
Seattle Office500 Yale Avenue North
Seattle, WA 98109
Los Angeles Office7083 Hollywood Boulevard
Los Angeles, CA 90028