overendstudio.co.zaoverendstudio.co.za/websites/gold-fields-corporate... · gold fields is one of...
TRANSCRIPT
Report compiled by
Gold Fields
Investor CDP Information Request
CDP 2012
May 2012
Investor CDP 2011 Information Request
Table of Contents
Table of Contents
0. Introduction ..................................................................................................................................... i
1. Governance ..................................................................................................................................... 1
2. Strategy ........................................................................................................................................... 4
3. Targets and Initiatives ................................................................................................................... 12
4. Communications ........................................................................................................................... 37
5. Climate Change Risk ...................................................................................................................... 38
6. Climate Change Opportunities ...................................................................................................... 65
7. Emissions Methodology ................................................................................................................ 85
8. Emissions Data .............................................................................................................................. 88
9. Scope 1 Emissions Breakdown ...................................................................................................... 91
10. Scope 2 Emissions Breakdown .................................................................................................... 92
11. Scope 2 Contractual Emissions ................................................................................................... 93
12. Energy ......................................................................................................................................... 94
13. Emissions Performance ............................................................................................................... 94
14. Emissions Trading........................................................................................................................ 98
15. Scope 3 Emissions ..................................................................................................................... 100
Investor CDP 2011 Information Request
Introduction
i
0. Introduction This section is not included in CDP2012, but similar information will be collected on a page of the ORS prior to the start of the CDP 2012 questionnaire.
0.1 Introduction Please give a general description and introduction to your organization. You are not required to give an introduction to your corporation, but please do so if you wish. Gold Fields is one of the world’s largest unhedged producers of gold with attributable, annualised production of 3.5 million gold equivalent ounces from eight operating mines in Australia, Ghana, Peru and South Africa. Gold Fields also has an extensive and diverse global growth pipeline with four major projects in resource development and feasibility. Gold Fields has total attributable gold equivalent Mineral Reserves of 80.6 million ounces and Mineral Resources of 217 million ounces. Gold Fields is listed on the JSE Limited (primary listing), the New York Stock Exchange (NYSE), NASDAQ Dubai Limited, Euronext in Brussels (NYX) and the Swiss Exchange (SWX).
Gold Fields is responsible for mining and concentrating the gold and copper at the operations, from where it is sent to be refined further at various refineries. These refineries are not under the sole
ownership of Gold Fields.
The location and nature of Gold Fields operations is as follows:
The South African operations are all underground mines: 1. KDC West & KDC East (26° 24’S and 27° 36’E)
2. Beatrix (28° 15’S and 26° 47’E) 3. South Deep (26º 25’ S and 27º 40’ E)
The Ghanaian operations are all open pit mines: 1. Tarkwa (5° 15’ N and 2° 00’ W)
2. Damang (5° 11’N and 1° 57’W)
The Australian operations are a combination of underground and open pit mines: 1. St Ives (31° 12’S and 121° 40’E)
2. Agnew (27° 55’S and 120° 42’E)
Cerro Corona is an open pit copper and gold mine located in Peru (6° 45’S and 78° 37’W)
Annual Report: http://www.goldfields.co.za/reports/ar_dec_2011/index.php
Investor CDP 2011 Information Request
Introduction
ii
Company Revenue for the period of 01 Jan 2010 – 31 Dec 2011: R41,877 million
ISIN number:
ZAE000018123
CUSIP number: 38059T106
SEDOL number:
6280215
0.2 Reporting Year Please state the start and end date of the year for which you are reporting data. Please refer to the guidance for more detail if:
• Different facilities have different reporting dates • If this is the first time the company responds to CDP • If the company has not submitted the three years prior to the current reporting year emission data to
CDP in previous responses (not necessary when the company is a SME) • If data from previous years need to be restated • If there is a change in your reporting year from years previously supplied to CDP (e.g. from reporting
calendar year to financial year) • If you do not have data to cover the entire reporting year
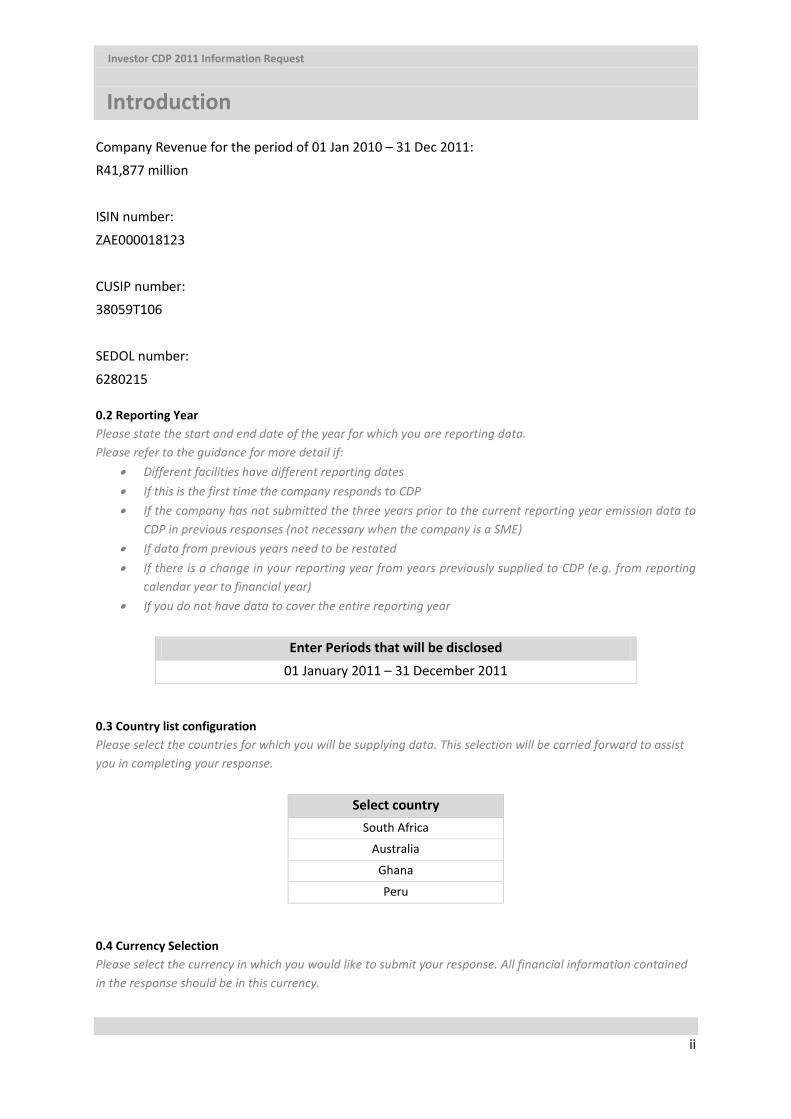
Enter Periods that will be disclosed
01 January 2011 – 31 December 2011
0.3 Country list configuration Please select the countries for which you will be supplying data. This selection will be carried forward to assist you in completing your response.
Select country South Africa
Australia
Ghana
Peru
0.4 Currency Selection Please select the currency in which you would like to submit your response. All financial information contained in the response should be in this currency.

Investor CDP 2011 Information Request
Introduction
iii
Select currency Rand (SA)

Investor CDP 2011 Information Request
Management
1
1. Governance
Group and Individual Responsibility
1.1 Where is the highest level of direct responsibility for climate change within your company? Individual/sub-set of the Board or other committee appointed by the board
1.1a: Please identify the position of the individual or name of the committee with this responsibility
Please use the text box to identify:
(i) the job title of the individual or name of the committee and;
(ii) a description of their / its position in the corporate structure
(i) Safety, Health and Sustainable Development Committee (SHSD Committee) (ii) The SHSD Committee is a Board subcommittee and reports it findings and recommendations
to the board for consideration and will review with the Board an appropriate response to such findings.
Individual Performance
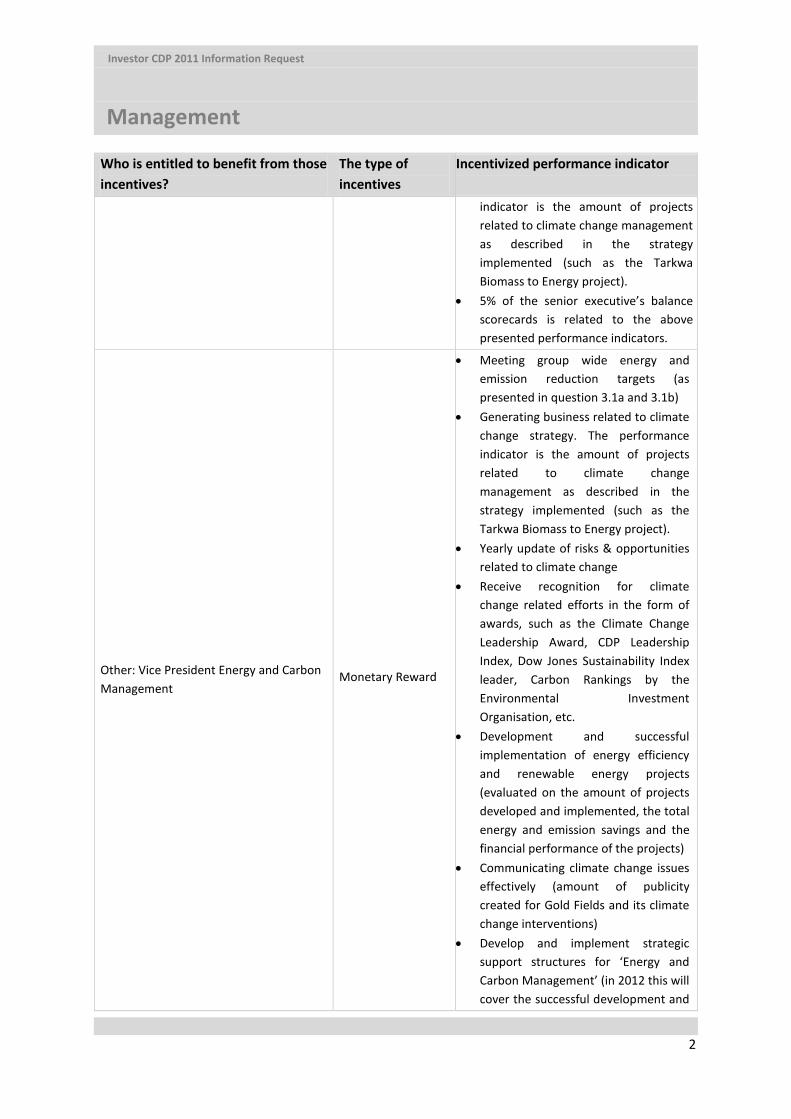
1.2 Do you provide incentives for the management of climate change issues, including the attainment of targets? Yes If yes: 1.2a Please complete the table (2,400 characters in column 3) Who is entitled to benefit from those incentives?
The type of incentives
Incentivized performance indicator
Corporate executive team Monetary Reward
• Receive recognition for climate change related efforts in the form of awards, such as the Climate Change Leadership Award, CDP Leadership Index, Dow Jones Sustainability Index leader, Carbon Rankings by the Environmental Investment Organisation, etc.
• Meeting group wide energy and emission reduction targets (as presented in question 3.1a and 3.1b)
• Generating business related to climate change strategy. The performance
Investor CDP 2011 Information Request
Management
2
Who is entitled to benefit from those incentives?
The type of incentives
Incentivized performance indicator
indicator is the amount of projects related to climate change management as described in the strategy implemented (such as the Tarkwa Biomass to Energy project).
• 5% of the senior executive’s balance scorecards is related to the above presented performance indicators.
Other: Vice President Energy and Carbon Management
Monetary Reward
• Meeting group wide energy and emission reduction targets (as presented in question 3.1a and 3.1b)
• Generating business related to climate change strategy. The performance indicator is the amount of projects related to climate change management as described in the strategy implemented (such as the Tarkwa Biomass to Energy project).
• Yearly update of risks & opportunities related to climate change
• Receive recognition for climate change related efforts in the form of awards, such as the Climate Change Leadership Award, CDP Leadership Index, Dow Jones Sustainability Index leader, Carbon Rankings by the Environmental Investment Organisation, etc.
• Development and successful implementation of energy efficiency and renewable energy projects (evaluated on the amount of projects developed and implemented, the total energy and emission savings and the financial performance of the projects)
• Communicating climate change issues effectively (amount of publicity created for Gold Fields and its climate change interventions)
• Develop and implement strategic support structures for ‘Energy and Carbon Management’ (in 2012 this will cover the successful development and
Investor CDP 2011 Information Request
Management
3
Who is entitled to benefit from those incentives?
The type of incentives
Incentivized performance indicator
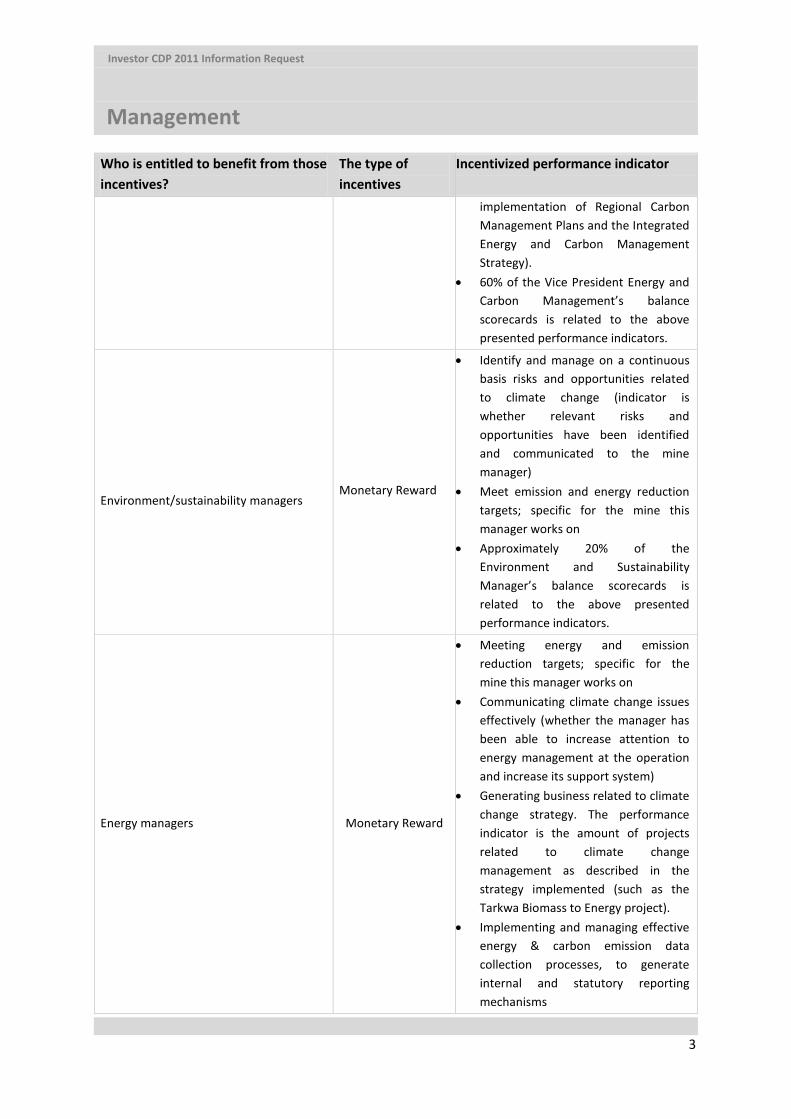
implementation of Regional Carbon Management Plans and the Integrated Energy and Carbon Management Strategy).
• 60% of the Vice President Energy and Carbon Management’s balance scorecards is related to the above presented performance indicators.
Environment/sustainability managers
Monetary Reward
• Identify and manage on a continuous basis risks and opportunities related to climate change (indicator is whether relevant risks and opportunities have been identified and communicated to the mine manager)
• Meet emission and energy reduction targets; specific for the mine this manager works on
• Approximately 20% of the Environment and Sustainability Manager’s balance scorecards is related to the above presented performance indicators.
Energy managers Monetary Reward
• Meeting energy and emission reduction targets; specific for the mine this manager works on
• Communicating climate change issues effectively (whether the manager has been able to increase attention to energy management at the operation and increase its support system)
• Generating business related to climate change strategy. The performance indicator is the amount of projects related to climate change management as described in the strategy implemented (such as the Tarkwa Biomass to Energy project).
• Implementing and managing effective energy & carbon emission data collection processes, to generate internal and statutory reporting mechanisms

Investor CDP 2011 Information Request
Management
4
Who is entitled to benefit from those incentives?
The type of incentives
Incentivized performance indicator
• Approximately 60% of the Energy Management’s balance scorecards is related to the above presented performance indicators.
2. Strategy
Risk Management Approach
2.1 Please select the option that best describes your risk management procedures with regard to climate change risks and opportunities This question should be answered by selecting one of the three options available:
• Integrated into multi-disciplinary companywide risk management processes o A documented process where climate change risks and opportunities are integrated into the
company's centralized enterprise risk management program covering all possible types/sources of risks and opportunities
• A specific climate change risk management process o A documented process which considers climate change risks and opportunities separate from
other business risks and opportunities • There are no documented processes for assessing and managing risk and opportunities from climate
change If “integrated into company-wide risk management process”, “a specific climate change risk management process”, or “a process that forms part of the company’s overall approach to governance/compliance” are selected: 2.1a Please provide further details (see guidance) (max 7000 characters)
• The scope of the process
Gold Fields has a well developed and embedded Enterprise Wide Risk Management process. This system is based on the risk management requirements of King III code on corporate governance and the ISO 31000 International guideline for risk management. With regard to climate change related risks, the Corporate Risk Management Strategy received its input from the risk management section of the Carbon Management Strategy (CMS). Gold Fields’ comprehensive CMS was drafted in 2009 and updated beginning of 2011. It incorporates the identification of risks and opportunities presented by climate change and related
Investor CDP 2011 Information Request
Management
5
change in the world economy. This includes physical, regulatory, market, customer behaviour changes, perception and other risks and opportunities. During 2011, it was decided that every region should develop Regional Carbon Management Plans (RCMPs), to operationalise the CMS on a regional level. The RCMPs will provide bottom up input on risks and opportunities into the CMS and therefore Risk Policy. A South African RCMP has been developed and will be used as a template to roll out the RCMP approach. A crucial aspect of the CMPs will be to formalize an approach on a regional level for climate change related risk and opportunity identification.
• How risks and opportunities are assessed at a company level
The Board, via the Audit Committee oversees the overall system of risk assessment. The Audit Committee oversees the changing environment within which the group operates and is responsible
for the identification and mitigation of new and existing risks, including climate change related risks, on an ongoing basis. The Group Risk Manager is responsible for the process of risk management that takes place at a corporate level. All risks identified in Gold Fields risk management process have
control measures and mitigating strategies in place.
Gold Fields has 4 types of enterprise wide risk registers: 1. Individual operations and Service Divisions
2. Regional Risk Registers 3. Specialised company-wide Register
4. Corporate Register
South Africa’s RCMP requires the development of a dedicated climate change risk register. The intention of the risk register is for managers to be more informed and pro-active which allows for
remedial action to be taken often before the risks materialise.
Opportunities are assessed on a group level via the CMS and the ‘Energy and Carbon Management Strategy’ (ECMS), which is currently being developed. The RCMPs should strengthen the process of identification of opportunities at an operational and regional level, after which it is communicated
up into the organisation. Opportunities identified are assessed by operational and energy managers, regional managers and overseen by the board. As the identification of opportunities related to
climate change has been incorporated into the energy and operational manager’s performance contracts, there is a system in place that motivates the identification of opportunities.
• How risk and opportunities are assessed at an asset level
Investor CDP 2011 Information Request
Management
6
Gold Fields assets’ exposure to climate change related risks and opportunities are assessed in several
ways. Firstly, a comprehensive physical risk management programme is implemented within Gold Fields which monitors risks, including climate change related risks, on an ongoing basis. Secondly,
Gold Fields’ assets and their exposure to (amongst others) climate change related risks are yearly investigated by its insurance company. Gold Fields is in the top quartile of companies participating in
these insurance asset surveys. Climate change related opportunities and risks on an asset level are furthermore assessed using the CMS, ECMS and RCMP. All Gold Fields’ operations have been
assessed on asset level in terms of physical, regulatory, economical and other climate change related risks and opportunities:
- Operations at which physical impacts related to climate change were found to be a potential risk, conducted detailed studies, including future projections.
- As part of the ECMS, every region is currently going through an intensive screening process to find any additional climate change related regulatory risks and opportunities. This will be formalized to take place on a regular basis.
- The CMS determined that all growth assets will have climate change constraints and opportunities embedded in their design and development. Therefore, new assets are
investigated on any climate change related risks and opportunities.
• The frequency of monitoring in terms of weeks/months/years Climate change risks, included in the risk registers are reviewed on a quarterly basis as part of the
normal operational reviews and assessed on a 6 monthly basis by the Executive Committee and the Board in terms of applicability and effectiveness. The Internet web based Cura electronic risk
management software solution has been fully functional since early 2009 and is used to record and monitor strategic risks to which the operations, regions and corporate are exposed. An auditing
function is included in the software in order to conduct ongoing internal assurances that mitigating strategies for risks are receiving the required attention. The audits are conducted by an internal controller on each operation and region.
Opportunities are reviewed weekly and monthly during management review meetings
• Criteria for determining materiality/priorities
Risks, including climate change related risks, are evaluated on materiality based on its risk rating. Risk rating is determined as being the product of the severity and the probability. Severity is based
on the potential impact of the risk; firstly on safety and then on the potential of disruptions, reduced cost effectiveness and compromised sustainability of the operations. When determining the
probability of physical risks related to climate change, information such as climate change projections and past experience is taken into account. When determining the probability of

Investor CDP 2011 Information Request
Management
7
regulatory risks related to climate change, draft policies and Government response papers are used
as input.
When opportunities are identified, they are prioritised as follow; 1. Safety
2. Impact on Notional Cash Expenditure 3. Impact on the carbon footprint
• To whom are the results reported
Gold Fields’ Board has established a Safety, Health and Sustainable Development Committee (SHSD Committee). Climate change risks and issues are overseen by this committee, which reports to the Board. Opportunities are reported by energy and operational managers to the Board via the SHSD
Committee.
The progress and status of the carbon management efforts of Gold Fields are reported to the Board and Executive committees since 2005. The Executive Committees are kept informed through
updates at committee meetings held quarterly and a quarterly submitted Board note.
Business Strategy
2.2 Is climate change integrated into your business strategy? Yes
If yes: 2.2a Please describe the process outcomes (see guidance) (max 7000 characters) For years Gold Fields’ business strategy has taken into account risks and opportunities related to climate change. In achieving its vision ‘to be the global leader in sustainable gold mining’ Gold Fields’
management team has identified three objectives that require its focus. These are:
• Optimise our Assets – growing cash flow margin per ounce.
• Grow Gold Fields – grow ounces per share.
• Secure our Future – the need to address sustainability.
Managing the risks and opportunities related to climate change as per the ‘Carbon Management Strategy’ (CMS) and other strategic documents, positively contributes to each of Gold Fields’
objectives.
Investor CDP 2011 Information Request
Management
8
i. Gold Fields developed a CMS in 2009, which was updated in 2011. The CMS feeds into and is
directly linked to Gold Fields business strategy. The CMS is also underpinned by, and integrated with the Group’s Business Improvement Initiative (BI). The CMS is developed to
support the company’s vision and focus objectives as mentioned above from a carbon perspective. During 2011, it was decided that every region should develop Regional Carbon
Management Plans (RCMPs), to operationalise the CMS on an operational level. One of the purposes of RCMP’s is to support climate change related information flow from operational
level into the CMS and therefore Gold Fields’ business strategy. The South African CMP included the following bottom up communication structures;
- The development of Regional Carbon Steering Committees, where regional climate change related issues are discussed and communicated to the Group Carbon
Steering Committee - Development and Implementation of a CMP Communication plan to formalize
internal and external communication around climate change issues.
In the past, carbon pricing as part of operational performance reporting has motivated a change in Gold Fields’ business strategy; namely to adapt the company to thrive in a carbon-regulated future. In response to the strategy, Gold Fields CEO set stringent energy reduction targets and alternative energy use targets at growth projects.
ii. The climate change aspects that have influenced the business strategy most are the risks of; increased costs (due to carbon taxation directly and indirectly via the supply chain),
production disruptions due to changed weather patterns and uncertainty regarding new climate change related regulations and possibly Gold Fields reputation if the company
doesn’t deal with climate change appropriately. Gold Fields has also identified the opportunity for its strategic and management approaches towards climate change to support its vision of being ‘the global leader in sustainable gold mining’. Gold Fields
anticipates that proactively addressing the risks associated with climate change, will not only reduces its risks, but also realise potential opportunities such as supporting the positive
reputation of the company. Gold Fields Carbon Management Strategy and Plans address all identified risks and opportunities. The company’s emission reduction targets are expected to
reduce the potential exposure of the company to carbon taxation and other climate change related regulatory initiatives.
iii. At the beginning of 2011, the Carbon Management Strategy was updated and additional
short term (over the next three years) strategic components were identified:
• Development, implementation and monitoring of Carbon Management Plans by each
Region.

Investor CDP 2011 Information Request
Management
9
• Further integrate carbon and energy management through the development of a ‘Group
Energy and Carbon Management Strategy’.
• Stimulate wide spread usage of the guidelines ‘to incorporate climate change aspects into
existing operations’ and ‘guidelines to incorporate climate change into the development of new projects
• In 2011, new, more stringent energy reduction targets have been set.
• Water is expected to become scarcer, supply more erratic and contested in most areas of the world, as a result of climate change. More focus will be put on water management and
water efficiency targets will be set for all regions and sites.
iv. The most important intervention of the long term (more than 3 years from now) strategy, influenced by climate change has been the formal incorporation of climate change
considerations into the process of developing new mining operations. This has been supported by the development of guidelines to support this integration of mitigation and adaptation related issues into asset design. To minimize the new operations’ carbon
footprint as much as possible, Gold Fields’ development teams will be required to calculate the new asset’s carbon footprint over its lifetime and to identify energy efficiency and
renewable energy opportunities as early as possible in the project development process. To support this long-term strategic view, Gold Fields’ CEO has set a target that all new projects
must at least have 20% of their energy sourced from alternative sources of energy other than fossil fuels.
v. Gold Fields competes mainly in two markets. The first is in the gold market and the second
the investment market for raising funds to mine gold. Gold Fields believes that a better understanding and management of the risks and opportunities presented by climate
changes enables it to be more cost competitive and secure better mining assets than its competitors in the gold market. Gold Fields further believes that the leadership position it
has secured in the climate change space by achieving a first place in the South African CDLI in 2011, first place in the BRICS 300 Scope 3 Environmental Rankings by the Environmental Investment Organisation and by winning the 2011 Climate Change Leadership Awards,
strengthens its ‘social license to operate’ and gives it a competitive advantage in the investment market to secure funds to open new mines. This is also proven by the fact that
these results have contributed to Gold Fields inclusion into the ‘Be Green Exchange Traded Fund’ which supports Gold Fields’ aim to develop value for its shareholders.
vi. The most important business decisions during 2011 influenced by climate change driven
aspects of the strategy have been:
Investor CDP 2011 Information Request
Management
10
1. Ambitious, new emission reduction targets have been set by the company’s CEO, as well
as a target that all new projects must at least have 20% of their energy sourced from alternative sources of energy.
2. Implementation of the Beatrix Methane Capture Project at the Beatrix 4 Shaft 3. Update and implementation of the Carbon Management Strategy as well as the decision
that all regions develop and implement Carbon Management Plans. 4. Decision to develop a ‘Group Energy and Carbon Management Strategy’ to further
integrate energy and carbon management. 5. Commence the registration process for the obtaining of carbon credits from several
emission reduction projects. 6. In 2011 it was decided to conduct a feasibility study on the KDC-West bio-energy
project and investigate the potential of a biomass and waste to energy project on Gold Fields’ Tarkwa mine.
Engagement with Policy Makers
2.3 Do you engage with policy makers to encourage further action on mitigation and/or adaptation? Yes
If yes: 2.3a Please explain (max 5000 characters):
(i) Engagement process
a. Method of engagement – e.g. through a trade organization, as an individual company, through funding of a third party, etc and public or private;
b. Topic of engagement – e.g. legislation, policy, products/technologies
c. Nature of engagement – e.g. responding to a consultation, participating in policy research, lobbying
(ii) Actions advocated
a. The nature of advice given, e.g. endorsement or opposition of policy proposals or were you encouraging action on mitigation/adaptation
In South Africa, Gold Fields engages mainly with the following policy makers:
1- Business Unity South Africa (BUSA) and Business Leadership South Africa (BLSA) Gold Fields joins BUSA and BLSA stakeholder meetings when these are organised to provide Government with industry input on regulations. BLSA represents the largest listed and
Investor CDP 2011 Information Request
Management
11
unlisted companies while BUSA, of which BLSA is a member, is the representative body of Business in tricameral meeting with Government and the labour movement. Recommendations are submitted to government based on the input provided during these meetings. Topics engaged on have been; mandatory reporting, carbon tax and carbon budgeting which have been presented in the National Climate Change Response White Paper. Gold Fields, via BUSA and BLSA, has advocated that mandatory reporting should be reduced to the minimum and aligned with other reporting requirements as to reduce the work associated with reporting. Though Gold Fields supports mitigation actions and policies (as proven by its own commitment to reduce emissions), it advocated for carbon budgets to be based on intensity values as otherwise industry growth will be impacted and carbon tax to be introduced gradually, while taking into account the impacts it will have on industry.
2- National Treasury: Gold Fields engaged with National Treasury in 2011 mainly through the Chamber of Mines (CoM). National Treasury requested input on its carbon tax policy, which the CoM, in cooperation with BUSA provided. Gold Fields on its side provided the CoM with its comments to the Carbon Tax policy. Gold Fields advocated that the impact of carbon tax on companies should be investigated and that clear price signals should be sent to the market. Carbon tax tariffs shouldn’t be allowed to negatively impact Gold Fields global competitiveness.
3- Eskom: Gold Fields has representatives at different forums within Eskom. For example the head of electrical engineering engages with Eskom on energy supply, demand side management, energy efficiency and conversation. These forum meetings take place on a monthly basis. During these forums Gold Fields advocates the importance of supply security and proposes joint cooperation and action on energy efficiency projects to reduce Gold fields’ electricity consumption and carbon intensity and help Eskom to secure supply.
4- Department of Environmental Affairs (DEA): In 2011, Gold Fields as a member of the Industry Task Team on Climate Change (ITTCC) has engaged with DEA on an ad-hoc basis in response to proposed regulations. Gold Fields supported the submission of ‘ITTCC comments on the Climate Change Response White Paper’. In this document it is advocated most importantly that the concept of ‘carbon budgets’ in the White Paper should be better defined and based on abatement plans set by companies.
5- National Planning Commission: Gold Fields attended a series of meeting with the National Planning Commission on the low carbon economy work stream. Gold Fields presence was requested by the National Planning Commission. Engagement was specifically on the proposed carbon tax and budgets. See the actions advocated under the ‘BUSA and BLSA’ section above for the actions advocated by Gold Fields during meetings at the National Planning Commission.
In Ghana, Gold Fields engages regularly with the Electricity Company of Ghana and the Volta River Authority on energy consumption reduction initiatives. This is done in response to public
Investor CDP 2011 Information Request
Management
12
participation requests, new policy development or initiated by Gold Fields. Gold Fields advocates reasonable energy consumption reduction targets through implementation of energy efficient technology during these engagements.
Gold Fields requested meetings with the ‘Ghana Energy Commission’, ‘National Focal Point on Renewable Energy and Carbon Management’ and the ‘Institute of Renewable Energy’ to discuss the Tarkwa biomass to energy project. During those meetings, Gold Fields would present the project, find out what regulatory requirements the project was subject to and what support structures were available. Gold Fields Australasia plays an active role in working with local, state and federal bodies, in their effort to achieve carbon emission mitigation and climate change adaptation. Gold Fields continues to be requested to provide input to various white papers, regarding the National Greenhouse & Energy Reporting system and the Energy Efficiency Opportunities Programme (EEOP). Gold Fields has supported emission and energy reporting in line with the National Greenhouse & Energy Reporting scheme and asked for compliance with international terminology on the EEOP. Gold Fields are still represented as a founding member of the Goldfields Renewable Energy Lobby (GREL), which actively promotes the deployment of large scale renewable energy generation sources for the north eastern goldfields region. GREL engages with Government and private businesses to obtain the required support to implement projects.
3. Targets and Initiatives
Targets
3.1 Did you have an emission reduction target that was active (ongoing or reached completion) in the reporting year? You will need to select one of the following options: • Absolute target • Intensity target • Absolute and intensity targets • No
Investor CDP 2011 Information Request
Management
13
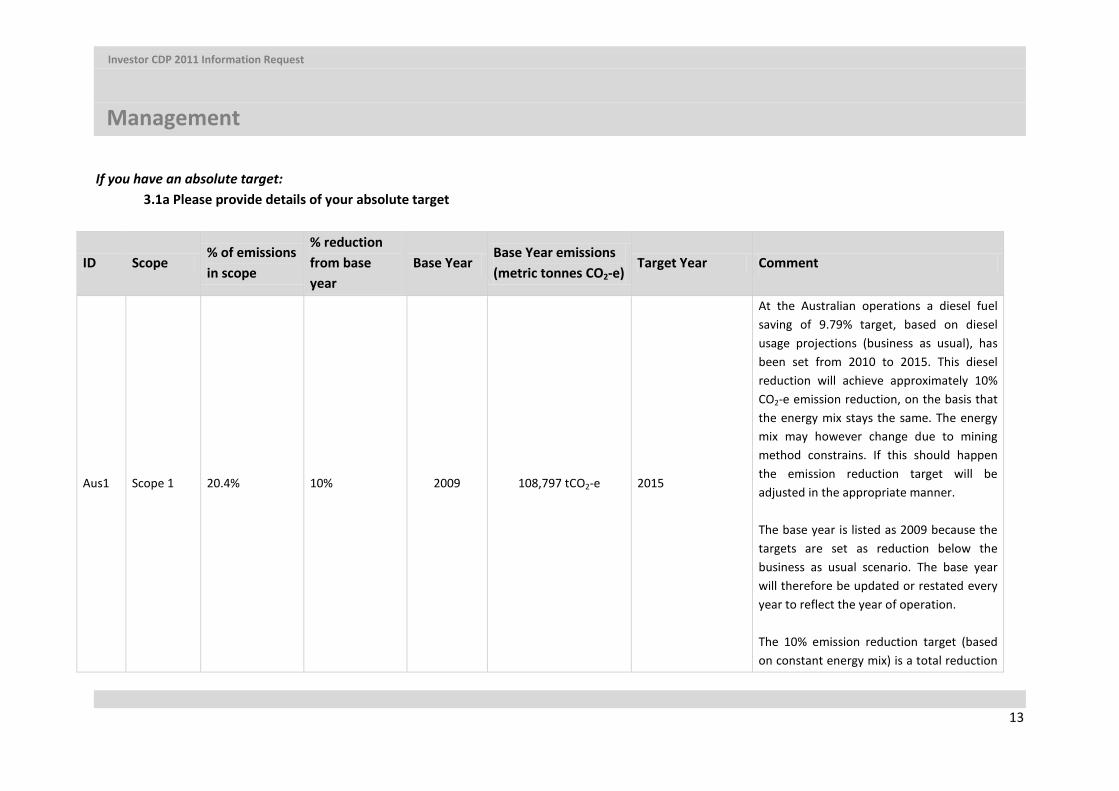
If you have an absolute target: 3.1a Please provide details of your absolute target
ID Scope % of emissions in scope
% reduction from base year
Base Year Base Year emissions (metric tonnes CO2-e)
Target Year Comment
Aus1 Scope 1 20.4% 10% 2009 108,797 tCO2-e 2015
At the Australian operations a diesel fuel saving of 9.79% target, based on diesel usage projections (business as usual), has been set from 2010 to 2015. This diesel reduction will achieve approximately 10% CO2-e emission reduction, on the basis that the energy mix stays the same. The energy mix may however change due to mining method constrains. If this should happen the emission reduction target will be adjusted in the appropriate manner. The base year is listed as 2009 because the targets are set as reduction below the business as usual scenario. The base year will therefore be updated or restated every year to reflect the year of operation. The 10% emission reduction target (based on constant energy mix) is a total reduction
Investor CDP 2011 Information Request
Management
14
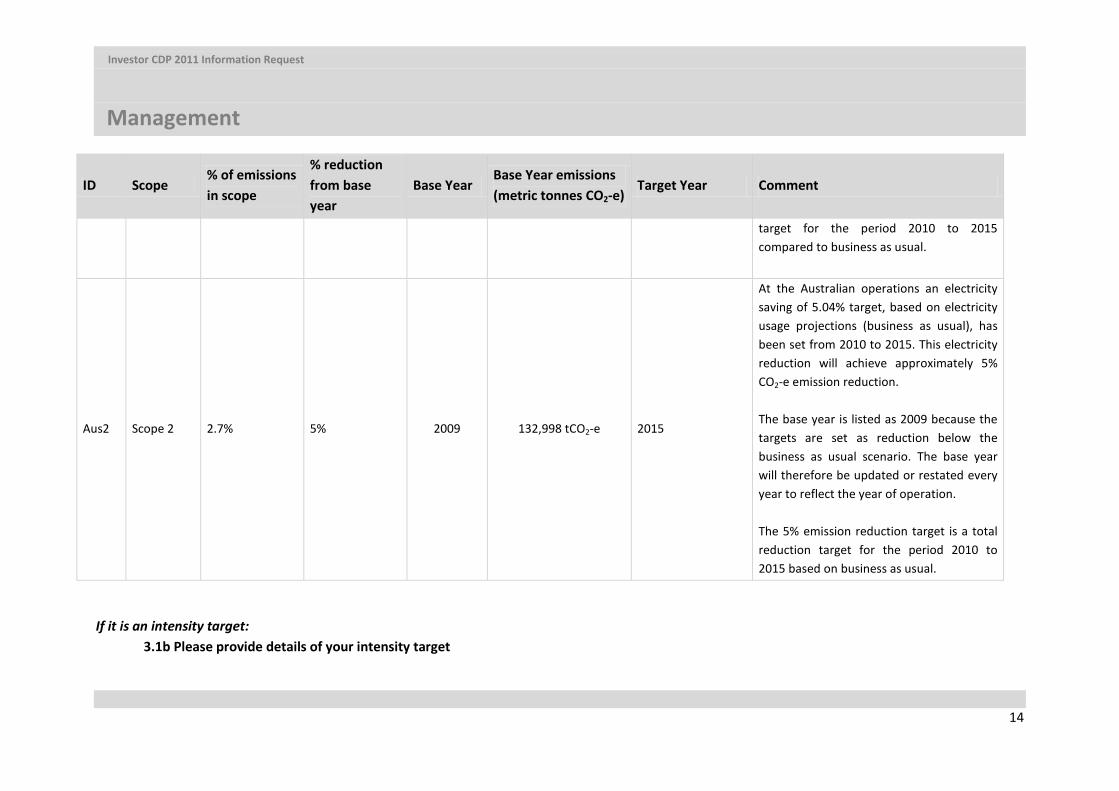
ID Scope % of emissions in scope
% reduction from base year
Base Year Base Year emissions (metric tonnes CO2-e)
Target Year Comment
target for the period 2010 to 2015 compared to business as usual.
Aus2 Scope 2 2.7% 5% 2009 132,998 tCO2-e 2015
At the Australian operations an electricity saving of 5.04% target, based on electricity usage projections (business as usual), has been set from 2010 to 2015. This electricity reduction will achieve approximately 5% CO2-e emission reduction. The base year is listed as 2009 because the targets are set as reduction below the business as usual scenario. The base year will therefore be updated or restated every year to reflect the year of operation. The 5% emission reduction target is a total reduction target for the period 2010 to 2015 based on business as usual.
If it is an intensity target: 3.1b Please provide details of your intensity target
Investor CDP 2011 Information Request
Management
15
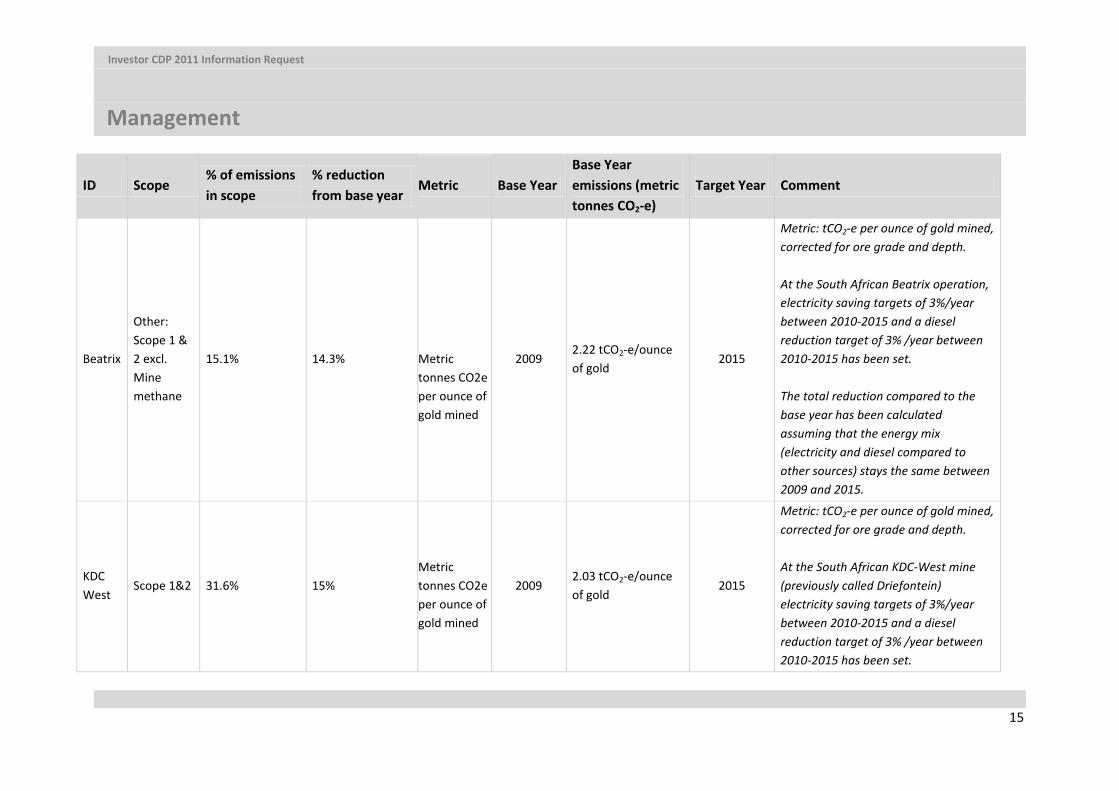
ID Scope % of emissions in scope
% reduction from base year
Metric Base Year Base Year emissions (metric tonnes CO2-e)
Target Year Comment
Beatrix
Other: Scope 1 & 2 excl. Mine methane
15.1% 14.3%
Metric tonnes CO2e per ounce of gold mined
2009 2.22 tCO2-e/ounce of gold
2015
Metric: tCO2-e per ounce of gold mined, corrected for ore grade and depth. At the South African Beatrix operation, electricity saving targets of 3%/year between 2010-2015 and a diesel reduction target of 3% /year between 2010-2015 has been set. The total reduction compared to the base year has been calculated assuming that the energy mix (electricity and diesel compared to other sources) stays the same between 2009 and 2015.
KDC West
Scope 1&2 31.6% 15%
Metric tonnes CO2e per ounce of gold mined
2009 2.03 tCO2-e/ounce of gold
2015
Metric: tCO2-e per ounce of gold mined, corrected for ore grade and depth. At the South African KDC-West mine (previously called Driefontein) electricity saving targets of 3%/year between 2010-2015 and a diesel reduction target of 3% /year between 2010-2015 has been set.

Investor CDP 2011 Information Request
Management
16
ID Scope % of emissions in scope
% reduction from base year
Metric Base Year Base Year emissions (metric tonnes CO2-e)
Target Year Comment
The total reduction compared to the base year has been calculated assuming that the energy mix (electricity and diesel compared to other sources) stays the same between 2009 and 2015.
KDC East
Scope 1&2 30.7% 15%
Metric tonnes CO2e per ounce of gold mined
2009 2.80 tCO2-e/ounce of gold
2015
Metric: tCO2-e per ounce of gold mined, corrected for ore grade and depth At the South African KDC-East (previously called Kloof) mine, electricity saving targets of 3%/year between 2010-2015 and a diesel reduction target of 3% /year between 2010-2015 has been set. The total reduction compared to the base year has been calculated assuming that the energy mix (electricity and diesel compared to other sources) stays the same between 2009 and 2015.
Investor CDP 2011 Information Request
Management
17
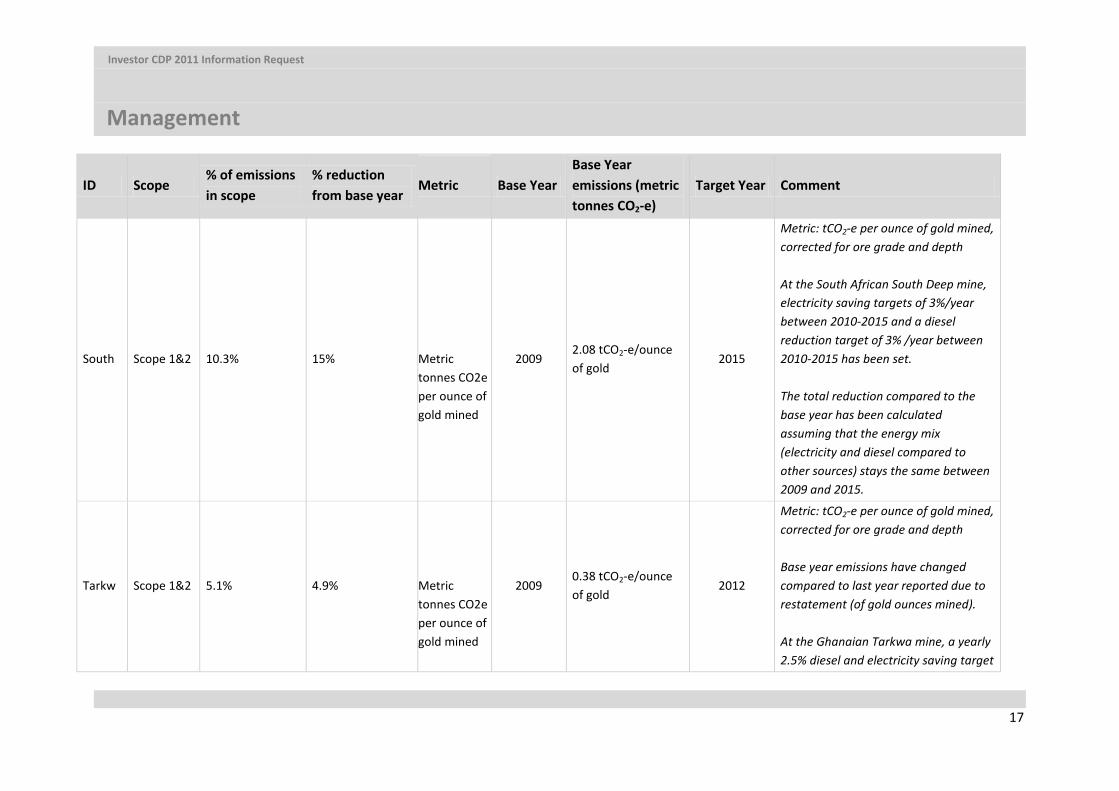
ID Scope % of emissions in scope
% reduction from base year
Metric Base Year Base Year emissions (metric tonnes CO2-e)
Target Year Comment
South Scope 1&2 10.3% 15%
Metric tonnes CO2e per ounce of gold mined
2009 2.08 tCO2-e/ounce of gold
2015
Metric: tCO2-e per ounce of gold mined, corrected for ore grade and depth At the South African South Deep mine, electricity saving targets of 3%/year between 2010-2015 and a diesel reduction target of 3% /year between 2010-2015 has been set. The total reduction compared to the base year has been calculated assuming that the energy mix (electricity and diesel compared to other sources) stays the same between 2009 and 2015.
Tarkw Scope 1&2 5.1% 4.9%
Metric tonnes CO2e per ounce of gold mined
2009 0.38 tCO2-e/ounce of gold
2012
Metric: tCO2-e per ounce of gold mined, corrected for ore grade and depth Base year emissions have changed compared to last year reported due to restatement (of gold ounces mined). At the Ghanaian Tarkwa mine, a yearly 2.5% diesel and electricity saving target
Investor CDP 2011 Information Request
Management
18
ID Scope % of emissions in scope
% reduction from base year
Metric Base Year Base Year emissions (metric tonnes CO2-e)
Target Year Comment
between 2010-2012 has been set. The total reduction compared to the base year has been calculated assuming that the energy mix (electricity and diesel compared to other sources) stays the same between 2009 and 2012.
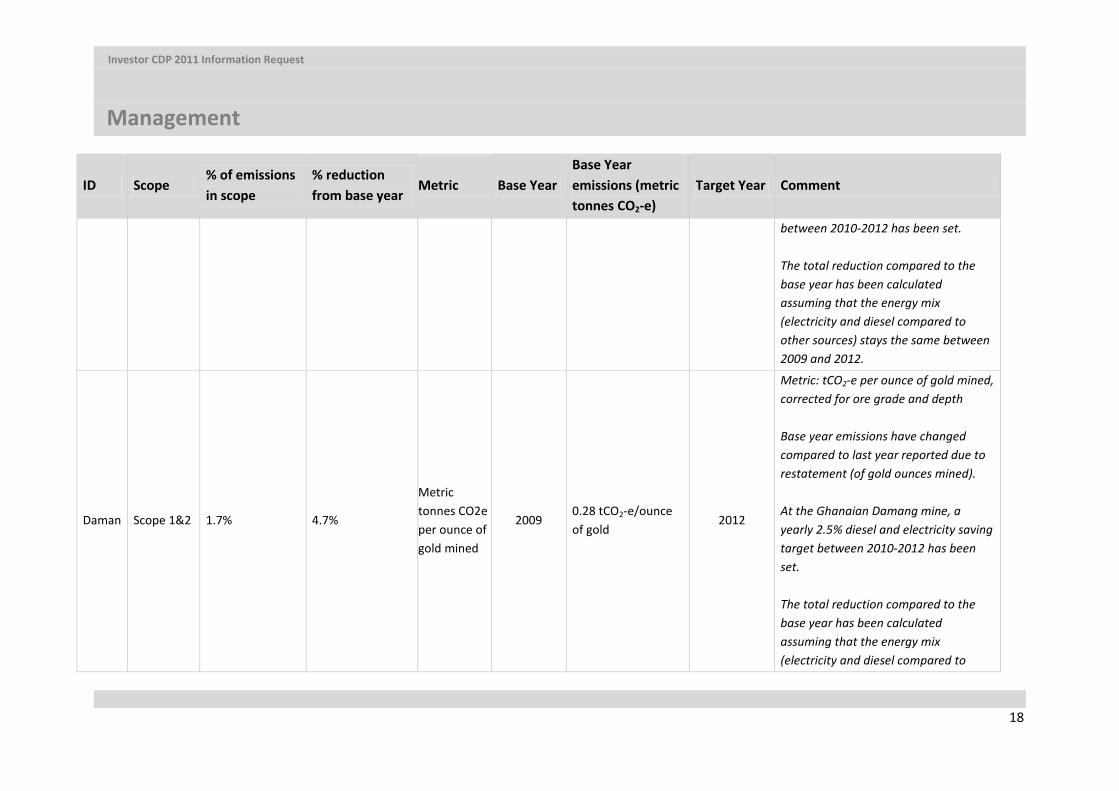
Daman Scope 1&2 1.7% 4.7%
Metric tonnes CO2e per ounce of gold mined
2009 0.28 tCO2-e/ounce of gold
2012
Metric: tCO2-e per ounce of gold mined, corrected for ore grade and depth Base year emissions have changed compared to last year reported due to restatement (of gold ounces mined). At the Ghanaian Damang mine, a yearly 2.5% diesel and electricity saving target between 2010-2012 has been set. The total reduction compared to the base year has been calculated assuming that the energy mix (electricity and diesel compared to
Investor CDP 2011 Information Request
Management
19
ID Scope % of emissions in scope
% reduction from base year
Metric Base Year Base Year emissions (metric tonnes CO2-e)
Target Year Comment
other sources) stays the same between 2009 and 2012.
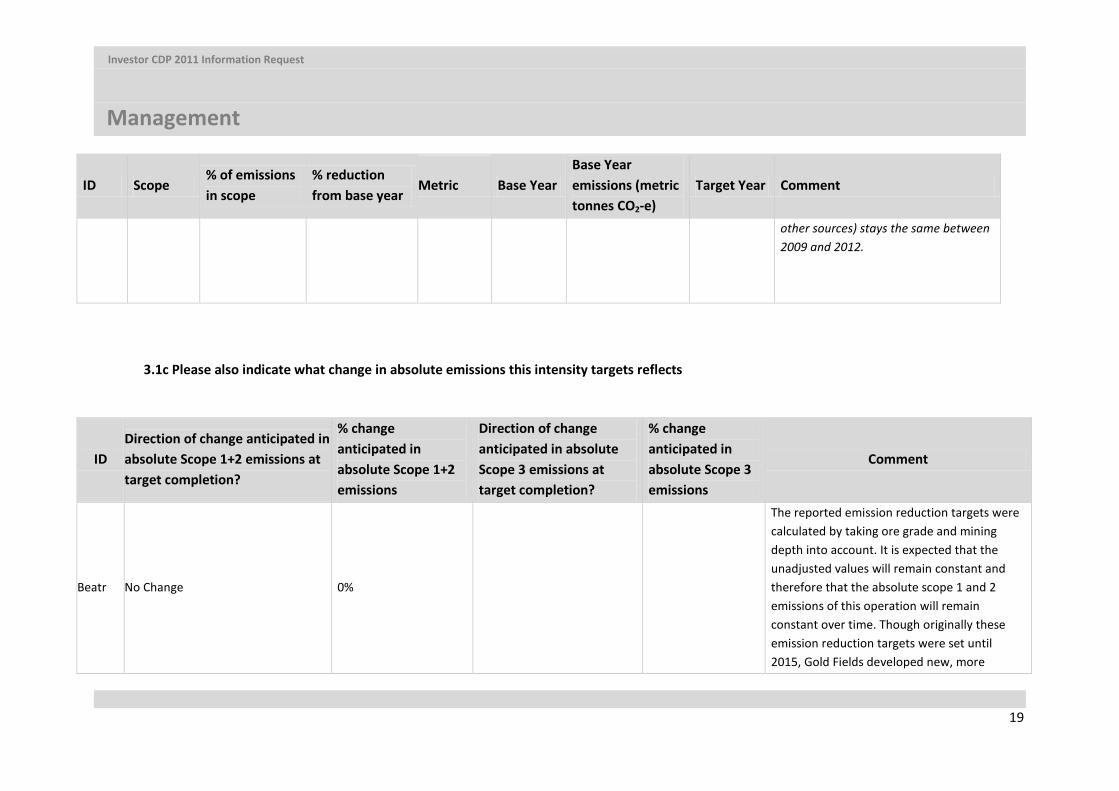
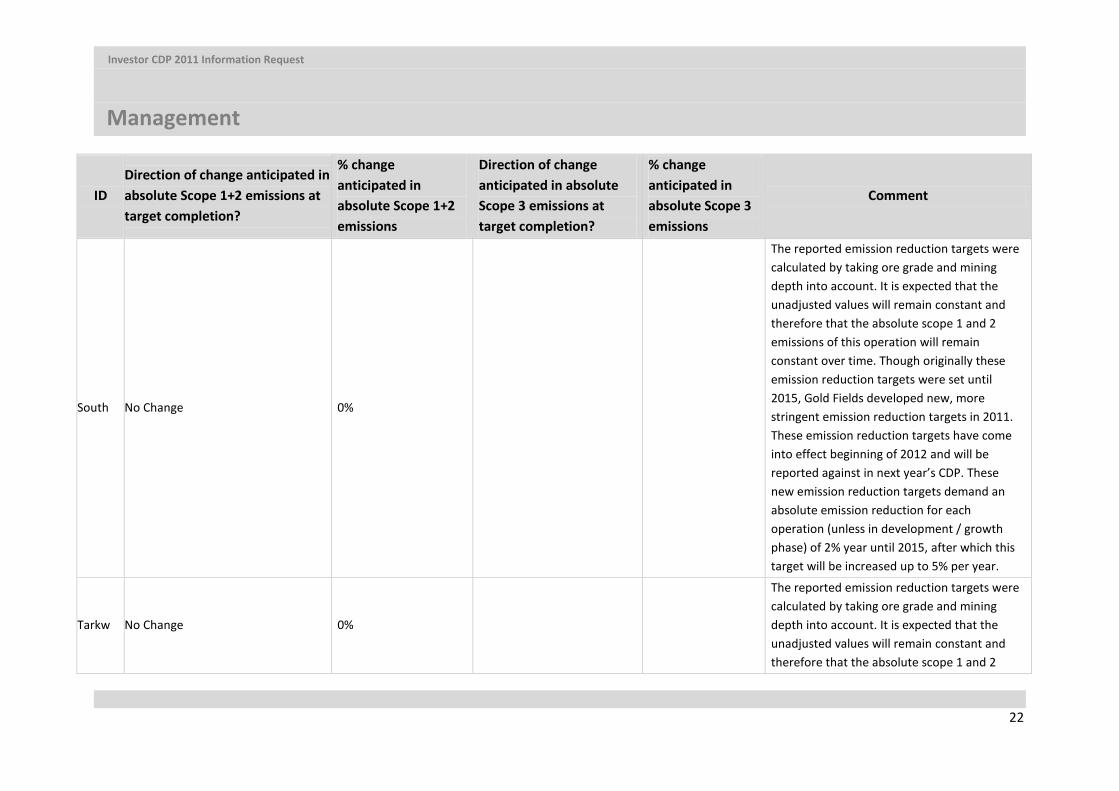
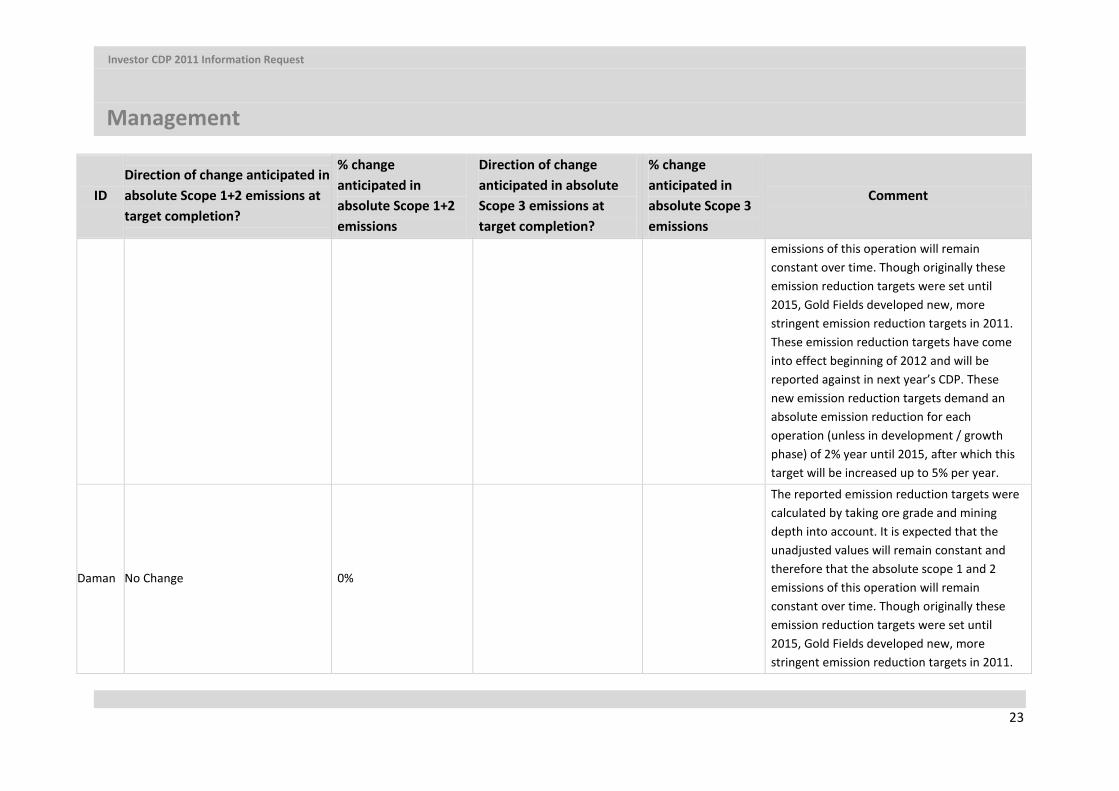
3.1c Please also indicate what change in absolute emissions this intensity targets reflects
ID Direction of change anticipated in absolute Scope 1+2 emissions at target completion?
% change anticipated in absolute Scope 1+2 emissions
Direction of change anticipated in absolute Scope 3 emissions at target completion?
% change anticipated in absolute Scope 3 emissions
Comment
Beatr No Change 0%
The reported emission reduction targets were calculated by taking ore grade and mining depth into account. It is expected that the unadjusted values will remain constant and therefore that the absolute scope 1 and 2 emissions of this operation will remain constant over time. Though originally these emission reduction targets were set until 2015, Gold Fields developed new, more
Investor CDP 2011 Information Request
Management
20
ID Direction of change anticipated in absolute Scope 1+2 emissions at target completion?
% change anticipated in absolute Scope 1+2 emissions
Direction of change anticipated in absolute Scope 3 emissions at target completion?
% change anticipated in absolute Scope 3 emissions
Comment
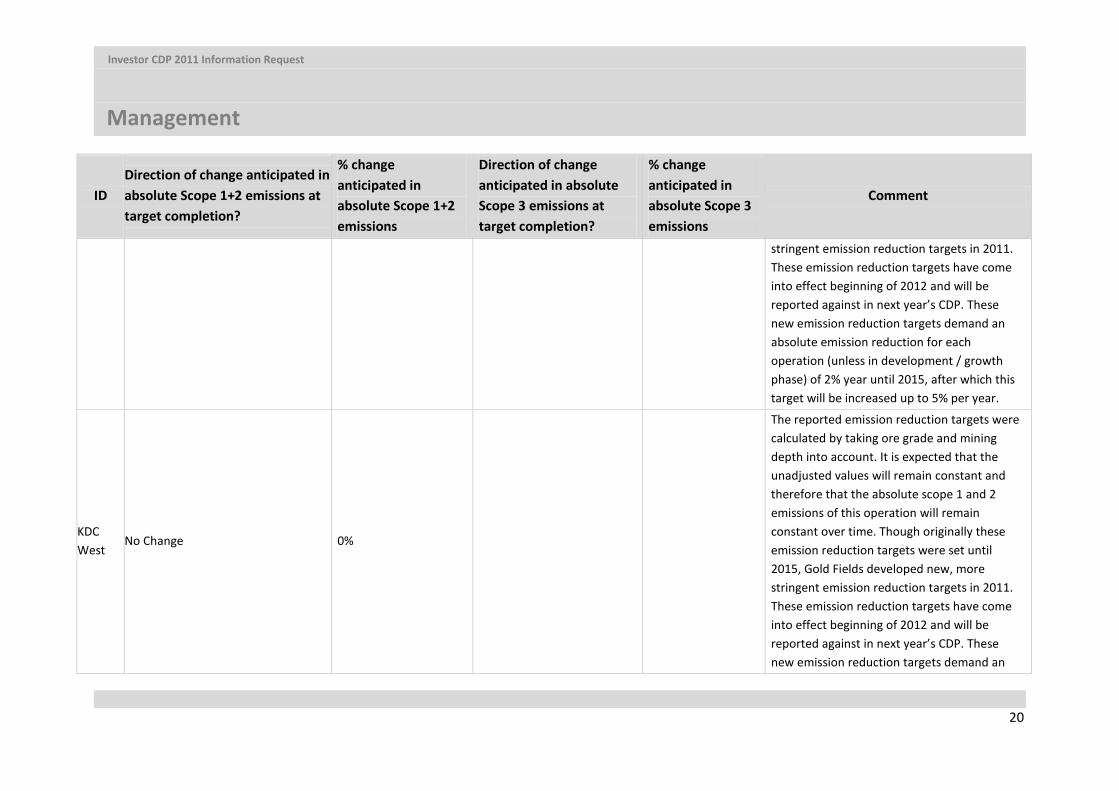
stringent emission reduction targets in 2011. These emission reduction targets have come into effect beginning of 2012 and will be reported against in next year’s CDP. These new emission reduction targets demand an absolute emission reduction for each operation (unless in development / growth phase) of 2% year until 2015, after which this target will be increased up to 5% per year.
KDC West
No Change 0%
The reported emission reduction targets were calculated by taking ore grade and mining depth into account. It is expected that the unadjusted values will remain constant and therefore that the absolute scope 1 and 2 emissions of this operation will remain constant over time. Though originally these emission reduction targets were set until 2015, Gold Fields developed new, more stringent emission reduction targets in 2011. These emission reduction targets have come into effect beginning of 2012 and will be reported against in next year’s CDP. These new emission reduction targets demand an
Investor CDP 2011 Information Request
Management
21
ID Direction of change anticipated in absolute Scope 1+2 emissions at target completion?
% change anticipated in absolute Scope 1+2 emissions
Direction of change anticipated in absolute Scope 3 emissions at target completion?
% change anticipated in absolute Scope 3 emissions
Comment
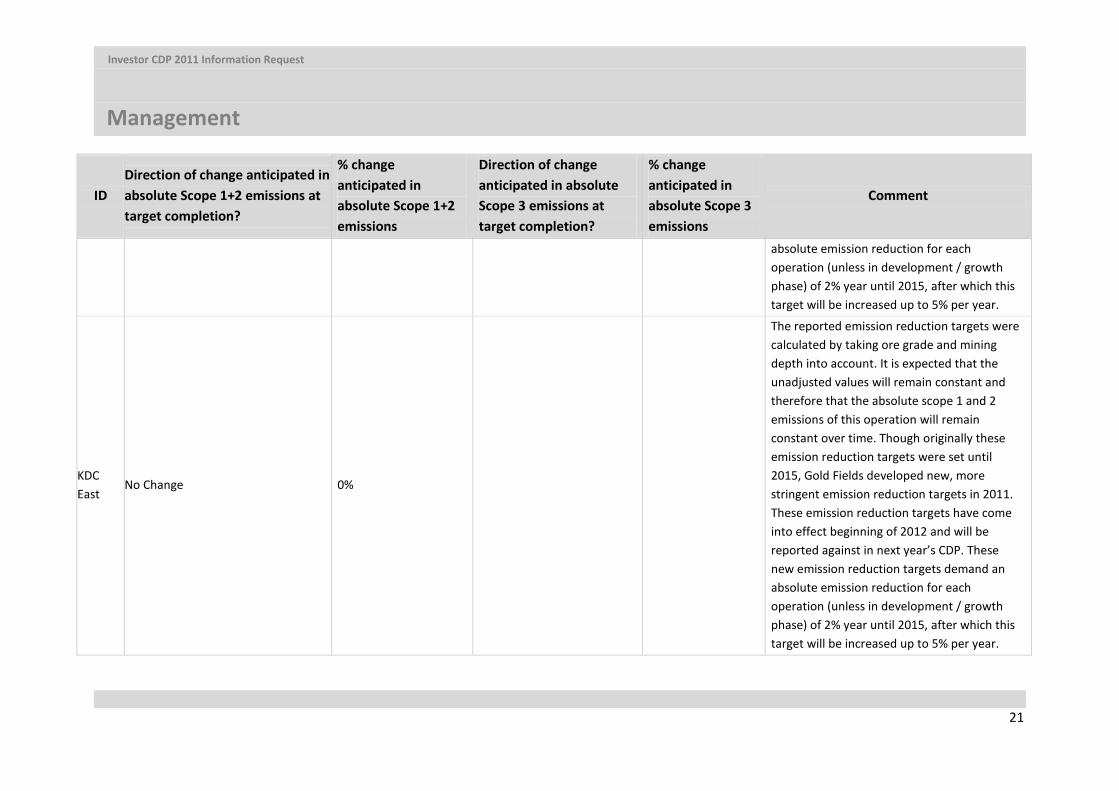
absolute emission reduction for each operation (unless in development / growth phase) of 2% year until 2015, after which this target will be increased up to 5% per year.
KDC East
No Change 0%
The reported emission reduction targets were calculated by taking ore grade and mining depth into account. It is expected that the unadjusted values will remain constant and therefore that the absolute scope 1 and 2 emissions of this operation will remain constant over time. Though originally these emission reduction targets were set until 2015, Gold Fields developed new, more stringent emission reduction targets in 2011. These emission reduction targets have come into effect beginning of 2012 and will be reported against in next year’s CDP. These new emission reduction targets demand an absolute emission reduction for each operation (unless in development / growth phase) of 2% year until 2015, after which this target will be increased up to 5% per year.
Investor CDP 2011 Information Request
Management
22
ID Direction of change anticipated in absolute Scope 1+2 emissions at target completion?
% change anticipated in absolute Scope 1+2 emissions
Direction of change anticipated in absolute Scope 3 emissions at target completion?
% change anticipated in absolute Scope 3 emissions
Comment
South No Change 0%
The reported emission reduction targets were calculated by taking ore grade and mining depth into account. It is expected that the unadjusted values will remain constant and therefore that the absolute scope 1 and 2 emissions of this operation will remain constant over time. Though originally these emission reduction targets were set until 2015, Gold Fields developed new, more stringent emission reduction targets in 2011. These emission reduction targets have come into effect beginning of 2012 and will be reported against in next year’s CDP. These new emission reduction targets demand an absolute emission reduction for each operation (unless in development / growth phase) of 2% year until 2015, after which this target will be increased up to 5% per year.
Tarkw No Change 0%
The reported emission reduction targets were calculated by taking ore grade and mining depth into account. It is expected that the unadjusted values will remain constant and therefore that the absolute scope 1 and 2
Investor CDP 2011 Information Request
Management
23
ID Direction of change anticipated in absolute Scope 1+2 emissions at target completion?
% change anticipated in absolute Scope 1+2 emissions
Direction of change anticipated in absolute Scope 3 emissions at target completion?
% change anticipated in absolute Scope 3 emissions
Comment
emissions of this operation will remain constant over time. Though originally these emission reduction targets were set until 2015, Gold Fields developed new, more stringent emission reduction targets in 2011. These emission reduction targets have come into effect beginning of 2012 and will be reported against in next year’s CDP. These new emission reduction targets demand an absolute emission reduction for each operation (unless in development / growth phase) of 2% year until 2015, after which this target will be increased up to 5% per year.
Daman No Change 0%
The reported emission reduction targets were calculated by taking ore grade and mining depth into account. It is expected that the unadjusted values will remain constant and therefore that the absolute scope 1 and 2 emissions of this operation will remain constant over time. Though originally these emission reduction targets were set until 2015, Gold Fields developed new, more stringent emission reduction targets in 2011.
Investor CDP 2011 Information Request
Management
24
ID Direction of change anticipated in absolute Scope 1+2 emissions at target completion?
% change anticipated in absolute Scope 1+2 emissions
Direction of change anticipated in absolute Scope 3 emissions at target completion?
% change anticipated in absolute Scope 3 emissions
Comment
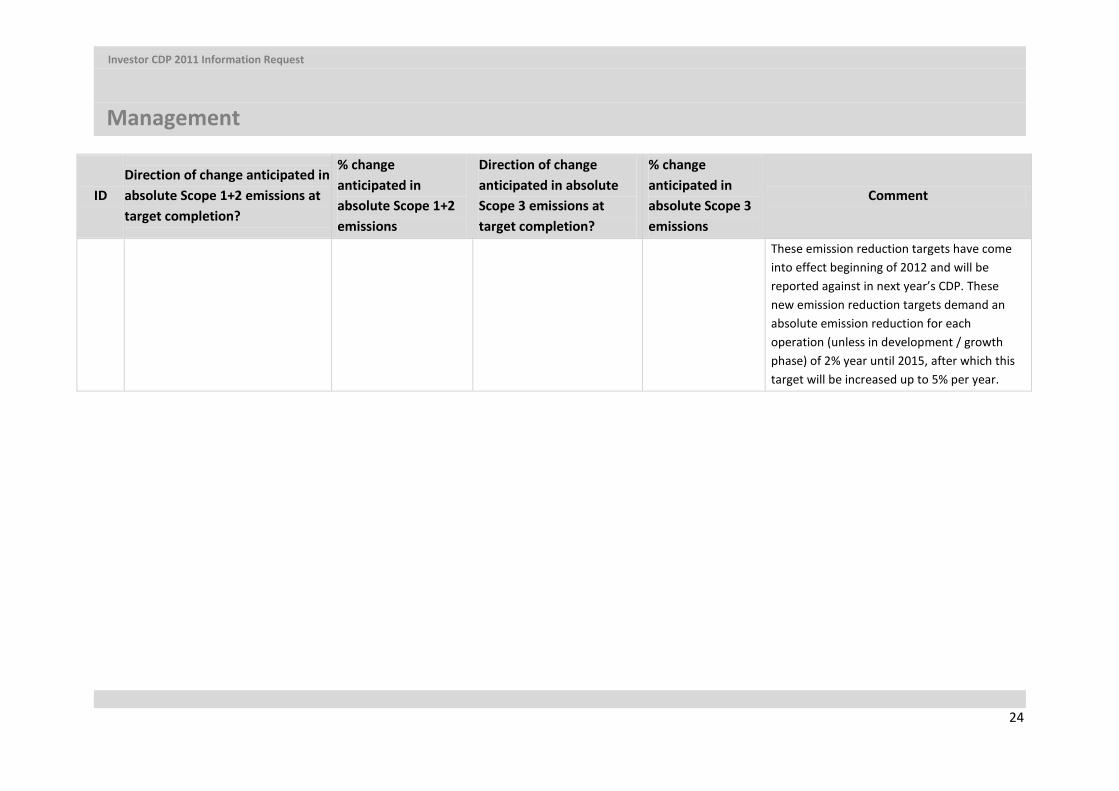
These emission reduction targets have come into effect beginning of 2012 and will be reported against in next year’s CDP. These new emission reduction targets demand an absolute emission reduction for each operation (unless in development / growth phase) of 2% year until 2015, after which this target will be increased up to 5% per year.
Investor CDP 2011 Information Request
Management
25
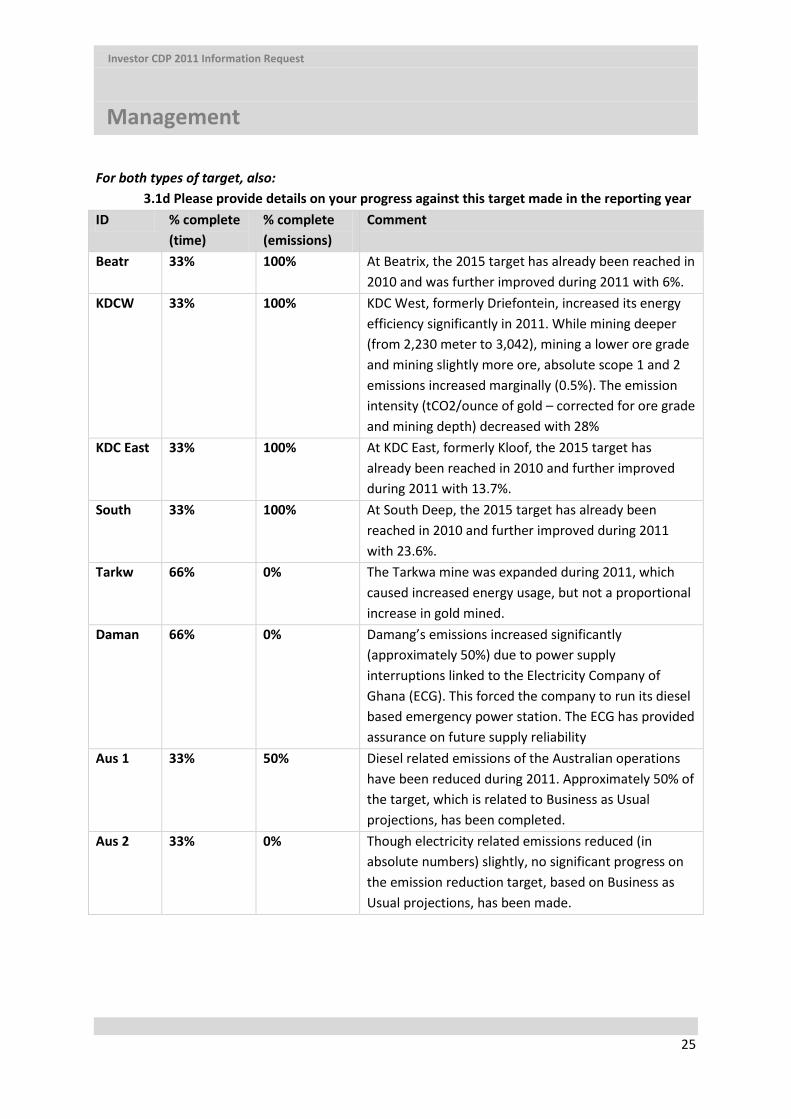
For both types of target, also: 3.1d Please provide details on your progress against this target made in the reporting year ID % complete
(time) % complete (emissions)
Comment
Beatr 33% 100% At Beatrix, the 2015 target has already been reached in 2010 and was further improved during 2011 with 6%.
KDCW 33% 100% KDC West, formerly Driefontein, increased its energy efficiency significantly in 2011. While mining deeper (from 2,230 meter to 3,042), mining a lower ore grade and mining slightly more ore, absolute scope 1 and 2 emissions increased marginally (0.5%). The emission intensity (tCO2/ounce of gold – corrected for ore grade and mining depth) decreased with 28%
KDC East 33% 100% At KDC East, formerly Kloof, the 2015 target has already been reached in 2010 and further improved during 2011 with 13.7%.
South 33% 100% At South Deep, the 2015 target has already been reached in 2010 and further improved during 2011 with 23.6%.
Tarkw 66% 0% The Tarkwa mine was expanded during 2011, which caused increased energy usage, but not a proportional increase in gold mined.
Daman 66% 0% Damang’s emissions increased significantly (approximately 50%) due to power supply interruptions linked to the Electricity Company of Ghana (ECG). This forced the company to run its diesel based emergency power station. The ECG has provided assurance on future supply reliability
Aus 1 33% 50% Diesel related emissions of the Australian operations have been reduced during 2011. Approximately 50% of the target, which is related to Business as Usual projections, has been completed.
Aus 2 33% 0% Though electricity related emissions reduced (in absolute numbers) slightly, no significant progress on the emission reduction target, based on Business as Usual projections, has been made.

Investor CDP 2011 Information Request
Management
26
Emission Reduction Initiatives (CDP 2010 Q9.7-9.9; Q16)
3.2 Does the use of your goods and/or services directly enable GHG emissions to be avoided by a third party? No
If yes: 3.2a Please provide details (see guidance)
3.3 Did you have emissions reduction initiatives that were active within the reporting year (this can include those in the planning and/or implementation phases)?
Yes
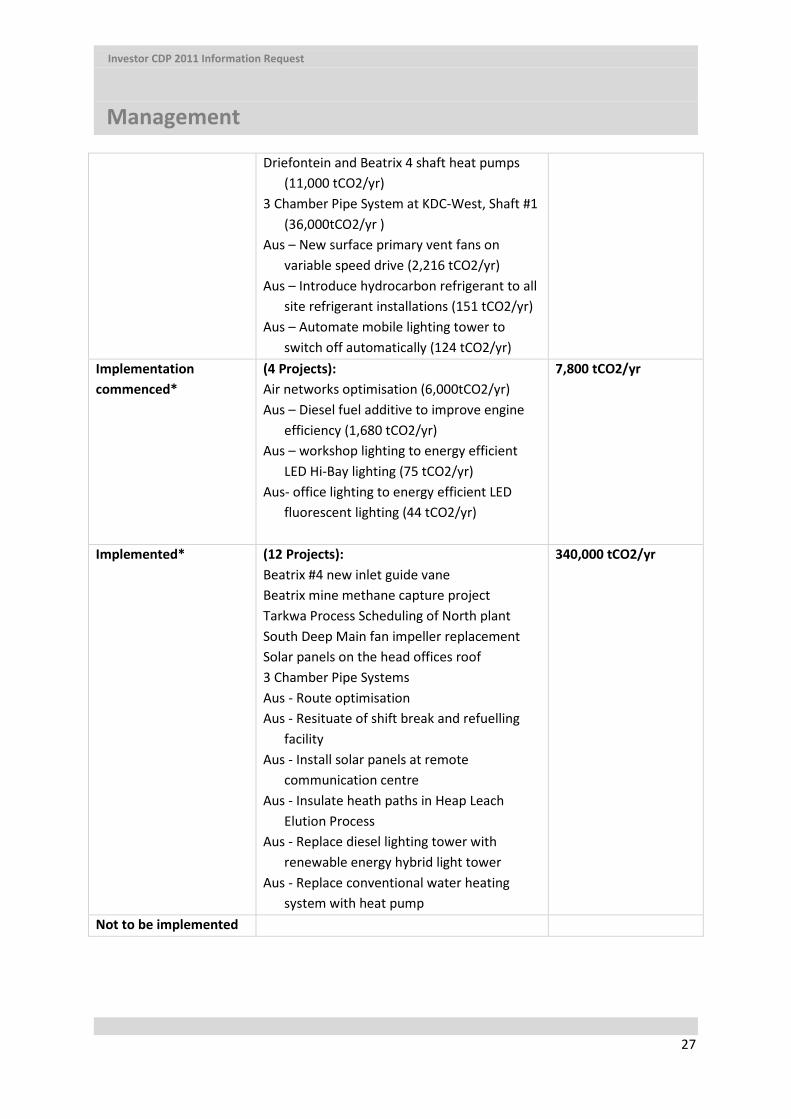
If yes, complete questions 3.3a, 3.3b and 3.3c: 3.3a Please identify the total number of projects at each stage of development, and for use in the implementation stage, estimated CO2e saving (New for CDP 2012) Stage of development Number of projects Total estimated annual
CO2e savings (only for rows marked *)
Under investigation (9 Projects): Driefontein RE project Beatrix gas engines & heat recovery Tarkwa biomass power plant Wind generation at Lake Lefroy (Aus) SA solar projects SA ice chilling plants Damang energy saving light bulbs Aus – Increase in productivity using R.E heating in Elution Process Preheat Aus – Install timers on all hot water services
To be implemented* (9 Projects): SA operations in-line fans (160,000tCO2/yr) Beatrix West mine methane capture project
(171,128tCO2/yr) Kloof & Driefontein main fan impeller
replacements (60,000 tCO2/yr) Energy efficient lighting at head offices
(300tCO2/yr)
442,000 tCO2/yr
Investor CDP 2011 Information Request
Management
27
Driefontein and Beatrix 4 shaft heat pumps (11,000 tCO2/yr)
3 Chamber Pipe System at KDC-West, Shaft #1 (36,000tCO2/yr )
Aus – New surface primary vent fans on variable speed drive (2,216 tCO2/yr)
Aus – Introduce hydrocarbon refrigerant to all site refrigerant installations (151 tCO2/yr)
Aus – Automate mobile lighting tower to switch off automatically (124 tCO2/yr)
Implementation commenced*
(4 Projects): Air networks optimisation (6,000tCO2/yr) Aus – Diesel fuel additive to improve engine
efficiency (1,680 tCO2/yr) Aus – workshop lighting to energy efficient
LED Hi-Bay lighting (75 tCO2/yr) Aus- office lighting to energy efficient LED
fluorescent lighting (44 tCO2/yr)
7,800 tCO2/yr
Implemented* (12 Projects): Beatrix #4 new inlet guide vane Beatrix mine methane capture project Tarkwa Process Scheduling of North plant South Deep Main fan impeller replacement Solar panels on the head offices roof 3 Chamber Pipe Systems Aus - Route optimisation Aus - Resituate of shift break and refuelling
facility Aus - Install solar panels at remote
communication centre Aus - Insulate heath paths in Heap Leach
Elution Process Aus - Replace diesel lighting tower with
renewable energy hybrid light tower Aus - Replace conventional water heating
system with heat pump
340,000 tCO2/yr
Not to be implemented
Investor CDP 2011 Information Request
Management
28
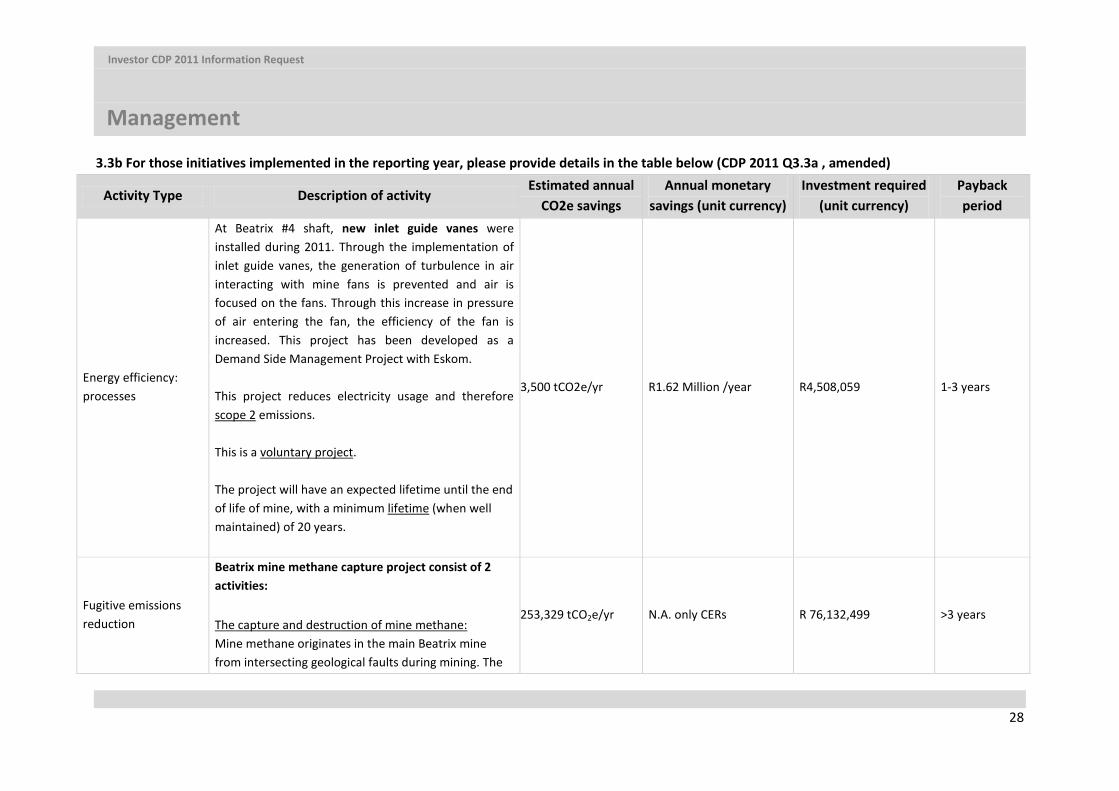
3.3b For those initiatives implemented in the reporting year, please provide details in the table below (CDP 2011 Q3.3a , amended)
Activity Type Description of activity Estimated annual
CO2e savings Annual monetary
savings (unit currency) Investment required
(unit currency) Payback period
Energy efficiency: processes
At Beatrix #4 shaft, new inlet guide vanes were installed during 2011. Through the implementation of inlet guide vanes, the generation of turbulence in air interacting with mine fans is prevented and air is focused on the fans. Through this increase in pressure of air entering the fan, the efficiency of the fan is increased. This project has been developed as a Demand Side Management Project with Eskom. This project reduces electricity usage and therefore scope 2 emissions. This is a voluntary project. The project will have an expected lifetime until the end of life of mine, with a minimum lifetime (when well maintained) of 20 years.
3,500 tCO2e/yr R1.62 Million /year R4,508,059 1-3 years
Fugitive emissions reduction
Beatrix mine methane capture project consist of 2 activities: The capture and destruction of mine methane: Mine methane originates in the main Beatrix mine from intersecting geological faults during mining. The
253,329 tCO2e/yr N.A. only CERs R 76,132,499 >3 years
Investor CDP 2011 Information Request
Management
29
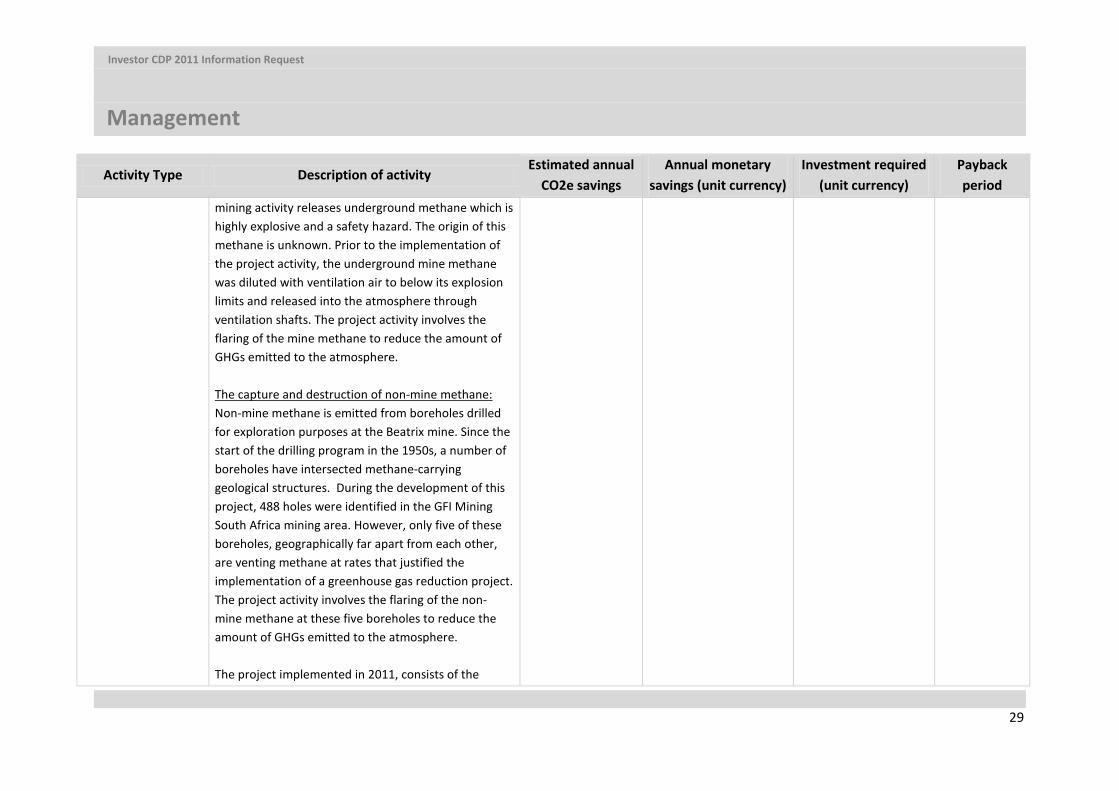
Activity Type Description of activity Estimated annual
CO2e savings Annual monetary
savings (unit currency) Investment required
(unit currency) Payback period
mining activity releases underground methane which is highly explosive and a safety hazard. The origin of this methane is unknown. Prior to the implementation of the project activity, the underground mine methane was diluted with ventilation air to below its explosion limits and released into the atmosphere through ventilation shafts. The project activity involves the flaring of the mine methane to reduce the amount of GHGs emitted to the atmosphere. The capture and destruction of non-mine methane: Non-mine methane is emitted from boreholes drilled for exploration purposes at the Beatrix mine. Since the start of the drilling program in the 1950s, a number of boreholes have intersected methane-carrying geological structures. During the development of this project, 488 holes were identified in the GFI Mining South Africa mining area. However, only five of these boreholes, geographically far apart from each other, are venting methane at rates that justified the implementation of a greenhouse gas reduction project. The project activity involves the flaring of the non-mine methane at these five boreholes to reduce the amount of GHGs emitted to the atmosphere. The project implemented in 2011, consists of the
Investor CDP 2011 Information Request
Management
30
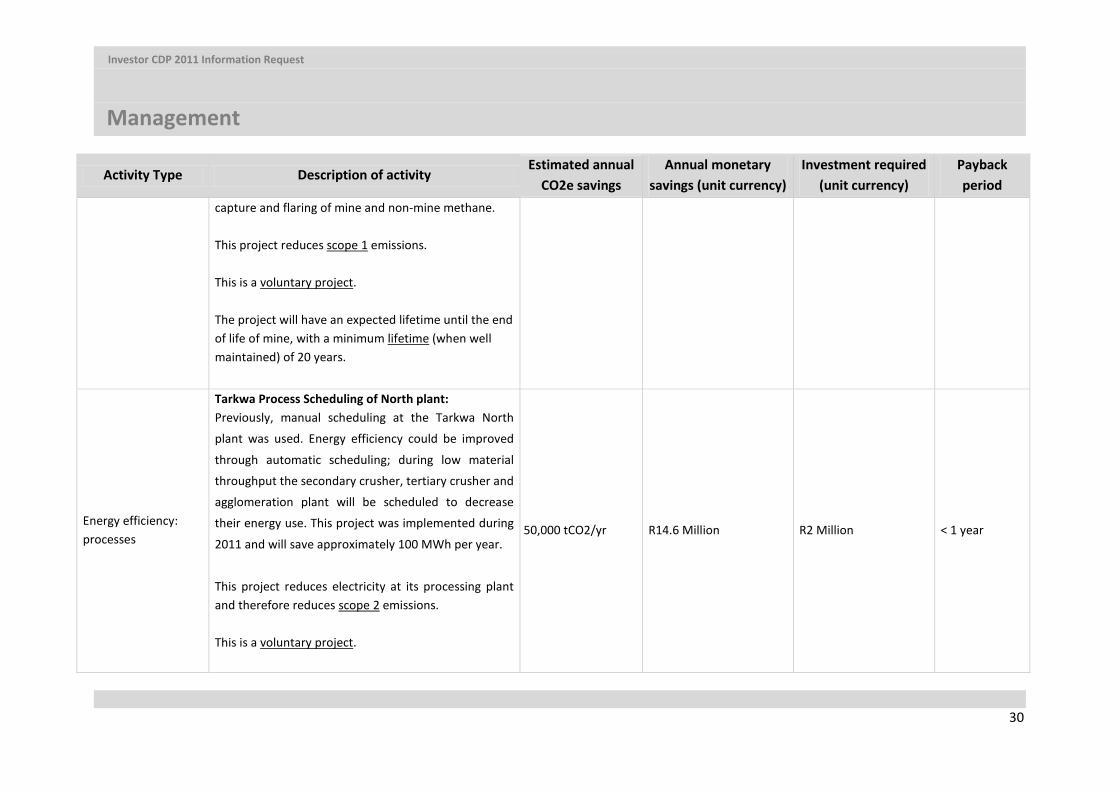
Activity Type Description of activity Estimated annual
CO2e savings Annual monetary
savings (unit currency) Investment required
(unit currency) Payback period
capture and flaring of mine and non-mine methane. This project reduces scope 1 emissions. This is a voluntary project. The project will have an expected lifetime until the end of life of mine, with a minimum lifetime (when well maintained) of 20 years.
Energy efficiency: processes
Tarkwa Process Scheduling of North plant: Previously, manual scheduling at the Tarkwa North
plant was used. Energy efficiency could be improved
through automatic scheduling; during low material
throughput the secondary crusher, tertiary crusher and
agglomeration plant will be scheduled to decrease
their energy use. This project was implemented during
2011 and will save approximately 100 MWh per year.
This project reduces electricity at its processing plant and therefore reduces scope 2 emissions. This is a voluntary project.
50,000 tCO2/yr R14.6 Million R2 Million < 1 year

Investor CDP 2011 Information Request
Management
31
Activity Type Description of activity Estimated annual
CO2e savings Annual monetary
savings (unit currency) Investment required
(unit currency) Payback period
The project will have a minimum lifetime (when well maintained) of 20 years.
Energy efficiency: processes
South Deep main fan impeller replacement: this project replaced the inefficient fan impellers and installed new efficient impellers for the main fan station at South Deep. The new impellers are more aerodynamically efficient and reduce the shaft load on the motor. The reduced load will ensure a reduction in the electrical energy usage during all operating hours of the specific fan. This project was implemented to reduce the mine’s energy requirements and to comply with its emission reduction targets, as presented in question 3.1b (ID: South). This project reduces electricity usage and therefore scope 2 emissions. This is a voluntary project. The project will have an expected lifetime until the end of life of mine, with a minimum lifetime (when well maintained) of 20 years.
6,300 tCO2e/yr R6,000,000 R2,700,000 < 1 year
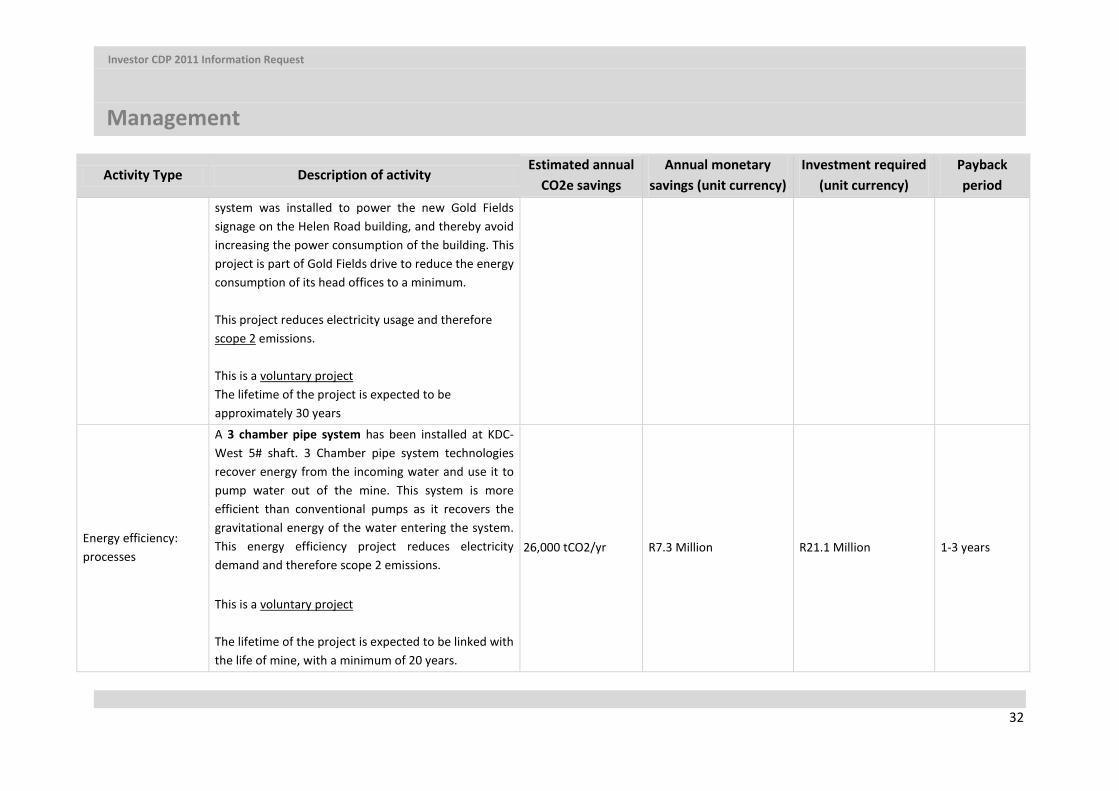
Low Carbon Energy Installation
Solar panels have been installed on the roof of Gold Fields’ head office (Sandton, South Africa). The solar
20 tCO2e/yr R4,000 R115,000 > 3 years
Investor CDP 2011 Information Request
Management
32
Activity Type Description of activity Estimated annual
CO2e savings Annual monetary
savings (unit currency) Investment required
(unit currency) Payback period
system was installed to power the new Gold Fields signage on the Helen Road building, and thereby avoid increasing the power consumption of the building. This project is part of Gold Fields drive to reduce the energy consumption of its head offices to a minimum. This project reduces electricity usage and therefore scope 2 emissions. This is a voluntary project The lifetime of the project is expected to be approximately 30 years
Energy efficiency: processes
A 3 chamber pipe system has been installed at KDC-West 5# shaft. 3 Chamber pipe system technologies recover energy from the incoming water and use it to pump water out of the mine. This system is more efficient than conventional pumps as it recovers the gravitational energy of the water entering the system. This energy efficiency project reduces electricity demand and therefore scope 2 emissions. This is a voluntary project The lifetime of the project is expected to be linked with the life of mine, with a minimum of 20 years.
26,000 tCO2/yr R7.3 Million R21.1 Million 1-3 years
Investor CDP 2011 Information Request
Management
33
Activity Type Description of activity Estimated annual
CO2e savings Annual monetary
savings (unit currency) Investment required
(unit currency) Payback period
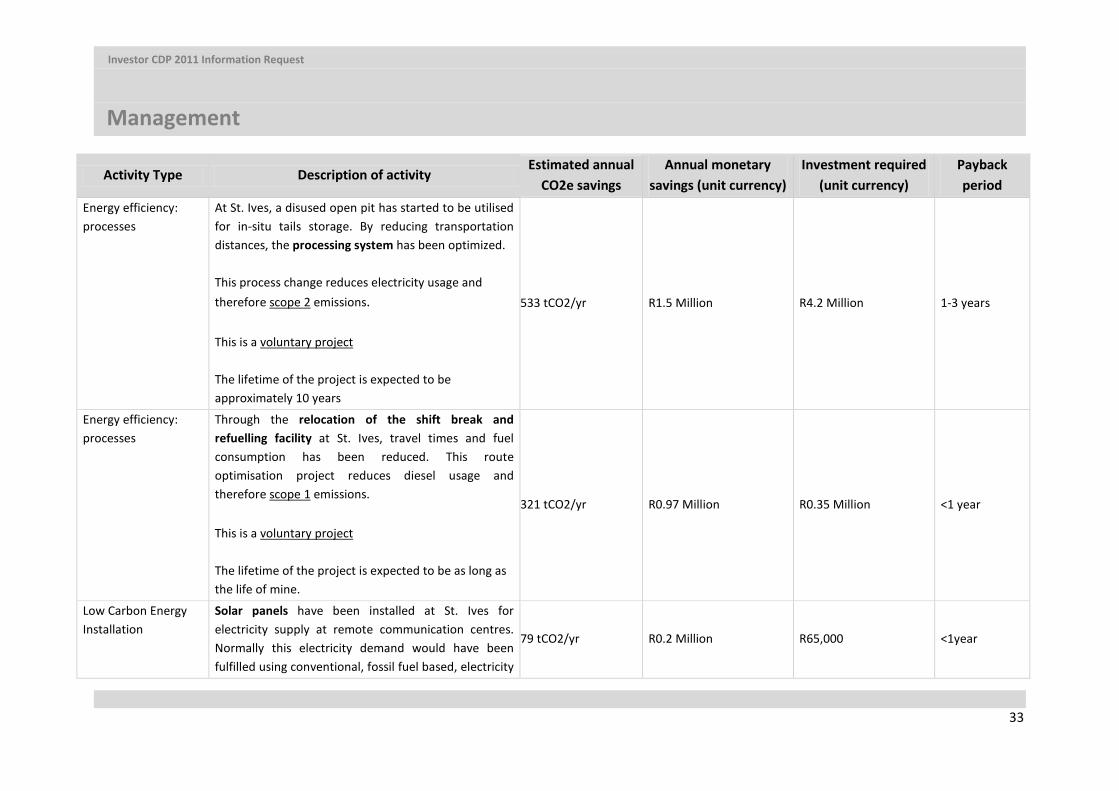
Energy efficiency: processes
At St. Ives, a disused open pit has started to be utilised for in-situ tails storage. By reducing transportation distances, the processing system has been optimized. This process change reduces electricity usage and therefore scope 2 emissions. This is a voluntary project The lifetime of the project is expected to be approximately 10 years
533 tCO2/yr R1.5 Million R4.2 Million 1-3 years
Energy efficiency: processes
Through the relocation of the shift break and refuelling facility at St. Ives, travel times and fuel consumption has been reduced. This route optimisation project reduces diesel usage and therefore scope 1 emissions. This is a voluntary project The lifetime of the project is expected to be as long as the life of mine.
321 tCO2/yr R0.97 Million R0.35 Million <1 year
Low Carbon Energy Installation
Solar panels have been installed at St. Ives for electricity supply at remote communication centres. Normally this electricity demand would have been fulfilled using conventional, fossil fuel based, electricity
79 tCO2/yr R0.2 Million R65,000 <1year

Investor CDP 2011 Information Request
Management
34
Activity Type Description of activity Estimated annual
CO2e savings Annual monetary
savings (unit currency) Investment required
(unit currency) Payback period
supply. Following Gold Fields drive to reduce its emissions, the choice for solar panels was made. As this project reduces electricity demand, scope 2 emissions are reduced. This is a voluntary project The lifetime of the project is expected to be approximately 30 years
Energy efficiency: processes
Insulation of the heat paths within the Heap Leach Elution Process (where gold is extracted) has reduced heat demand. Less energy input, which was obtained through LPG combustion, is required and therefore scope 1 emissions have been reduced. This is a voluntary project The lifetime of the project is expected to be approximately 10 years
30 tCO2/yr R86,000 R75,000 <1 year
Low Carbon Energy Installation
At St. Ives, the diesel lighting tower has been replaced with a renewable energy hybrid light tower. Instead of using diesel only, electricity is generated using solar panels. When insufficient electricity is stored from solar energy, diesel will be used as a backup. This project is expected to be rolled out at the operations.
23 tCO2/yr R66,000 R77,000 1-3 years

Investor CDP 2011 Information Request
Management
35
Activity Type Description of activity Estimated annual
CO2e savings Annual monetary
savings (unit currency) Investment required
(unit currency) Payback period
As diesel usage is reduced through the implementation of this project, scope 1 emissions have been reduced. This is a voluntary project The lifetime of the project is expected to be approximately 30 years
Energy efficiency: processes
At St. Ives, conventional hot water units that break down are being replaced with heat pumps for the purpose of water heating. Though the first units have been replaced, this project will be scaled up over time as units need to be replaced. As electricity usage is reduced, scope 2 emissions are reduced through this project. This is a voluntary project The lifetime of the project is expected to be approximately 15 years
11 tCO2/yr R14,000 R49,000 >3 years
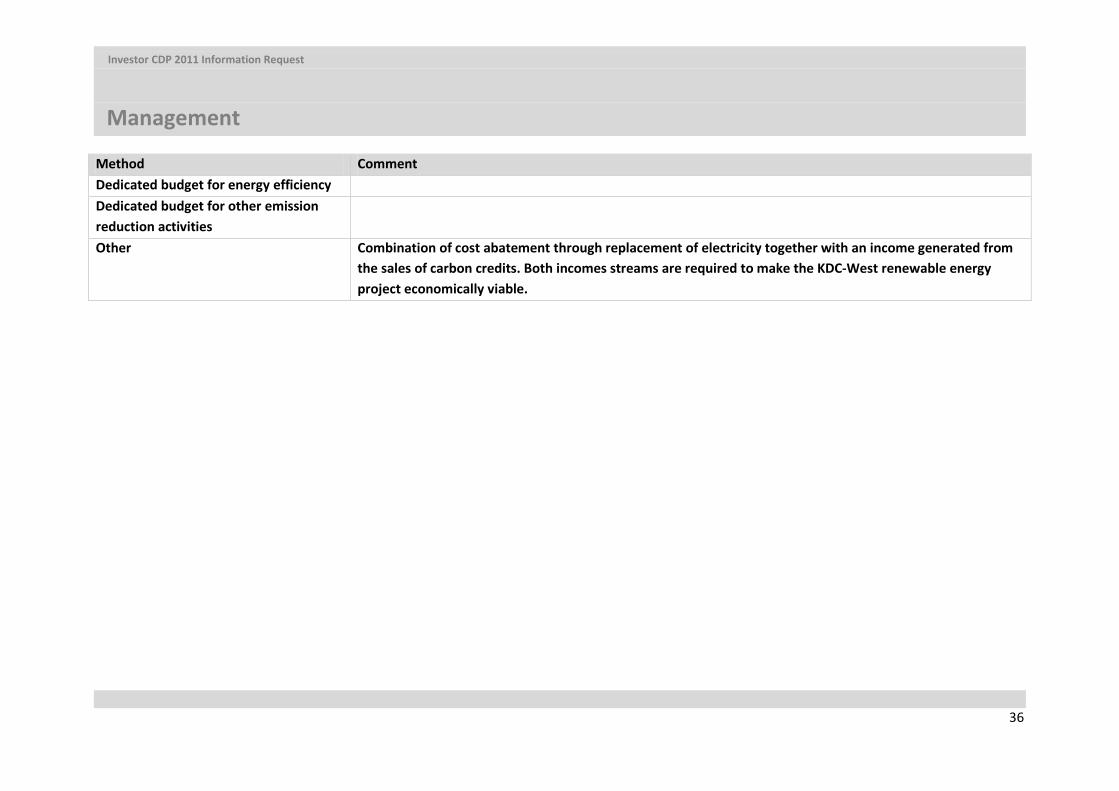
3.3c What methods do you use to drive investment in emissions reduction activities? (CDP 2011 Q3.3b, no change)
Investor CDP 2011 Information Request
Management
36
Method Comment Dedicated budget for energy efficiency Dedicated budget for other emission reduction activities
Other Combination of cost abatement through replacement of electricity together with an income generated from the sales of carbon credits. Both incomes streams are required to make the KDC-West renewable energy project economically viable.
Investor CDP 2011 Information Request
Management
37
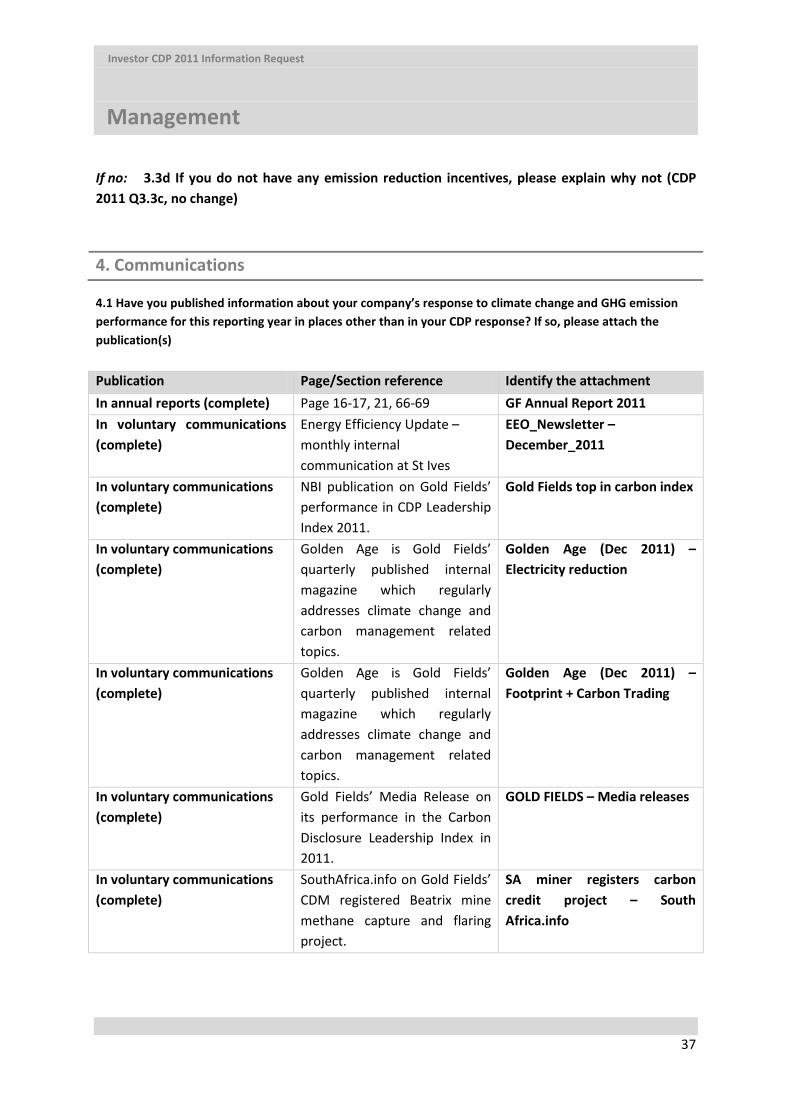
If no: 3.3d If you do not have any emission reduction incentives, please explain why not (CDP 2011 Q3.3c, no change)
4. Communications
4.1 Have you published information about your company’s response to climate change and GHG emission performance for this reporting year in places other than in your CDP response? If so, please attach the publication(s) Publication Page/Section reference Identify the attachment In annual reports (complete) Page 16-17, 21, 66-69 GF Annual Report 2011 In voluntary communications (complete)
Energy Efficiency Update – monthly internal communication at St Ives
EEO_Newsletter – December_2011
In voluntary communications (complete)
NBI publication on Gold Fields’ performance in CDP Leadership Index 2011.
Gold Fields top in carbon index
In voluntary communications (complete)
Golden Age is Gold Fields’ quarterly published internal magazine which regularly addresses climate change and carbon management related topics.
Golden Age (Dec 2011) – Electricity reduction
In voluntary communications (complete)
Golden Age is Gold Fields’ quarterly published internal magazine which regularly addresses climate change and carbon management related topics.
Golden Age (Dec 2011) – Footprint + Carbon Trading
In voluntary communications (complete)
Gold Fields’ Media Release on its performance in the Carbon Disclosure Leadership Index in 2011.
GOLD FIELDS – Media releases
In voluntary communications (complete)
SouthAfrica.info on Gold Fields’ CDM registered Beatrix mine methane capture and flaring project.
SA miner registers carbon credit project – South Africa.info
Investor CDP 2011 Information Request
Risks & Opportunities
38
5. Climate Change Risk
5.1 Have you identified any climate change risks (current or future) that have the potential to generate a substantive change in your business operations, revenue or expenditure? Please identify the relevant categories:
Risks driven by regulation Risks driven by changes in physical climate parameter Risks driven by changes in other climate-related developments
Investor CDP 2011 Information Request
Risks & Opportunities
39
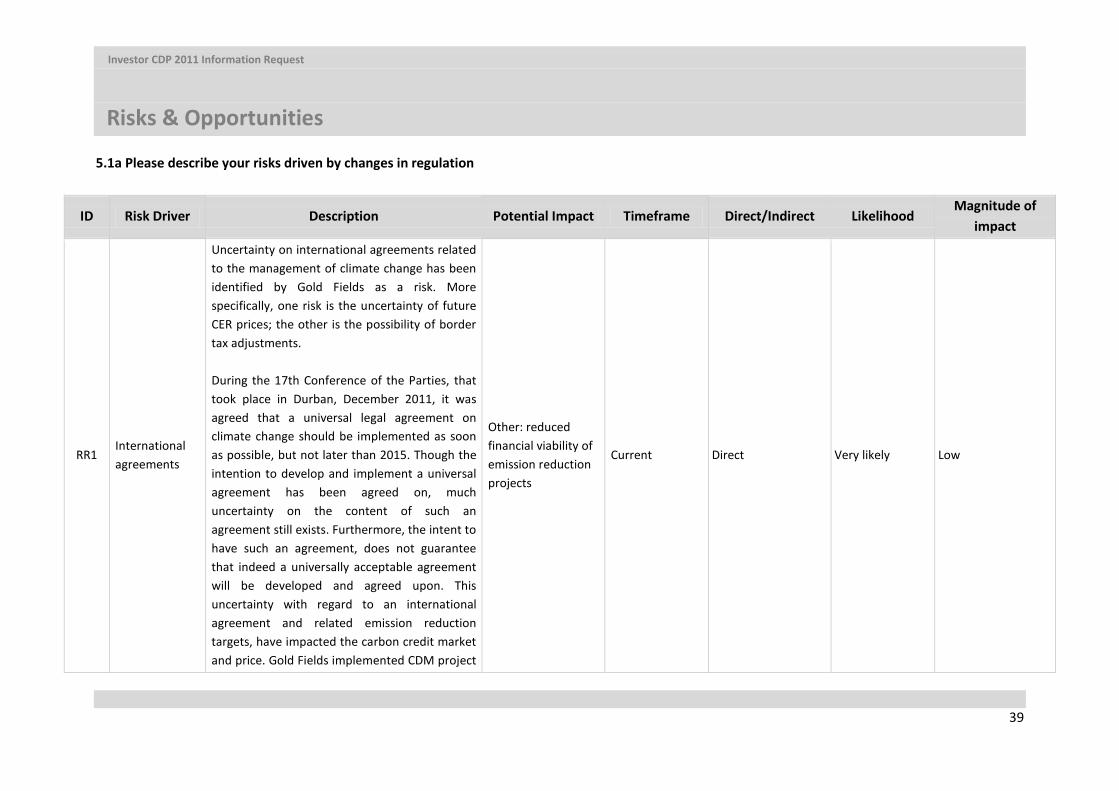
5.1a Please describe your risks driven by changes in regulation
ID Risk Driver Description Potential Impact Timeframe Direct/Indirect Likelihood Magnitude of
impact
RR1 International agreements
Uncertainty on international agreements related to the management of climate change has been identified by Gold Fields as a risk. More specifically, one risk is the uncertainty of future CER prices; the other is the possibility of border tax adjustments. During the 17th Conference of the Parties, that took place in Durban, December 2011, it was agreed that a universal legal agreement on climate change should be implemented as soon as possible, but not later than 2015. Though the intention to develop and implement a universal agreement has been agreed on, much uncertainty on the content of such an agreement still exists. Furthermore, the intent to have such an agreement, does not guarantee that indeed a universally acceptable agreement will be developed and agreed upon. This uncertainty with regard to an international agreement and related emission reduction targets, have impacted the carbon credit market and price. Gold Fields implemented CDM project
Other: reduced financial viability of emission reduction projects
Current Direct Very likely Low
Investor CDP 2011 Information Request
Risks & Opportunities
40
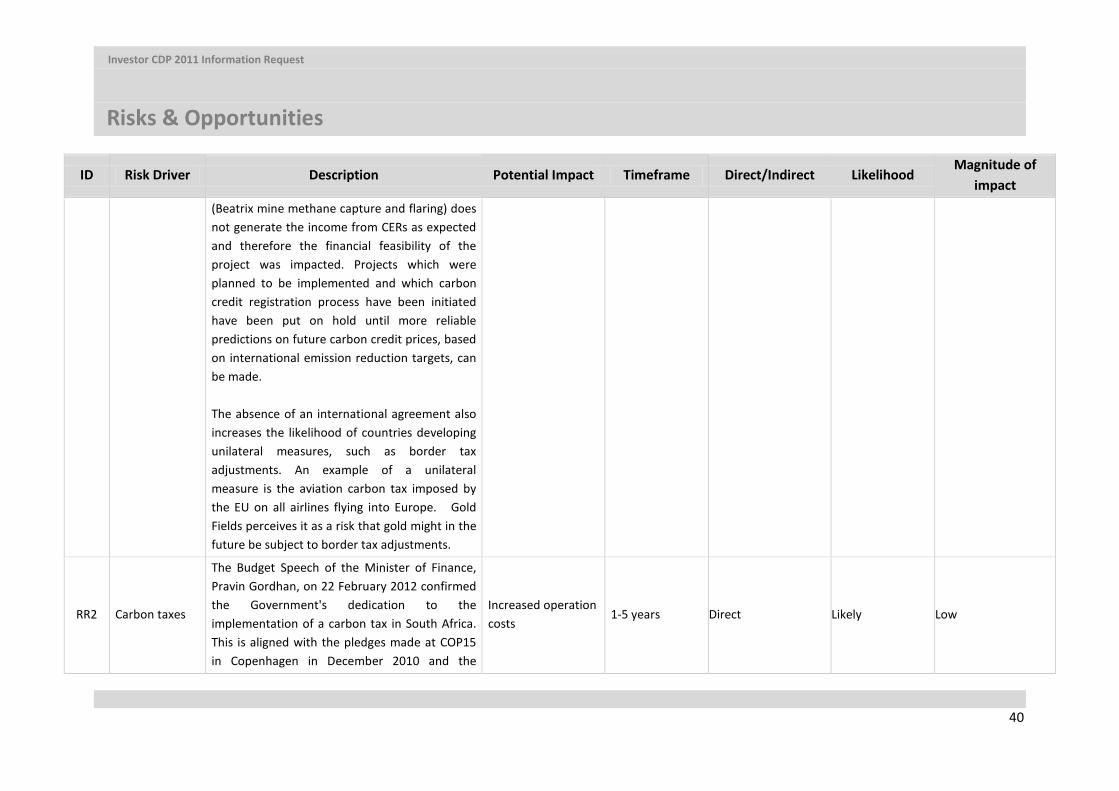
ID Risk Driver Description Potential Impact Timeframe Direct/Indirect Likelihood Magnitude of
impact (Beatrix mine methane capture and flaring) does not generate the income from CERs as expected and therefore the financial feasibility of the project was impacted. Projects which were planned to be implemented and which carbon credit registration process have been initiated have been put on hold until more reliable predictions on future carbon credit prices, based on international emission reduction targets, can be made. The absence of an international agreement also increases the likelihood of countries developing unilateral measures, such as border tax adjustments. An example of a unilateral measure is the aviation carbon tax imposed by the EU on all airlines flying into Europe. Gold Fields perceives it as a risk that gold might in the future be subject to border tax adjustments.
RR2 Carbon taxes
The Budget Speech of the Minister of Finance, Pravin Gordhan, on 22 February 2012 confirmed the Government's dedication to the implementation of a carbon tax in South Africa. This is aligned with the pledges made at COP15 in Copenhagen in December 2010 and the
Increased operation costs
1-5 years Direct Likely Low
Investor CDP 2011 Information Request
Risks & Opportunities
41
ID Risk Driver Description Potential Impact Timeframe Direct/Indirect Likelihood Magnitude of
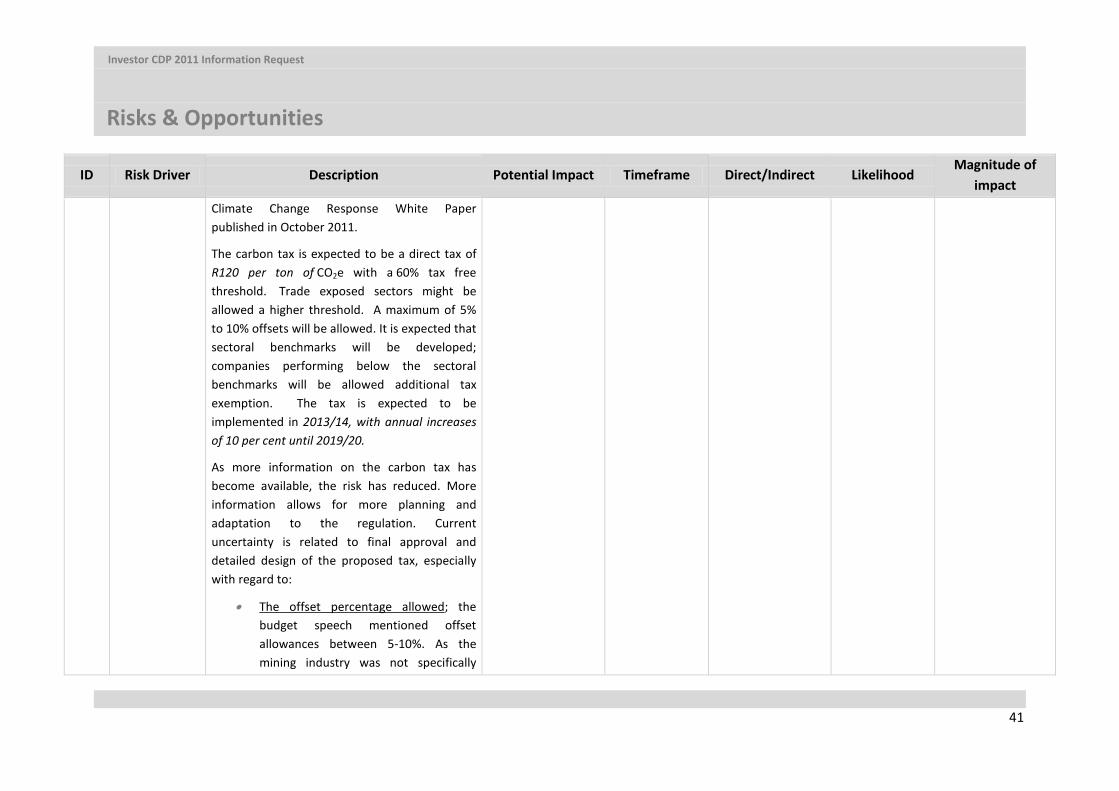
impact Climate Change Response White Paper published in October 2011.
The carbon tax is expected to be a direct tax of R120 per ton of CO2e with a 60% tax free threshold. Trade exposed sectors might be allowed a higher threshold. A maximum of 5% to 10% offsets will be allowed. It is expected that sectoral benchmarks will be developed; companies performing below the sectoral benchmarks will be allowed additional tax exemption. The tax is expected to be implemented in 2013/14, with annual increases of 10 per cent until 2019/20.
As more information on the carbon tax has become available, the risk has reduced. More information allows for more planning and adaptation to the regulation. Current uncertainty is related to final approval and detailed design of the proposed tax, especially with regard to:
• The offset percentage allowed; the budget speech mentioned offset allowances between 5-10%. As the mining industry was not specifically
Investor CDP 2011 Information Request
Risks & Opportunities
42
ID Risk Driver Description Potential Impact Timeframe Direct/Indirect Likelihood Magnitude of
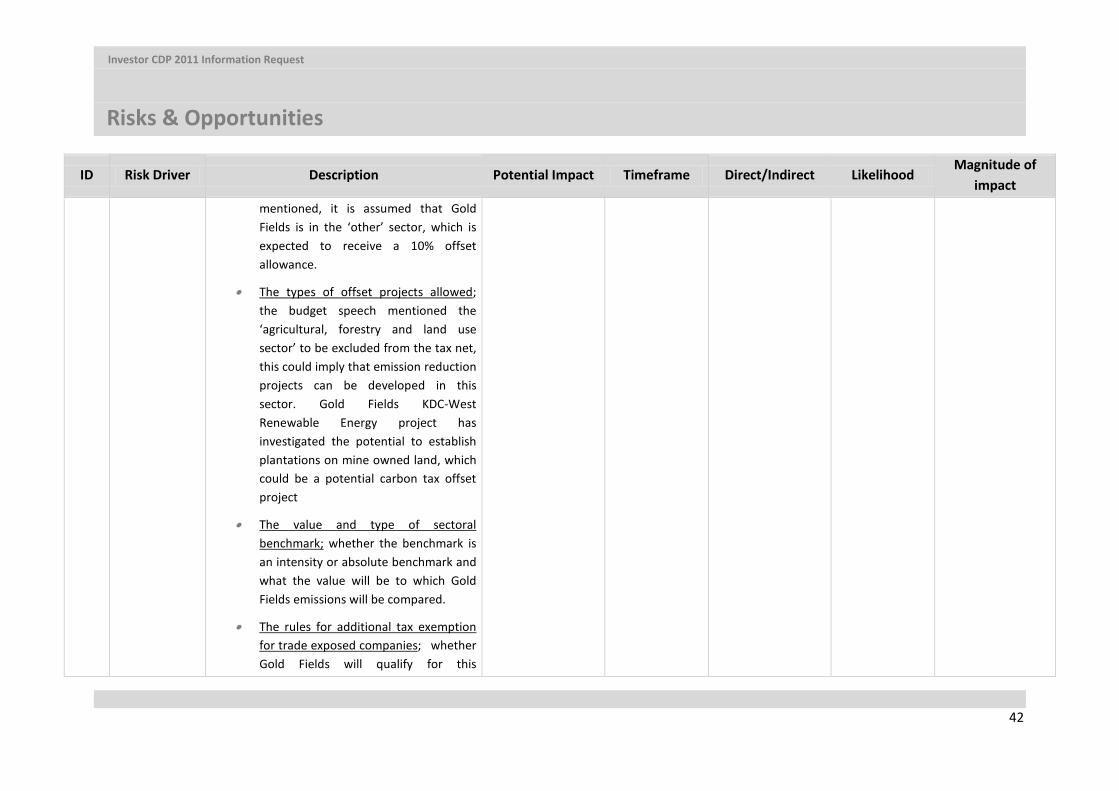
impact mentioned, it is assumed that Gold Fields is in the ‘other’ sector, which is expected to receive a 10% offset allowance.
• The types of offset projects allowed; the budget speech mentioned the ‘agricultural, forestry and land use sector’ to be excluded from the tax net, this could imply that emission reduction projects can be developed in this sector. Gold Fields KDC-West Renewable Energy project has investigated the potential to establish plantations on mine owned land, which could be a potential carbon tax offset project
• The value and type of sectoral benchmark; whether the benchmark is an intensity or absolute benchmark and what the value will be to which Gold Fields emissions will be compared.
• The rules for additional tax exemption for trade exposed companies; whether Gold Fields will qualify for this
Investor CDP 2011 Information Request
Risks & Opportunities
43
ID Risk Driver Description Potential Impact Timeframe Direct/Indirect Likelihood Magnitude of
impact exemption.
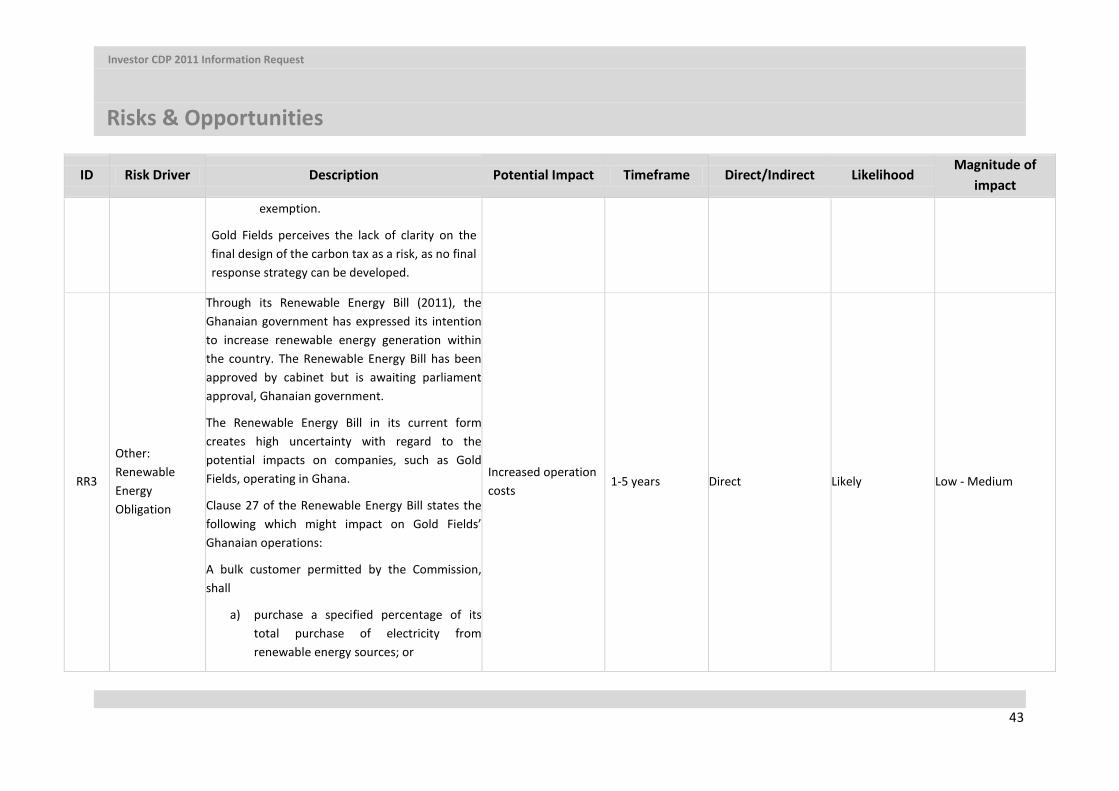
Gold Fields perceives the lack of clarity on the final design of the carbon tax as a risk, as no final response strategy can be developed.
RR3
Other: Renewable Energy Obligation
Through its Renewable Energy Bill (2011), the Ghanaian government has expressed its intention to increase renewable energy generation within the country. The Renewable Energy Bill has been approved by cabinet but is awaiting parliament approval, Ghanaian government.
The Renewable Energy Bill in its current form creates high uncertainty with regard to the potential impacts on companies, such as Gold Fields, operating in Ghana.
Clause 27 of the Renewable Energy Bill states the following which might impact on Gold Fields’ Ghanaian operations:
A bulk customer permitted by the Commission, shall
a) purchase a specified percentage of its total purchase of electricity from renewable energy sources; or
Increased operation costs 1-5 years Direct Likely Low - Medium
Investor CDP 2011 Information Request
Risks & Opportunities
44
ID Risk Driver Description Potential Impact Timeframe Direct/Indirect Likelihood Magnitude of
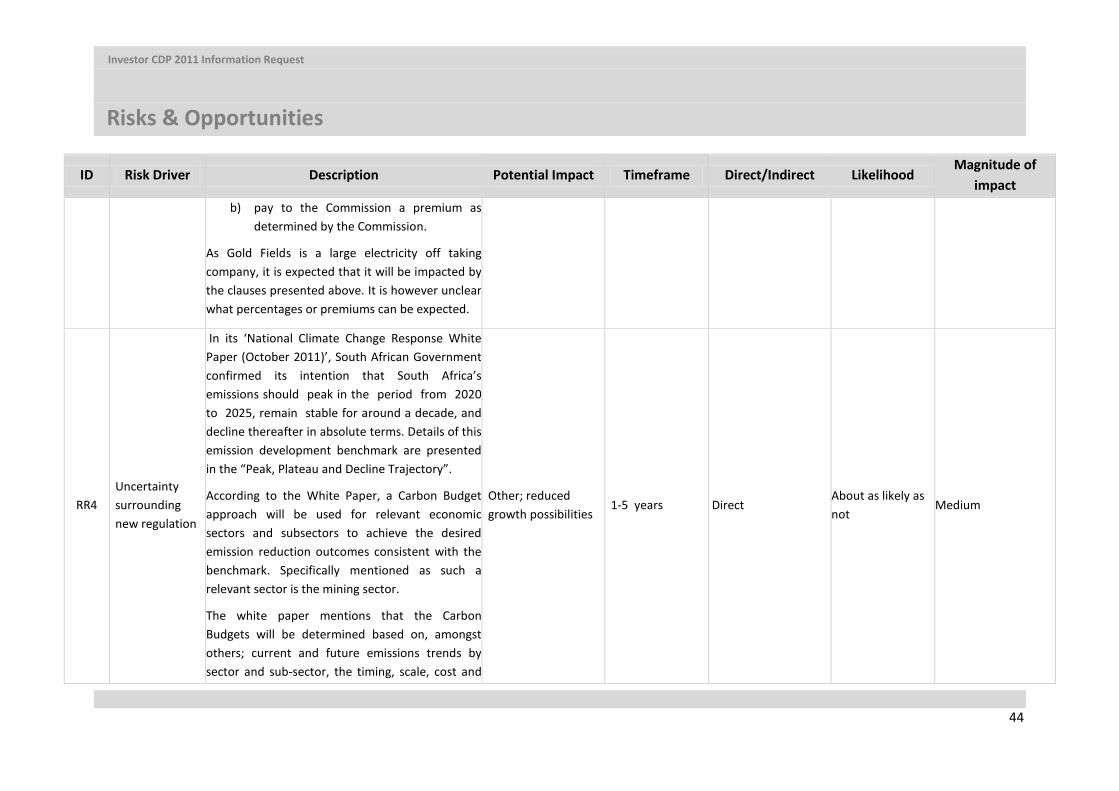
impact b) pay to the Commission a premium as
determined by the Commission.
As Gold Fields is a large electricity off taking company, it is expected that it will be impacted by the clauses presented above. It is however unclear what percentages or premiums can be expected.
RR4 Uncertainty surrounding new regulation
In its ‘National Climate Change Response White Paper (October 2011)’, South African Government confirmed its intention that South Africa’s emissions should peak in the period from 2020 to 2025, remain stable for around a decade, and decline thereafter in absolute terms. Details of this emission development benchmark are presented in the “Peak, Plateau and Decline Trajectory”.
According to the White Paper, a Carbon Budget approach will be used for relevant economic sectors and subsectors to achieve the desired emission reduction outcomes consistent with the benchmark. Specifically mentioned as such a relevant sector is the mining sector.
The white paper mentions that the Carbon Budgets will be determined based on, amongst others; current and future emissions trends by sector and sub-sector, the timing, scale, cost and
Other; reduced growth possibilities
1-5 years Direct About as likely as not
Medium
Investor CDP 2011 Information Request
Risks & Opportunities
45
ID Risk Driver Description Potential Impact Timeframe Direct/Indirect Likelihood Magnitude of
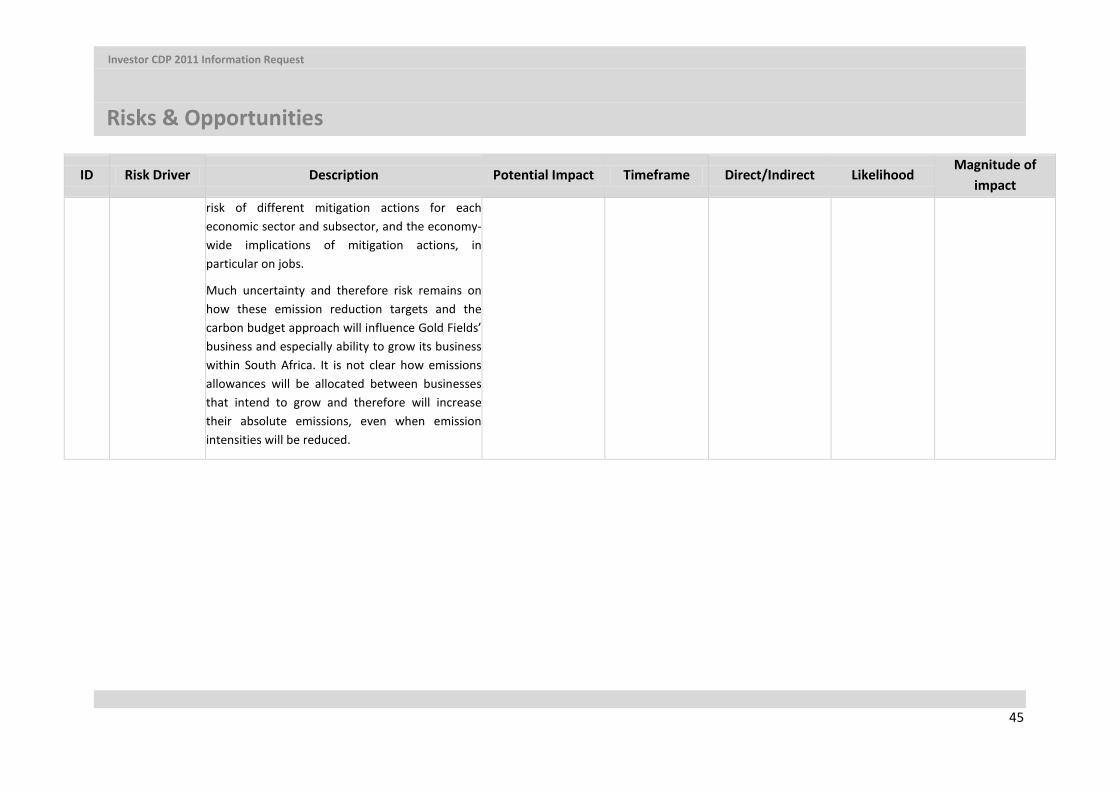
impact risk of different mitigation actions for each economic sector and subsector, and the economy-wide implications of mitigation actions, in particular on jobs.
Much uncertainty and therefore risk remains on how these emission reduction targets and the carbon budget approach will influence Gold Fields’ business and especially ability to grow its business within South Africa. It is not clear how emissions allowances will be allocated between businesses that intend to grow and therefore will increase their absolute emissions, even when emission intensities will be reduced.
Investor CDP 2011 Information Request
Risks & Opportunities
46
5.1b Please describe (i) the potential financial implications of risk before taking action; (ii) the methods you are using to manage this risk and (iii) the costs associated with these actions The risks / opportunities presented in italic have been moved to the ‘further information box (in CDP submission)’ due to character limitations (7000 characters). By describing one or two opportunities / risks in detail, the chance of obtaining maximum disclosure points was increased. Points are awarded to the best risk / opportunity within a category. ID: RR1 (International Agreements: Carbon Price uncertainty & border tax adjustment)
(i) Potential financial implications of risk before taking action:
• Carbon Credit price The risk of reduced income due to reduced carbon credit prices on other CDM projects
have become clear in the registered Beatrix Mine Methane Project. With an expected emission reduction potential of 253,329tCO2/yr, and an (at the time of registration)
expected CER price of 12 Euro/CER, income from CERs sales on this project were envisaged to be approximately R30 Million. As the CER price dropped to approximately 4 Euro/CER, the expected income is currently R10 Million. This is a significant risk to the
financial viability of projects and, depending on the development of the CER price might impact other projects which are in the pipeline for CDM registration.
• Border Tax Adjustment Gold Fields has calculated the potential financial impact of border tax adjustments on its
product. This calculation is based on the assumptions of a 20% reduction target and a price of Euro 10 per ton. Such a tax will increase the current cost base between 0.1% and
1.1% for the different operations and on average for the Group with 0.6%.
(ii) The methods you are using to manage this risk: As part of the methods used to manage this risk, developments within the carbon market space
are being monitored. The Carbon Management Strategy is continuously updated to appropriately respond to changes in the market. Gold Fields is furthermore investigating the opportunity to use the credits generated in its CDM projects as offsets into Australia from 2015
onwards.
(iii) The costs associated with these actions Parts of the above costs are absorbed in-house by the developers of the different CDM projects
(negotiations on carbon prices). Gold fields spends approximately R100,000 per year on carbon market related advise from external carbon specialists.
Investor CDP 2011 Information Request
Risks & Opportunities
47
ID: RR2 (carbon tax)
(i) Potential financial implications of risk before taking action Gold Fields has modelled the potential impact of a carbon tax on their operations. Based
on the 2012 Budget Speech a carbon tax of R 120 per ton of CO2 on 40% of the company’s Scope 1 and 2 emissions was assumed. The total costs for Gold Fields of such
a carbon tax would be approximately R250 Million. For the separate South African operations, the operating costs are expected to increase with:
Beatrix: 2.7% KDC: 2.1%
South Deep: 1.2%
However, uncertainty with regard to cost reduction potential exists: - Offsets; Gold Fields’ ‘biomass to energy project’ pre-feasibility study on the KDC-
West mine investigated the cost of establishing a plantation on mine land. It was
found that CO2 can be sequestered at a cost of approximately R70/tonne. This implies that R50 can be saved on every tonneCO2 that is allowed within the offset
allowance. If mine land rehabilitation obligations are taken into account, this saving might be higher. If the offsets are deducted only from the taxable proportion of the
carbon footprint (fixed benchmark), a 10% offset allowance will reduce carbon tax expenses with approximately R26 Million. However, a 5% offset allowance or not a
fixed benchmark (offsets are deducted from total carbon footprint), will reduce the carbon tax expenses with R13 Million in both cases. It is still unknown what type of
projects will be allowed as offset projects. - Tax exemption by performing under the sectoral benchmark; depending on the
value of the sectoral benchmark (and whether the benchmark is an intensity or absolute benchmark), tax exemption can be awarded if proven that Gold Fields
performs below the sectoral benchmark. An increased threshold of 5%, will reduce carbon tax expenditure with approximately R31 Million (12%). - Increased tax threshold due to trade exposure; based on an expected tax
threshold due to trade exposure of 10%, a tax expenditure reduction of approximately R60 Million is expected.
(ii) The methods you are using to manage this risk:
Gold Fields is managing the carbon tax risk and impact in a combination of ways:
• Gold Fields has drafted two sets of guidelines to incorporate climate change into is
operations. These guidelines cover economic impacts of climate change due to
Investor CDP 2011 Information Request
Risks & Opportunities
48
regulations, risks related to physical climate change parameters and other climate
change impacts; Guidelines to incorporate climate change aspects into existing operations.
Guidelines to incorporate climate change into the development of new projects.
• By reducing its carbon footprint, Gold Fields reduces its exposure to carbon tax. Its carbon footprint is reduced through behavioural changes to effect more efficient
operations, energy efficiency projects and through the implementation of renewable and alternative energy projects. Energy efficiency targets are included in the score
cards of managers, thereby linking their bonuses and increases to the repositioning of the business.
• Through the development of carbon offset projects, Gold Fields will reduce its own
carbon tax expenditure and might create additional income as only 5 to 10% of a company’s carbon footprint is expected to be allowed to be offset. Gold Fields has
large areas of land available where it could implement projects to increase its carbon stock. These can be sold as offsets at an estimated price of R120/tonne CO2
in 2013.
• Gold Fields engages with government on carbon tax related issues and proposes to government to develop mine specific benchmarks, for two reasons:
A sound sectoral benchmark cannot be developed for the mining industry as a whole due to the high variability in the grade and depth of ores, as well as
mine type (opencast vs. underground). By developing a reliable mine specific benchmark, it will become possible for
Energy Efficiency and Renewable Energy projects related emission savings to be deducted from the taxable portion of the carbon footprint.
Sound sectoral benchmarks will make the implementation of the carbon tax easier for all role players.
(iii) The costs associated with these actions
• Development of the guidelines to incorporate climate change aspects into existing operations and development of new operations: R90,000.
• Reducing of the company’s carbon footprint:
Stimulating behavioural change: development and updating of the Carbon Toolkit have cost the company R100,000. Internal communications on
carbon and energy related issues are incorporated in Gold Fields’ in-house costs.
Implementation of Renewable and alternative Energy Projects:
Investor CDP 2011 Information Request
Risks & Opportunities
49
o The Beatrix Methane project was implemented in 2011 with a total
cost of R80 Million. Implementation costs of Energy Efficiency projects in 2011 in South Africa
were approximately R28.5 Million.
• Investigations into carbon sequestration potential on Gold Fields owned land have
cost the company approximately R0.5 Million.
• Engagement with Government costs: o ITTCC membership fee: R376,200/yr
o ICMM membership fee: R115,000/yr o Chamber of Mines engagement: R40.5 Million in 2011
ID: RR3 (Ghana Renewable Energy Bill)
(i) Potential financial implications of risk before taking action There is no indication yet on the changed electricity price as a result of the Renewable Energy Bill in Ghana. Gold Fields currently pays an electricity price of approximately $0.15/kWh at its Ghanaian operations. Based on the specifications in the Renewable Energy Bill (see risk description), two premiums (5% and 10% price increase) have been modelled to estimate the impact of the expected price increase. This would increase the total costs at Ghanaian operations with US$3.5 Million (5% increase) to US$7 Million (10% increase) and increase the operational costs at Tarkwa and Damang between 0.6 to 2%.
(ii) The methods you are using to manage this risk
Gold Fields Ghana is currently managing the risk of the Renewable Energy Bill by investigating the option of an onsite bio-energy plant. These investigations started in 2011 and it was found that through own renewable energy generation, renewable electricity can be generated for competitive prices compared to the current grid electricity price (depending on the scale and capital structure of the project). As Gold Fields is not a power producer, it has started negotiations to outsource the implementation and running of the plant.
(iii) The costs associated with these actions
• Gold Fields’ commitment to the feasibility study on the Tarkwa ‘Biomass to electricity project’ has been R1 Million.
ID: RR04 (Uncertainty surrounding new regulation)
(i) Potential financial implications of risk before taking action If the carbon budget is based on absolute emission reductions, as consistent with PPD trajectory, it is
expected there will be growth implications for Gold Fields. A typical deep Gold Fields gold mine has a
Investor CDP 2011 Information Request
Risks & Opportunities
50
carbon intensity of approximately 1.45 tCO2/ounces of gold (not corrected for ore grade and mining
depth). If Gold Fields would not downscale any of its current operations, be subject to an absolute carbon budget and open up a new operation, it is expected that these new growth projects will be
charged at a 100% carbon tax rate. Assuming a R120/tCO2 tax rate and average operating costs of R7,100/ounce of gold, operating costs will increase with R175/ounce of gold (2.5%).
(ii) The methods you are using to manage this risk
This risk is managed by engaging on a regular basis with government to communicate the impact of such proposition on the mining sector. Gold Fields’ engages on such topics with government via the
National Planning Commission, ICMM, ITTCC and the Chamber of mines.
(iii) The costs associated with these actions These costs are best expressed via the company’s membership fees to the following organisation:
ITTCC membership fee: R376,200/yr
ICMM membership fee: R115,000/yr Chamber of Mines engagement: R40.5 Million in 2011
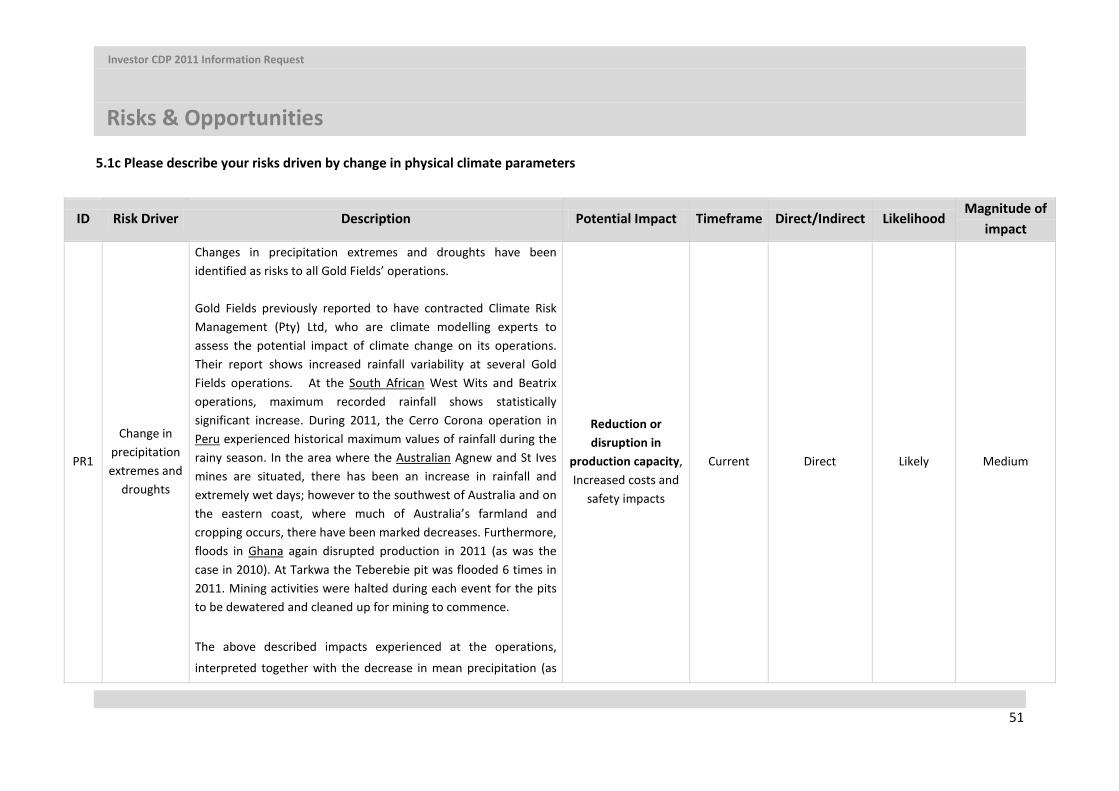
Investor CDP 2011 Information Request
Risks & Opportunities
51
5.1c Please describe your risks driven by change in physical climate parameters
ID Risk Driver Description Potential Impact Timeframe Direct/Indirect Likelihood Magnitude of
impact
PR1
Change in precipitation extremes and
droughts
Changes in precipitation extremes and droughts have been identified as risks to all Gold Fields’ operations. Gold Fields previously reported to have contracted Climate Risk Management (Pty) Ltd, who are climate modelling experts to assess the potential impact of climate change on its operations. Their report shows increased rainfall variability at several Gold Fields operations. At the South African West Wits and Beatrix operations, maximum recorded rainfall shows statistically significant increase. During 2011, the Cerro Corona operation in Peru experienced historical maximum values of rainfall during the rainy season. In the area where the Australian Agnew and St Ives mines are situated, there has been an increase in rainfall and extremely wet days; however to the southwest of Australia and on the eastern coast, where much of Australia’s farmland and cropping occurs, there have been marked decreases. Furthermore, floods in Ghana again disrupted production in 2011 (as was the case in 2010). At Tarkwa the Teberebie pit was flooded 6 times in 2011. Mining activities were halted during each event for the pits to be dewatered and cleaned up for mining to commence.
The above described impacts experienced at the operations,
interpreted together with the decrease in mean precipitation (as
Reduction or disruption in
production capacity, Increased costs and
safety impacts
Current Direct Likely Medium
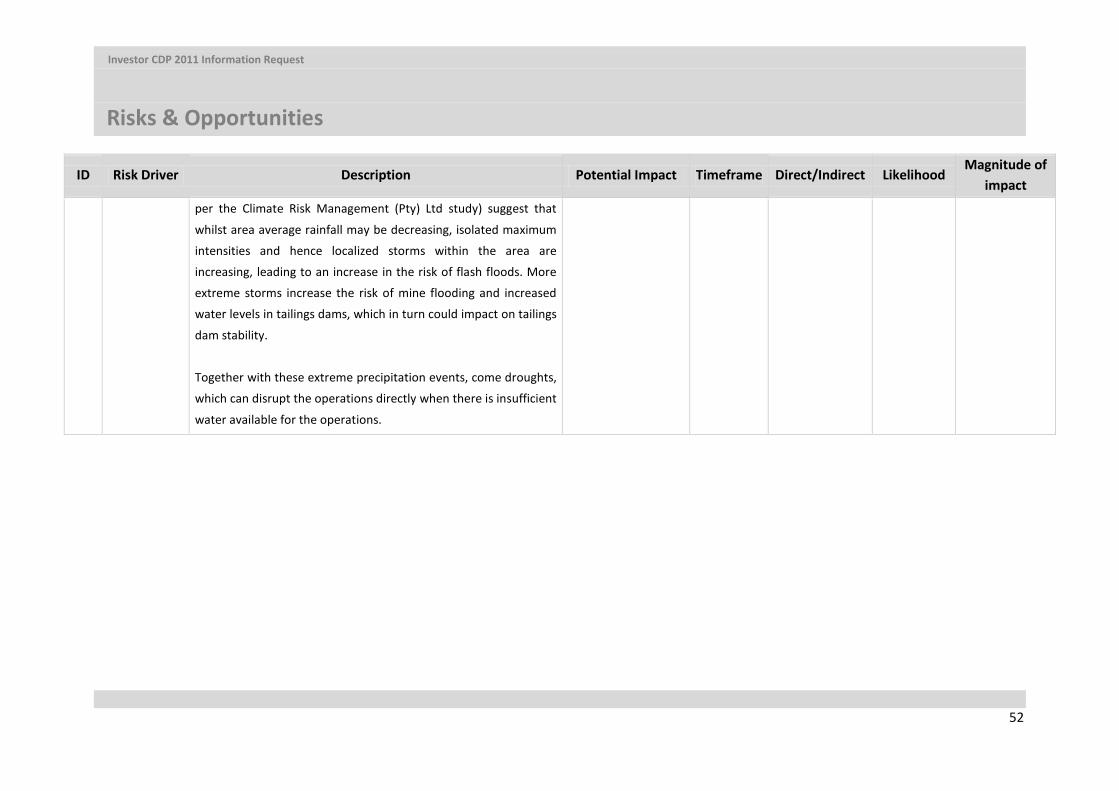
Investor CDP 2011 Information Request
Risks & Opportunities
52
ID Risk Driver Description Potential Impact Timeframe Direct/Indirect Likelihood Magnitude of
impact per the Climate Risk Management (Pty) Ltd study) suggest that
whilst area average rainfall may be decreasing, isolated maximum
intensities and hence localized storms within the area are
increasing, leading to an increase in the risk of flash floods. More
extreme storms increase the risk of mine flooding and increased
water levels in tailings dams, which in turn could impact on tailings
dam stability.
Together with these extreme precipitation events, come droughts,
which can disrupt the operations directly when there is insufficient
water available for the operations.
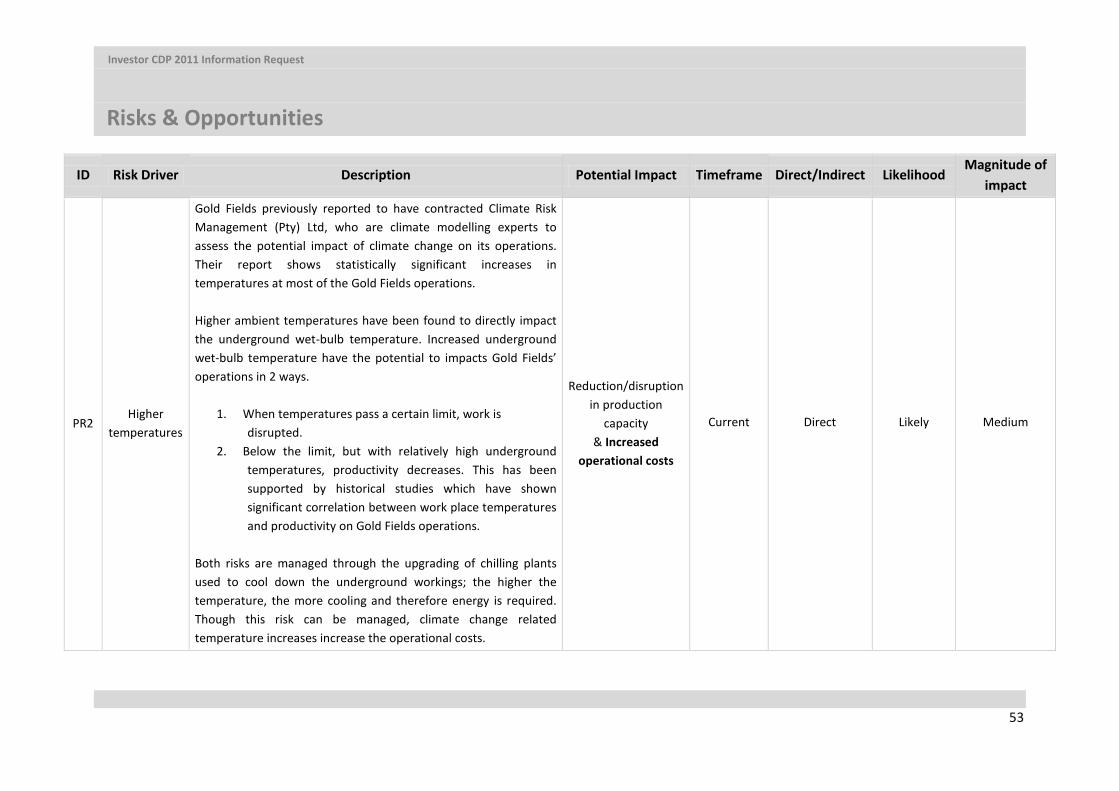
Investor CDP 2011 Information Request
Risks & Opportunities
53
ID Risk Driver Description Potential Impact Timeframe Direct/Indirect Likelihood Magnitude of
impact
PR2 Higher
temperatures
Gold Fields previously reported to have contracted Climate Risk Management (Pty) Ltd, who are climate modelling experts to assess the potential impact of climate change on its operations. Their report shows statistically significant increases in temperatures at most of the Gold Fields operations. Higher ambient temperatures have been found to directly impact the underground wet-bulb temperature. Increased underground wet-bulb temperature have the potential to impacts Gold Fields’ operations in 2 ways.
1. When temperatures pass a certain limit, work is disrupted.
2. Below the limit, but with relatively high underground temperatures, productivity decreases. This has been supported by historical studies which have shown significant correlation between work place temperatures and productivity on Gold Fields operations.
Both risks are managed through the upgrading of chilling plants used to cool down the underground workings; the higher the temperature, the more cooling and therefore energy is required. Though this risk can be managed, climate change related temperature increases increase the operational costs.
Reduction/disruption in production
capacity & Increased
operational costs
Current Direct Likely Medium
Investor CDP 2011 Information Request
Risks & Opportunities
54
5.1d Please describe (i) the potential financial implications of risk before taking action; (ii) the methods you are using to manage this risk and (iii) the costs associated with these actions
ID: PR1 (Change in precipitation extremes and droughts)
i. Potential financial implication: Gold Fields has recognized that climate change brings a change in precipitation extremes and
droughts frequency. Precipitation extremes and droughts can potentially a) compromise tailing dam stability, b) cause flooding of mines and c) disrupt / decrease operational capacity. The financial
implications of these risks are presented below:
a) Compromised Tailing Dam Stability: Increased rainfall and especially storms could impact on tailings dam stability.
Compromised tailing dam stability carriers a catastrophic risk on the safety of people and property.
b) Flooding of mines (pit/shaft):
At Tarkwa, the Teberebie pit was flooded 6 times in 2011. Mining activities were halted during each event for the pits to be dewatered and cleaned up. A total of 161,359 budget tonnes of ore was therefore not mined. At an average gold concentration of 0.03 ounce of gold/tonne ore, a total of approximately 5,000 ounces was lost during the floods. At an average gold price (during 2011) of R10,642/ounce, income was reduced with R53.2 Million. At an average Notional Cash Expenditure of 39%, a profit of approximately R32.5 Million was lost.
c) Droughts causing operation disruptions/decreased capacity: When the mine can’t continue operations as usual, due to a lack of water, droughts have the capacity to decrease the output and/or disrupt operations. Gold Fields’ Australian and South African operations are situated in water stressed areas (according to the World Business Council on Sustainable Development Water Tool). It is difficult to estimate the period of time operations are disrupted due to droughts, as this could be anything between a shift and longer periods. For that reason the impact is given per shift missed: Ghana: R4.1 Million Peru: R0.72 Million
South Africa: R16 Million Australia: R3.6 Million
Investor CDP 2011 Information Request
Risks & Opportunities
55
ii. The following methods are adapted to manage this risk:
To adapt and manage risks, all operations are subjected to risk analysis on a regular basis (see question 2.1 for more information). Furthermore, the above mentioned risks are
managed by the following actions:
a) Gold Fields manages and monitors its tailing dams intensively with the
purpose of having the tailings dams up to a standard to withstand rare, extreme weather events. Several actions prove this commitment:
A centralized tailings storage facility, designed to withstand 1 in 200 year rainfall events, was completed in 2011 and the first tailings deposited.
Freeboard was increased in 2011 on all Gold Fields’ South African tailing dams to mitigate flash flood risks.
Gold Fields appointed an independent tailing dam review board, which consists of tailing dam experts, to monitor the tailing dam at Cerro Corona.
b) Increased pumping capacity has been installed in 2011 in Ghana c) To manage the risk of having insufficient water due to droughts, the South
African operations have initiated the Liquid Gold Project. The Liquid Gold Project focuses primarily on achieving a technical solution for the treatment of
good quality fissure water and contaminated process water to produce water of potable quality. During 2011, a pre-feasibility study was completed and an environmental license obtained. A detailed Feasibility study will commence in
2012. The Australian operations have in 2011 diversified its water sources and increased water recycling. At St Ives, a third-party study was commissioned to
give detailed insight on the future viability of its current bore-field. Furthermore, St Ives is investigating the potential of a solar desalination
treatment process.
iii. Costing of the above: a) The costs related to tailing dam management in order to withstand extreme
weather events related to climate change:
• The building of the Centralized Tailing Storage Facility cost approximately R400 Million.
• Cost of Freeboard increase in 2011 at the South African operations was R2.4 Million.

Investor CDP 2011 Information Request
Risks & Opportunities
56
• Cost of the independent tailing dam review board is approximately R30
Million per year. b) Gold Fields Tarkwa installed an additional 4 high lift pumps and accessories at a
total cost of R6.7 million. c) Costs of the Liquid Gold Pre-feasibility study was R12.8 Million
Costs of the St Ives bore-field future viability study was R224,000
ID: PR2 (Change in mean (average) temperature) i. Potential financial implications:
There are several potential financial implications related to increased average temperatures:
• It has been Gold Fields’ experience that outside temperature increases impact directly the underground wet-bulb temperature, this indicating the air’s capacity to absorb moisture and
therefore aid cooling. If the wet-bulb temperature at the underground mines reaches a certain threshold, Gold Fields is legally obliged to stop operations until cooling has brought
the temperature below the threshold. Financial implications related to work disruptions are related to the revenue that is normally generated during a shift (between R0.75 Million and
R16 Million, depending on the operation).
• Research has shown that a 1 degree increase in work place temperature of underground mines decreases productivity by as much as 17%. It is Gold Fields experience that
temperature increases are directly transferred to underground web bulb temperatures. It is estimated that a one degree increase in temperature and an associated 17% reduction in
productivity would reduce revenue at the South African operations with approximately R2.7 Million /shift.
ii. The following methods are adapted to manage this risk:
Design parameters of all chilling plants have been changed and are now based on the results obtained from the climate change risk study done for Gold Fields by Climate Risk
Management (Pty) Ltd. Chilling plants have now been designed to compensate for expected increases in temperature over the life of mines. The chilling plants at the Beatrix and KDC
mine have been upgraded accordingly, with the South Deep upgrade still in process. New mines and expansions, such as the Beatrix-West expansion, are designed for higher wet-bulb
temperatures based on actual or expected temperature increases.
iii. Costs of this:
Chilling capacity demand has been found to have increased with 5-10% to offset the increased wet-bulb temperatures. Per chilling plant of R120M, about R6M to R12M is
expected to be the cost to offset increased temperatures, caused by climate change.
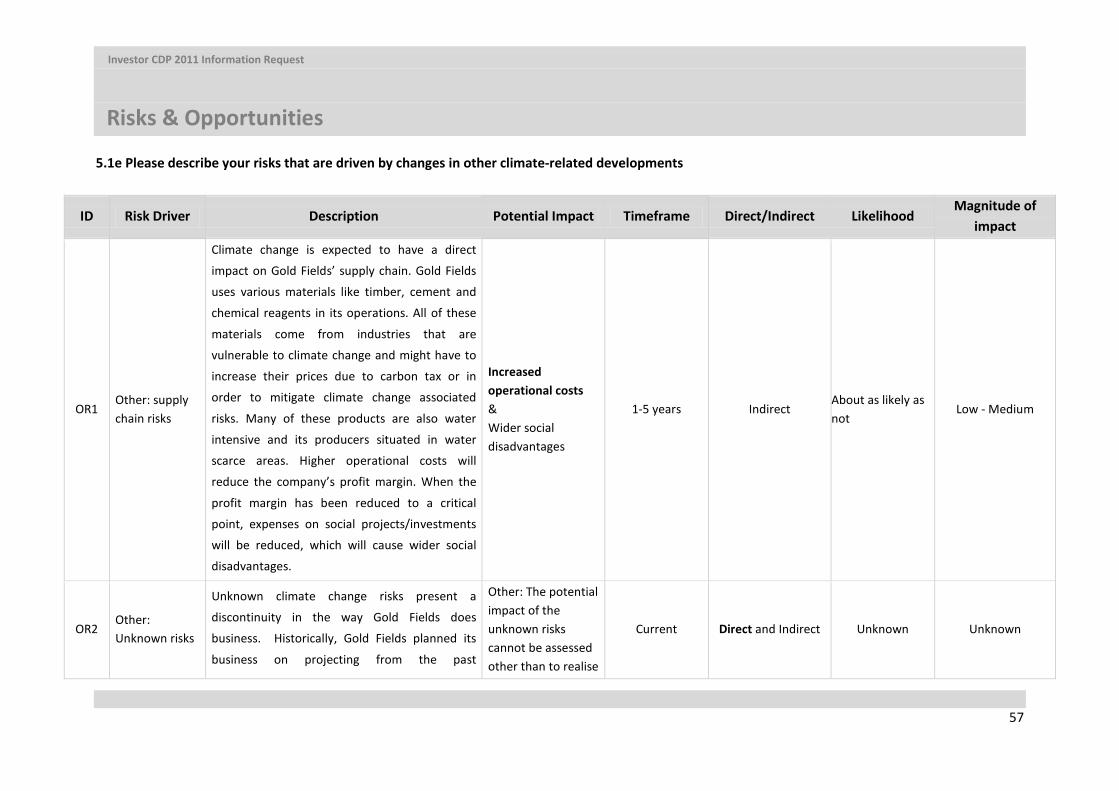
Investor CDP 2011 Information Request
Risks & Opportunities
57
5.1e Please describe your risks that are driven by changes in other climate-related developments
ID Risk Driver Description Potential Impact Timeframe Direct/Indirect Likelihood Magnitude of
impact
OR1 Other: supply chain risks
Climate change is expected to have a direct
impact on Gold Fields’ supply chain. Gold Fields
uses various materials like timber, cement and
chemical reagents in its operations. All of these
materials come from industries that are
vulnerable to climate change and might have to
increase their prices due to carbon tax or in
order to mitigate climate change associated
risks. Many of these products are also water
intensive and its producers situated in water
scarce areas. Higher operational costs will
reduce the company’s profit margin. When the
profit margin has been reduced to a critical
point, expenses on social projects/investments
will be reduced, which will cause wider social
disadvantages.
Increased operational costs & Wider social disadvantages
1-5 years Indirect About as likely as not
Low - Medium
OR2 Other: Unknown risks
Unknown climate change risks present a
discontinuity in the way Gold Fields does
business. Historically, Gold Fields planned its
business on projecting from the past
Other: The potential impact of the unknown risks cannot be assessed other than to realise
Current Direct and Indirect Unknown Unknown
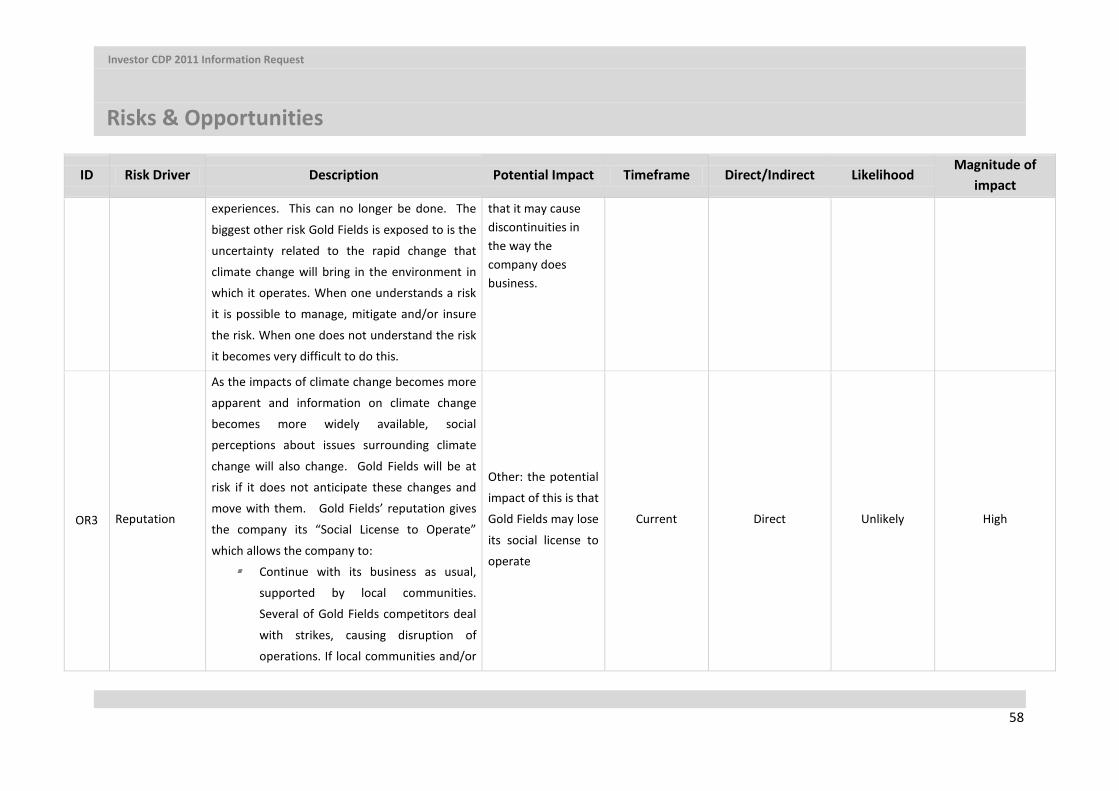
Investor CDP 2011 Information Request
Risks & Opportunities
58
ID Risk Driver Description Potential Impact Timeframe Direct/Indirect Likelihood Magnitude of
impact experiences. This can no longer be done. The
biggest other risk Gold Fields is exposed to is the
uncertainty related to the rapid change that
climate change will bring in the environment in
which it operates. When one understands a risk
it is possible to manage, mitigate and/or insure
the risk. When one does not understand the risk
it becomes very difficult to do this.
that it may cause discontinuities in the way the company does business.
OR3 Reputation
As the impacts of climate change becomes more
apparent and information on climate change
becomes more widely available, social
perceptions about issues surrounding climate
change will also change. Gold Fields will be at
risk if it does not anticipate these changes and
move with them. Gold Fields’ reputation gives
the company its “Social License to Operate”
which allows the company to:
Continue with its business as usual,
supported by local communities.
Several of Gold Fields competitors deal
with strikes, causing disruption of
operations. If local communities and/or
Other: the potential
impact of this is that
Gold Fields may lose
its social license to
operate
Current Direct Unlikely High
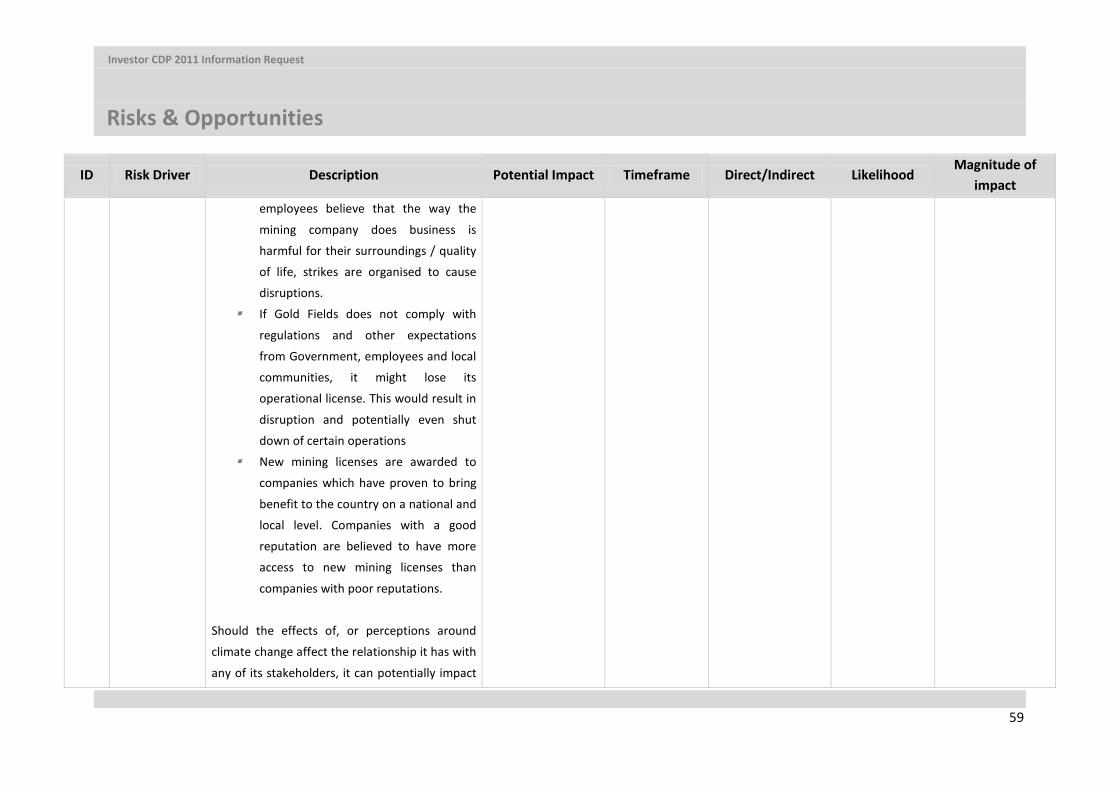
Investor CDP 2011 Information Request
Risks & Opportunities
59
ID Risk Driver Description Potential Impact Timeframe Direct/Indirect Likelihood Magnitude of
impact employees believe that the way the
mining company does business is
harmful for their surroundings / quality
of life, strikes are organised to cause
disruptions.
If Gold Fields does not comply with
regulations and other expectations
from Government, employees and local
communities, it might lose its
operational license. This would result in
disruption and potentially even shut
down of certain operations
New mining licenses are awarded to
companies which have proven to bring
benefit to the country on a national and
local level. Companies with a good
reputation are believed to have more
access to new mining licenses than
companies with poor reputations.
Should the effects of, or perceptions around
climate change affect the relationship it has with
any of its stakeholders, it can potentially impact
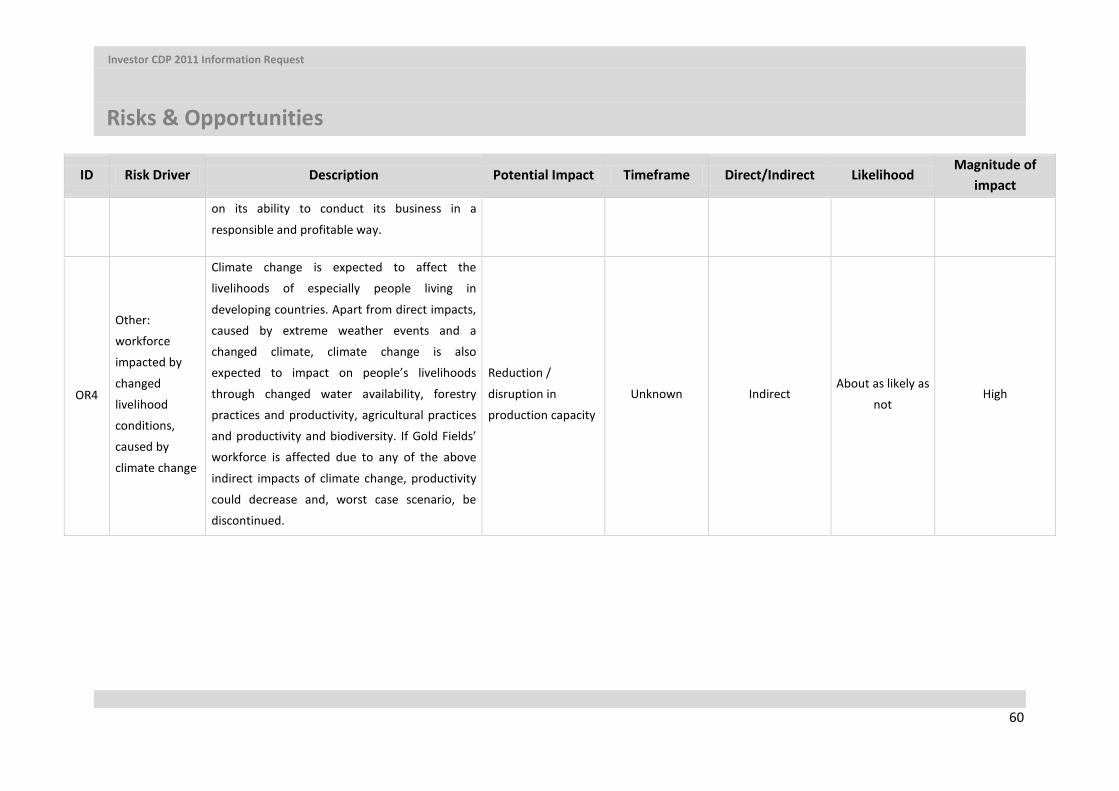
Investor CDP 2011 Information Request
Risks & Opportunities
60
ID Risk Driver Description Potential Impact Timeframe Direct/Indirect Likelihood Magnitude of
impact on its ability to conduct its business in a
responsible and profitable way.
OR4
Other:
workforce
impacted by
changed
livelihood
conditions,
caused by
climate change
Climate change is expected to affect the
livelihoods of especially people living in
developing countries. Apart from direct impacts,
caused by extreme weather events and a
changed climate, climate change is also
expected to impact on people’s livelihoods
through changed water availability, forestry
practices and productivity, agricultural practices
and productivity and biodiversity. If Gold Fields’
workforce is affected due to any of the above
indirect impacts of climate change, productivity
could decrease and, worst case scenario, be
discontinued.
Reduction /
disruption in
production capacity
Unknown Indirect About as likely as
not High
Investor CDP 2011 Information Request
Risks & Opportunities
61
5.1f Please describe (i) the potential financial implications of risk before taking action; (ii) the methods you are using to manage this risk and (iii) the costs associated with these actions ID:OR1 (Supply Chain Risks)
(i) The potential financial implications of risk before taking action:
Some of the supply chain products being at increased risk due to different climate change related
aspects include:
• Timber could, due to increased droughts, become more vulnerable to fires. The timber extraction process is also sensitive to high rainfall. Timber is used in Gold Fields’ operations
in South Africa and Ghana. Climate change is expected to reduce average precipitation in these regions and increase heavy rainfall events. If timber supply by its usual suppliers is
disrupted, it is expected that it could be sourced from other areas, though for a premium. Assuming a premium of R20/tonne on the timber purchased in South Africa and Ghana, this
risk has a potential financial implication of R3.2Million increase on Gold Fields operational costs (0.02% increase).
• The cement industry is an energy intensive sector and is therefore expected to be carbon tax vulnerable. A carbon tax imposed on the cement used by Gold Fields will increase its operational costs. Assuming a carbon tax for its South African suppliers of R48/tCO2 (based
on the budget speech announcement of R120/tCO2 and a tax free threshold of 60%), which is passed on for 50% to the consumer, Gold Fields operational costs could increase with
R60,000. As Australian carbon tax regulations have been announced and details provided, this is no longer perceived as a risk. However, based on its emission reduction intentions, it
could be possible that similar carbon tax systems will be implemented in Ghana and Peru. If the same assumptions as for the South African cement suppliers are made, operational costs
for Gold Fields could further increase with R1.5Million (0.007%).
• Majority (97%) of Gold Fields electricity is sourced from water scarce areas. In 2009, low
rainfall in the Volta River catchment area in Ghana reduced hydro power availability and disrupted power supply to Tarkwa mine. It is expected that increased events of extreme weather and changed weather patterns will cause more disruptions in electricity supply.
More than other products, a disruption of electricity supply is likely to disrupt operations. Electricity was disrupted at Damang during 2011, which caused an increase in diesel use in
its stand by generator and a reduced gold output. To produce electricity with the diesel generator is approximately R1.6/kWh more expensive. If no back up generation is available,
the costs are higher as they relate to operation disruption.

Investor CDP 2011 Information Request
Risks & Opportunities
62
• Liquid fuels are found to have sensitive infrastructure to extreme weather events. A
disruption of a liquid fuel supply chain is expected to cause a premium in fuel prices, as was the case for timber.
(ii) The methods you are using to manage this risk:
It is important for Gold Fields to know whether their suppliers have insight into potential
climate change related risks that may impact their operations and whether they are managing these risks actively. Gold Fields is currently implementing a supplier water and
carbon disclosure system. Suppliers will be requested to disclose the life cycle emissions of the products supplied. In the long term, Gold Fields would like to ask their suppliers to disclose their risks and opportunities related to climate change. As part of the
implementation of this supplier disclosure system, Gold Fields will offer their suppliers free workshops where they will learn how to calculate a company’s and product’s carbon
footprint. It is only once this system is fully operational and suppliers have insight in their product water and carbon footprints, that their risks can be actively managed. Gold Fields
will be preferring suppliers with low product life cycle emissions.
(iii) The costs associated with these actions: The cost of implementation of the system that requires suppliers to disclose the carbon
footprint of their products is minimal and managed in-house. Gold Fields is planning to offer several workshops on carbon footprint calculations to their suppliers from mid 2012, which
will come at a cost to the company of R50,000 each.
ID: OR2 (Unknown risks) i. The potential financial implications of risk before taking action:
Gold Fields recognises that unknown risks can significantly impact on its operations and
business; exact financial implications are not available as the risks are unknown.
ii. The methods you are using to manage this risk: This risk has been reported in previous CDPs but is found to still be relevant. A number of
risks reported on in this reporting year have been identified through the process of continued scanning of the climate change landscape on the regulatory, physical and other
fronts in order to make sure that new developments do not jeopardize Gold Fields’ business. The Carbon Management Strategy is integrated with the Risk Management Strategy in a way
that constantly scrutinises all the aspects of Gold Fields’ business for new risks. This risk evaluation is done regularly and under responsibility of an executive board member. Even
Investor CDP 2011 Information Request
Risks & Opportunities
63
though Gold Fields has such an advanced system in place to monitor and recognize climate
change related risks, the company acknowledges that new, unidentified risks might impact its business as usual.
iii. The costs associated with these actions:
The exact cost of the risk management system is unavailable as this is managed in-house.
ID: OR3 (Reputational Risks) (i) The potential financial implications of this risk before taking action:
If Gold Fields loses its social license to operate this may severely impact on production at its different mines. Gold Fields has observed in areas where it operates around the world that a
breakdown in the relationships with local communities can lead to significant production losses; several competitors lose operation days on a regular basis due to local community action. If Gold Fields were to lose its social license to operate at any time, it would results in
losses of between R4.1 million at a typical mine in Ghana to R16 million at a typical mine in South Africa per shift missed.
(ii) The methods you are using to manage this risk: New systems are continuously designed and implemented to address social and community concerns. This includes, but is not limited to factors covered by Gold Fields sustainability policy. The first priority is stakeholder engagement to be aware of concerns and communicate effectively. Gold Fields is guided in this approach by the internationally used AA 1000 Stakeholder Engagement Standard. Furthermore, communities receive additional benefits from the mines through corporate social development programmes. The following are examples of corporate social investment spending by Gold Fields: building of schools, provision of scholarships and small business support.
(iii) The costs associated with these actions: The costs of stakeholder engagement are integrated into the day to day operation of the
business. Total Socio-Economic Development spending in 2011 by Gold Fields was R375 million.
ID: OR4 (Other: workforce impacted by changed livelihood conditions, caused by climate change)
(i) The potential financial implications of risk before taking action: Climate change is expected to impact on people’s livelihoods through changed water
availability, forestry practices and productivity, agricultural practices and productivity and biodiversity. If Gold Fields’ workforce is affected due to any of the above indirect impacts of
climate change, Gold Fields productivity might be affected and even disrupted. Disruption of operations result in losses of between R4.1 million at a typical mine in Ghana to R16 million
at a typical mine in South Africa per shift missed.
Investor CDP 2011 Information Request
Risks & Opportunities
64
(ii) The methods you are using to manage this risk: Gold Fields focuses its community development efforts on creating support structures and
enabling environments for its employees and surrounding communities. Examples of enabling environments are environments with sufficient water available and agricultural
systems that are resilient to changed weather patterns caused by climate change. Examples of such projects initiated by Gold Fields:
• The construction of a 30 Million m3 water reservoir at its Chucapaca project (mining has not yet commenced). Of this water, 20 million m3 is for local use in agriculture, etc. The
remaining 10 million m3 will be sold to the Gold Fields JV. The income created from these sales will be used to maintain the water reservoir’s infrastructure and reduce the costs for the users of the 20 million m3. This water reservoir will be build before the mine starts
operations, following Gold Fields commitment to take care of water issues before starting to mine.
• In Ghana, extensive agricultural programmes, including support for the cultivation of local oil palm, cassava, vegetables and livestock amongst local farmers. During 2011, a total of 708
people benefited from the programmes. It is expected that better agricultural practices will increase agricultural resilience to climate change induced weather changes.
(iii) The costs associated with these actions:
Socio-Economic Development spending by Gold Fields on ‘infrastructure development’ and ‘conservation and the environment’ have been approximately 13.5 Million US$ in 2011. These two types of SED spending are found to be the closest related to climate change risk
management of livelihoods of Gold Fields employees.

Investor CDP 2011 Information Request
Risks & Opportunities
65
6. Climate Change Opportunities
6.1 Have you identified any climate change opportunities (current or future) that have the potential to generate a substantive change in your business operations, revenue or expenditure? Please identify the relevant categories:
Opportunities driven by regulation Opportunities driven by changes in physical climate parameter Opportunities driven by changes in other climate-related developments
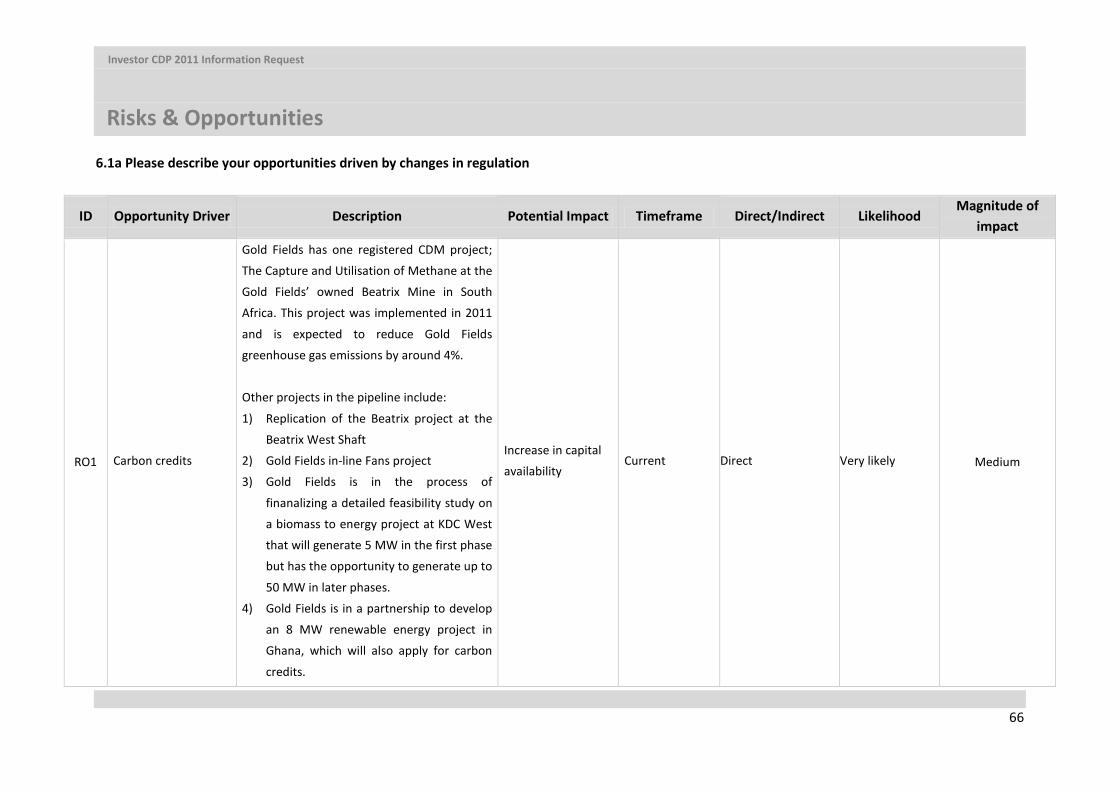
Investor CDP 2011 Information Request
Risks & Opportunities
66
6.1a Please describe your opportunities driven by changes in regulation
ID Opportunity Driver Description Potential Impact Timeframe Direct/Indirect Likelihood Magnitude of
impact
RO1 Carbon credits
Gold Fields has one registered CDM project;
The Capture and Utilisation of Methane at the
Gold Fields’ owned Beatrix Mine in South
Africa. This project was implemented in 2011
and is expected to reduce Gold Fields
greenhouse gas emissions by around 4%.
Other projects in the pipeline include:
1) Replication of the Beatrix project at the
Beatrix West Shaft
2) Gold Fields in-line Fans project
3) Gold Fields is in the process of
finanalizing a detailed feasibility study on
a biomass to energy project at KDC West
that will generate 5 MW in the first phase
but has the opportunity to generate up to
50 MW in later phases.
4) Gold Fields is in a partnership to develop
an 8 MW renewable energy project in
Ghana, which will also apply for carbon
credits.
Increase in capital
availability Current Direct Very likely Medium

Investor CDP 2011 Information Request
Risks & Opportunities
67
ID Opportunity Driver Description Potential Impact Timeframe Direct/Indirect Likelihood Magnitude of
impact
RO2
Demand Side
Management and tax
incentives
In response to climate change, South African
Government committed to reduce its national
emissions, following a Peak, Plateau, and
Decline Trajectory. Partly initiated by this
commitment (and partly for energy security
purposes), Government supported the
Demand Side Management (DSM)
programme run by Eskom as well as tax
incentives. Gold Fields South Africa has a
number of energy efficiency and emission
reduction projects that will benefit from both
the DSM programme, as well as these tax
incentives. These include projects such as:
- Main vane control project
- Composite in-line fans
- Change-house heat pumps
- Optimisation of air networks
- Beatrix mine methane capture
- KDC-West Renewable Energy project
Eskom’s DSM programme provides partial
(up to 50%) capital funding for energy
efficiency projects and up to 100% of the
Investment opportunities – opportunities to
make capital investments
Current Direct Very likely Medium
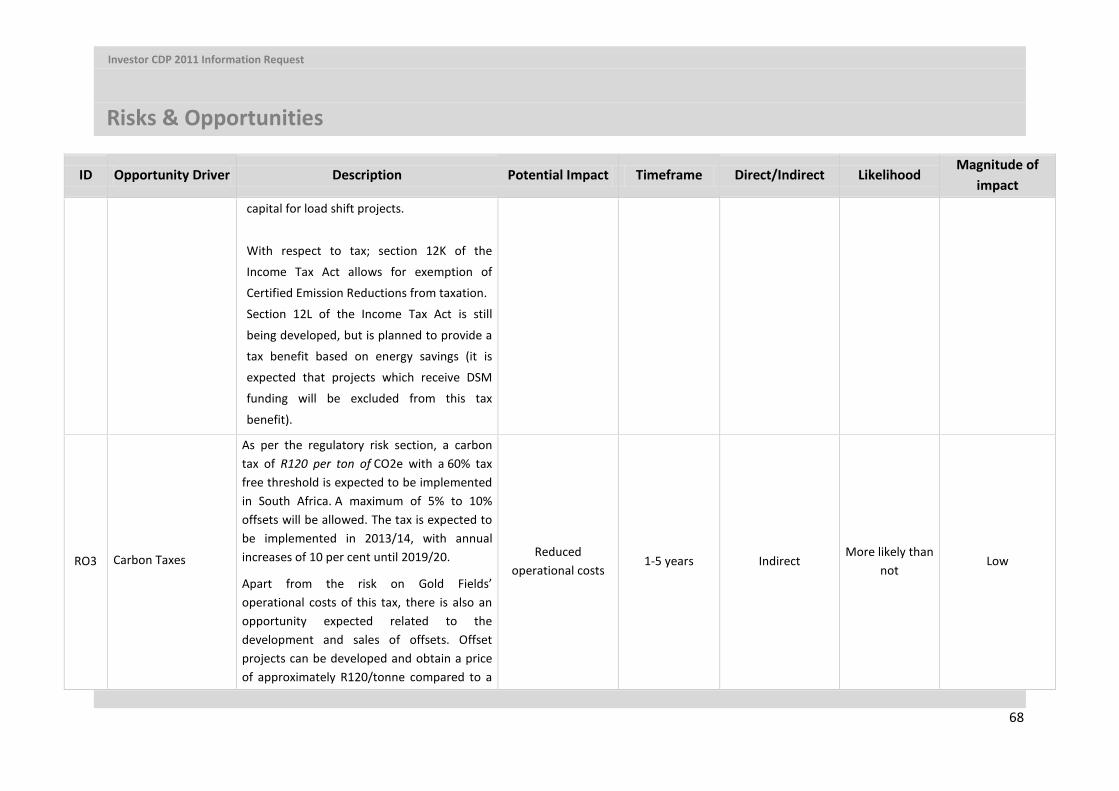
Investor CDP 2011 Information Request
Risks & Opportunities
68
ID Opportunity Driver Description Potential Impact Timeframe Direct/Indirect Likelihood Magnitude of
impact capital for load shift projects.
With respect to tax; section 12K of the
Income Tax Act allows for exemption of
Certified Emission Reductions from taxation.
Section 12L of the Income Tax Act is still
being developed, but is planned to provide a
tax benefit based on energy savings (it is
expected that projects which receive DSM
funding will be excluded from this tax
benefit).
RO3 Carbon Taxes
As per the regulatory risk section, a carbon tax of R120 per ton of CO2e with a 60% tax free threshold is expected to be implemented in South Africa. A maximum of 5% to 10% offsets will be allowed. The tax is expected to be implemented in 2013/14, with annual increases of 10 per cent until 2019/20.
Apart from the risk on Gold Fields’ operational costs of this tax, there is also an opportunity expected related to the development and sales of offsets. Offset projects can be developed and obtain a price of approximately R120/tonne compared to a
Reduced operational costs
1-5 years Indirect More likely than
not Low
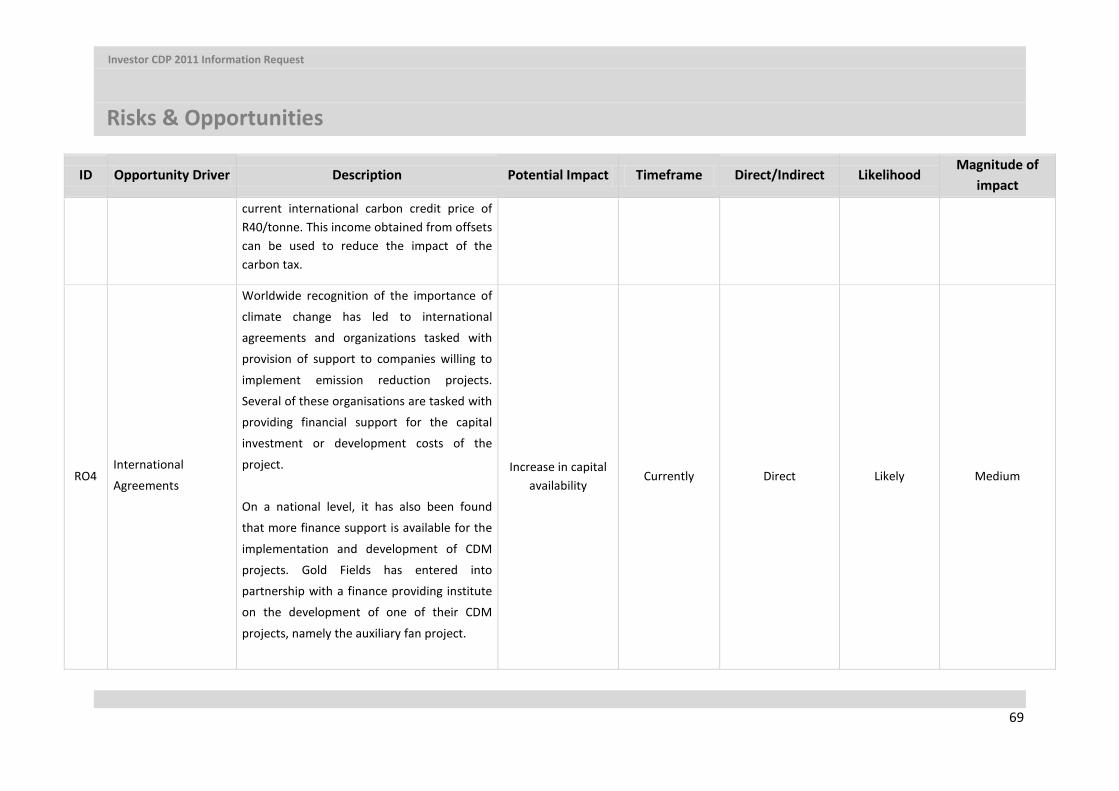
Investor CDP 2011 Information Request
Risks & Opportunities
69
ID Opportunity Driver Description Potential Impact Timeframe Direct/Indirect Likelihood Magnitude of
impact current international carbon credit price of R40/tonne. This income obtained from offsets can be used to reduce the impact of the carbon tax.
RO4 International
Agreements
Worldwide recognition of the importance of
climate change has led to international
agreements and organizations tasked with
provision of support to companies willing to
implement emission reduction projects.
Several of these organisations are tasked with
providing financial support for the capital
investment or development costs of the
project.
On a national level, it has also been found
that more finance support is available for the
implementation and development of CDM
projects. Gold Fields has entered into
partnership with a finance providing institute
on the development of one of their CDM
projects, namely the auxiliary fan project.
Increase in capital availability
Currently Direct Likely Medium
Investor CDP 2011 Information Request
Risks & Opportunities
70
ID Opportunity Driver Description Potential Impact Timeframe Direct/Indirect Likelihood Magnitude of
impact These types of finance are perceived as
opportunities to Gold Fields as it allows the
company to implement their emission
reduction projects, but still have capital
available for it new growth projects.

Investor CDP 2011 Information Request
Risks & Opportunities
71
6.1b Please describe (i) the potential financial implications of the opportunity; (ii) the methods you are using to manage this opportunity and (iii) the costs associated with these actions RO1: Carbon credits
i. Potential financial implication: The one registered and four other projects that are currently in development to be registered for
carbon credits have the following potential financial implications (all assume a current market price of R40/CER):
• Beatrix Mine Methane capture and flaring project which was registered in 2011 is expected to generate approximately 250,000 CERs per year, at a value of around R10 million per year.
• Beatrix West Mine Methane Capture and flaring project is expected to generate approximately 170,000 CERs per year, at a value of around R6.8 million per year.
• Gold Fields Ventilation Fan project flaring is expected to generate approximately 160,000 CERs
per year, at a value of around R6.4 million per year.
• Driefontein Renewable Energy Project flaring is expected to generate approximately 25,000 CERs
per year, at a value of around R1 million per year.
• Ghana Renewable Energy Project is expected to generate approximately 45,000 CERs per year, at a value of around R1.8 million per year
ii. Methods used to manage the opportunity:
On a Group strategic level, Gold Fields has expressed the importance of the development of carbon credit projects. In the ‘Carbon Management Plan for the South African Region’, which is developed
to implement the strategy on a regional level, ‘maximized use of mitigation related incentives’ is included as part of the mitigation strategy. According to this carbon management plan, formal
procedures to ensure that all new projects are assessed for their carbon finance potential should be developed in 2012.
Gold Fields has effectively communicated with all its employees that carbon credit projects are seen
as a priority to reduce carbon emissions and should be developed where possible. Communication and awareness raising has taken place through the distribution of a ‘Climate Change and Carbon Management Toolkit’, developed for Gold Fields. Management of the carbon credit projects is
overseen by the Carbon Management Steering Committee. Delivery of the CDM projects is included in the score cards of the managers responsible for these opportunities. Successful delivery of the
projects will impact directly on both their bonuses and increases. Gold Fields has registered one project in 2011; the Beatrix Mine Methane Capture and Flaring project.
iii. Costs of these methods:
Investor CDP 2011 Information Request
Risks & Opportunities
72
The cost of updating the Carbon Management Strategy, the development cost of the
Regional Carbon Management Plan for South Africa and associated carbon work has been in the order of R2 Million.
Development and updating of the Carbon Toolkit have cost the company R100,000.
RO2: Demand Side Management and tax incentives i. Potential financial implication:
The current Eskom DSM – Gold Fields project pipeline contains 20 projects with a total value of approximately R348 Million. Of this, R245 Million will be contributed by Eskom through its DSM
programme.
With respect to tax (section 12L (allowance for energy efficiency savings) & section 12K (exemption of certified emission reductions from taxation) of the income tax act), the following financial implications have been calculated:
• The Beatrix Methane Capture and Flaring project emission reduction purchase agreement with Mercuria has been valued with a NPV of R200 million. Under normal company taxation
this revenue would have carried a tax bill of R56 million. Under section 12K this tax is saved.
• Gold Fields estimated the impact of section 12L (Allowance for energy efficiency savings; excluding DSM projects) on its KDC-West Driefontein Renewable Energy project. By utilising the tax benefit, the project generates a NPV of R352 million, whereas it would only be valued at a NPV of R300 million without that tax benefit.
ii. Methods used to manage the opportunity: The financial opportunities presented through DSM and tax incentives can only be harvested through the identification and implementation of appropriate projects. For this reason, Gold Fields identified and started implementation of several energy efficiency projects and is looking into biomass and solar energy projects in South Africa. Through its emission reduction targets and by including achievement of targets (refer to question 3.3b), as well as implementation of emissions reducing projects into the score-cards of managers, additional incentives to manage this opportunity has been created.
iii. Costs of these methods:
As the Eskom DSM programme pays up to 50% of energy efficiency projects and up to 100% of load shift projects, Gold Fields will have to make a considerable capital contribution to the
implementation of the projects currently in the implementation pipeline. Gold Fields contribution to the projects in the pipeline is R103 Million.
Investor CDP 2011 Information Request
Risks & Opportunities
73
Gold Fields furthermore has to identify and initiate the projects. Most energy efficiency projects are identified by mine engineers and therefore these costs are carried in-house. Some projects, such as
the KDC-West Renewable energy project require expertise not available in-house. The pre-feasibility study costs of the KDC-West Renewable energy project were approximately R500, 000. The feasibility
study costs are estimated to be around R2.5 million.
RO3: Carbon Taxes – offset opportunities i. Potential financial implication:
As mentioned in the risk section (ID: RR2), offset allowances as part of the South African carbon tax system create an opportunity to reduce the costs associated with carbon tax. Apart from generating
offsets to offset Gold Fields’ own carbon tax obligations, additional offsets are expected to be allowed for sales. Though it is not known what type of projects will be allowed as offset projects, the carbon tax budget speech presented ‘agriculture, forestry and land use change’ to fall outside
the tax net, thereby indicating that offset projects within this sector would be possible.
Gold Fields’ KDC-West ‘biomass to energy’ pre- feasibility studies showed that a plantation could be established on the Gold Fields property and sequester carbon at an approximate cost of R70/tCO2.
Assuming that offsets will be sold against a lower price than the carbon tax (R120/tCO2), a profit of between R30-40/tCO2 sequestered can be expected. This does however not take into account
validation/certification costs which prove that these offsets have been approved by an independent third party. It is not yet known what standard the offsets will need to comply with. On the KDC-
West property, it is calculated (as part of the feasibility study) that approximately 45,000 to 50,000 tCO2 can be stored. If sold this would create an income of between R1.4Million – R2Million. Offset
will however only be sold when Gold Fields’ own offset requirements have been fulfilled, as the benefit is higher from offsetting than from selling the offsets. It is unknown if Gold Fields’ will be
allowed to generate offsets at its international operations for use within South Africa.
ii. Methods used to manage the opportunity:
As mentioned above, Gold Fields has already conducted a study into its carbon sequestration potential at KDC-West mine (which will be comparable to its other Gauteng operations). Once more
information on the offsets for the carbon tax are made available, Gold Fields will investigate;
• The amount of land it has available and which is suitable for carbon sequestration through the establishment of plantations / forests.
• The sequestration potential and associated costs on these specific types of land.
Investor CDP 2011 Information Request
Risks & Opportunities
74
iii. Costs of these methods:
The ‘biomass to energy’ pre-feasibility study costs have been in the order of R500,000. No final commitment on whether the project will be implemented has been made yet. The implementation
costs of this project (establishment of the plantation and the energy generating component) will be in the order of R82M. The costs of the study investigating Gold Fields properties offset potential will
be between R100,000 and R500,000, depending on whether the international operations will be included in this study.
RO4: International Agreements – Finance opportunities
i. Potential financial implication:
Gold Fields and a South African based financial institution have agreed on the financial institute to pay for the CDM registration costs of the auxiliary fans project. These CDM registration costs are in the order of R900,000. In return, this financial institution will own 12% of the carbon
credits (estimated at 160,000 CERs in total per year) obtained from the project.
ii. Methods used to manage the opportunity: Gold Fields actively engages with financial institutions which are interested in the development of carbon credits.
iii. Costs of these methods:
Engagement with financial institutions on CDM project development is managed in-house and therefore no specific costs are attributed to the management of this opportunity.
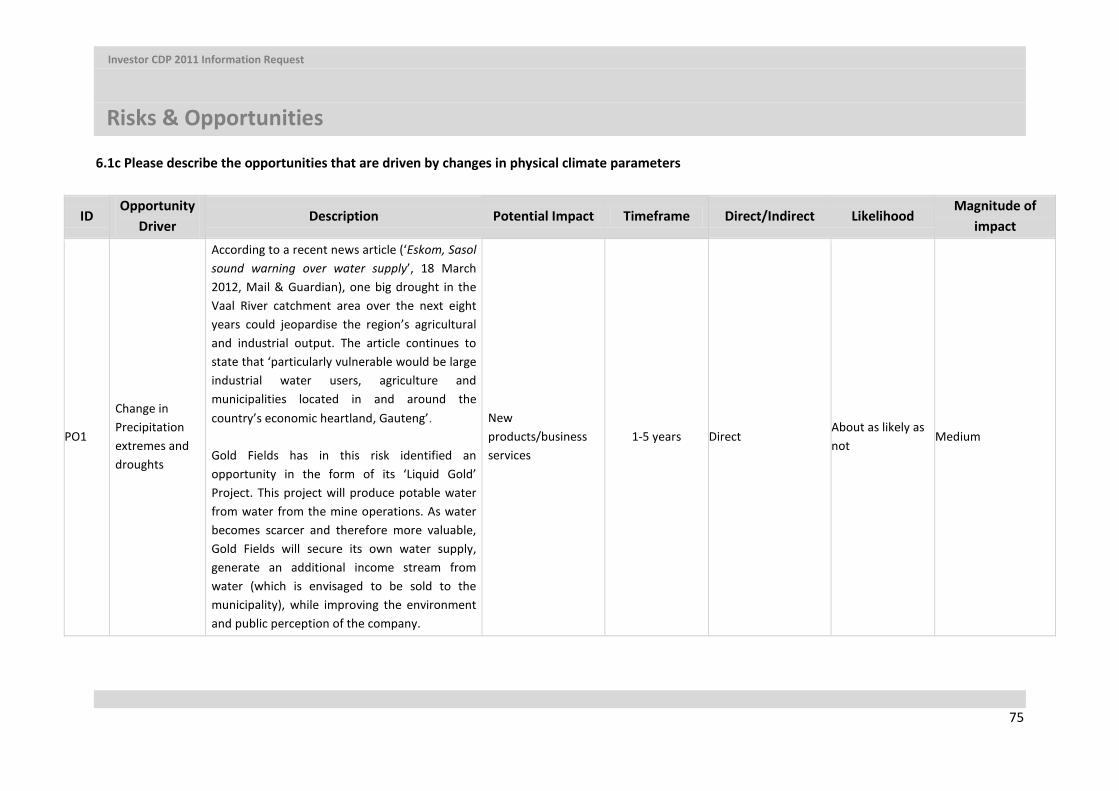
Investor CDP 2011 Information Request
Risks & Opportunities
75
6.1c Please describe the opportunities that are driven by changes in physical climate parameters
ID Opportunity
Driver Description Potential Impact Timeframe Direct/Indirect Likelihood
Magnitude of impact
PO1
Change in Precipitation extremes and droughts
According to a recent news article (‘Eskom, Sasol sound warning over water supply’, 18 March 2012, Mail & Guardian), one big drought in the Vaal River catchment area over the next eight years could jeopardise the region’s agricultural and industrial output. The article continues to state that ‘particularly vulnerable would be large industrial water users, agriculture and municipalities located in and around the country’s economic heartland, Gauteng’. Gold Fields has in this risk identified an opportunity in the form of its ‘Liquid Gold’ Project. This project will produce potable water from water from the mine operations. As water becomes scarcer and therefore more valuable, Gold Fields will secure its own water supply, generate an additional income stream from water (which is envisaged to be sold to the municipality), while improving the environment and public perception of the company.
New products/business services
1-5 years Direct About as likely as not
Medium

Investor CDP 2011 Information Request
Risks & Opportunities
76
6.1d Please describe (i) the potential financial implications of the opportunity; (ii) the methods you are using to manage this opportunity and (iii) the costs associated with these actions ID: PO1 (Liquid Gold Project)
i. the potential financial implications of the opportunity; The Liquid Gold project envisages the production of potable water from fissure water, as well as process water produced by Gold Fields KDC and South Deep mines. This will be processed using leading-edge, customised treatment technology and robust monitoring systems that will ensure high levels of water quality. The technology used includes:
• A Crystalactor® to reduce calcium levels and produce mine usable lime as a side-product. This is a pellet reactor that softens water and enables the crystallisation of a variety of (heavy metal) carbonates, phosphates, halides, sulphates and sulphides
• A cationic ion exchange to reduce residual calcium and magnesium • A de-gassing tower to remove carbon dioxide
The objective of the project is to discharge only Class I water and to improve the quality of the recirculating water within the mine to Class I standards. The water treatment process will extract uranium, lime, Calcium/Magnesium Nitrate and Ammonia Sulphate; all which have a commercial value and will be sold as part of the project activity. Treated water is also envisaged to be sold to the municipality and in that way provide an additional income stream. The financial model resulting from the pre-feasibility study indicated the project to have a real IRR of 10% at an NPV of approximately R17 Million. The project is part of Gold Fields long term sustainability commitment, to support its vision ‘to be the global leader in sustainable gold mining’ and to adapt to possible climate change impacts (water shortage). Therefore, the project does not have to achieve the financial performance Gold Fields projects usually are subject to.
ii. the methods you are using to manage this opportunity;
Gold Fields finalized the Liquid Gold prefeasibility study in 2011, which made recommendations on the Terms of Reference for a feasibility study. Gold Fields started engaging with several companies on the feasibility study during 2011. Tenders have currently been received and it is expected that the feasibility study will be awarded and commence mid 2012.
Gold Fields furthermore had an Environmental Impact Assessment on the project conducted and had its environmental license rewarded from the Department of Environmental Affairs during 2011.
iii. the costs associated with these actions The cost of the pre-feasibility study into the Liquid Gold project has costs Gold Fields R12.8 Million. The budget estimate of the feasibility study which is to commence in 2012 is in the order of R80 Million. The capital costs of the Liquid Gold project have been estimated at R700 Million during the pre-feasibility study.

Investor CDP 2011 Information Request
Risks & Opportunities
77
6.1e Please describe the opportunities that are driven by changes in other climate-related developments
ID Opportunity
Driver Description Potential Impact Timeframe Direct/Indirect Likelihood
Magnitude of impact
OO1 Other: new investor attractiveness
In July 2011, Nedbank launched the Nedbank
Green Index. This index measures the
performance of the top 'green' companies on
the JSE. Furthermore, a fund of these top ‘green’
companies has been established, called the
‘BettaBeta Green Exchange Traded Fund’ (BBG-
ETF). The companies included in the ‘BBG-ETF’
are companies that have been rated by the
Carbon Disclosure Project (CDP) as being
amongst the best disclosers on climate change
issues and the strongest performers in
responding to climate change. Furthermore,
companies with registered CDM projects within
South Africa have been included in the fund. By
being included in the BBG-ETF, Gold Fields has
had additional exposure and attractiveness to
investors, thereby supporting the stock price.
Not only is this green fund an indication of the
increased importance investors place on the
climate change management performance of the
Increased stock price
Current Indirect Certain Medium

Investor CDP 2011 Information Request
Risks & Opportunities
78
ID Opportunity
Driver Description Potential Impact Timeframe Direct/Indirect Likelihood
Magnitude of impact
companies they invest in. The CEO of the Public
Investment Corporation, which is a significant
shareholder in Gold Fields, stated in the
Engineering News (11 May, 2012) that ‘we’re
willing to forego some of the money due to us as
shareholders while this (renewable energy)
footprint is expanded’. The company stated to
consciously invest in companies with renewable
energy and other sustainable projects.
Also Mr. Chester Paulson, the chairman of Paulson & Co, Gold Fields’ 5th largest investor, has publically highlighted the importance of Socially Responsible Investment and the increasingly important role climate change plays within that arena. Companies developing clean and renewable energy technologies have found increasing interest and revenues.
OO2 Changing consumer behaviour
Gold as a Safe Haven:
Historically, it has been found that in times of
political, economic and social crisis investors
generally buy gold as it is seen as a safe
investment. Sales of gold could increase if
Increased demand for existing products
1-5 years Indirect About as likely as
not Unknown
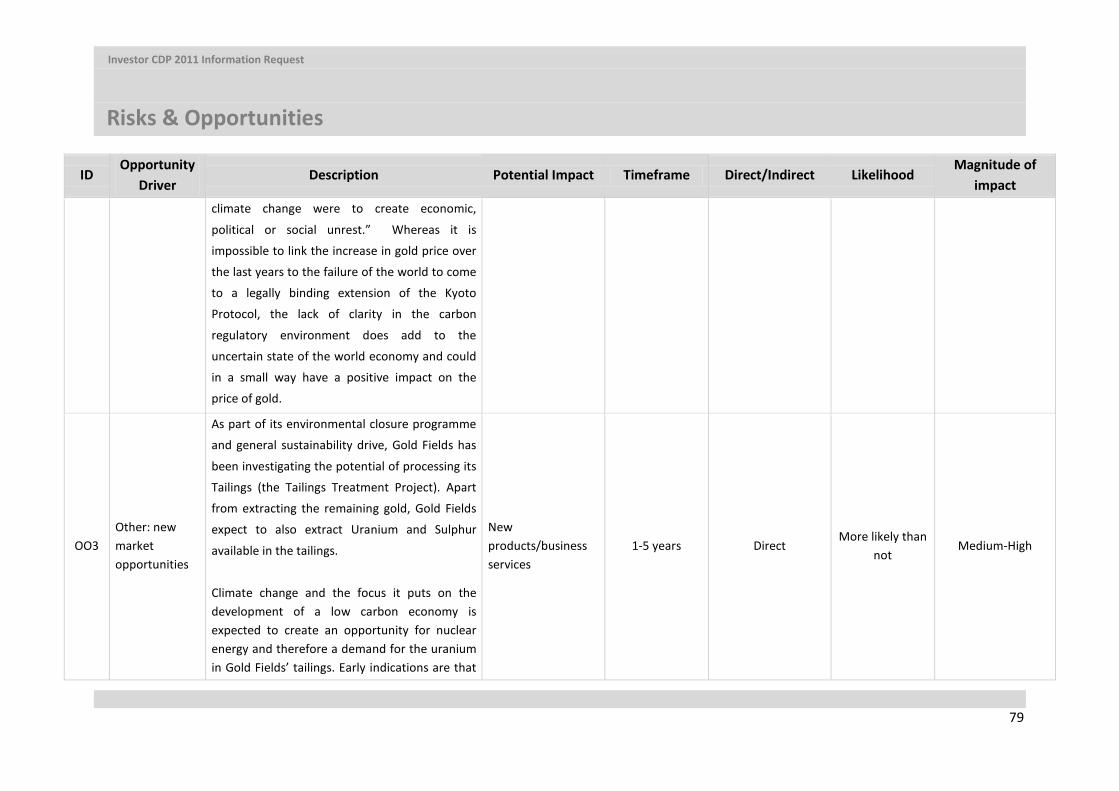
Investor CDP 2011 Information Request
Risks & Opportunities
79
ID Opportunity
Driver Description Potential Impact Timeframe Direct/Indirect Likelihood
Magnitude of impact
climate change were to create economic,
political or social unrest.” Whereas it is
impossible to link the increase in gold price over
the last years to the failure of the world to come
to a legally binding extension of the Kyoto
Protocol, the lack of clarity in the carbon
regulatory environment does add to the
uncertain state of the world economy and could
in a small way have a positive impact on the
price of gold.
OO3 Other: new market opportunities
As part of its environmental closure programme
and general sustainability drive, Gold Fields has
been investigating the potential of processing its
Tailings (the Tailings Treatment Project). Apart
from extracting the remaining gold, Gold Fields
expect to also extract Uranium and Sulphur
available in the tailings.
Climate change and the focus it puts on the development of a low carbon economy is expected to create an opportunity for nuclear energy and therefore a demand for the uranium in Gold Fields’ tailings. Early indications are that
New products/business services
1-5 years Direct More likely than
not Medium-High
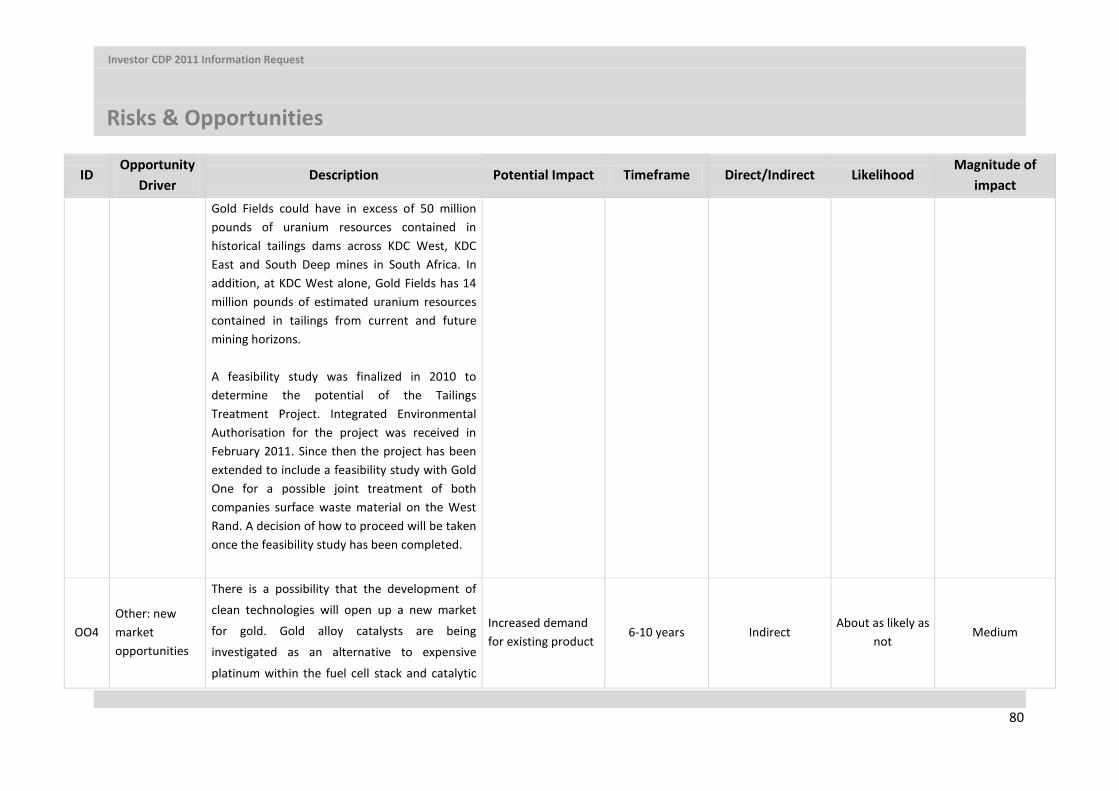
Investor CDP 2011 Information Request
Risks & Opportunities
80
ID Opportunity
Driver Description Potential Impact Timeframe Direct/Indirect Likelihood
Magnitude of impact
Gold Fields could have in excess of 50 million pounds of uranium resources contained in historical tailings dams across KDC West, KDC East and South Deep mines in South Africa. In addition, at KDC West alone, Gold Fields has 14 million pounds of estimated uranium resources contained in tailings from current and future mining horizons. A feasibility study was finalized in 2010 to determine the potential of the Tailings Treatment Project. Integrated Environmental Authorisation for the project was received in February 2011. Since then the project has been extended to include a feasibility study with Gold One for a possible joint treatment of both companies surface waste material on the West Rand. A decision of how to proceed will be taken once the feasibility study has been completed.
OO4 Other: new market opportunities
There is a possibility that the development of
clean technologies will open up a new market
for gold. Gold alloy catalysts are being
investigated as an alternative to expensive
platinum within the fuel cell stack and catalytic
Increased demand for existing product
6-10 years Indirect About as likely as
not Medium
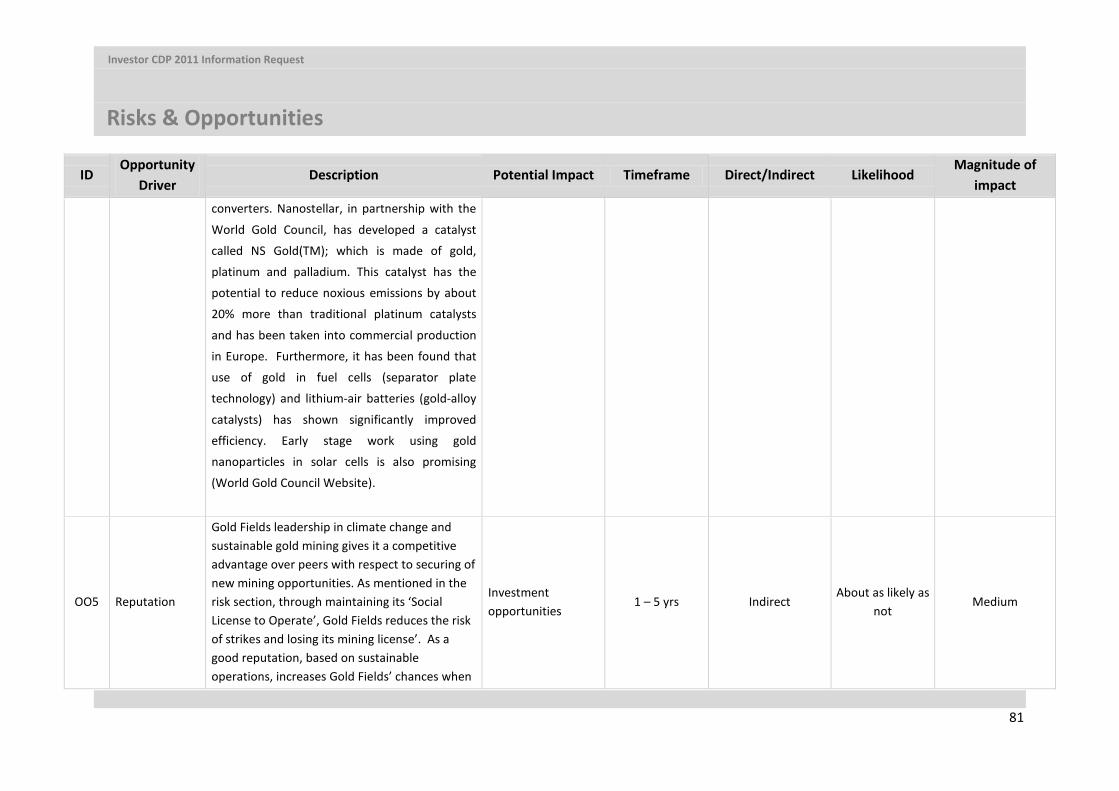
Investor CDP 2011 Information Request
Risks & Opportunities
81
ID Opportunity
Driver Description Potential Impact Timeframe Direct/Indirect Likelihood
Magnitude of impact
converters. Nanostellar, in partnership with the
World Gold Council, has developed a catalyst
called NS Gold(TM); which is made of gold,
platinum and palladium. This catalyst has the
potential to reduce noxious emissions by about
20% more than traditional platinum catalysts
and has been taken into commercial production
in Europe. Furthermore, it has been found that use of gold in fuel cells (separator plate
technology) and lithium-air batteries (gold-alloy
catalysts) has shown significantly improved
efficiency. Early stage work using gold
nanoparticles in solar cells is also promising
(World Gold Council Website).
OO5 Reputation
Gold Fields leadership in climate change and sustainable gold mining gives it a competitive advantage over peers with respect to securing of new mining opportunities. As mentioned in the risk section, through maintaining its ‘Social License to Operate’, Gold Fields reduces the risk of strikes and losing its mining license’. As a good reputation, based on sustainable operations, increases Gold Fields’ chances when
Investment opportunities
1 – 5 yrs Indirect About as likely as
not Medium
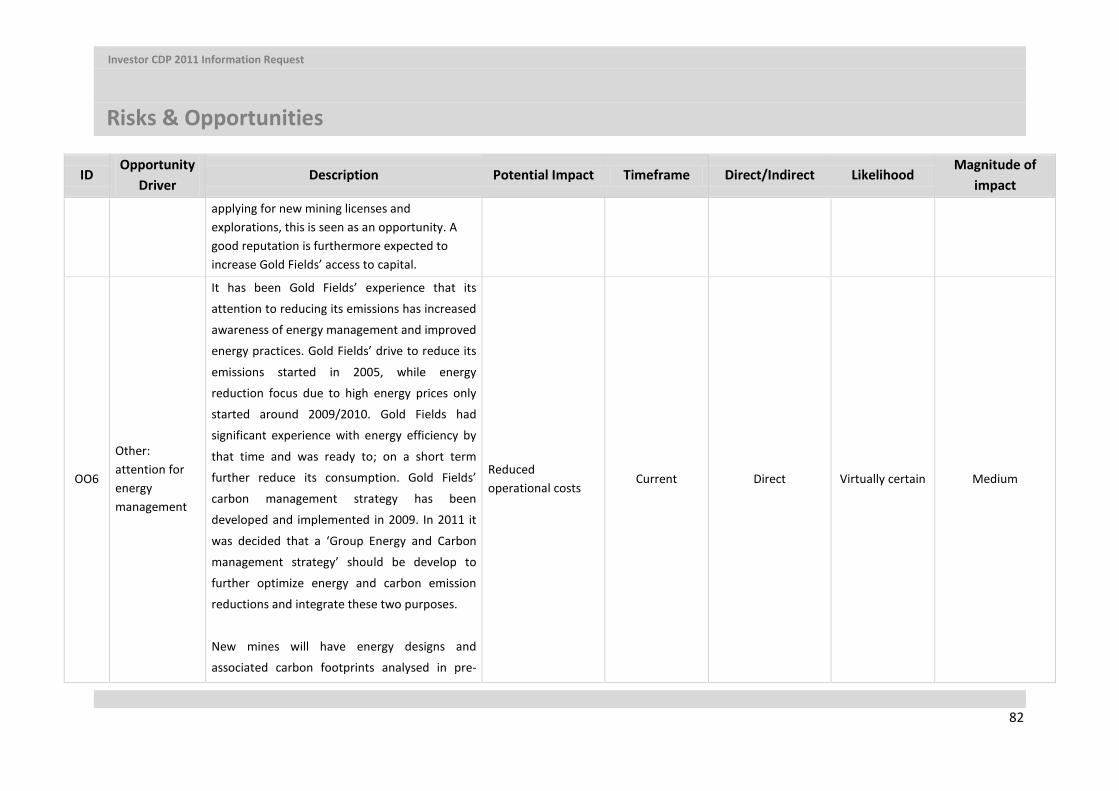
Investor CDP 2011 Information Request
Risks & Opportunities
82
ID Opportunity
Driver Description Potential Impact Timeframe Direct/Indirect Likelihood
Magnitude of impact
applying for new mining licenses and explorations, this is seen as an opportunity. A good reputation is furthermore expected to increase Gold Fields’ access to capital.
OO6
Other: attention for energy management
It has been Gold Fields’ experience that its
attention to reducing its emissions has increased
awareness of energy management and improved
energy practices. Gold Fields’ drive to reduce its
emissions started in 2005, while energy
reduction focus due to high energy prices only
started around 2009/2010. Gold Fields had
significant experience with energy efficiency by
that time and was ready to; on a short term
further reduce its consumption. Gold Fields’
carbon management strategy has been
developed and implemented in 2009. In 2011 it
was decided that a ‘Group Energy and Carbon
management strategy’ should be develop to
further optimize energy and carbon emission
reductions and integrate these two purposes.
New mines will have energy designs and
associated carbon footprints analysed in pre-
Reduced operational costs
Current Direct Virtually certain Medium
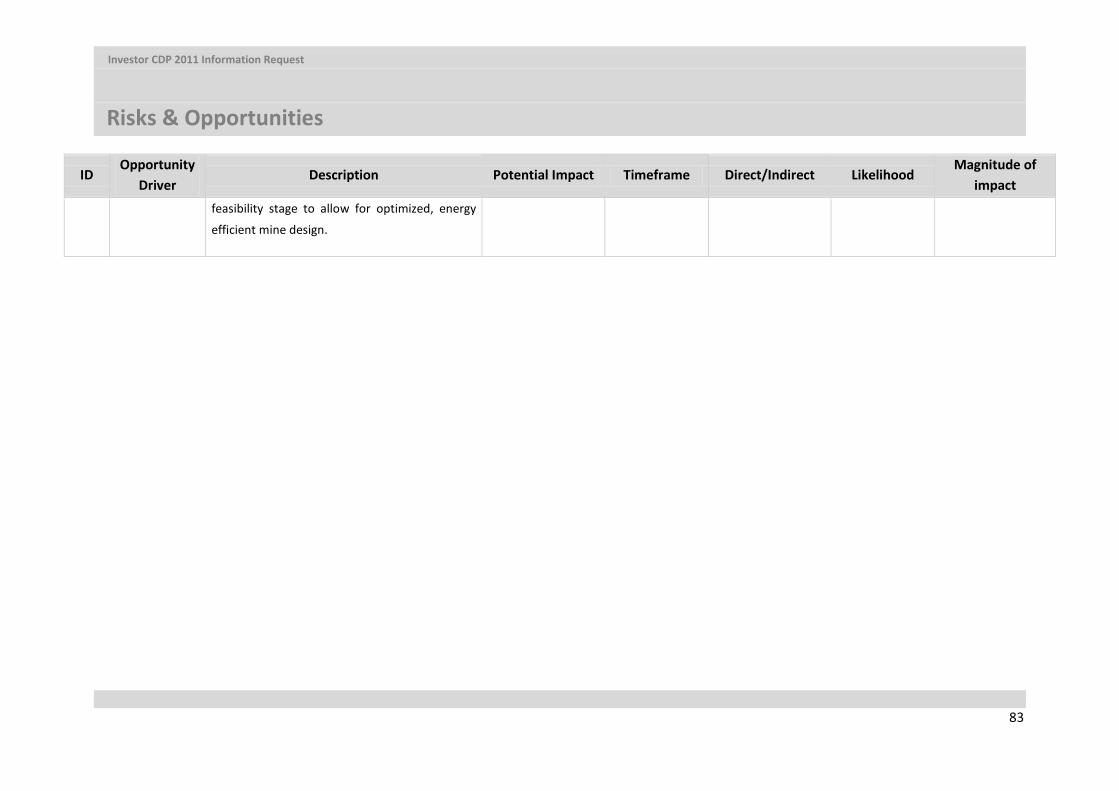
Investor CDP 2011 Information Request
Risks & Opportunities
83
ID Opportunity
Driver Description Potential Impact Timeframe Direct/Indirect Likelihood
Magnitude of impact
feasibility stage to allow for optimized, energy
efficient mine design.
Investor CDP 2011 Information Request
Emissions
84
6.1f Please describe (i) the potential financial implications of the opportunity; (ii) the methods you are using to manage this opportunity and (iii) the costs associated with these actions 1) ID: OO1: Increased market opportunities for Gold Fields’ shares
(i) The potential financial implications of the opportunity:
Two large Gold Fields investors have publically stated that renewable energy implementation and sustainable development are important investment criteria when deciding to invest in a
company. The financial implication of this can be illustrated through the Nedbank ‘BettaBeta Green Exchange Traded Fund’, which has given the largest single percentage within this
portfolio to Gold Fields (4.8%). This fund was listed beginning of December 2011 and bought a total worth of R4.9 Million of Gold Fields shares. It can be reasoned that if Gold Fields would not
have been as active in the climate change management sphere as it is, these shares would not have been sold. This increased the share price, allowing in turn the company to develop and
grow.
(ii) The methods you are using to manage this opportunity:
To keep being part of the Nedbank ‘BettaBeta Green Exchange Traded Fund’ (BBG-ETF), Gold
Fields should keep its position as ‘climate change leader’. This, the company aims to achieve through strategic interventions, such as:
• Regular updating of the ‘Carbon Management Strategy’
• Development and implementation of regional ‘Carbon Management Plans’
• Integration of energy and carbon management through the development of the
‘Group Energy and Carbon Strategy’
Furthermore, Gold Fields’ CEO has set new, more stringent emission reduction targets, decided that 20% of all energy requirements in new projects should be obtained from alternative sources
of energy and made performance in carbon reporting a key priority, which is included in his performance scorecard.
(iii) The costs associated with these actions:
• The costs of updating the ‘Carbon Management Strategy’, development of the South African Regional ‘Carbon Management Plans’ and other carbon related work have cost approximately R2 Million.
Investor CDP 2011 Information Request
Emissions
85
• The costs of strategic integration of carbon and energy related management
through development of the ‘Group Energy and Carbon Strategy’ are approximately R10 Million
2) ID: OO2: Gold as a Safe Haven
The financial implication of this opportunity lies in a positive influence on the price of gold. Long term trends show a correlation between gold and energy prices. It is generally accepted that the move to a
low carbon economy will put upward pressure on energy prices and it is expected that gold will follow this trend. An increase in gold price directly influences Gold Fields profits. An increase of 1% on
the group average gold price in 2011 and assuming the amount of gold mined in 2011 would increase Gold Fields income with R400 Million and profit with R200 Million.
This opportunity is not actively managed by Gold Fields as gold mining companies are price takers in
the gold market. Therefore there are no costs associated with the management of this opportunity.
3) ID: OO3: Market for Uranium from the Tailings Treatment Project
As part of the Tailings Treatment Project, Gold Fields might decide to mine uranium contained in the tailings. Climate Change has put a focus on the development of low carbon economies, which are
expected to increase the demand for nuclear energy and therefore uranium; thereby creating an opportunity for Gold Fields. Assuming that 50% of the uranium content (total is currently estimated at 64 million pounds) of current tailings could be extracted and sold at a price of R360 per pound,
this would create an additional income stream of approximately R11.6 billion. This excludes the uranium contained in the mines.
This opportunity is managed through the performance of a detailed feasibility study which was finalized at the end of 2010. An Integrated Environmental Authorisation for the project was received in February 2011. The Gold Fields Board of Directors has not taken a final investment decision on the project as yet.
The cost of the detailed feasibility study performed was R60.5 million. Environmental authorization applications were managed internally and therefore part of the normal in-house costs.
4) ID: OO4: New Industrial Applications for Gold i. The potential financial implications of the opportunity:
Investor CDP 2011 Information Request
Emissions
86
The potential financial implication of this opportunity is that the price of gold may increase due to
increased demand for gold for usage in new industrial applications. Any increase in the price of gold will directly impact on Gold Fields financial performance. An increase of 1% on the group average
gold price in 2011 and assuming the amount of gold mined in 2011 would increase Gold Fields income with R400 Million and profit with R200 Million.
ii. The methods you are using to manage this opportunity:
This opportunity is managed through Gold Fields’ involvement with the World Gold Council. The World Gold Council supports the development of new, gold using, industrial applications, such as
gold catalysts.
iii. The costs associated with these actions: The cost of managing this opportunity is included in Gold Fields’ annual fees to the World Gold
Council. Gold Fields’ membership fee to the World Gold Council was R23.4 Million in 2011. 5) ID: OO5 Reputation
(i) The potential financial implications of the opportunity: The potential financial implication of this opportunity lies in the possibility to grow the business as is
the stated intent of Gold Fields. Gold Fields believes that its responsible behaviour in the climate change and sustainable mining space offers a competitive advantage against its peers that could
result in Gold Fields obtaining access to funding from more environmentally-conscious investors. Exact amounts are difficult to quantify but additional funding – either via debt or equity investment –
could lower the net cost of funding to Gold Fields and thus facilitate greater investments.
(ii) The methods you are using to manage this opportunity: This opportunity is managed through best practice management of sustainability related issues, diligently communicating in an open and transparent way Gold Fields efforts (both successes and
failures) to all stakeholders. Such communications can take place in a dedicated way with specific local communities or through more general means, such as the annual report. It is Gold Fields
intention to develop a dedicated Sustainable Development communications programme in 2012.
(iii) The costs associated with these actions: The costs associated with these actions, are managed in-house and part of the company’s fixed
expenditure.
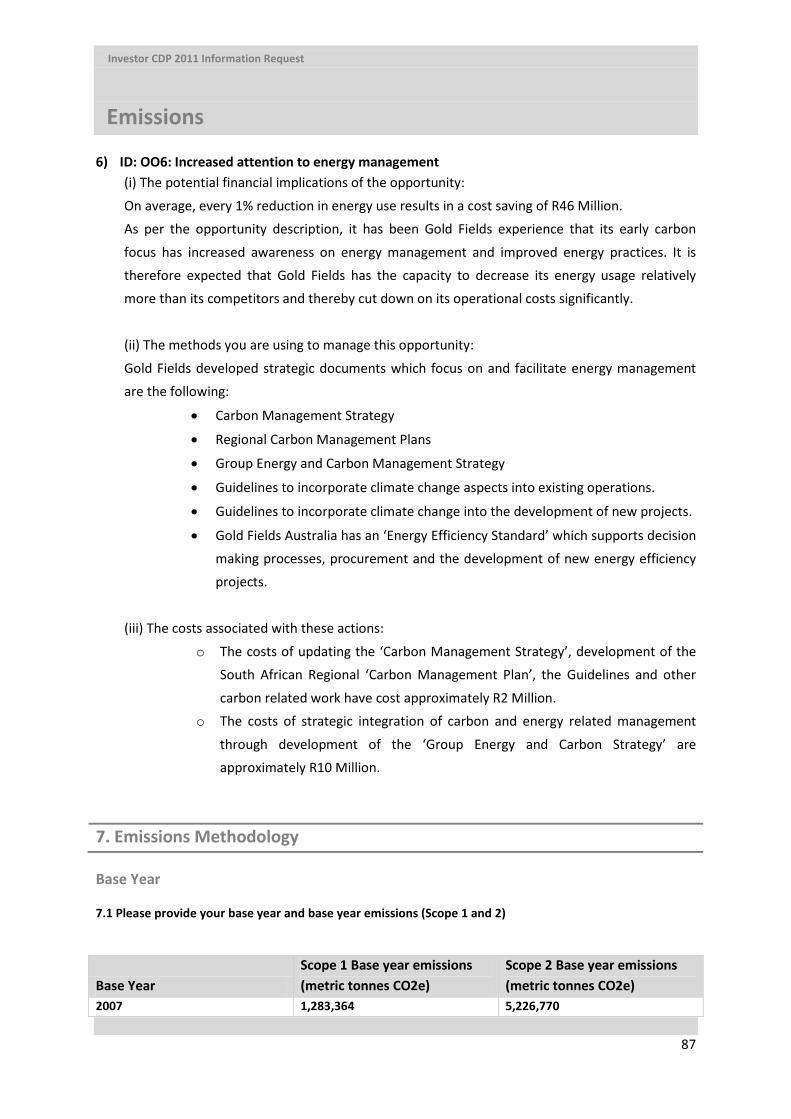
Investor CDP 2011 Information Request
Emissions
87
6) ID: OO6: Increased attention to energy management (i) The potential financial implications of the opportunity:
On average, every 1% reduction in energy use results in a cost saving of R46 Million. As per the opportunity description, it has been Gold Fields experience that its early carbon
focus has increased awareness on energy management and improved energy practices. It is therefore expected that Gold Fields has the capacity to decrease its energy usage relatively more than its competitors and thereby cut down on its operational costs significantly.
(ii) The methods you are using to manage this opportunity:
Gold Fields developed strategic documents which focus on and facilitate energy management are the following:
• Carbon Management Strategy
• Regional Carbon Management Plans
• Group Energy and Carbon Management Strategy
• Guidelines to incorporate climate change aspects into existing operations.
• Guidelines to incorporate climate change into the development of new projects.
• Gold Fields Australia has an ‘Energy Efficiency Standard’ which supports decision making processes, procurement and the development of new energy efficiency projects.
(iii) The costs associated with these actions:
o The costs of updating the ‘Carbon Management Strategy’, development of the South African Regional ‘Carbon Management Plan’, the Guidelines and other
carbon related work have cost approximately R2 Million. o The costs of strategic integration of carbon and energy related management
through development of the ‘Group Energy and Carbon Strategy’ are approximately R10 Million.
7. Emissions Methodology
Base Year
7.1 Please provide your base year and base year emissions (Scope 1 and 2)
Base Year Scope 1 Base year emissions (metric tonnes CO2e)
Scope 2 Base year emissions (metric tonnes CO2e)
2007 1,283,364 5,226,770
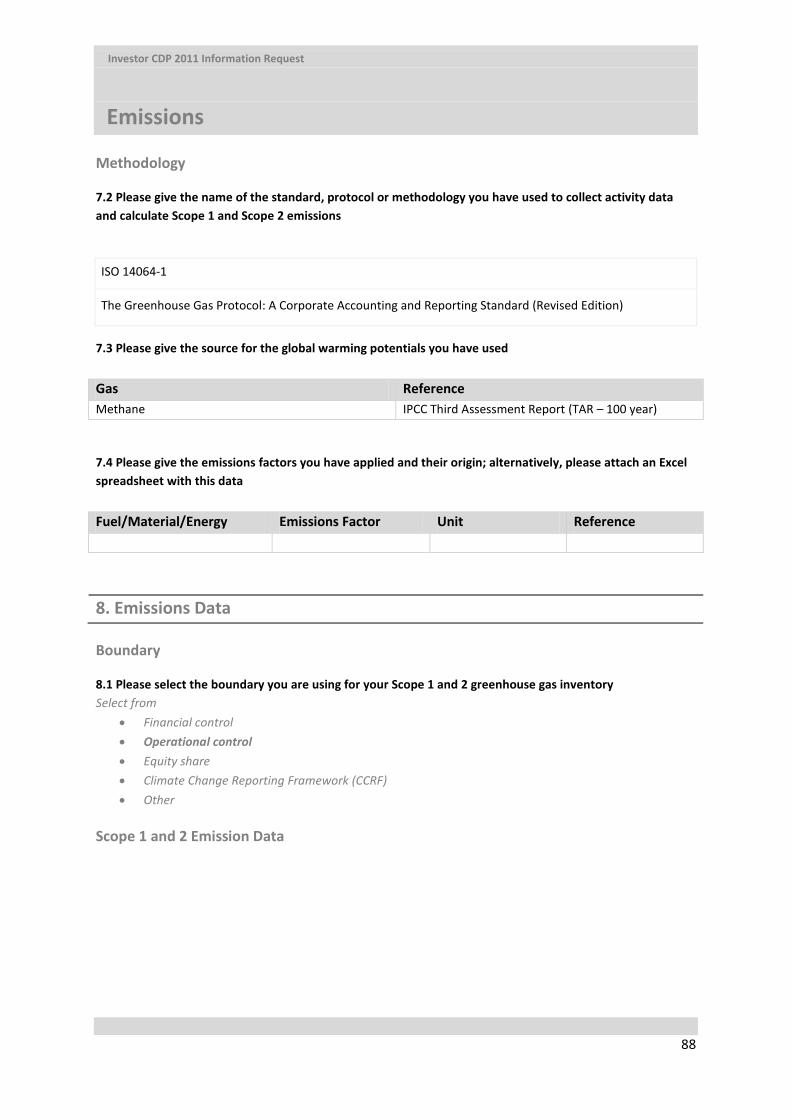
Investor CDP 2011 Information Request
Emissions
88
Methodology
7.2 Please give the name of the standard, protocol or methodology you have used to collect activity data and calculate Scope 1 and Scope 2 emissions
ISO 14064-1
The Greenhouse Gas Protocol: A Corporate Accounting and Reporting Standard (Revised Edition)
7.3 Please give the source for the global warming potentials you have used Gas Reference Methane IPCC Third Assessment Report (TAR – 100 year)
7.4 Please give the emissions factors you have applied and their origin; alternatively, please attach an Excel spreadsheet with this data Fuel/Material/Energy Emissions Factor Unit Reference
8. Emissions Data
Boundary
8.1 Please select the boundary you are using for your Scope 1 and 2 greenhouse gas inventory Select from
• Financial control • Operational control • Equity share • Climate Change Reporting Framework (CCRF) • Other
Scope 1 and 2 Emission Data
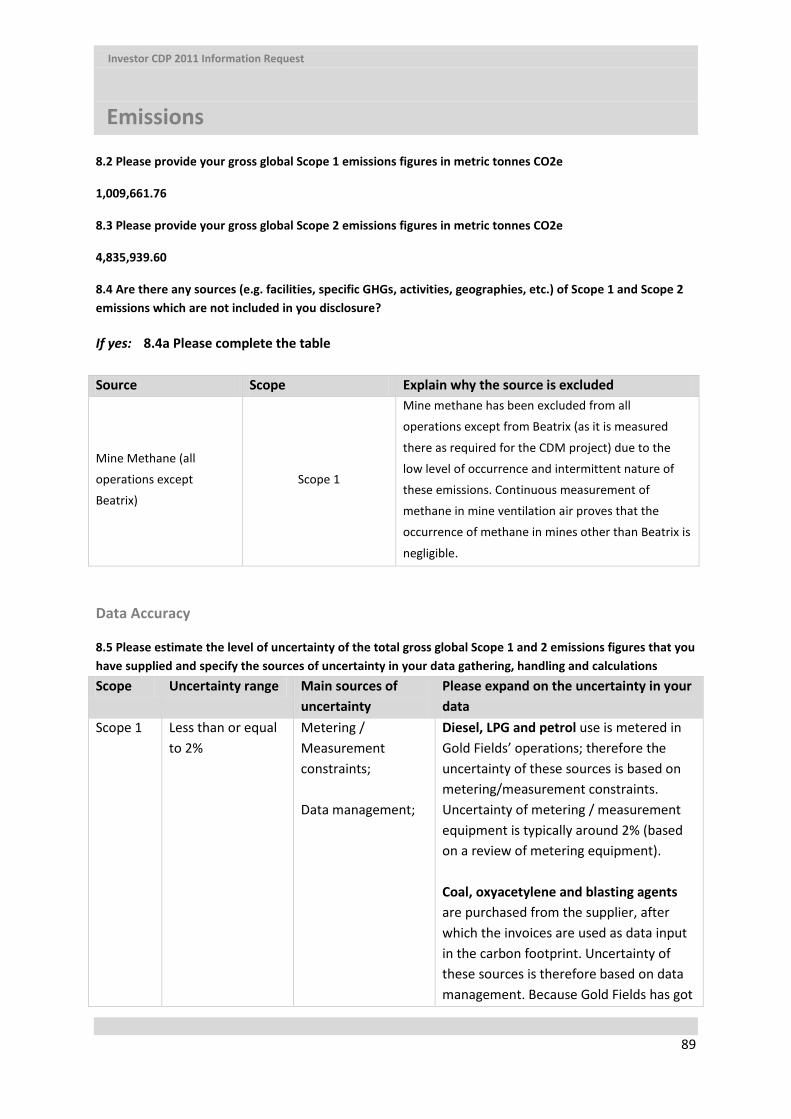
Investor CDP 2011 Information Request
Emissions
89
8.2 Please provide your gross global Scope 1 emissions figures in metric tonnes CO2e
1,009,661.76
8.3 Please provide your gross global Scope 2 emissions figures in metric tonnes CO2e
4,835,939.60
8.4 Are there any sources (e.g. facilities, specific GHGs, activities, geographies, etc.) of Scope 1 and Scope 2 emissions which are not included in you disclosure?
If yes: 8.4a Please complete the table Source Scope Explain why the source is excluded
Mine Methane (all
operations except
Beatrix)
Scope 1
Mine methane has been excluded from all
operations except from Beatrix (as it is measured
there as required for the CDM project) due to the
low level of occurrence and intermittent nature of
these emissions. Continuous measurement of
methane in mine ventilation air proves that the
occurrence of methane in mines other than Beatrix is
negligible.
Data Accuracy
8.5 Please estimate the level of uncertainty of the total gross global Scope 1 and 2 emissions figures that you have supplied and specify the sources of uncertainty in your data gathering, handling and calculations Scope Uncertainty range Main sources of
uncertainty Please expand on the uncertainty in your data
Scope 1 Less than or equal to 2%
Metering / Measurement constraints; Data management;
Diesel, LPG and petrol use is metered in Gold Fields’ operations; therefore the uncertainty of these sources is based on metering/measurement constraints. Uncertainty of metering / measurement equipment is typically around 2% (based on a review of metering equipment). Coal, oxyacetylene and blasting agents are purchased from the supplier, after which the invoices are used as data input in the carbon footprint. Uncertainty of these sources is therefore based on data management. Because Gold Fields has got
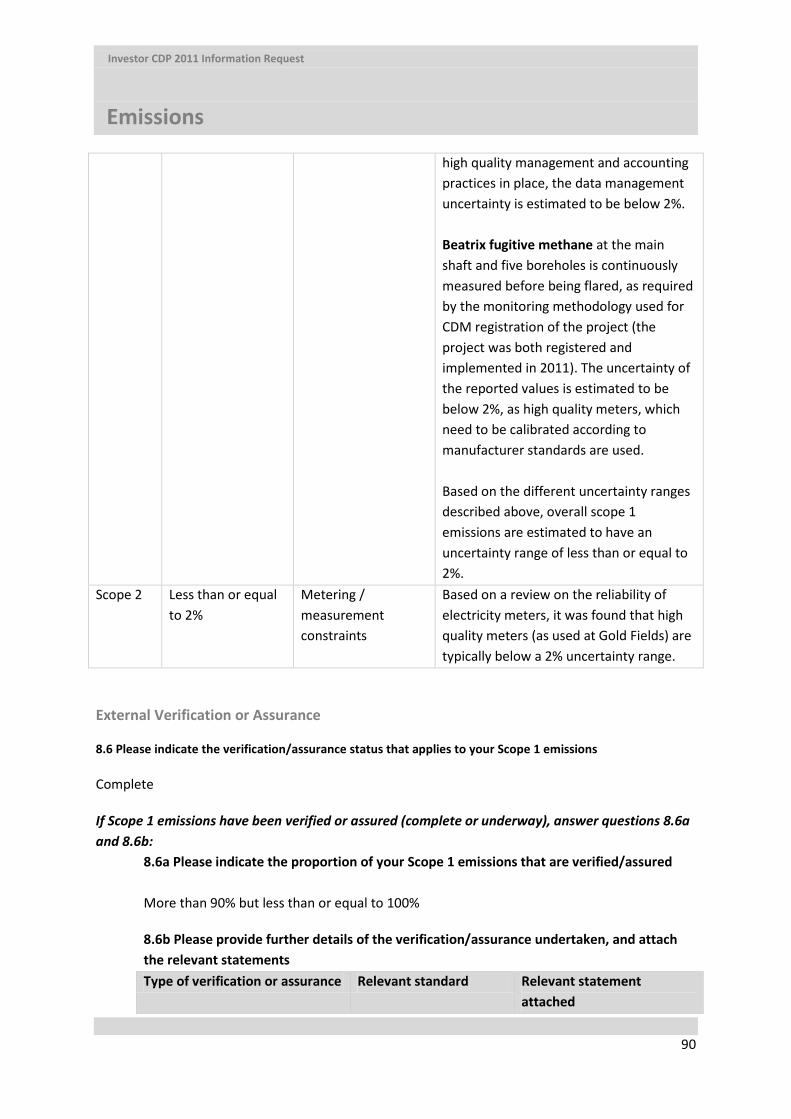
Investor CDP 2011 Information Request
Emissions
90
high quality management and accounting practices in place, the data management uncertainty is estimated to be below 2%. Beatrix fugitive methane at the main shaft and five boreholes is continuously measured before being flared, as required by the monitoring methodology used for CDM registration of the project (the project was both registered and implemented in 2011). The uncertainty of the reported values is estimated to be below 2%, as high quality meters, which need to be calibrated according to manufacturer standards are used. Based on the different uncertainty ranges described above, overall scope 1 emissions are estimated to have an uncertainty range of less than or equal to 2%.
Scope 2 Less than or equal to 2%
Metering / measurement constraints
Based on a review on the reliability of electricity meters, it was found that high quality meters (as used at Gold Fields) are typically below a 2% uncertainty range.
External Verification or Assurance
8.6 Please indicate the verification/assurance status that applies to your Scope 1 emissions
Complete
If Scope 1 emissions have been verified or assured (complete or underway), answer questions 8.6a and 8.6b:
8.6a Please indicate the proportion of your Scope 1 emissions that are verified/assured More than 90% but less than or equal to 100%
8.6b Please provide further details of the verification/assurance undertaken, and attach the relevant statements Type of verification or assurance Relevant standard Relevant statement
attached
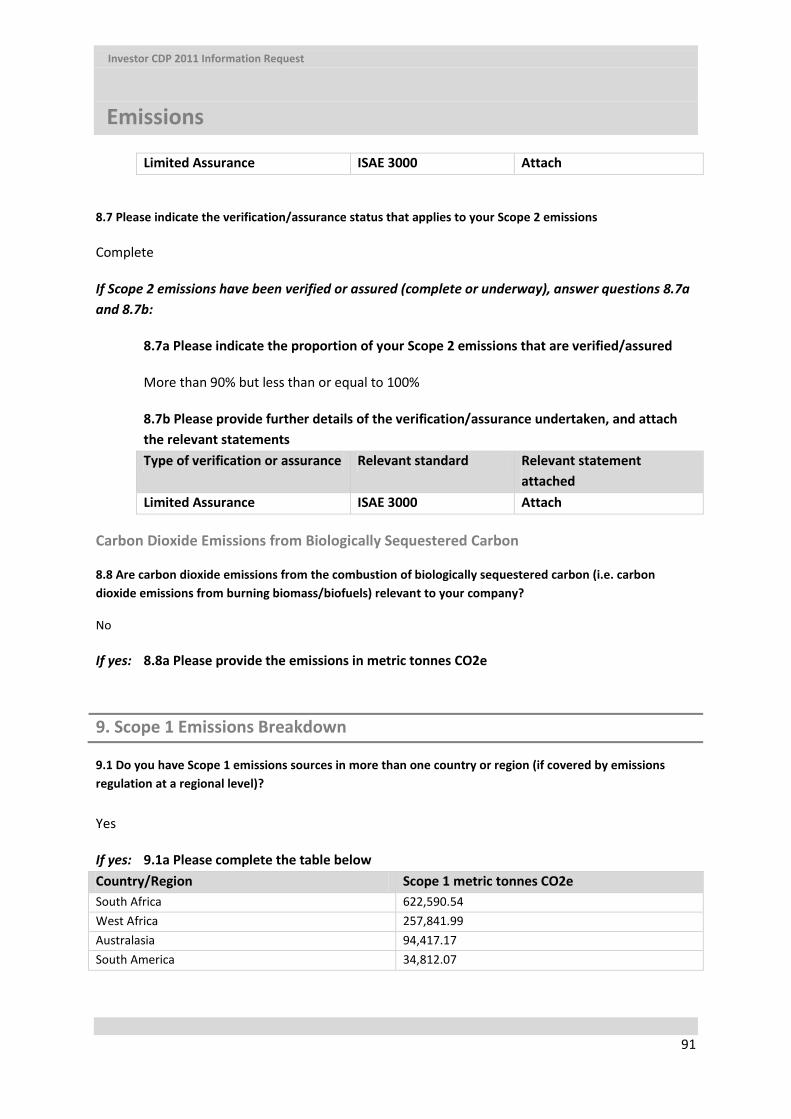
Investor CDP 2011 Information Request
Emissions
91
Limited Assurance ISAE 3000 Attach
8.7 Please indicate the verification/assurance status that applies to your Scope 2 emissions
Complete
If Scope 2 emissions have been verified or assured (complete or underway), answer questions 8.7a and 8.7b:
8.7a Please indicate the proportion of your Scope 2 emissions that are verified/assured
More than 90% but less than or equal to 100%
8.7b Please provide further details of the verification/assurance undertaken, and attach the relevant statements Type of verification or assurance Relevant standard Relevant statement
attached Limited Assurance ISAE 3000 Attach
Carbon Dioxide Emissions from Biologically Sequestered Carbon
8.8 Are carbon dioxide emissions from the combustion of biologically sequestered carbon (i.e. carbon dioxide emissions from burning biomass/biofuels) relevant to your company?
No
If yes: 8.8a Please provide the emissions in metric tonnes CO2e
9. Scope 1 Emissions Breakdown
9.1 Do you have Scope 1 emissions sources in more than one country or region (if covered by emissions regulation at a regional level)? Yes
If yes: 9.1a Please complete the table below Country/Region Scope 1 metric tonnes CO2e South Africa 622,590.54 West Africa 257,841.99 Australasia 94,417.17 South America 34,812.07

Investor CDP 2011 Information Request
Emissions
92
9.2 Please indicate which other Scope 1 emissions breakdowns you are able to provide (tick all that apply) By business division (9.2a)
X By facility (9.2b) By GHG type (9.2c) By activity (9.2d)
9.2a Please break down your total global Scope 1 emissions by business division Business division Scope 1 emissions (metric tonnes CO2e)
9.2b Please break down your total global Scope 1 emissions by facility Facility Scope 1 emissions (metric tonnes CO2e) KDC West 7,592.59 KDC East 6,473.58 Beatrix 598,326.19 South Deep 10,198.18 Tarkwa 192,578.18 Damang 65,263.81 St Ives 76,952.07 Agnew 17,465.10 Cerro Corona 34,812.07
9.2c Please break down your total global Scope 1 emissions by GHG type GHG type Scope 1 emissions (metric tonnes CO2e)
9.2d Please break down your total global Scope 1 emissions by activity Activity Scope 1 emissions (metric tonnes CO2e)
10. Scope 2 Emissions Breakdown
10.1 Do you have Scope 2 emissions sources in more than one country or region (if covered by emissions regulation at a regional level)?
Yes
If yes: 10.1a Please complete the table below Country/Region Scope 2 metric tonnes CO2e South Africa 4,567,035.62 West Africa 102,935.38 Australasia 129,945.06 South America 36,023.54
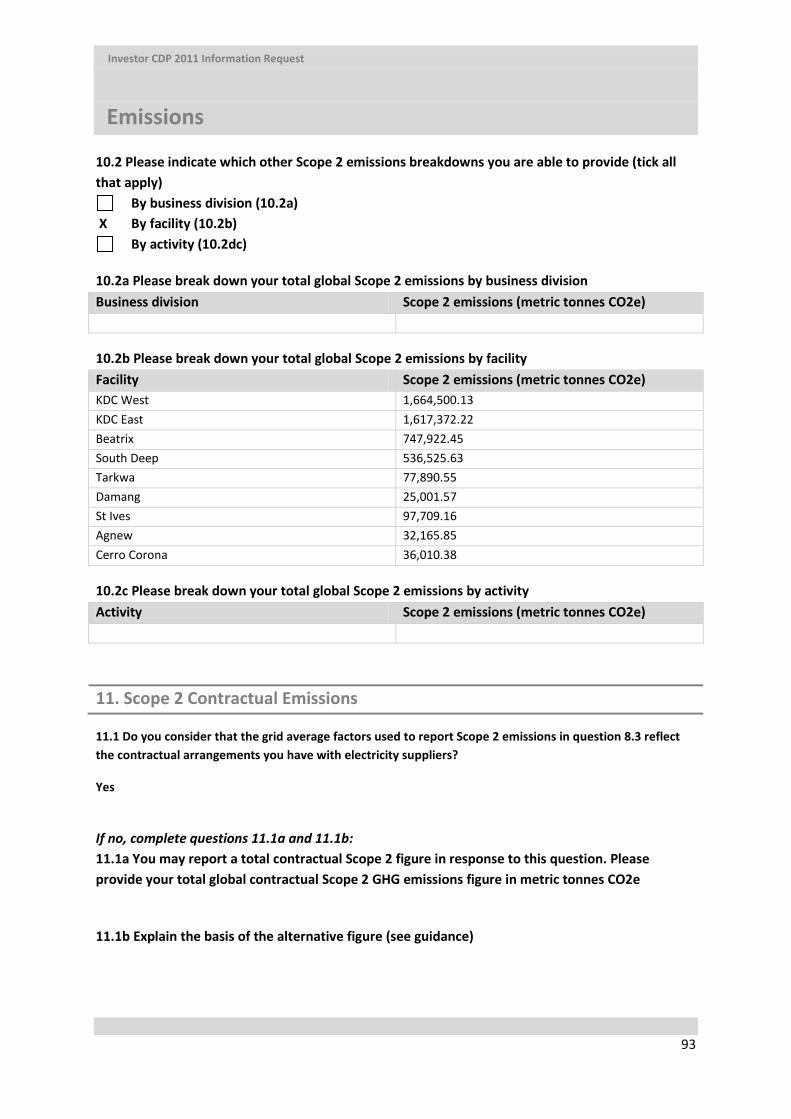
Investor CDP 2011 Information Request
Emissions
93
10.2 Please indicate which other Scope 2 emissions breakdowns you are able to provide (tick all that apply)
By business division (10.2a) X By facility (10.2b)
By activity (10.2dc)
10.2a Please break down your total global Scope 2 emissions by business division Business division Scope 2 emissions (metric tonnes CO2e)
10.2b Please break down your total global Scope 2 emissions by facility Facility Scope 2 emissions (metric tonnes CO2e) KDC West 1,664,500.13 KDC East 1,617,372.22 Beatrix 747,922.45 South Deep 536,525.63 Tarkwa 77,890.55 Damang 25,001.57 St Ives 97,709.16 Agnew 32,165.85 Cerro Corona 36,010.38
10.2c Please break down your total global Scope 2 emissions by activity Activity Scope 2 emissions (metric tonnes CO2e)
11. Scope 2 Contractual Emissions
11.1 Do you consider that the grid average factors used to report Scope 2 emissions in question 8.3 reflect the contractual arrangements you have with electricity suppliers?
Yes
If no, complete questions 11.1a and 11.1b: 11.1a You may report a total contractual Scope 2 figure in response to this question. Please provide your total global contractual Scope 2 GHG emissions figure in metric tonnes CO2e
11.1b Explain the basis of the alternative figure (see guidance)
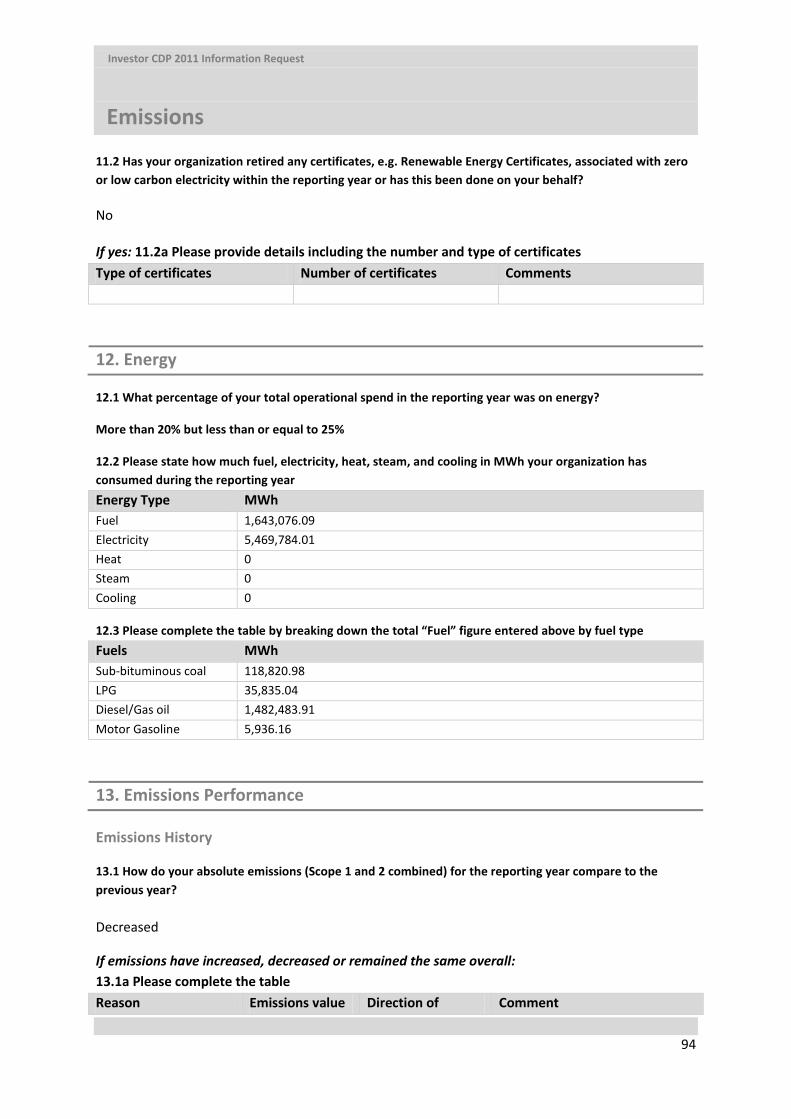
Investor CDP 2011 Information Request
Emissions
94
11.2 Has your organization retired any certificates, e.g. Renewable Energy Certificates, associated with zero or low carbon electricity within the reporting year or has this been done on your behalf?
No
If yes: 11.2a Please provide details including the number and type of certificates Type of certificates Number of certificates Comments
12. Energy
12.1 What percentage of your total operational spend in the reporting year was on energy?
More than 20% but less than or equal to 25%
12.2 Please state how much fuel, electricity, heat, steam, and cooling in MWh your organization has consumed during the reporting year Energy Type MWh Fuel 1,643,076.09 Electricity 5,469,784.01 Heat 0 Steam 0 Cooling 0
12.3 Please complete the table by breaking down the total “Fuel” figure entered above by fuel type Fuels MWh Sub-bituminous coal 118,820.98 LPG 35,835.04 Diesel/Gas oil 1,482,483.91 Motor Gasoline 5,936.16
13. Emissions Performance
Emissions History
13.1 How do your absolute emissions (Scope 1 and 2 combined) for the reporting year compare to the previous year? Decreased
If emissions have increased, decreased or remained the same overall: 13.1a Please complete the table Reason Emissions value Direction of Comment

Investor CDP 2011 Information Request
Emissions
95
(percentage) change Emission reduction activities
8.3% Decrease The Beatrix mine methane flaring project was implemented mid 2011 and reduced the mines’ methane emissions. The reduction is equal to 6.2% of the previous year’s carbon footprint. Energy Efficiency projects implemented at the South African operations caused the operations to use less energy while ore quality decreased. Approximately 2.1% additional energy savings on the total 2010 carbon footprint were achieved.
‘Other’ 0.8% Increase Ghanaian operations were impacted by power supply interruptions linked to the Electricity Company of Ghana. This forced the operations to use their diesel fuelled emergency power station, causing an increase in their carbon emissions.
Emissions Intensity
13.2 Please describe your gross combined Scope 1 and 2 emissions for the reporting year in metric tonnes CO2e per unit currency total revenue (2,400 characters limit for ‘reasons for change’) Intensity Figure
Metric numerator
Metric denominator
% change from previous year
Direction of change from previous year
Reason for change
126.51 Metric tonnes CO2
Unit total revenue (R Million)
19% Decrease This intensity figure excludes mine methane The % change from the previous year has been calculated based on the restated 2010 carbon footprint. The difference in terms of scope 1 and 2 emissions (excluding mine methane) for 2010 before and after the restatement is 4.5% decrease. The 2010 carbon
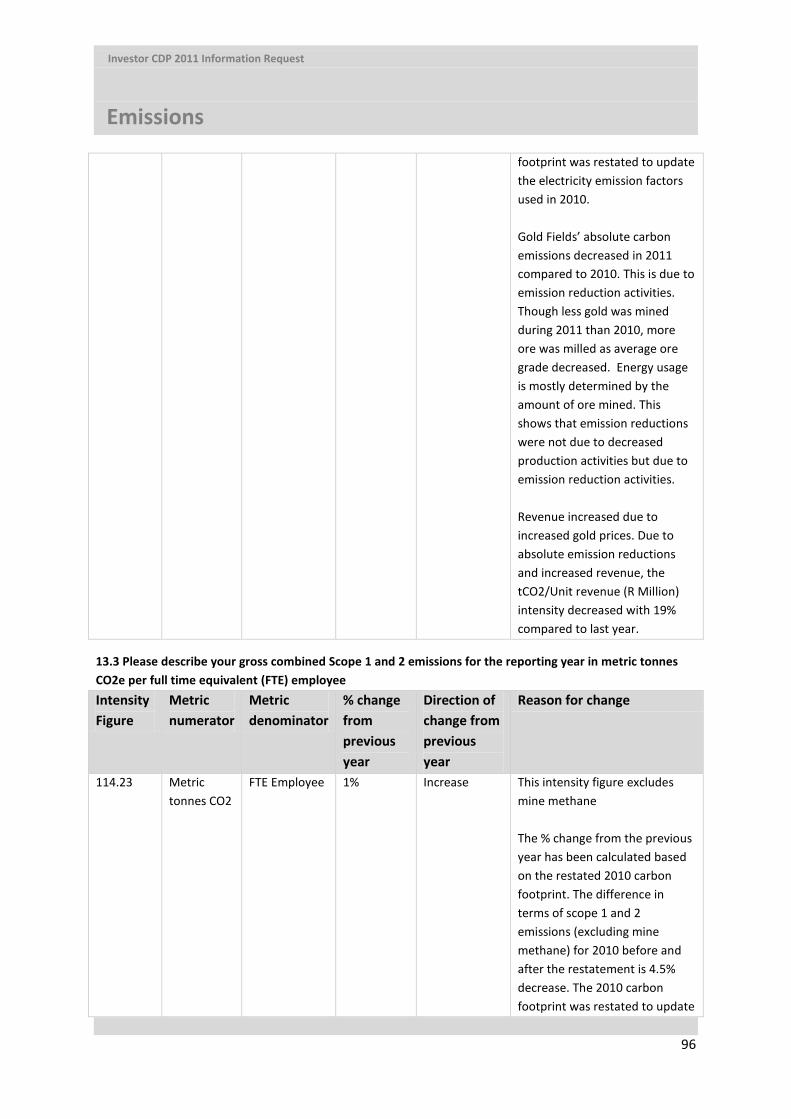
Investor CDP 2011 Information Request
Emissions
96
footprint was restated to update the electricity emission factors used in 2010. Gold Fields’ absolute carbon emissions decreased in 2011 compared to 2010. This is due to emission reduction activities. Though less gold was mined during 2011 than 2010, more ore was milled as average ore grade decreased. Energy usage is mostly determined by the amount of ore mined. This shows that emission reductions were not due to decreased production activities but due to emission reduction activities. Revenue increased due to increased gold prices. Due to absolute emission reductions and increased revenue, the tCO2/Unit revenue (R Million) intensity decreased with 19% compared to last year.
13.3 Please describe your gross combined Scope 1 and 2 emissions for the reporting year in metric tonnes CO2e per full time equivalent (FTE) employee Intensity Figure
Metric numerator
Metric denominator
% change from previous year
Direction of change from previous year
Reason for change
114.23 Metric tonnes CO2
FTE Employee 1% Increase This intensity figure excludes mine methane The % change from the previous year has been calculated based on the restated 2010 carbon footprint. The difference in terms of scope 1 and 2 emissions (excluding mine methane) for 2010 before and after the restatement is 4.5% decrease. The 2010 carbon footprint was restated to update
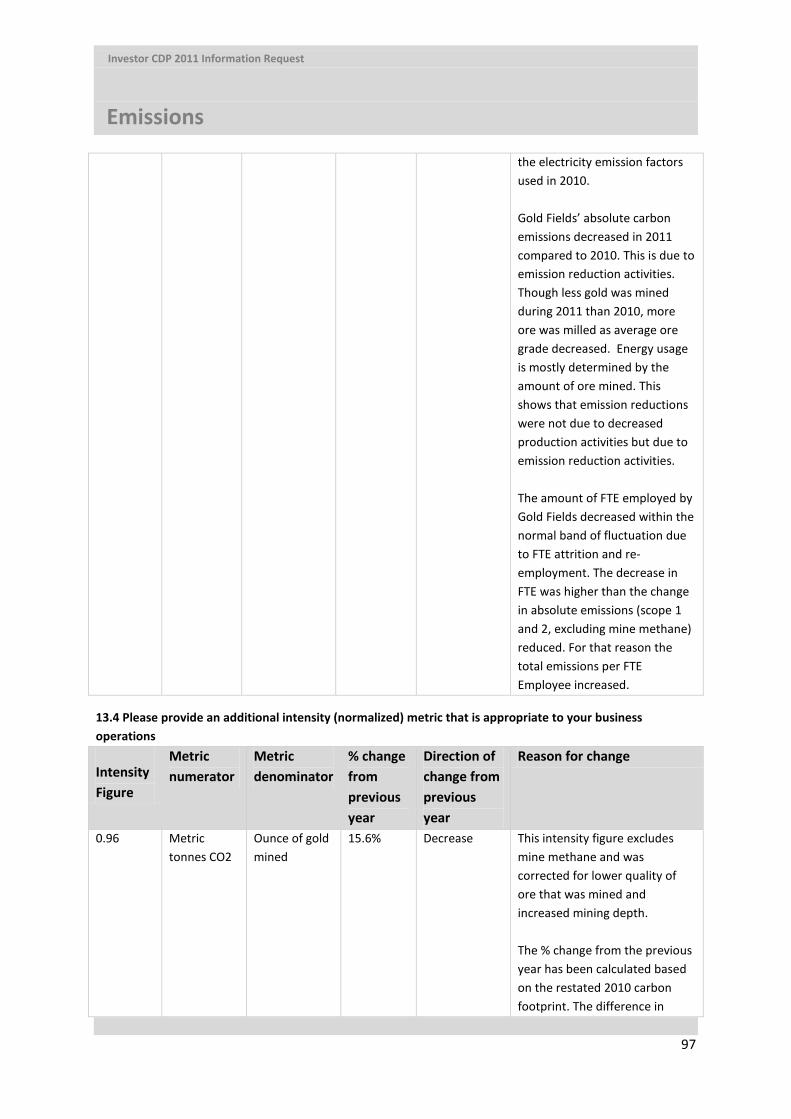
Investor CDP 2011 Information Request
Emissions
97
the electricity emission factors used in 2010. Gold Fields’ absolute carbon emissions decreased in 2011 compared to 2010. This is due to emission reduction activities. Though less gold was mined during 2011 than 2010, more ore was milled as average ore grade decreased. Energy usage is mostly determined by the amount of ore mined. This shows that emission reductions were not due to decreased production activities but due to emission reduction activities. The amount of FTE employed by Gold Fields decreased within the normal band of fluctuation due to FTE attrition and re-employment. The decrease in FTE was higher than the change in absolute emissions (scope 1 and 2, excluding mine methane) reduced. For that reason the total emissions per FTE Employee increased.
13.4 Please provide an additional intensity (normalized) metric that is appropriate to your business operations
Intensity Figure
Metric numerator
Metric denominator
% change from previous year
Direction of change from previous year
Reason for change
0.96 Metric tonnes CO2
Ounce of gold mined
15.6% Decrease This intensity figure excludes mine methane and was corrected for lower quality of ore that was mined and increased mining depth. The % change from the previous year has been calculated based on the restated 2010 carbon footprint. The difference in
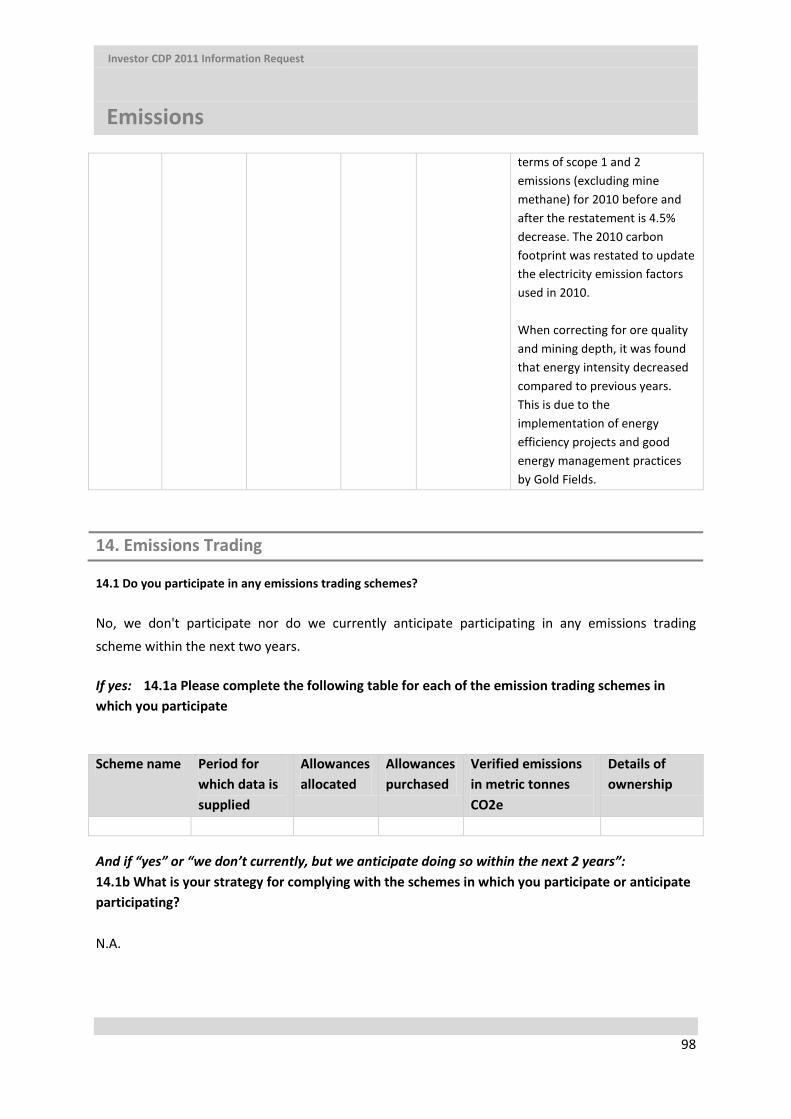
Investor CDP 2011 Information Request
Emissions
98
terms of scope 1 and 2 emissions (excluding mine methane) for 2010 before and after the restatement is 4.5% decrease. The 2010 carbon footprint was restated to update the electricity emission factors used in 2010. When correcting for ore quality and mining depth, it was found that energy intensity decreased compared to previous years. This is due to the implementation of energy efficiency projects and good energy management practices by Gold Fields.
14. Emissions Trading
14.1 Do you participate in any emissions trading schemes? No, we don't participate nor do we currently anticipate participating in any emissions trading scheme within the next two years.
If yes: 14.1a Please complete the following table for each of the emission trading schemes in which you participate
Scheme name Period for
which data is supplied
Allowances allocated
Allowances purchased
Verified emissions in metric tonnes CO2e
Details of ownership
And if “yes” or “we don’t currently, but we anticipate doing so within the next 2 years”: 14.1b What is your strategy for complying with the schemes in which you participate or anticipate participating? N.A.
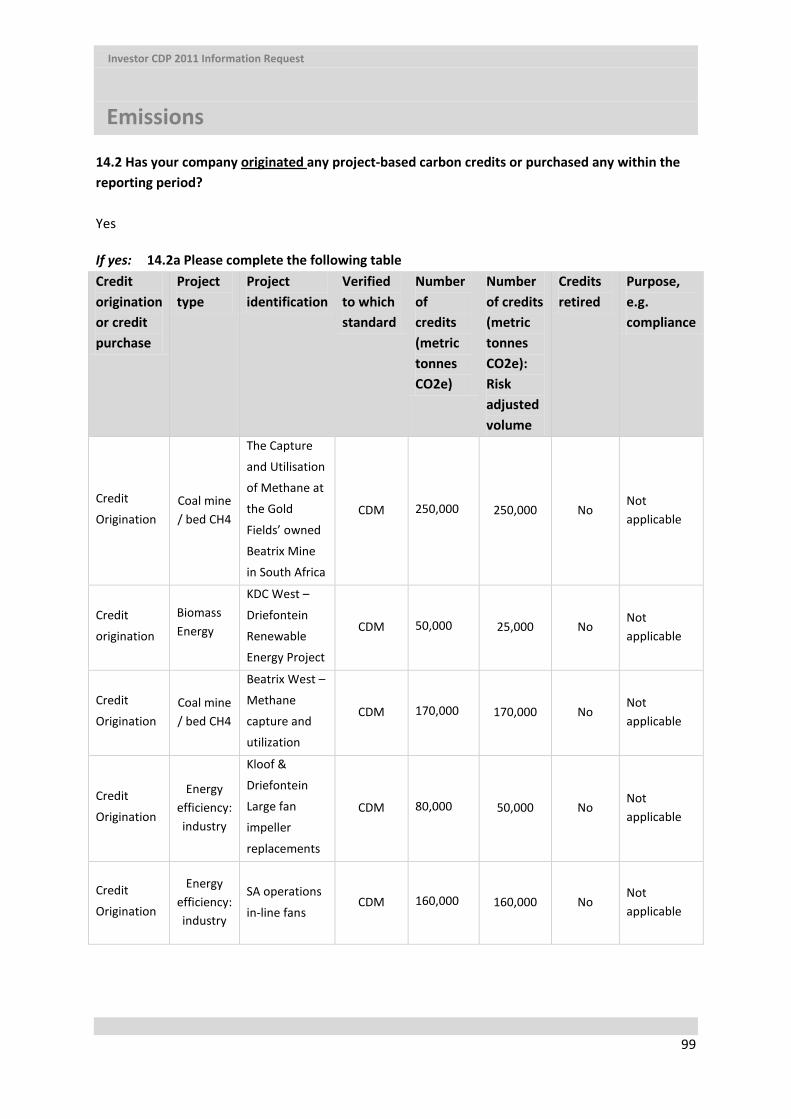
Investor CDP 2011 Information Request
Emissions
99
14.2 Has your company originated
any project-based carbon credits or purchased any within the reporting period?
Yes
If yes: 14.2a Please complete the following table Credit origination or credit purchase
Project type
Project identification
Verified to which standard
Number of credits (metric tonnes CO2e)
Number of credits (metric tonnes CO2e): Risk adjusted volume
Credits retired
Purpose, e.g. compliance
Credit
Origination Coal mine / bed CH4
The Capture
and Utilisation
of Methane at
the Gold
Fields’ owned
Beatrix Mine
in South Africa
CDM 250,000 250,000 No Not applicable
Credit
origination
Biomass Energy
KDC West –
Driefontein
Renewable
Energy Project
CDM 50,000 25,000 No Not applicable
Credit
Origination Coal mine / bed CH4
Beatrix West –
Methane
capture and
utilization
CDM 170,000 170,000 No Not applicable
Credit
Origination
Energy efficiency: industry
Kloof &
Driefontein
Large fan
impeller
replacements
CDM 80,000 50,000 No Not applicable
Credit
Origination
Energy efficiency: industry
SA operations
in-line fans
CDM 160,000 160,000 No Not applicable
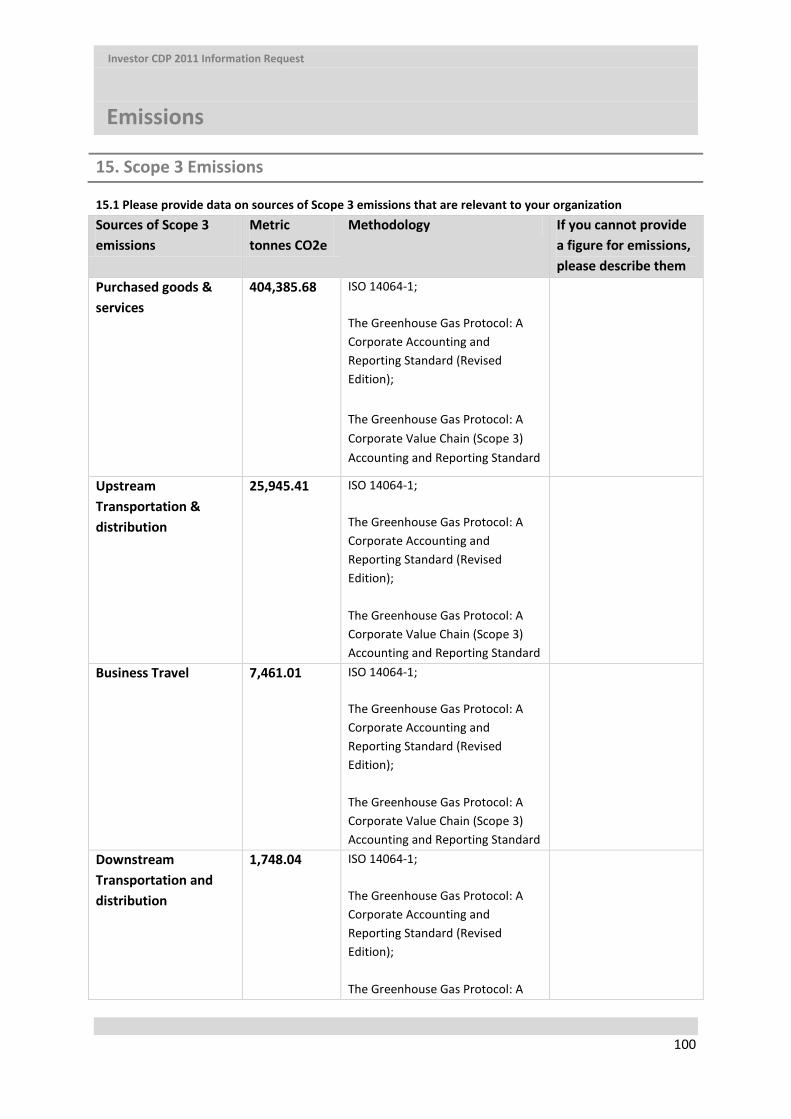
Investor CDP 2011 Information Request
Emissions
100
15. Scope 3 Emissions
15.1 Please provide data on sources of Scope 3 emissions that are relevant to your organization Sources of Scope 3 emissions
Metric tonnes CO2e
Methodology If you cannot provide a figure for emissions, please describe them
Purchased goods & services
404,385.68 ISO 14064-1; The Greenhouse Gas Protocol: A Corporate Accounting and Reporting Standard (Revised Edition);
The Greenhouse Gas Protocol: A Corporate Value Chain (Scope 3) Accounting and Reporting Standard
Upstream Transportation & distribution
25,945.41 ISO 14064-1; The Greenhouse Gas Protocol: A Corporate Accounting and Reporting Standard (Revised Edition); The Greenhouse Gas Protocol: A Corporate Value Chain (Scope 3) Accounting and Reporting Standard
Business Travel 7,461.01 ISO 14064-1; The Greenhouse Gas Protocol: A Corporate Accounting and Reporting Standard (Revised Edition); The Greenhouse Gas Protocol: A Corporate Value Chain (Scope 3) Accounting and Reporting Standard
Downstream Transportation and distribution
1,748.04 ISO 14064-1; The Greenhouse Gas Protocol: A Corporate Accounting and Reporting Standard (Revised Edition); The Greenhouse Gas Protocol: A
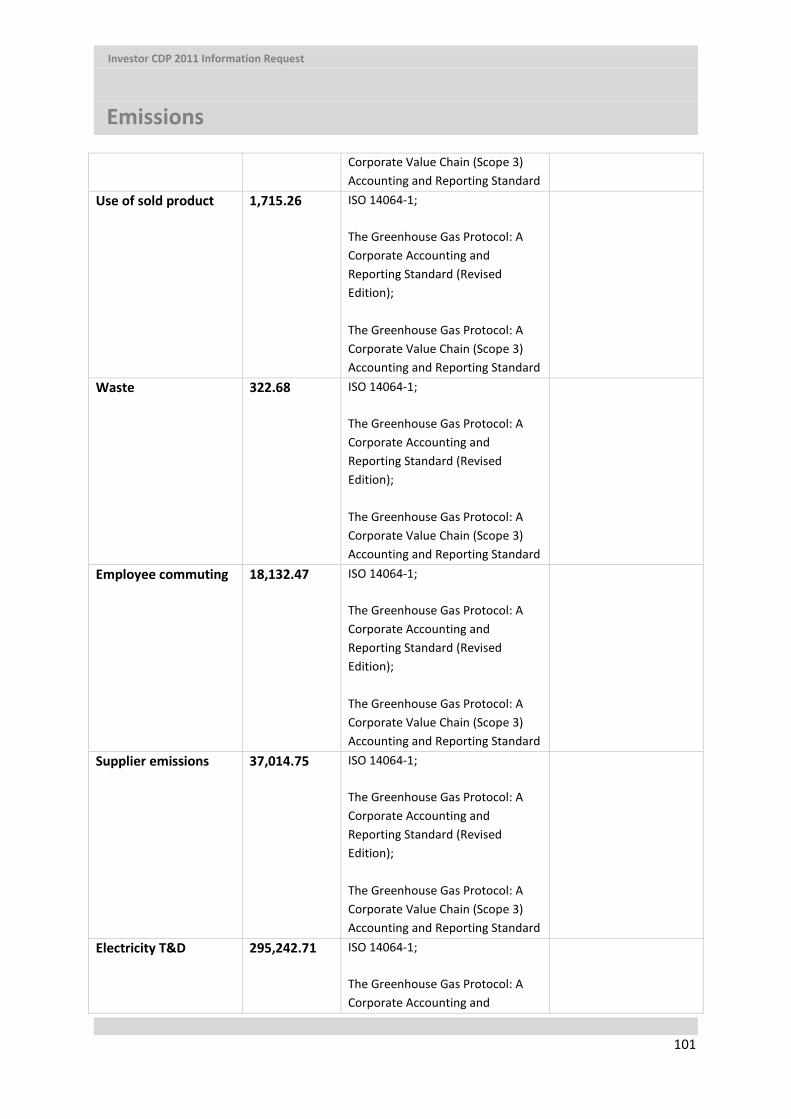
Investor CDP 2011 Information Request
Emissions
101
Corporate Value Chain (Scope 3) Accounting and Reporting Standard
Use of sold product 1,715.26 ISO 14064-1; The Greenhouse Gas Protocol: A Corporate Accounting and Reporting Standard (Revised Edition); The Greenhouse Gas Protocol: A Corporate Value Chain (Scope 3) Accounting and Reporting Standard
Waste 322.68 ISO 14064-1; The Greenhouse Gas Protocol: A Corporate Accounting and Reporting Standard (Revised Edition); The Greenhouse Gas Protocol: A Corporate Value Chain (Scope 3) Accounting and Reporting Standard
Employee commuting 18,132.47 ISO 14064-1; The Greenhouse Gas Protocol: A Corporate Accounting and Reporting Standard (Revised Edition); The Greenhouse Gas Protocol: A Corporate Value Chain (Scope 3) Accounting and Reporting Standard
Supplier emissions 37,014.75 ISO 14064-1; The Greenhouse Gas Protocol: A Corporate Accounting and Reporting Standard (Revised Edition); The Greenhouse Gas Protocol: A Corporate Value Chain (Scope 3) Accounting and Reporting Standard
Electricity T&D 295,242.71 ISO 14064-1; The Greenhouse Gas Protocol: A Corporate Accounting and

Investor CDP 2011 Information Request
Emissions
102
Reporting Standard (Revised Edition); The Greenhouse Gas Protocol: A Corporate Value Chain (Scope 3) Accounting and Reporting Standard
Total 791,968.01 ISO 14064-1; The Greenhouse Gas Protocol: A Corporate Accounting and Reporting Standard (Revised Edition); The Greenhouse Gas Protocol: A Corporate Value Chain (Scope 3) Accounting and Reporting Standard
15.2 Please indicate the verification/assurance status that applies to your Scope 3 emissions Please respond to this question by selecting one of the options from the list below, which will available as a drop down menu in the ORS.
• No emissions data provided • Not verified or assured • Verification or assurance underway but not yet complete- first year it has taken place • Verification or assurance underway but not yet complete- last year’s certificate attached • Verification or assurance complete
If Scope 3 emissions have been verified or assured (complete or underway), answer questions 15.2a and 15.2b: 15.2a Please indicate the proportion of your Scope 3 emissions that are verified/assured More than 90% but less than or equal to 100%
15.2b Please provide further details of the verification/assurance undertaken, and attach the relevant statements Type of verification or assurance
Relevant standard Relevant statement attached?
Limited Assurance ISAE 3000 Attach
15.3 Are you able to compare your Scope 3 emission for the reporting year with those for the previous year for any sources? (CDP 2011 Q15.3, amended) Yes
If yes: 15.3a Please complete the table (CDP 2011 Q15.3a, amended)
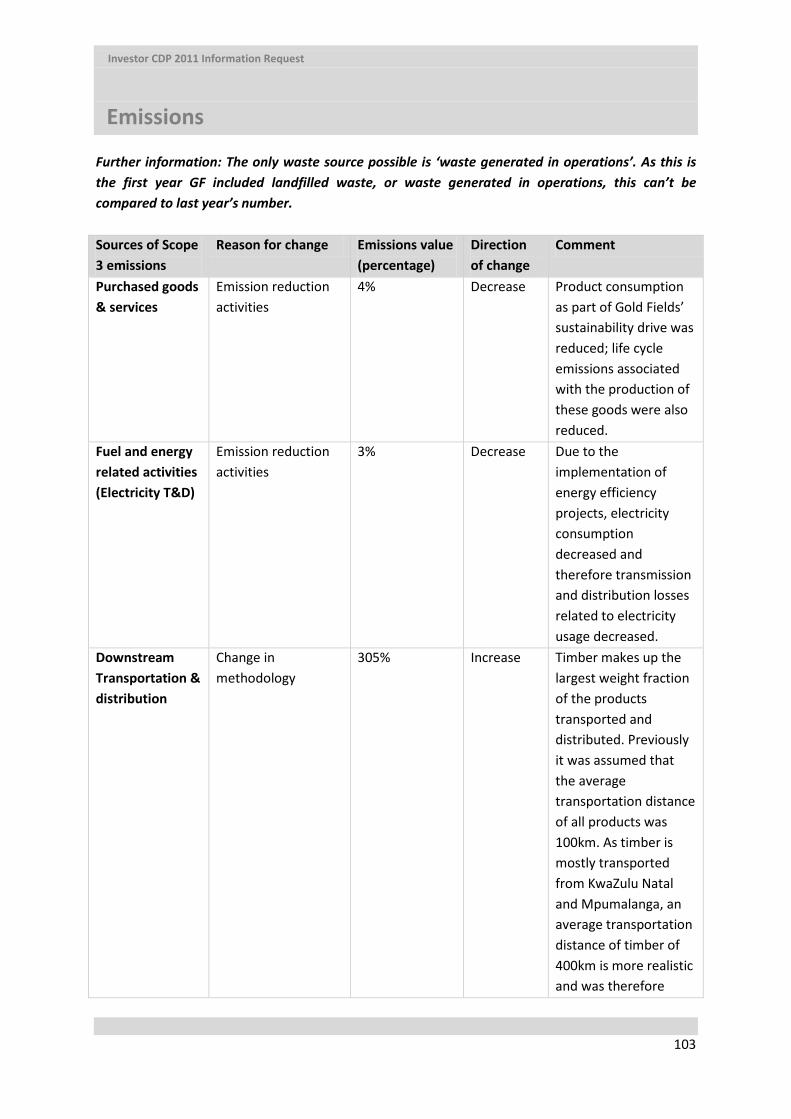
Investor CDP 2011 Information Request
Emissions
103
Further information: The only waste source possible is ‘waste generated in operations’. As this is the first year GF included landfilled waste, or waste generated in operations, this can’t be compared to last year’s number. Sources of Scope 3 emissions
Reason for change Emissions value (percentage)
Direction of change
Comment
Purchased goods & services
Emission reduction activities
4% Decrease Product consumption as part of Gold Fields’ sustainability drive was reduced; life cycle emissions associated with the production of these goods were also reduced.
Fuel and energy related activities (Electricity T&D)
Emission reduction activities
3% Decrease Due to the implementation of energy efficiency projects, electricity consumption decreased and therefore transmission and distribution losses related to electricity usage decreased.
Downstream Transportation & distribution
Change in methodology
305% Increase Timber makes up the largest weight fraction of the products transported and distributed. Previously it was assumed that the average transportation distance of all products was 100km. As timber is mostly transported from KwaZulu Natal and Mpumalanga, an average transportation distance of timber of 400km is more realistic and was therefore
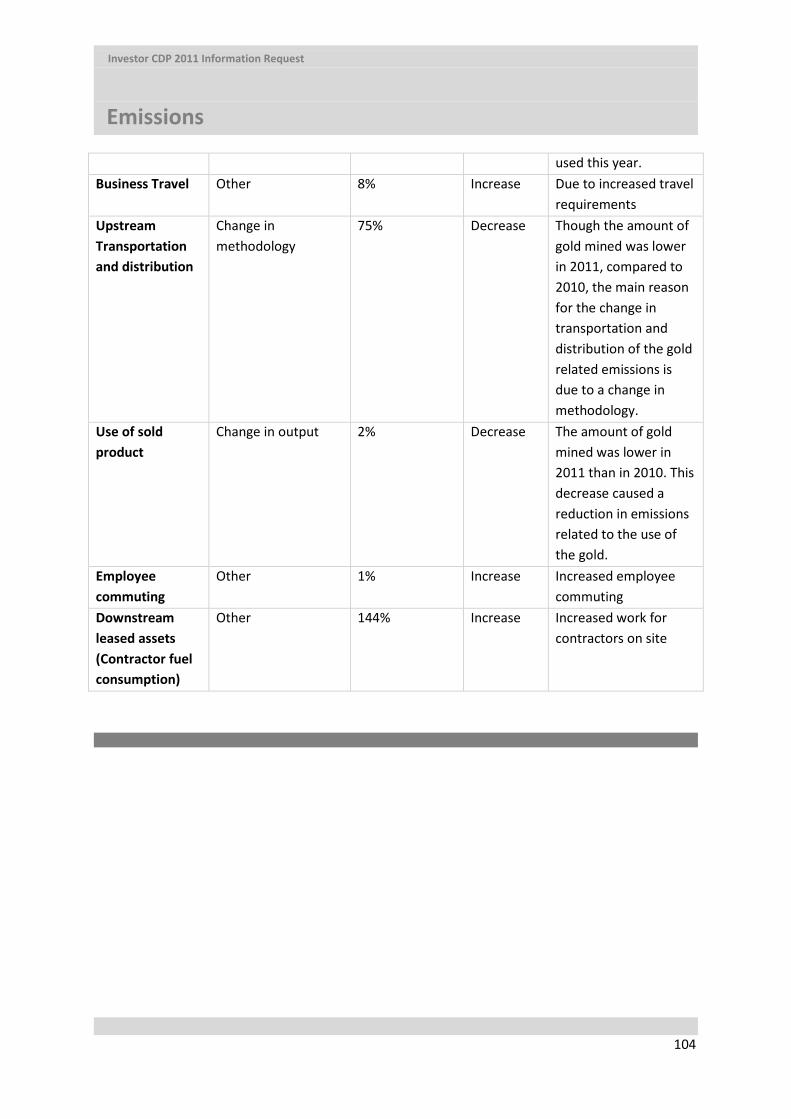
Investor CDP 2011 Information Request
Emissions
104
used this year. Business Travel Other 8% Increase Due to increased travel
requirements Upstream Transportation and distribution
Change in methodology
75% Decrease Though the amount of gold mined was lower in 2011, compared to 2010, the main reason for the change in transportation and distribution of the gold related emissions is due to a change in methodology.
Use of sold product
Change in output 2% Decrease The amount of gold mined was lower in 2011 than in 2010. This decrease caused a reduction in emissions related to the use of the gold.
Employee commuting
Other 1% Increase Increased employee commuting
Downstream leased assets (Contractor fuel consumption)
Other 144% Increase Increased work for contractors on site