gold guide for administrators - teaching … use the “growth ... documents listed on the right...
TRANSCRIPT

GOLD® Online
Guide for AdministratorsSection 7: Reports
58
Gettin
g Started
Ad
min
istration
Do
cum
entatio
nC
heckp
oin
tsP
lann
ing
Co
mm
un
ication
Rep
orts
Gettin
g Started
Ad
min
istration
Do
cum
entatio
nC
heckp
oin
tsP
lann
ing
Co
mm
un
ication
Rep
orts
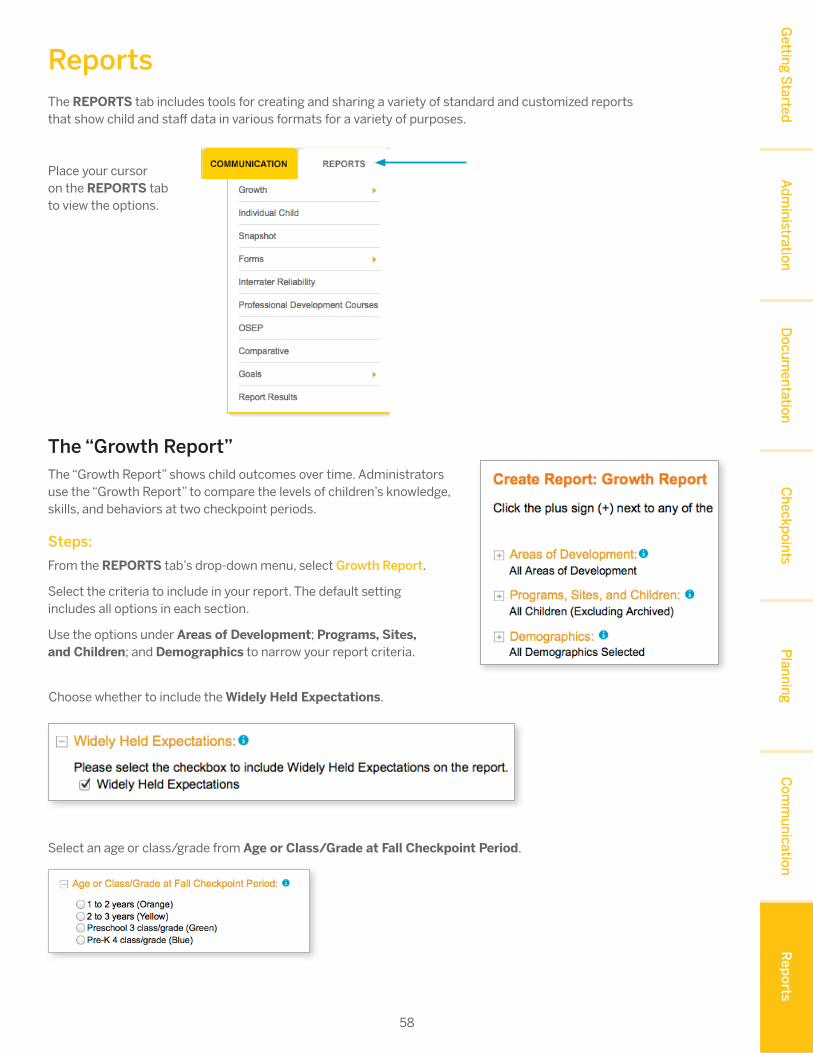
The REPORTS tab includes tools for creating and sharing a variety of standard and customized reports that show child and staff data in various formats for a variety of purposes.
Place your cursor on the REPORTS tab to view the options.
Reports
The “Growth Report”The “Growth Report” shows child outcomes over time. Administrators use the “Growth Report” to compare the levels of children’s knowledge, skills, and behaviors at two checkpoint periods.
Steps:
From the REPORTS tab’s drop-down menu, select Growth Report.
Select the criteria to include in your report. The default setting includes all options in each section.
Use the options under Areas of Development; Programs, Sites, and Children; and Demographics to narrow your report criteria.
Choose whether to include the Widely Held Expectations.
Select an age or class/grade from Age or Class/Grade at Fall Checkpoint Period.

59
Gettin
g Started
Ad
min
istration
Do
cum
entatio
nC
heckp
oin
tsP
lann
ing
Co
mm
un
ication
Rep
orts
Gettin
g Started
Ad
min
istration
Do
cum
entatio
nC
heckp
oin
tsP
lann
ing
Co
mm
un
ication
Rep
orts
Select two Checkpoint Periods.
Select the use of only finalized checkpoint data or the use of both finalized and unfinalized checkpoint data.
Tip. Using unfinalized data enables you to examine progress during a checkpoint period and possibly increase your data pool, but you run the risk of using data on which a teacher is still working.
The default score format is Raw Score.
Raw Score: To calculate an area raw score for a child’s knowledge, skills, and behaviors, GOLD® sums the ratings for each child, based on his or her skills, knowledge, and behaviors for each item (objectives/dimensions) in that area.
Select an option under Report By to choose which license level to include.
Tip. For more detailed information about the “Growth Report,” refer to the video tutorial and support documents listed on the right side of the screen.

60
Gettin
g Started
Ad
min
istration
Do
cum
entatio
nC
heckp
oin
tsP
lann
ing
Co
mm
un
ication
Rep
orts
Gettin
g Started
Ad
min
istration
Do
cum
entatio
nC
heckp
oin
tsP
lann
ing
Co
mm
un
ication
Rep
orts
Growth Export (Raw Data)The “Growth Export (Raw Data)” feature enables you to export raw growth data at the organization, program, teacher, and classroom levels. The output is available in HTML or Excel® format, but it is not available in PDF (print) format.
Steps:
From the REPORTS tab's drop-down menu, select Growth to view a submenu. Then click Growth Export (Raw Data).
Use the options under Programs, Sites, and Children and Demographics to narrow your export criteria.
Select two Checkpoint Periods to examine growth.
Select the use of only finalized checkpoint data or the use of both finalized and unfinalized checkpoint data.
Tip. Using unfinalized data enables you to check progress during a checkpoint period and possibly increase your data pool, but you run the risk of using data on which a teacher is still working.
From the Display Type choices, select the detail with which you would like the data to be presented. If you select either By Objective or By Dimension, you can only export the data for one area at a time.
Select which children to include in the report. Select Only Children With Ratings in Both Checkpoint Periods to report data only for children who have ratings in both checkpoint periods. Select All Children With Ratings in Either Checkpoint Period to report data for children who have ratings in either or both checkpoint periods.
Tip. Including only children with data from both checkpoint periods may give you a better idea of their growth, but the report might not include all of the children in the program.

61
Gettin
g Started
Ad
min
istration
Do
cum
entatio
nC
heckp
oin
tsP
lann
ing
Co
mm
un
ication
Rep
orts
Gettin
g Started
Ad
min
istration
Do
cum
entatio
nC
heckp
oin
tsP
lann
ing
Co
mm
un
ication
Rep
orts
The “Individual Child Report”This report enables you to see how individual children are performing during one or more checkpoint periods. By checking multiple checkpoint periods, you can track each child’s development and learning over time.
Steps:
From the REPORTS tab’s drop-down menu, select Individual Child.
Select specific Objectives/Dimensions to choose items for inclusion in the report.
Select the Program, Site, Teacher, Class, Children, and Period for which you would like to generate this report.
Select the Checkpoint Levels to include from All Levels, Only Checkpoint Levels, and Only Finalized Checkpoint Levels.
Select the Language in which you want the report to be generated.
Select an Output to choose a format.
Click GENERATE REPORT.

62
Gettin
g Started
Ad
min
istration
Do
cum
entatio
nC
heckp
oin
tsP
lann
ing
Co
mm
un
ication
Rep
orts
Gettin
g Started
Ad
min
istration
Do
cum
entatio
nC
heckp
oin
tsP
lann
ing
Co
mm
un
ication
Rep
orts
The “Snapshot Report”The “Snapshot Report” displays child outcomes data at a given time. It enables you to see the data by area, objective, and dimension. You can also report important demographic information.
Steps:
From the REPORTS tab’s drop-down menu, select Snapshot.
Use the options under Standards and Measures; Programs, Sites, and Children; and Demographics to specify the types of data to be included in your report. (To see the options, click the plus signs [+] to the left of the headings. Click the minus signs [–] to hide the lists.)
Select a Checkpoint Period.
Select the use of only finalized checkpoint data or the use of both finalized and unfinalized checkpoint data.
Use the options under Format to select information for inclusion in the report output.
Tip. For more detailed information, watch the video tutorial linked in the “Support” section of the screen.
The “Alignment Report” feature included in the “Snapshot Report” shows how the skills of children in preschool and pre-K are developing in relation to the expectations in state early learning standards or the Head Start Child Development & Early Learning Framework.
The report output is based on the state standards or Head Start alignment selected under Standards and Measures.
Click VIEW AS HTML, VIEW AS PDF, or VIEW AS EXCEL® to generate the report as the file type you prefer.

63
Gettin
g Started
Ad
min
istration
Do
cum
entatio
nC
heckp
oin
tsP
lann
ing
Co
mm
un
ication
Rep
orts
Gettin
g Started
Ad
min
istration
Do
cum
entatio
nC
heckp
oin
tsP
lann
ing
Co
mm
un
ication
Rep
orts
Forms
Alphabet Knowledge
Steps:
From the REPORTS tab’s drop-down menu, select Forms to view a submenu.
Click Alphabet Knowledge.
Click the plus signs [+] to see options for changing the settings.
Select a Report Type. You have the option of seeing a “Report by Class” or seeing at least one “Report by Child.”
Tip. You can only run one of these report types at a time. If you decide to run the others, simply close the report that was created, return to this screen, and select a different report type.
Use the options under Programs, Sites, and Children and Demographics to specify the data to be included in your report.
Select a checkpoint Period.
Select an Output.
After making all selections, click GENERATE REPORT.

64
Gettin
g Started
Ad
min
istration
Do
cum
entatio
nC
heckp
oin
tsP
lann
ing
Co
mm
un
ication
Rep
orts
Gettin
g Started
Ad
min
istration
Do
cum
entatio
nC
heckp
oin
tsP
lann
ing
Co
mm
un
ication
Rep
orts
Spanish Alphabet Knowledge
Steps:
From the REPORTS tab’s drop-down menu, select Forms to view a submenu.
Click Spanish Alphabet Knowledge.
To generate the report, follow the steps listed above for the “Alphabet Knowledge Form”.
“Spanish Alphabet Knowledge” reports should be used when the Spanish language and literacy objectives are enabled for particular children.
Number Concepts
Steps:
From the REPORTS tab’s drop-down menu, select Forms to view a submenu.
Click Number Concepts.
Click the plus signs [+] to see options for changing the settings.
Select a Report Type.
Use the options under Children, Demographics, Period, and Output to specify the data to be included in your report.
Click GENERATE REPORT.
Shapes
Steps:
From the REPORTS tab’s drop-down menu, click Forms to view a submenu.
Click Shapes.
Click the plus signs [+] to see options for changing the settings.
Select a Report Type.
Use the options under Children, Demographics, Period, and Output to specify the data to be included in your report.
Click GENERATE REPORT.

65
Gettin
g Started
Ad
min
istration
Do
cum
entatio
nC
heckp
oin
tsP
lann
ing
Co
mm
un
ication
Rep
orts
Gettin
g Started
Ad
min
istration
Do
cum
entatio
nC
heckp
oin
tsP
lann
ing
Co
mm
un
ication
Rep
orts
The “Interrater Reliability Certification Report”Use this report to monitor the completion status of staff members who are authorized to undertake the interrater reliability certification process.
Steps:
From the REPORTS tab’s drop-down menu, select Interrater Reliability.
Select All Programs and All Sites or specify a program and site from the drop-down list.
Select a Date Filter.
Select your Options.
Select your Output preference.
Click SHOW REPORT.
The “Professional Development Course Completion Report”Use this report to monitor staff members’ status with regard to the completion of GOLD® online professional development courses.
Steps:
From the REPORTS tab’s drop-down menu, select Professional Development Courses.
You can select All Programs and All Sites or select a specific program and site.
Select whether you want to Include users who have completed, are making progress in completing, and/or have not started the course.
Select your Output preference.
Select SHOW REPORT to generate the report.

66
Gettin
g Started
Ad
min
istration
Do
cum
entatio
nC
heckp
oin
tsP
lann
ing
Co
mm
un
ication
Rep
orts
Gettin
g Started
Ad
min
istration
Do
cum
entatio
nC
heckp
oin
tsP
lann
ing
Co
mm
un
ication
Rep
orts
OSEP ReportsIf these reports are enabled on your account, you can create a series of them for the Office of Special Education Programs (OSEP). These reports fall into three categories: “Entry Status” reports, “Federally Mandated Year-End” reports, and “Exit Status Summary” reports. Each report can be created at the organization, program, site, or child level, for the preschool children (ages 3–5) or the early intervention children (ages 0–3) in your program.
Steps:
From the REPORTS tab’s drop-down menu, select OSEP.
Select the report that you would like to create.
“Entry Status” Reports
The “Entry Status Report” shows the number and percentage of children with an IEP or IFSP whose knowledge, skills, and behaviors were or were not functioning at typical levels. It also shows entry status COSF scores for individual children. There are several ways to generate these reports, depending on what you need to analyze. It is useful to create “Entry Status” reports at the child level to make sure that data are complete for all the children involved.
Preschool Special Education Outcomes - Entry Status Report (child level) This report features user-defined fields that can be exported into an Excel® file. For each child, the report lists whether he or she is functioning at not typical/typical levels for each of the three OSEP outcomes and the child’s category (1–7) on the “ECO Center Child Outcomes Summary Form” for each outcome. This report is to be used for children ages 3–5 served in preschool special education programs.
Preschool Special Education Outcomes - Entry Status Report (program level)The “Entry Status Report” is used to meet 2007 federal reporting requirements under IDEA 2004 State Performance Plan Indicator #7. This report lists the number and percentage of children who are functioning at not typical/typical levels for each of the three OSEP outcomes. In addition, it lists the number and percentage of children who are not functioning at a typical level for at least one outcome. This report is to be used for children ages 3–5 served in preschool special education programs.
Early Intervention - Entry Status Report (child level)This report features user-defined fields that can be exported into an Excel® file. For each child, the report lists whether they are functioning at not typical/typical levels for each of the three OSEP outcomes and the child’s category (1–7) on the “ECO Center Child Outcomes Summary Form” for each outcome. This report is to be used for children ages birth to 3 served in early intervention programs.
Early Intervention - Entry Status Report (program level)The “Entry Status Report” is used to meet 2007 federal reporting requirements under IDEA 2004 State Performance Plan Indicator #3. This report lists the number and percentage of children who are functioning at not typical/typical levels for each of the three OSEP outcomes. In addition, it lists the number and percentage of children who are not functioning at a typical level for at least one outcome. This report is to be used for children ages birth to 3 served in early intervention programs.

67
Gettin
g Started
Ad
min
istration
Do
cum
entatio
nC
heckp
oin
tsP
lann
ing
Co
mm
un
ication
Rep
orts
Gettin
g Started
Ad
min
istration
Do
cum
entatio
nC
heckp
oin
tsP
lann
ing
Co
mm
un
ication
Rep
orts
On the next screen, set filters for teacher demographics. If you want to use all the criteria, click the gray button (at the top): I want to include all options. Go to next screen >>.
If you want to include all children whose records you may access, click the gray button (at the top): I want to include all children. Go to next screen >>.
Steps:
From the REPORTS tab’s drop-down menu, select OSEP.
Select the “Entry Status Report” that you would like to create.
On the first screen, select options to specify children’s demographics.

68
Gettin
g Started
Ad
min
istration
Do
cum
entatio
nC
heckp
oin
tsP
lann
ing
Co
mm
un
ication
Rep
orts
Gettin
g Started
Ad
min
istration
Do
cum
entatio
nC
heckp
oin
tsP
lann
ing
Co
mm
un
ication
Rep
orts
For “Child Level Entry Status” reports, you can adjust column display options after the report has been generated. Just check the boxes you need as columns and then click UPDATE.
Tip. To choose another display type (HTML, PDF, Excel®), use the links that follow the table.
On the final screen, enter a range of entry dates and select a Report View.
Click SUBMIT.
Note. The “Federal Entry Status Report” view gives you a very high overview of all the children included in the report. The “Program Analysis Entry Status Report” view gives the breakdown for each program included in the report.
On the third screen, set Report Inclusion Criteria to choose programs and sites for inclusion in the report. To include data for all children whose records you may access, click the gray button (at the top): I want to include all options. Go to next screen >>.
69
Gettin
g Started
Ad
min
istration
Do
cum
entatio
nC
heckp
oin
tsP
lann
ing
Co
mm
un
ication
Rep
orts
Gettin
g Started
Ad
min
istration
Do
cum
entatio
nC
heckp
oin
tsP
lann
ing
Co
mm
un
ication
Rep
orts
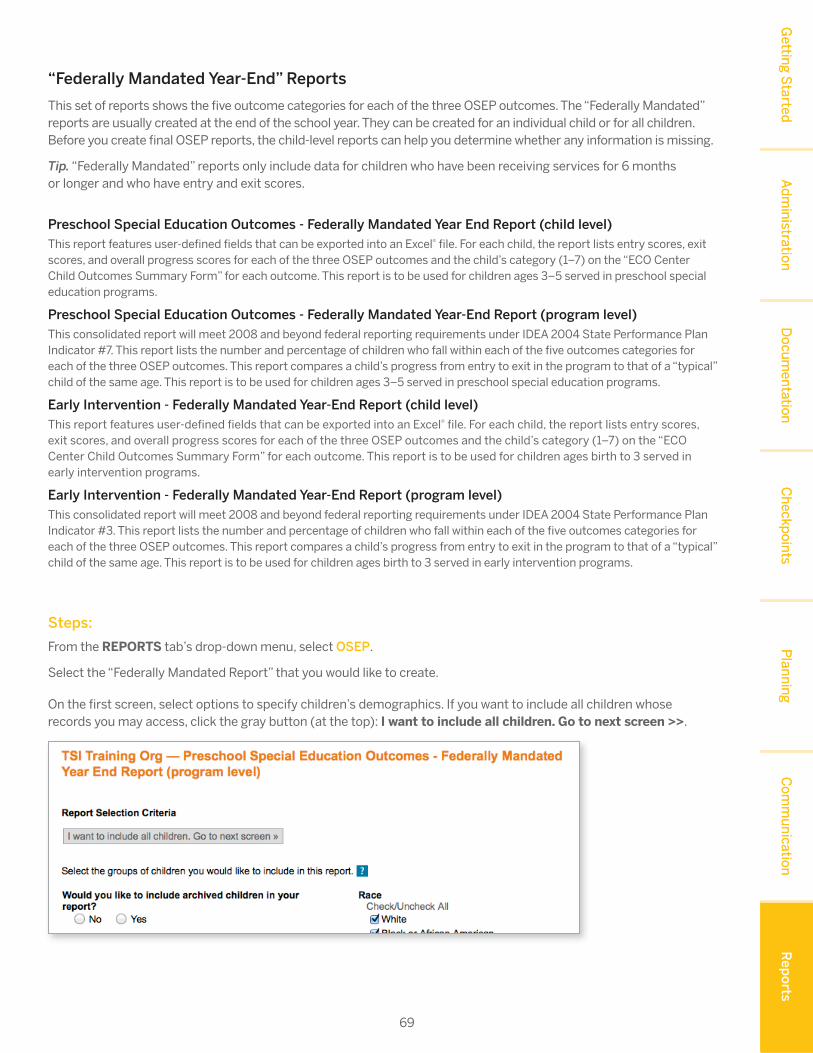
On the first screen, select options to specify children’s demographics. If you want to include all children whose records you may access, click the gray button (at the top): I want to include all children. Go to next screen >>.
“Federally Mandated Year-End” Reports
This set of reports shows the five outcome categories for each of the three OSEP outcomes. The “Federally Mandated” reports are usually created at the end of the school year. They can be created for an individual child or for all children. Before you create final OSEP reports, the child-level reports can help you determine whether any information is missing.
Tip. “Federally Mandated” reports only include data for children who have been receiving services for 6 months or longer and who have entry and exit scores.
Preschool Special Education Outcomes - Federally Mandated Year End Report (child level)This report features user-defined fields that can be exported into an Excel® file. For each child, the report lists entry scores, exit scores, and overall progress scores for each of the three OSEP outcomes and the child’s category (1–7) on the “ECO Center Child Outcomes Summary Form” for each outcome. This report is to be used for children ages 3–5 served in preschool special education programs.
Preschool Special Education Outcomes - Federally Mandated Year-End Report (program level)This consolidated report will meet 2008 and beyond federal reporting requirements under IDEA 2004 State Performance Plan Indicator #7. This report lists the number and percentage of children who fall within each of the five outcomes categories for each of the three OSEP outcomes. This report compares a child’s progress from entry to exit in the program to that of a “typical” child of the same age. This report is to be used for children ages 3–5 served in preschool special education programs.
Early Intervention - Federally Mandated Year-End Report (child level)This report features user-defined fields that can be exported into an Excel® file. For each child, the report lists entry scores, exit scores, and overall progress scores for each of the three OSEP outcomes and the child’s category (1–7) on the “ECO Center Child Outcomes Summary Form” for each outcome. This report is to be used for children ages birth to 3 served in early intervention programs.
Early Intervention - Federally Mandated Year-End Report (program level)This consolidated report will meet 2008 and beyond federal reporting requirements under IDEA 2004 State Performance Plan Indicator #3. This report lists the number and percentage of children who fall within each of the five outcomes categories for each of the three OSEP outcomes. This report compares a child’s progress from entry to exit in the program to that of a “typical” child of the same age. This report is to be used for children ages birth to 3 served in early intervention programs.
Steps:
From the REPORTS tab’s drop-down menu, select OSEP.
Select the “Federally Mandated Report” that you would like to create.

70
Gettin
g Started
Ad
min
istration
Do
cum
entatio
nC
heckp
oin
tsP
lann
ing
Co
mm
un
ication
Rep
orts
Gettin
g Started
Ad
min
istration
Do
cum
entatio
nC
heckp
oin
tsP
lann
ing
Co
mm
un
ication
Rep
orts
On the Report Format screen, you may change the formatting if you want to. However, the current year will auto-fill, so you can just click SUBMIT.
On the next screen, select options to specify teacher demographics. If you want to use all the criteria, click the gray button (at the top): I want to include all options. Go to next screen >>.
On the third screen, set Report Inclusion Criteria to choose programs and sites for inclusion in the report. To run the report for all children whose records you may access, click the gray button (at the top): I want to include all options. Go to next screen >>.

71
Gettin
g Started
Ad
min
istration
Do
cum
entatio
nC
heckp
oin
tsP
lann
ing
Co
mm
un
ication
Rep
orts
Gettin
g Started
Ad
min
istration
Do
cum
entatio
nC
heckp
oin
tsP
lann
ing
Co
mm
un
ication
Rep
orts
“Exit Status Summary” Reports (Child-Level Only)
The “Exit Status Summary” reports show the entry and exit scores of children who have or have had an IEP or IFSP in your program. This is a good report for seeing which children’s OSEP status in GOLD® should be adjusted because they have stopped receiving services. It also helps you check whether the data are correct. You can adjust columns and filter by entry and exit dates.
Preschool Special Education Outcomes - Exit Status Summary Report (child level)This report features user-defined fields that can be exported into an Excel® file. For each child, the report lists the exit status of the child and the length of time in your program. The report also lists entry scores, exit scores, and overall progress scores for each of the three OSEP outcomes and the child’s category (1–7) on the “ECO Center Child Outcomes Summary Form” for each outcome. This report is to be used for children ages 3–5 served in preschool special education programs.
Early Intervention - Exit Status Summary Report (child level)This report features user-defined fields that can be exported into an Excel® file. For each child, the report lists the exit status of the child and the length of time in your program. The report also lists entry scores, exit scores, and overall progress scores for each of the three OSEP outcomes and the child’s category (1–7) on the “ECO Center Child Outcomes Summary Form” for each outcome. This report is to be used for children ages birth to 3 served in early intervention programs.
Steps:
From the REPORTS tab’s drop-down menu, select OSEP.
Select the “Exit Status Summary Report” that you want to create.
Select the display columns and any date ranges you would like to specify. Then click UPDATE.
The report will appear below the filtering options.
Tip. To export the data to an Excel® file, click the link under the report table.
You can adjust the columns of a “Federally Mandated Report (Child-Level)” after the report has been generated. Just check the boxes of the columns you need and then click UPDATE.
Tip. To export the data to an Excel® file, click the link under the report table.

72
Gettin
g Started
Ad
min
istration
Do
cum
entatio
nC
heckp
oin
tsP
lann
ing
Co
mm
un
ication
Rep
orts
Gettin
g Started
Ad
min
istration
Do
cum
entatio
nC
heckp
oin
tsP
lann
ing
Co
mm
un
ication
Rep
orts
The “Comparative Report”In GOLD®, children’s skill levels are scored for each objective or dimension. The “Comparative Report” enables users to compare children’s scores to widely held expectations, to a nationally representative sample of children who have been assessed with GOLD®, or to a to readiness benchmark for a child’s readiness as he or she moves from pre-K toward kindergarten entry.
Steps:
From the REPORTS tab’s drop-down menu, select Comparative Report.
Select the criteria to include in your report. The default setting includes all options in each section.
Use the options under Areas of Development; Programs, Sites, and Children; and Demographics to narrow your report criteria.
Choose whether to compare children’s data to Widely Held Expectations, National Normative Sample, or GOLD Readiness.
Choosing Widely Held Expectations enables users to compare data for a group of children to determine if the children’s skills, knowledge, and behavior are below, meeting, or exceeding widely held expectations.
Choosing National Normative Sample enables users to compare children’s data to a nationally representative sample.
Choosing GOLD Readiness enables users to measure a child’s readiness as he or she moves from pre-K toward kindergarten entry.
Once you have selected an option under Compare to, an additional selection option appears. Options will be dependent on what you select under Compare to.
Any single age or class/grade can be selected when you choose Widely Held Expectations.
Select Preschool 3 class/grade (Green), Pre-K 4 class/grade (Blue), or Kindergarten (Purple) when you choose National Normative Sample.
The default selection is Kindergarten Entry when you choose GOLD Readiness.

73
Gettin
g Started
Ad
min
istration
Do
cum
entatio
nC
heckp
oin
tsP
lann
ing
Co
mm
un
ication
Rep
orts
Gettin
g Started
Ad
min
istration
Do
cum
entatio
nC
heckp
oin
tsP
lann
ing
Co
mm
un
ication
Rep
orts
Choose which children to include in the report. Select Only Children With Ratings in All Checkpoint Periods to report data only for children who have ratings in both checkpoint periods. Select All Children With Ratings in Any Checkpoint Period to report data for children who have ratings in either or both checkpoint periods.
Tip. Including only children with ratings from both checkpoint periods may give you a better idea of the growth in your program, but the report might not include results for all children in your program.
Select one or more Checkpoint Periods.
Select the use of only finalized checkpoint data or the use of both finalized and unfinalized checkpoint data. To select more than one checkpoint period, hold down the “control” key on your keyboard and use your mouse to select which periods you would like to report on.
Tip. Using unfinalized data enables you to examine comparative data during a checkpoint period and possibly increase your data pool, but you run the risk of using data on which a teacher is still working.
Select an option under Display Type to choose which display to include.
When selecting Widely Held Expectations or National Normative Scores, the user can choose to include tables or charts.
When selecting GOLD Readiness, the user’s only display type option is tables.
When the user chooses Tables as the display type, an additional report criteria selection appears: Report Level.
Select an option under Report Level to choose which license level to include.
When the user chooses GOLD Readiness under Compare to, an additional report criteria selection appears: Report Type.
Select an option under Report Type. Selecting Detailed will include the following data in the report output: a widely held expectation range for each area; widely held expectations data; the Readiness Benchmark for each area; and Readiness data. Selecting Summary will include the following data in the report output: a widely held expectation range for each area; the Readiness Benchmark for each area; and Readiness data.
Tip. For more detailed information about the “Comparative Report,” refer to the support documents listed on the right side of the screen.