goldman sachs dynamo strategy index™ - solactive · goldman sachs does not warrant the accuracy...
TRANSCRIPT
Goldman Sachs Dynamo Strategy Index™
¹ The strategy and rebalancing process are further described in the full rulebook available at http://www.solactive.com/downloads/GSDYNMO5.pdf
INDEX REPORTINGMay-31-2018
INDEX INFORMATION
Ticker GSDYNMO5
RIC .GSDYNMO5
Thomson Identifier
Index Sponsor Goldman, Sachs & Co.
Currency USD
Number of Underliers max. 8
Volatility Target 5%
Daily Volatility Control 5.50%
Index Calculator Solactive AG
Index Base Date Apr-30-2004
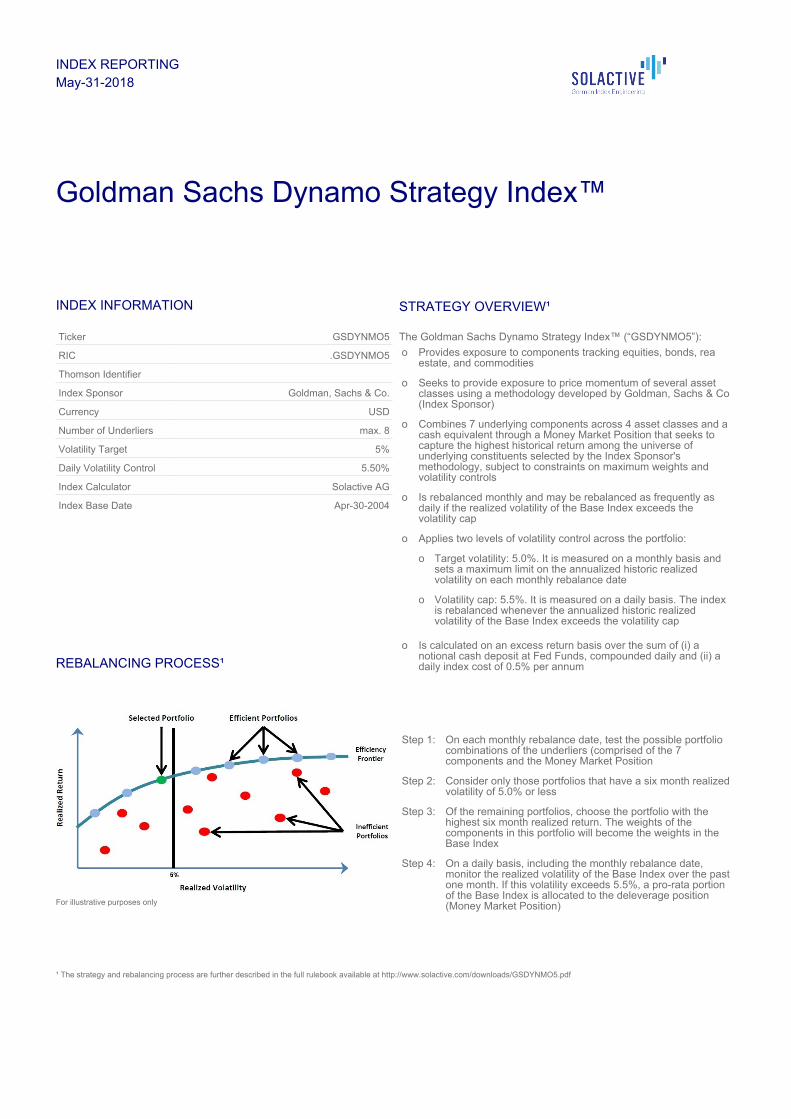
REBALANCING PROCESS¹
For illustrative purposes only
STRATEGY OVERVIEW¹
The Goldman Sachs Dynamo Strategy Index™ (“GSDYNMO5”):
o Provides exposure to components tracking equities, bonds, reaestate, and commodities
o Seeks to provide exposure to price momentum of several assetclasses using a methodology developed by Goldman, Sachs & Co(Index Sponsor)
o Combines 7 underlying components across 4 asset classes and acash equivalent through a Money Market Position that seeks tocapture the highest historical return among the universe ofunderlying constituents selected by the Index Sponsor'smethodology, subject to constraints on maximum weights andvolatility controls
o Is rebalanced monthly and may be rebalanced as frequently asdaily if the realized volatility of the Base Index exceeds thevolatility cap
o Applies two levels of volatility control across the portfolio:
o Target volatility: 5.0%. It is measured on a monthly basis andsets a maximum limit on the annualized historic realizedvolatility on each monthly rebalance date
o Volatility cap: 5.5%. It is measured on a daily basis. The indexis rebalanced whenever the annualized historic realizedvolatility of the Base Index exceeds the volatility cap
o Is calculated on an excess return basis over the sum of (i) anotional cash deposit at Fed Funds, compounded daily and (ii) adaily index cost of 0.5% per annum
Step 1: On each monthly rebalance date, test the possible portfoliocombinations of the underliers (comprised of the 7components and the Money Market Position
Step 2: Consider only those portfolios that have a six month realizedvolatility of 5.0% or less
Step 3: Of the remaining portfolios, choose the portfolio with thehighest six month realized return. The weights of thecomponents in this portfolio will become the weights in theBase Index
Step 4: On a daily basis, including the monthly rebalance date,monitor the realized volatility of the Base Index over the pastone month. If this volatility exceeds 5.5%, a pro-rata portionof the Base Index is allocated to the deleverage position(Money Market Position)
INDEX COMPOSITION
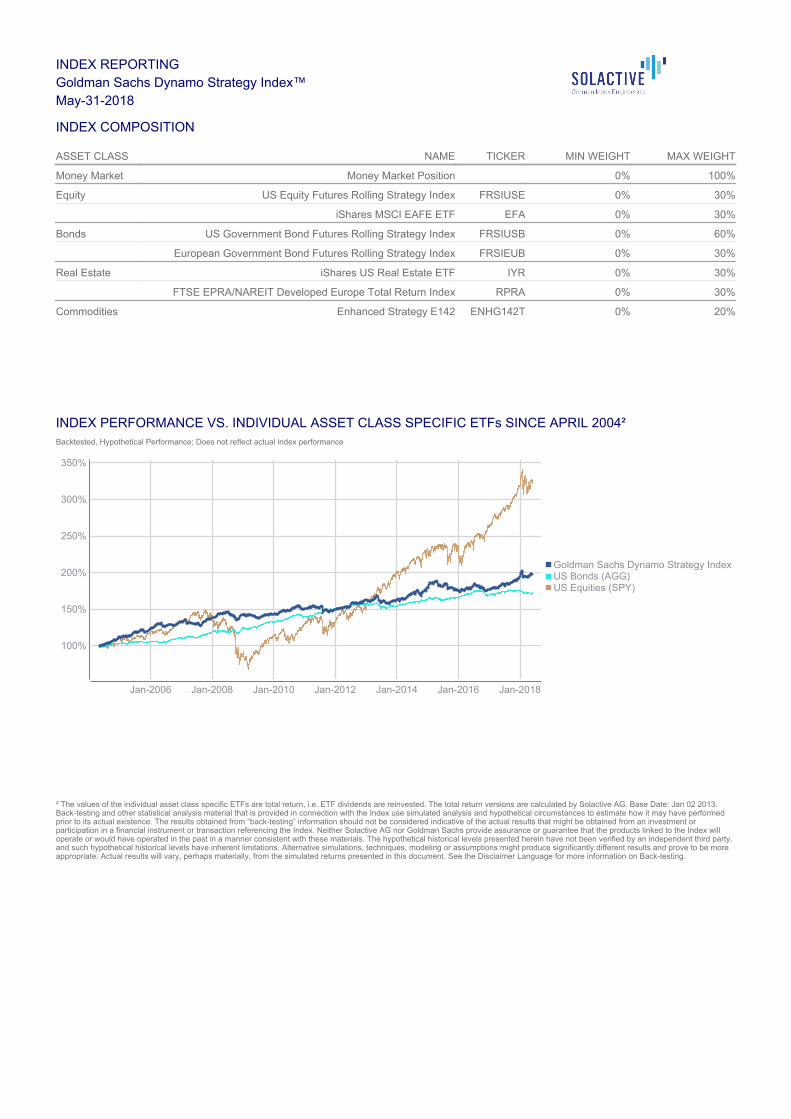
INDEX PERFORMANCE VS. INDIVIDUAL ASSET CLASS SPECIFIC ETFs SINCE APRIL 2004² Backtested, Hypothetical Performance; Does not reflect actual index performance
² The values of the individual asset class specific ETFs are total return, i.e. ETF dividends are reinvested. The total return versions are calculated by Solactive AG. Base Date: Jan 02 2013.Back-testing and other statistical analysis material that is provided in connection with the Index use simulated analysis and hypothetical circumstances to estimate how it may have performedprior to its actual existence. The results obtained from “back-testing” information should not be considered indicative of the actual results that might be obtained from an investment orparticipation in a financial instrument or transaction referencing the Index. Neither Solactive AG nor Goldman Sachs provide assurance or guarantee that the products linked to the Index willoperate or would have operated in the past in a manner consistent with these materials. The hypothetical historical levels presented herein have not been verified by an independent third party,and such hypothetical historical levels have inherent limitations. Alternative simulations, techniques, modeling or assumptions might produce significantly different results and prove to be moreappropriate. Actual results will vary, perhaps materially, from the simulated returns presented in this document. See the Disclaimer Language for more information on Back-testing.
INDEX REPORTINGGoldman Sachs Dynamo Strategy Index™May-31-2018
ASSET CLASS NAME TICKER MIN WEIGHT MAX WEIGHT
Money Market Money Market Position 0% 100%
Equity US Equity Futures Rolling Strategy Index FRSIUSE 0% 30%
iShares MSCI EAFE ETF EFA 0% 30%
Bonds US Government Bond Futures Rolling Strategy Index FRSIUSB 0% 60%
European Government Bond Futures Rolling Strategy Index FRSIEUB 0% 30%
Real Estate iShares US Real Estate ETF IYR 0% 30%
FTSE EPRA/NAREIT Developed Europe Total Return Index RPRA 0% 30%
Commodities Enhanced Strategy E142 ENHG142T 0% 20%
Goldman Sachs Dynamo Strategy IndexUS Bonds (AGG)US Equities (SPY)
Jan-2006 Jan-2008 Jan-2010 Jan-2012 Jan-2014 Jan-2016 Jan-2018
100%
150%
200%
250%
300%
350%
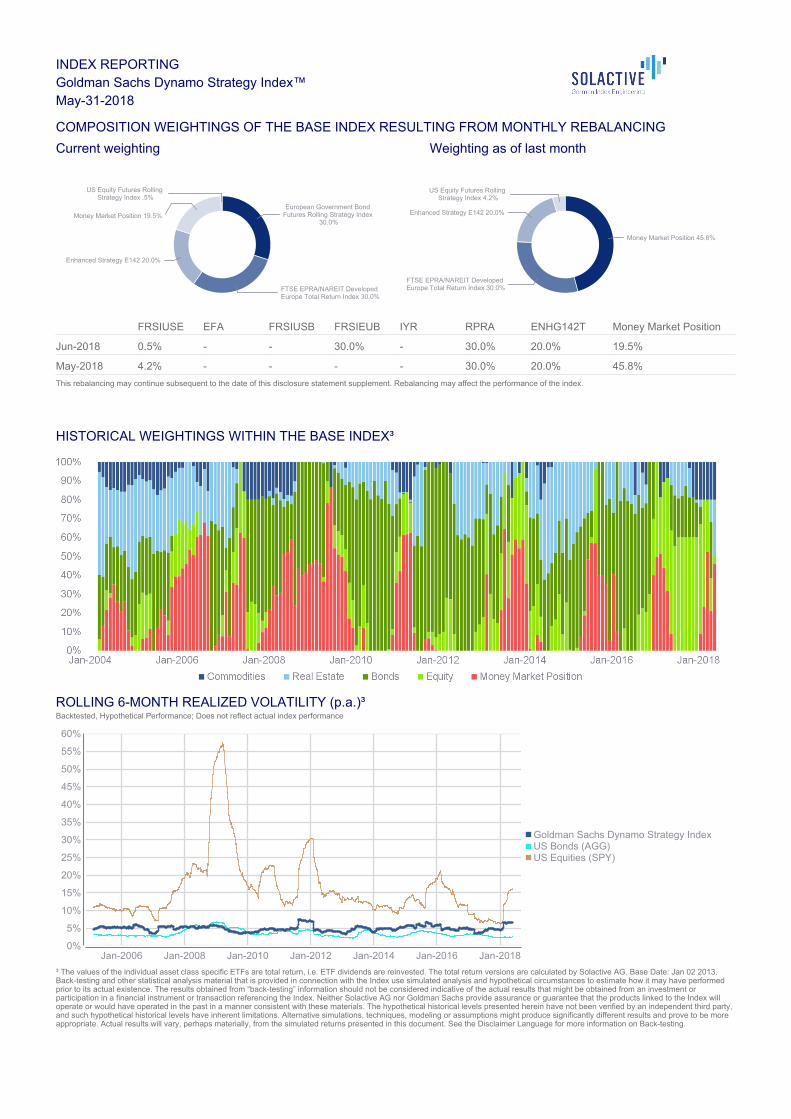
COMPOSITION WEIGHTINGS OF THE BASE INDEX RESULTING FROM MONTHLY REBALANCING
This rebalancing may continue subsequent to the date of this disclosure statement supplement. Rebalancing may affect the performance of the index.
HISTORICAL WEIGHTINGS WITHIN THE BASE INDEX³
ROLLING 6-MONTH REALIZED VOLATILITY (p.a.)³Backtested, Hypothetical Performance; Does not reflect actual index performance
³ The values of the individual asset class specific ETFs are total return, i.e. ETF dividends are reinvested. The total return versions are calculated by Solactive AG. Base Date: Jan 02 2013.Back-testing and other statistical analysis material that is provided in connection with the Index use simulated analysis and hypothetical circumstances to estimate how it may have performedprior to its actual existence. The results obtained from “back-testing” information should not be considered indicative of the actual results that might be obtained from an investment orparticipation in a financial instrument or transaction referencing the Index. Neither Solactive AG nor Goldman Sachs provide assurance or guarantee that the products linked to the Index willoperate or would have operated in the past in a manner consistent with these materials. The hypothetical historical levels presented herein have not been verified by an independent third party,and such hypothetical historical levels have inherent limitations. Alternative simulations, techniques, modeling or assumptions might produce significantly different results and prove to be moreappropriate. Actual results will vary, perhaps materially, from the simulated returns presented in this document. See the Disclaimer Language for more information on Back-testing.
INDEX REPORTINGGoldman Sachs Dynamo Strategy Index™May-31-2018
Current weighting Weighting as of last month
US Equity Futures Rolling Strategy Index .5%
Money Market Position 19.5%
Enhanced Strategy E142 20.0%
European Government Bond Futures Rolling Strategy Index
30.0%
FTSE EPRA/NAREIT Developed Europe Total Return Index 30.0%
US Equity Futures Rolling Strategy Index 4.2%
Enhanced Strategy E142 20.0%
FTSE EPRA/NAREIT Developed Europe Total Return Index 30.0%
Money Market Position 45.8%
FRSIUSE EFA FRSIUSB FRSIEUB IYR RPRA ENHG142T Money Market Position
Jun-2018 0.5% - - 30.0% - 30.0% 20.0% 19.5%
May-2018 4.2% - - - - 30.0% 20.0% 45.8%
Goldman Sachs Dynamo Strategy IndexUS Bonds (AGG)US Equities (SPY)
Jan-2006 Jan-2008 Jan-2010 Jan-2012 Jan-2014 Jan-2016 Jan-20180%
5%
10%
15%
20%
25%
30%
35%
40%
45%
50%
55%
60%
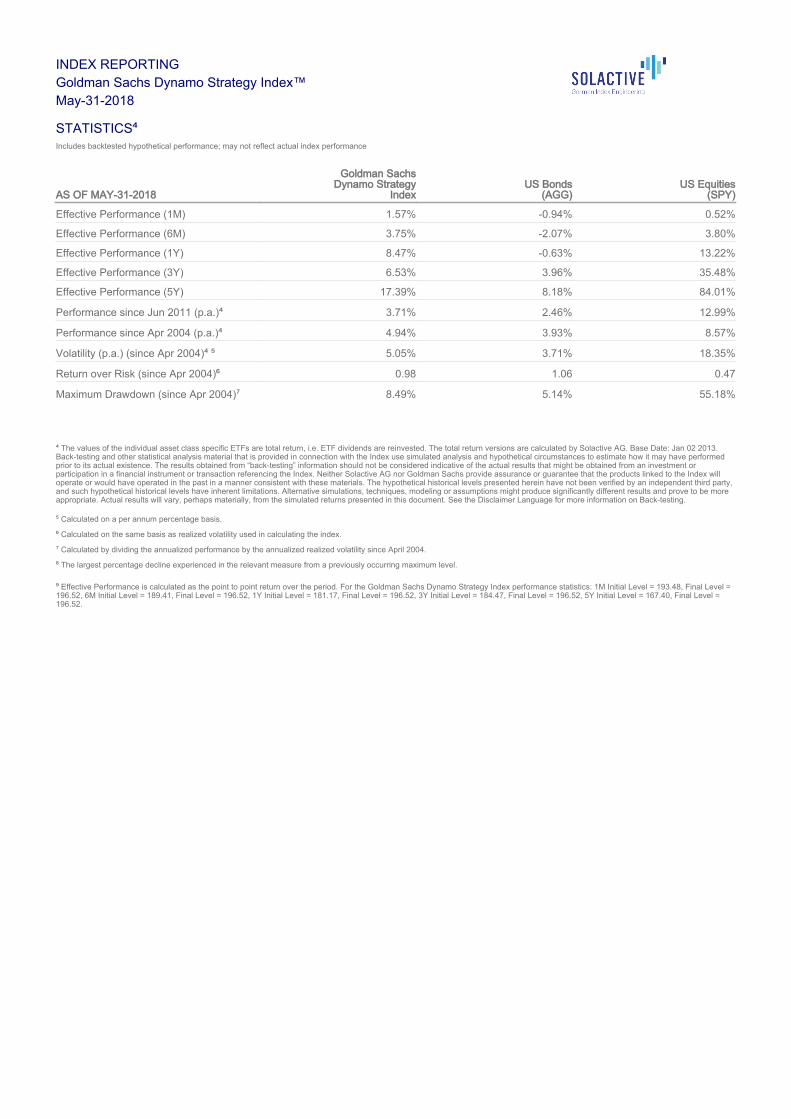
STATISTICS⁴ Includes backtested hypothetical performance; may not reflect actual index performance
⁴ The values of the individual asset class specific ETFs are total return, i.e. ETF dividends are reinvested. The total return versions are calculated by Solactive AG. Base Date: Jan 02 2013.Back-testing and other statistical analysis material that is provided in connection with the Index use simulated analysis and hypothetical circumstances to estimate how it may have performedprior to its actual existence. The results obtained from “back-testing” information should not be considered indicative of the actual results that might be obtained from an investment orparticipation in a financial instrument or transaction referencing the Index. Neither Solactive AG nor Goldman Sachs provide assurance or guarantee that the products linked to the Index willoperate or would have operated in the past in a manner consistent with these materials. The hypothetical historical levels presented herein have not been verified by an independent third party,and such hypothetical historical levels have inherent limitations. Alternative simulations, techniques, modeling or assumptions might produce significantly different results and prove to be moreappropriate. Actual results will vary, perhaps materially, from the simulated returns presented in this document. See the Disclaimer Language for more information on Back-testing. ⁵ Calculated on a per annum percentage basis. ⁶ Calculated on the same basis as realized volatility used in calculating the index. ⁷ Calculated by dividing the annualized performance by the annualized realized volatility since April 2004. ⁸ The largest percentage decline experienced in the relevant measure from a previously occurring maximum level.
⁹ Effective Performance is calculated as the point to point return over the period. For the Goldman Sachs Dynamo Strategy Index performance statistics: 1M Initial Level = 193.48, Final Level =196.52, 6M Initial Level = 189.41, Final Level = 196.52, 1Y Initial Level = 181.17, Final Level = 196.52, 3Y Initial Level = 184.47, Final Level = 196.52, 5Y Initial Level = 167.40, Final Level =196.52.
INDEX REPORTINGGoldman Sachs Dynamo Strategy Index™May-31-2018
AS OF MAY-31-2018
Goldman SachsDynamo Strategy
IndexUS Bonds
(AGG)US Equities
(SPY)
Effective Performance (1M) 1.57% -0.94% 0.52%
Effective Performance (6M) 3.75% -2.07% 3.80%
Effective Performance (1Y) 8.47% -0.63% 13.22%
Effective Performance (3Y) 6.53% 3.96% 35.48%
Effective Performance (5Y) 17.39% 8.18% 84.01%
Performance since Jun 2011 (p.a.)⁴ 3.71% 2.46% 12.99%
Performance since Apr 2004 (p.a.)⁴ 4.94% 3.93% 8.57%
Volatility (p.a.) (since Apr 2004)⁴ ⁵ 5.05% 3.71% 18.35%
Return over Risk (since Apr 2004)⁶ 0.98 1.06 0.47
Maximum Drawdown (since Apr 2004)⁷ 8.49% 5.14% 55.18%
DISCLAIMER The financial instrument is not sponsored, promoted, sold or supported in any other manner by Solactive AG (the "Calculation Agent") nor does the Calculation Agent offer any express orimplicit guarantee or assurance either with regard to the results of using the Index and/or Index trade mark or the Index Price at any time or in any other respect. The Index is calculated andpublished by the Calculation Agent. The Calculation Agent uses its best efforts to ensure that the Index is calculated correctly. The Calculation Agent does not warrant the accuracy orcompleteness of any information contained herein. Irrespective of its obligations towards the Issuer, the Calculation Agent has no obligation to point out errors in the Index to third partiesincluding but not limited to investors and/or financial intermediaries of the financial instrument. The calculation and publication of the Index by the Calculation Agent for the purpose of use inconnection with the financial instrument does not constitute a recommendation by the Calculation Agent to invest capital in said financial instrument nor does it in any way represent anassurance or opinion of the Calculation Agent with regard to any investment in this financial instrument. Goldman Sachs does not warrant the accuracy or completeness of any information contained herein and provides no assurance that this information is, in fact, accurate. The informationcontained herein is subject to change without notice. Any representations, projections and comparisons contained herein may not reflect the opinions of Goldman Sachs and may not beaccurate either now or at a future date. Consequently, you should not rely on such representations, projections, comparisons or other opinions when selecting any investment product or makinga recommendation to a customer. Current and future economic and other market events concerning an investment product or an index may cause the information provided herein to beincorrect. Past performance is not indicative of future results and should never be relied upon in making an investment decision or recommendation. Any investments or strategies referencedherein do not take into account the investment objectives, financial situation or particular needs of any specific person. Product suitability must be independently determined for each individualinvestor. Goldman Sachs explicitly disclaims any responsibility for product suitability or suitability determinations related to individual investors. © 2015 Goldman Sachs. All rights reserved.
DISCLAIMER LANGUAGE The Goldman Sachs Dynamo Strategy Index (the "index") is a momentum driven strategy, aiming to capture trends in the market by using historical data over a predefined horizon (e.g. 6months). Despite past simulations, there is no guarantee that the strategy will be able to capture trends effectively, or that the chosen horizon will still be relevant in the future. There is no guarantee that the index will not underperform some or all of the underlying assets. In particular, the index may have a significant weight in one of those assets at the time of asudden drop, or no exposure to one of those underlyings at a time it has a strong performance. Different indices with a different set of underlying assets may significantly outperform the selected index. For parts of the backtesting period, the underlying assets showed in this presentation have had strong performances. Backtested and past performance figures are not a reliable indicator orguarantee of future results. The index is not actively managed and GS does not exercise discretion in constructing, calculating or executing the strategy. For further information and disclosure about the strategy, includingrelevant risk factors, please refer to the related transaction documentation. The index was launched on June 15, 2015. The US Equity Futures Rolling Strategy Index, the US Government Bond Futures Rolling Strategy Index and European Government Bond Futures Rolling Strategy Index (collectively, the“Underlying Indices”) are the exclusive property of Goldman Sachs International, which has contracted with S&P Opco, LLC (a subsidiary of S&P Dow Jones Indices LLC) (“S&P Dow JonesIndices”) to calculate and maintain the Underlying Indices based on an objective pre-agreed methodology. S&P® is a registered trademark of Standard & Poor’s Financial Services LLC(“SPFS”); Dow Jones® is a registered trademark of Dow Jones Trademark Holdings LLC (“Dow Jones”); and, these trademarks have been licensed to S&P Dow Jones Indices. Neither S&PDow Jones Indices, SPFS, Dow Jones nor any of their affiliates sponsor and promote the Index and none shall be liable for any errors or omissions in calculating the Index. Goldman Sachs International has contracted with STOXX Limited, Zurich, Switzerland (“STOXX”) to maintain and calculate the European Equity Futures Rolling Strategy Index (the “Index”).STOXX and its licensor Dow Jones & Company, Inc., a Delaware corporation, New York, USA, do not have any legal obligations towards the purchasers of the financial product linked to theEuropean Equity Futures Rolling Strategy Index (“Financial Product”) and cannot be held liable for any losses or damages which relate to investments in the Financial Product. Purchasers ofthe Financial Product are made aware and accept that index calculations are based on large quantities of data provided by third parties and are thus susceptible to errors and delays. This mayresult in errors and delays in the Index which may have an impact on the Financial Product. iShares is a registered trademark of BlackRock Institutional Trust Company, N.A. (“BITC”). The index is not sponsored, endorsed, sold, or promoted by BITC. BITC makes no representations orwarranties to the owners of the index or any member of the public regarding the advisability of investing in the index. BITC has no obligation or liability in connection with the operation,marketing, trading or sale of the index. Source: FTSE International Limited (“FTSE”) © FTSE 2015. FTSE® is a trade mark of London Stock Exchange Plc and The Financial Times Limited and is used by FTSE under licence. Allrights in the FTSE indices and / or FTSE ratings vest in FTSE and/or its licensors. Neither FTSE nor its licensors accept any liability for any errors or omissions in the FTSE indices and / orFTSE ratings or underlying data. No further distribution of FTSE Data is permitted without FTSE’s express written consent. Enhanced Strategy E142 is derived and calculated based on the S&P GSCI Index under license from S&P Dow Jones Indices LLC (“S&P”). The Enhanced StrategyE142 and/or the GoldmanSachs Dynamo Strategy Index is not sponsored, endorsed, sold or promoted by S&P, its affiliates or its third party licensors. S&P and its affiliates shall have no liability for any errors oromissions in the Enhanced Strategy E142.
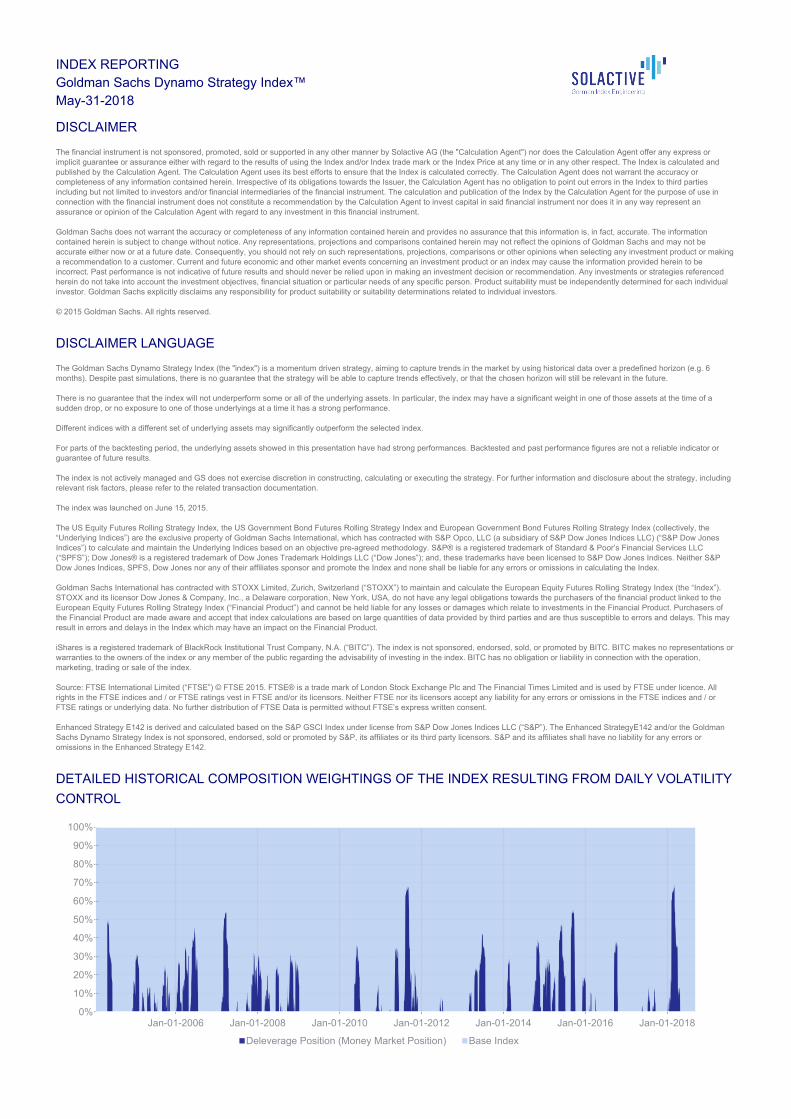
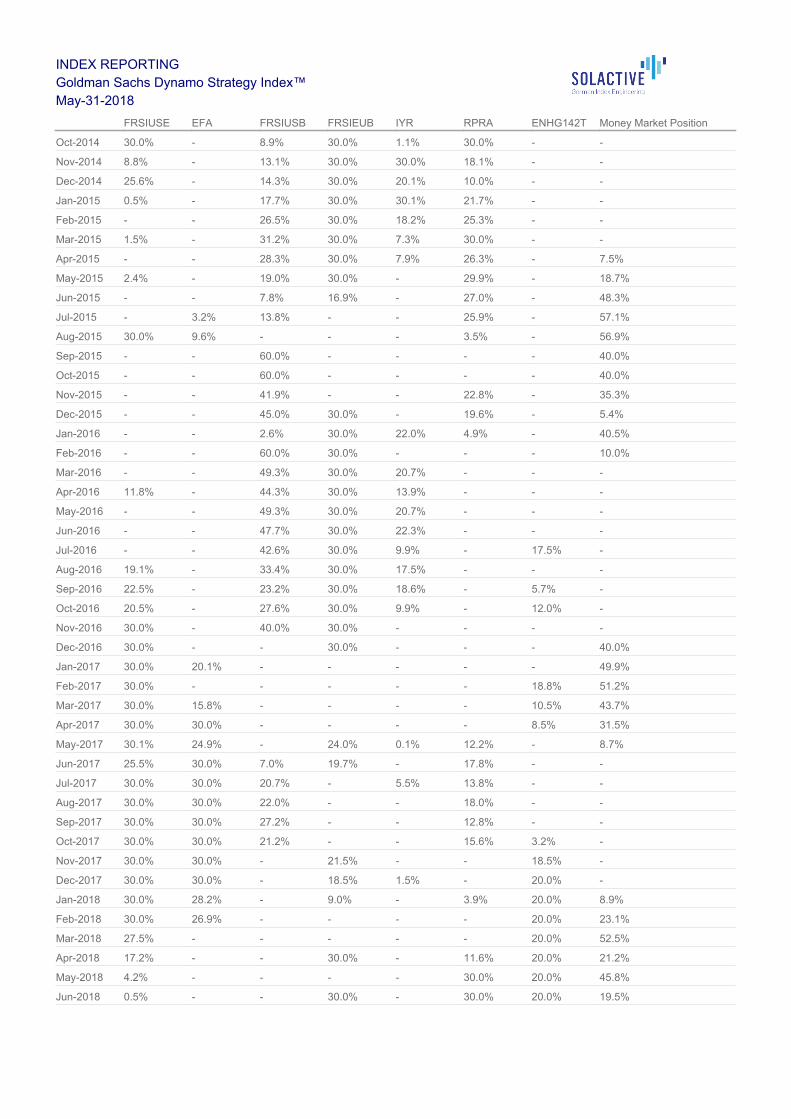
DETAILED HISTORICAL COMPOSITION WEIGHTINGS OF THE INDEX RESULTING FROM DAILY VOLATILITY
CONTROL
INDEX REPORTINGGoldman Sachs Dynamo Strategy Index™May-31-2018
Deleverage Position (Money Market Position) Base Index
Jan-01-2006 Jan-01-2008 Jan-01-2010 Jan-01-2012 Jan-01-2014 Jan-01-2016 Jan-01-20180%
10%
20%
30%
40%
50%
60%
70%
80%
90%
100%
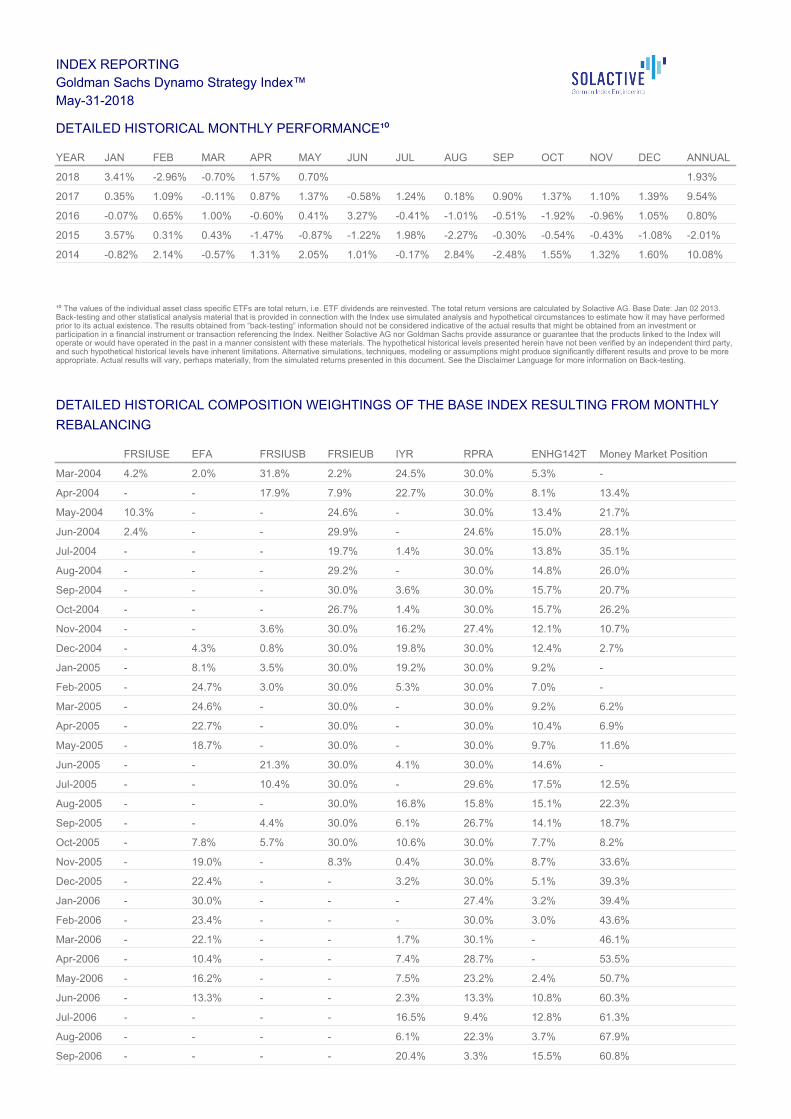
DETAILED HISTORICAL MONTHLY PERFORMANCE¹⁰
¹⁰ The values of the individual asset class specific ETFs are total return, i.e. ETF dividends are reinvested. The total return versions are calculated by Solactive AG. Base Date: Jan 02 2013.Back-testing and other statistical analysis material that is provided in connection with the Index use simulated analysis and hypothetical circumstances to estimate how it may have performedprior to its actual existence. The results obtained from “back-testing” information should not be considered indicative of the actual results that might be obtained from an investment orparticipation in a financial instrument or transaction referencing the Index. Neither Solactive AG nor Goldman Sachs provide assurance or guarantee that the products linked to the Index willoperate or would have operated in the past in a manner consistent with these materials. The hypothetical historical levels presented herein have not been verified by an independent third party,and such hypothetical historical levels have inherent limitations. Alternative simulations, techniques, modeling or assumptions might produce significantly different results and prove to be moreappropriate. Actual results will vary, perhaps materially, from the simulated returns presented in this document. See the Disclaimer Language for more information on Back-testing.
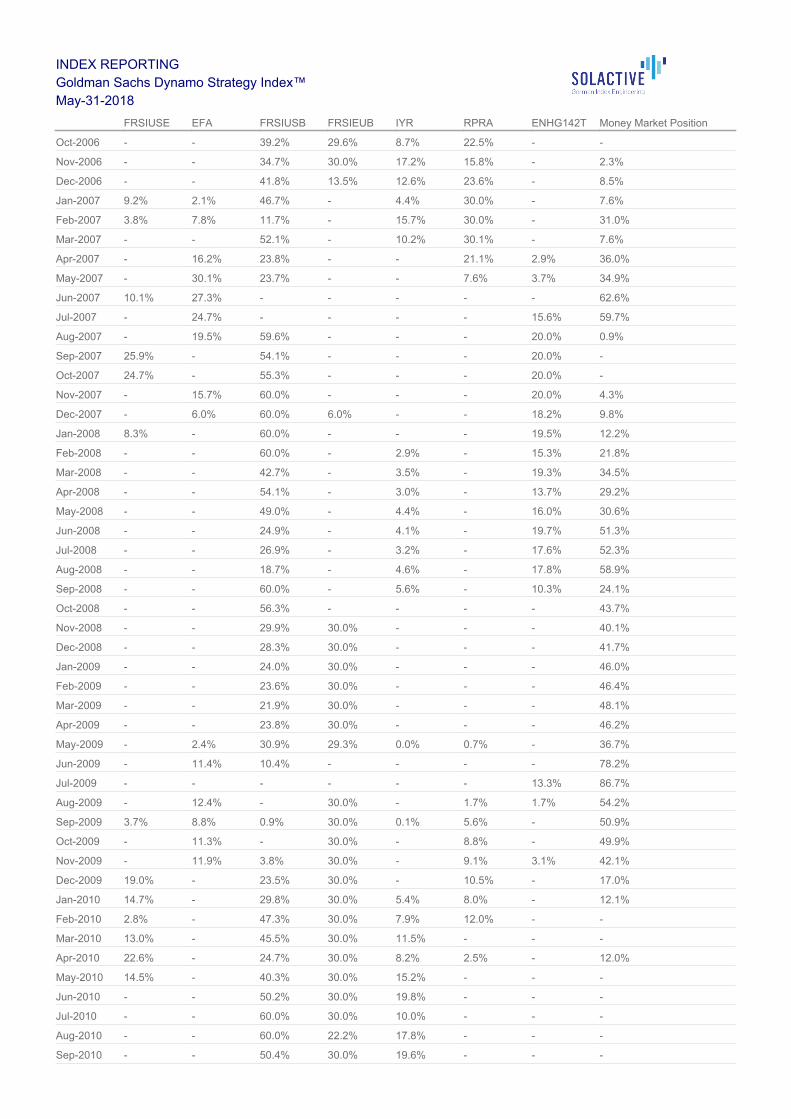
DETAILED HISTORICAL COMPOSITION WEIGHTINGS OF THE BASE INDEX RESULTING FROM MONTHLY
REBALANCING
INDEX REPORTINGGoldman Sachs Dynamo Strategy Index™May-31-2018
YEAR JAN FEB MAR APR MAY JUN JUL AUG SEP OCT NOV DEC ANNUAL
2018 3.41% -2.96% -0.70% 1.57% 0.70% 1.93%
2017 0.35% 1.09% -0.11% 0.87% 1.37% -0.58% 1.24% 0.18% 0.90% 1.37% 1.10% 1.39% 9.54%
2016 -0.07% 0.65% 1.00% -0.60% 0.41% 3.27% -0.41% -1.01% -0.51% -1.92% -0.96% 1.05% 0.80%
2015 3.57% 0.31% 0.43% -1.47% -0.87% -1.22% 1.98% -2.27% -0.30% -0.54% -0.43% -1.08% -2.01%
2014 -0.82% 2.14% -0.57% 1.31% 2.05% 1.01% -0.17% 2.84% -2.48% 1.55% 1.32% 1.60% 10.08%
FRSIUSE EFA FRSIUSB FRSIEUB IYR RPRA ENHG142T Money Market Position
Mar-2004 4.2% 2.0% 31.8% 2.2% 24.5% 30.0% 5.3% -
Apr-2004 - - 17.9% 7.9% 22.7% 30.0% 8.1% 13.4%
May-2004 10.3% - - 24.6% - 30.0% 13.4% 21.7%
Jun-2004 2.4% - - 29.9% - 24.6% 15.0% 28.1%
Jul-2004 - - - 19.7% 1.4% 30.0% 13.8% 35.1%
Aug-2004 - - - 29.2% - 30.0% 14.8% 26.0%
Sep-2004 - - - 30.0% 3.6% 30.0% 15.7% 20.7%
Oct-2004 - - - 26.7% 1.4% 30.0% 15.7% 26.2%
Nov-2004 - - 3.6% 30.0% 16.2% 27.4% 12.1% 10.7%
Dec-2004 - 4.3% 0.8% 30.0% 19.8% 30.0% 12.4% 2.7%
Jan-2005 - 8.1% 3.5% 30.0% 19.2% 30.0% 9.2% -
Feb-2005 - 24.7% 3.0% 30.0% 5.3% 30.0% 7.0% -
Mar-2005 - 24.6% - 30.0% - 30.0% 9.2% 6.2%
Apr-2005 - 22.7% - 30.0% - 30.0% 10.4% 6.9%
May-2005 - 18.7% - 30.0% - 30.0% 9.7% 11.6%
Jun-2005 - - 21.3% 30.0% 4.1% 30.0% 14.6% -
Jul-2005 - - 10.4% 30.0% - 29.6% 17.5% 12.5%
Aug-2005 - - - 30.0% 16.8% 15.8% 15.1% 22.3%
Sep-2005 - - 4.4% 30.0% 6.1% 26.7% 14.1% 18.7%
Oct-2005 - 7.8% 5.7% 30.0% 10.6% 30.0% 7.7% 8.2%
Nov-2005 - 19.0% - 8.3% 0.4% 30.0% 8.7% 33.6%
Dec-2005 - 22.4% - - 3.2% 30.0% 5.1% 39.3%
Jan-2006 - 30.0% - - - 27.4% 3.2% 39.4%
Feb-2006 - 23.4% - - - 30.0% 3.0% 43.6%
Mar-2006 - 22.1% - - 1.7% 30.1% - 46.1%
Apr-2006 - 10.4% - - 7.4% 28.7% - 53.5%
May-2006 - 16.2% - - 7.5% 23.2% 2.4% 50.7%
Jun-2006 - 13.3% - - 2.3% 13.3% 10.8% 60.3%
Jul-2006 - - - - 16.5% 9.4% 12.8% 61.3%
Aug-2006 - - - - 6.1% 22.3% 3.7% 67.9%
Sep-2006 - - - - 20.4% 3.3% 15.5% 60.8%
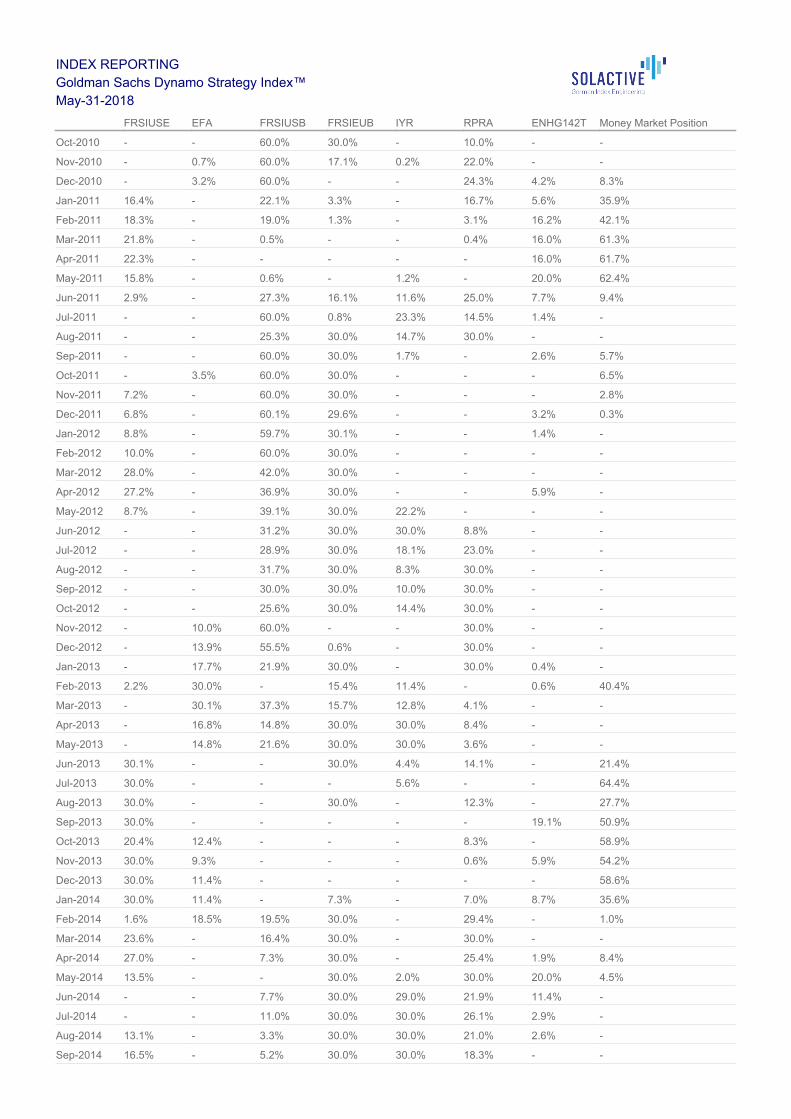
INDEX REPORTINGGoldman Sachs Dynamo Strategy Index™May-31-2018
FRSIUSE EFA FRSIUSB FRSIEUB IYR RPRA ENHG142T Money Market Position
Oct-2006 - - 39.2% 29.6% 8.7% 22.5% - -
Nov-2006 - - 34.7% 30.0% 17.2% 15.8% - 2.3%
Dec-2006 - - 41.8% 13.5% 12.6% 23.6% - 8.5%
Jan-2007 9.2% 2.1% 46.7% - 4.4% 30.0% - 7.6%
Feb-2007 3.8% 7.8% 11.7% - 15.7% 30.0% - 31.0%
Mar-2007 - - 52.1% - 10.2% 30.1% - 7.6%
Apr-2007 - 16.2% 23.8% - - 21.1% 2.9% 36.0%
May-2007 - 30.1% 23.7% - - 7.6% 3.7% 34.9%
Jun-2007 10.1% 27.3% - - - - - 62.6%
Jul-2007 - 24.7% - - - - 15.6% 59.7%
Aug-2007 - 19.5% 59.6% - - - 20.0% 0.9%
Sep-2007 25.9% - 54.1% - - - 20.0% -
Oct-2007 24.7% - 55.3% - - - 20.0% -
Nov-2007 - 15.7% 60.0% - - - 20.0% 4.3%
Dec-2007 - 6.0% 60.0% 6.0% - - 18.2% 9.8%
Jan-2008 8.3% - 60.0% - - - 19.5% 12.2%
Feb-2008 - - 60.0% - 2.9% - 15.3% 21.8%
Mar-2008 - - 42.7% - 3.5% - 19.3% 34.5%
Apr-2008 - - 54.1% - 3.0% - 13.7% 29.2%
May-2008 - - 49.0% - 4.4% - 16.0% 30.6%
Jun-2008 - - 24.9% - 4.1% - 19.7% 51.3%
Jul-2008 - - 26.9% - 3.2% - 17.6% 52.3%
Aug-2008 - - 18.7% - 4.6% - 17.8% 58.9%
Sep-2008 - - 60.0% - 5.6% - 10.3% 24.1%
Oct-2008 - - 56.3% - - - - 43.7%
Nov-2008 - - 29.9% 30.0% - - - 40.1%
Dec-2008 - - 28.3% 30.0% - - - 41.7%
Jan-2009 - - 24.0% 30.0% - - - 46.0%
Feb-2009 - - 23.6% 30.0% - - - 46.4%
Mar-2009 - - 21.9% 30.0% - - - 48.1%
Apr-2009 - - 23.8% 30.0% - - - 46.2%
May-2009 - 2.4% 30.9% 29.3% 0.0% 0.7% - 36.7%
Jun-2009 - 11.4% 10.4% - - - - 78.2%
Jul-2009 - - - - - - 13.3% 86.7%
Aug-2009 - 12.4% - 30.0% - 1.7% 1.7% 54.2%
Sep-2009 3.7% 8.8% 0.9% 30.0% 0.1% 5.6% - 50.9%
Oct-2009 - 11.3% - 30.0% - 8.8% - 49.9%
Nov-2009 - 11.9% 3.8% 30.0% - 9.1% 3.1% 42.1%
Dec-2009 19.0% - 23.5% 30.0% - 10.5% - 17.0%
Jan-2010 14.7% - 29.8% 30.0% 5.4% 8.0% - 12.1%
Feb-2010 2.8% - 47.3% 30.0% 7.9% 12.0% - -
Mar-2010 13.0% - 45.5% 30.0% 11.5% - - -
Apr-2010 22.6% - 24.7% 30.0% 8.2% 2.5% - 12.0%
May-2010 14.5% - 40.3% 30.0% 15.2% - - -
Jun-2010 - - 50.2% 30.0% 19.8% - - -
Jul-2010 - - 60.0% 30.0% 10.0% - - -
Aug-2010 - - 60.0% 22.2% 17.8% - - -
Sep-2010 - - 50.4% 30.0% 19.6% - - -
INDEX REPORTINGGoldman Sachs Dynamo Strategy Index™May-31-2018
FRSIUSE EFA FRSIUSB FRSIEUB IYR RPRA ENHG142T Money Market Position
Oct-2010 - - 60.0% 30.0% - 10.0% - -
Nov-2010 - 0.7% 60.0% 17.1% 0.2% 22.0% - -
Dec-2010 - 3.2% 60.0% - - 24.3% 4.2% 8.3%
Jan-2011 16.4% - 22.1% 3.3% - 16.7% 5.6% 35.9%
Feb-2011 18.3% - 19.0% 1.3% - 3.1% 16.2% 42.1%
Mar-2011 21.8% - 0.5% - - 0.4% 16.0% 61.3%
Apr-2011 22.3% - - - - - 16.0% 61.7%
May-2011 15.8% - 0.6% - 1.2% - 20.0% 62.4%
Jun-2011 2.9% - 27.3% 16.1% 11.6% 25.0% 7.7% 9.4%
Jul-2011 - - 60.0% 0.8% 23.3% 14.5% 1.4% -
Aug-2011 - - 25.3% 30.0% 14.7% 30.0% - -
Sep-2011 - - 60.0% 30.0% 1.7% - 2.6% 5.7%
Oct-2011 - 3.5% 60.0% 30.0% - - - 6.5%
Nov-2011 7.2% - 60.0% 30.0% - - - 2.8%
Dec-2011 6.8% - 60.1% 29.6% - - 3.2% 0.3%
Jan-2012 8.8% - 59.7% 30.1% - - 1.4% -
Feb-2012 10.0% - 60.0% 30.0% - - - -
Mar-2012 28.0% - 42.0% 30.0% - - - -
Apr-2012 27.2% - 36.9% 30.0% - - 5.9% -
May-2012 8.7% - 39.1% 30.0% 22.2% - - -
Jun-2012 - - 31.2% 30.0% 30.0% 8.8% - -
Jul-2012 - - 28.9% 30.0% 18.1% 23.0% - -
Aug-2012 - - 31.7% 30.0% 8.3% 30.0% - -
Sep-2012 - - 30.0% 30.0% 10.0% 30.0% - -
Oct-2012 - - 25.6% 30.0% 14.4% 30.0% - -
Nov-2012 - 10.0% 60.0% - - 30.0% - -
Dec-2012 - 13.9% 55.5% 0.6% - 30.0% - -
Jan-2013 - 17.7% 21.9% 30.0% - 30.0% 0.4% -
Feb-2013 2.2% 30.0% - 15.4% 11.4% - 0.6% 40.4%
Mar-2013 - 30.1% 37.3% 15.7% 12.8% 4.1% - -
Apr-2013 - 16.8% 14.8% 30.0% 30.0% 8.4% - -
May-2013 - 14.8% 21.6% 30.0% 30.0% 3.6% - -
Jun-2013 30.1% - - 30.0% 4.4% 14.1% - 21.4%
Jul-2013 30.0% - - - 5.6% - - 64.4%
Aug-2013 30.0% - - 30.0% - 12.3% - 27.7%
Sep-2013 30.0% - - - - - 19.1% 50.9%
Oct-2013 20.4% 12.4% - - - 8.3% - 58.9%
Nov-2013 30.0% 9.3% - - - 0.6% 5.9% 54.2%
Dec-2013 30.0% 11.4% - - - - - 58.6%
Jan-2014 30.0% 11.4% - 7.3% - 7.0% 8.7% 35.6%
Feb-2014 1.6% 18.5% 19.5% 30.0% - 29.4% - 1.0%
Mar-2014 23.6% - 16.4% 30.0% - 30.0% - -
Apr-2014 27.0% - 7.3% 30.0% - 25.4% 1.9% 8.4%
May-2014 13.5% - - 30.0% 2.0% 30.0% 20.0% 4.5%
Jun-2014 - - 7.7% 30.0% 29.0% 21.9% 11.4% -
Jul-2014 - - 11.0% 30.0% 30.0% 26.1% 2.9% -
Aug-2014 13.1% - 3.3% 30.0% 30.0% 21.0% 2.6% -
Sep-2014 16.5% - 5.2% 30.0% 30.0% 18.3% - -
INDEX REPORTINGGoldman Sachs Dynamo Strategy Index™May-31-2018
FRSIUSE EFA FRSIUSB FRSIEUB IYR RPRA ENHG142T Money Market Position
Oct-2014 30.0% - 8.9% 30.0% 1.1% 30.0% - -
Nov-2014 8.8% - 13.1% 30.0% 30.0% 18.1% - -
Dec-2014 25.6% - 14.3% 30.0% 20.1% 10.0% - -
Jan-2015 0.5% - 17.7% 30.0% 30.1% 21.7% - -
Feb-2015 - - 26.5% 30.0% 18.2% 25.3% - -
Mar-2015 1.5% - 31.2% 30.0% 7.3% 30.0% - -
Apr-2015 - - 28.3% 30.0% 7.9% 26.3% - 7.5%
May-2015 2.4% - 19.0% 30.0% - 29.9% - 18.7%
Jun-2015 - - 7.8% 16.9% - 27.0% - 48.3%
Jul-2015 - 3.2% 13.8% - - 25.9% - 57.1%
Aug-2015 30.0% 9.6% - - - 3.5% - 56.9%
Sep-2015 - - 60.0% - - - - 40.0%
Oct-2015 - - 60.0% - - - - 40.0%
Nov-2015 - - 41.9% - - 22.8% - 35.3%
Dec-2015 - - 45.0% 30.0% - 19.6% - 5.4%
Jan-2016 - - 2.6% 30.0% 22.0% 4.9% - 40.5%
Feb-2016 - - 60.0% 30.0% - - - 10.0%
Mar-2016 - - 49.3% 30.0% 20.7% - - -
Apr-2016 11.8% - 44.3% 30.0% 13.9% - - -
May-2016 - - 49.3% 30.0% 20.7% - - -
Jun-2016 - - 47.7% 30.0% 22.3% - - -
Jul-2016 - - 42.6% 30.0% 9.9% - 17.5% -
Aug-2016 19.1% - 33.4% 30.0% 17.5% - - -
Sep-2016 22.5% - 23.2% 30.0% 18.6% - 5.7% -
Oct-2016 20.5% - 27.6% 30.0% 9.9% - 12.0% -
Nov-2016 30.0% - 40.0% 30.0% - - - -
Dec-2016 30.0% - - 30.0% - - - 40.0%
Jan-2017 30.0% 20.1% - - - - - 49.9%
Feb-2017 30.0% - - - - - 18.8% 51.2%
Mar-2017 30.0% 15.8% - - - - 10.5% 43.7%
Apr-2017 30.0% 30.0% - - - - 8.5% 31.5%
May-2017 30.1% 24.9% - 24.0% 0.1% 12.2% - 8.7%
Jun-2017 25.5% 30.0% 7.0% 19.7% - 17.8% - -
Jul-2017 30.0% 30.0% 20.7% - 5.5% 13.8% - -
Aug-2017 30.0% 30.0% 22.0% - - 18.0% - -
Sep-2017 30.0% 30.0% 27.2% - - 12.8% - -
Oct-2017 30.0% 30.0% 21.2% - - 15.6% 3.2% -
Nov-2017 30.0% 30.0% - 21.5% - - 18.5% -
Dec-2017 30.0% 30.0% - 18.5% 1.5% - 20.0% -
Jan-2018 30.0% 28.2% - 9.0% - 3.9% 20.0% 8.9%
Feb-2018 30.0% 26.9% - - - - 20.0% 23.1%
Mar-2018 27.5% - - - - - 20.0% 52.5%
Apr-2018 17.2% - - 30.0% - 11.6% 20.0% 21.2%
May-2018 4.2% - - - - 30.0% 20.0% 45.8%
Jun-2018 0.5% - - 30.0% - 30.0% 20.0% 19.5%