goldman sachs north american shale revolution & energy ... · pdf filegoldman sachs north...
TRANSCRIPT

Goldman Sachs North American Shale Revolution & Energy Infrastructure Portfolio
For Professional Investors Only - Not For Distribution To The General Public

1
US Energy Highlights
1,2,3Source: BP Statistical Review of World Energy June 2014 reflects full year 2013 levels; 4Source: EIA; 5Source: LYB Investor presentation; 6Source: EIA 7Source: Ponderosa Advisors LLC and IEA 8Source: Petroleum Economist; 9Source: Bloomberg and Wood Mackenzie;10Source: HIS. The economic and market forecasts presented herein are for informational purposes as of the date of this presentation. There can be no assurance that the forecasts will be achieved. Please see additional disclosures at the end of this presentation.
Current Forecast
Energy Production
– Largest producer of energy in the world (crude oil, natural gas and NGLs)1
– Largest producer of natural gas in the world (2013: 66.5 vs. 58.5 Bcf/d from Russia; US represents ~20% of global production)2
– 3rd largest liquids producer (after Saudi Arabia and Russia), but fastest growing (from 2010-2013 US production growth of 33%; Saudi Arabia 14%; Russia 4%)3
– From 2013 to 2025:
– Natural Gas production to increase 31%
– Liquids production to increase over 140%
– US expected to become largest crude oil producer in the world by 20157
Energy Usage – LPG exports have increased 152.1% and petroleum products exports have increased 36.1% from 2010-20134
– US became a net exporter of petroleum product in 2011 for the first time since 1949 and of LPGs in 2012
– US has a significant cost advantage in manufacturing, petrochemicals, agriculture, and refining through cheap feedstock (i.e. cost of ethylene production in the US is ~1/4th the price in Europe)5
– US to begin exporting LNG by 2016; by 2019 exports to be at 11.4 Bcf/d making the US the 2nd largest LNG exporter8
– US ethylene production capacity to increase by ~40% by 2018 (additional 11.6 MM metric tons per year of production capacity over 2013 levels)9
Infrastructure Spending
– Ongoing projects throughout the US
– $1.2 trillion expected energy infrastructure spending from 2014-202510

2
Key Potential Beneficiaries of US Shale Revolution Comprised of Energy Producers, Energy Infrastructure, and Energy Users
Increasing Production
Increasing Cash Flows & Spending
Increasing Consumption of US Energy
Commercial / Consumer Refining (Oil) Utilities Petro chemical & Fertilizer
Energy Users (Downstream)
Energy Production (Upstream)
Exploration Drilling
Energy Infrastructure (Midstream)
Transportation (pipeline) Storage Processing (Nat Gas)

3
Key Objectives
Seeks to capture the benefits of the North American Energy Shale Revolution
Invest in key beneficiaries – Energy Producers (Upstream), Energy Infrastructure (Midstream), and Energy Users (Downstream)
Emphasize energy infrastructure since more driven by volume than commodity pricing and unique attributes of yield + growth, interest rate and inflation resiliency, and low correlations to traditional asset classes
Seeks to capture the benefits in a more tax sensitive way for offshore investors versus more conventional ways
Seeks a total return approach comprised of yield + growth, with an emphasis on the latter
Note: There is no guarantee that these objectives will be met.

4
Why Now?
Strong fundamentals with robust growth expected across…
– Energy production
– Energy usage (of US produced energy)
– Energy infrastructure spending
Reasonable Valuations
– And, cheap relative to fixed income

5
US Energy Production Three catalysts for a US Shale Revolution that may make North American Energy Independence a reality
Abundant resources1
Domestic Capabilities
1Source of Map Data: Energy Information Administration based on data from various published studies. Green shading represents the approximate location of the current US shale plays, while all shaded areas represent US basins. Basins are geographic features that may or may not contain shale.
Technological Advances
Horizontal Fracking
3D Seismic Imaging
Rotary Steerable Drilling
Infrastructure
Expertise
Property Rights
Water
Bakken Shale Eagle Ford Shale Marcellus Shale Permian Basin

6
Marcellus Shale
Potential Years of Drilling:
1001
Bakken Shale
Potential Years of Drilling:
351
Permian Basin
Potential Years of Drilling: Not Available
Eagle Ford Shale
Potential Years of Drilling:
451
BAKKEN
BARNETT
PERMIAN EAGLE FORD
MARCELLUS
Barnett Shale
Potential Years of Drilling:
301
1Source: Enterprise Product Partners L.P., December 10, 2013 This information discusses general market activity, industry or sector trends, or other broad-based economic, market or political conditions and should not be construed as research or investment advice. Please see additional disclosures.
US Energy Production This has led to new and emerging Shale plays

7
Projected US resources suggests the Energy Revolution is in its early stages
Recoverable Shale Gas Resources (Trillion Cubic Feet)
Recoverable Shale Oil Resources (Billion Barrels)
1 US 1,161 1 Russia 75
2 China 1,115 2 US 48
3 Argentina 802 3 China 32
4 Algeria 707 4 Argentina 27
5 Canada 573 5 Libya 26
6 Mexico 545 6 Australia 18
7 Australia 437 7 Venezuela 13
8 South Africa 390 8 Mexico 13
9 Russia 285 9 Pakistan 9
10 Brazil 245 10 Canada 9
11 Others 1535 11 Others 65
TOTAL 7,795 TOTAL 335
Source: EIA/ARI World Shale Gas and Shale Oil Resource Assessment, Advanced Resources International, Inc., June 2013.
US Energy Production Potential Recoverable Resources (Technologically & Economically Feasible to Extract)

8
0
2,000
4,000
6,000
8,000
10,000
12,000
14,000
16,000
1918 1930 1942 1954 1966 1978 1990 2002 2014
mill
ion
b/d
US Energy Production
Source: International Energy Agency, Goldman Sachs Global ECS Research, and GSAM as of 8/30/2013. The economic and market forecasts presented herein are based on proprietary models for informational purposes as of the date of this presentation. There can be no assurance that the forecasts will be achieved. Please see additional disclosures at the end of this presentation.
Expansion of Shale Oil and Natural Gas Liquids Production…
US Production vs. Saudi Arabia (Millions Barrels of Oil per Day, based on predictions by the International Energy Agency)
Rapid Growth Expected – North America may become the largest oil producer in the World, overtaking Saudi Arabia next year
Shale Natural gas liquids Biofuels Traditional oil well

9
Key driver today
– US is shifting towards consuming more US produced energy and importing less
Key drivers in future
– Greater ability to export US produced energy (including dry natural gas through liquefied natural gas (LNG))
– Petro chemical, agriculture, and manufacturing companies ramping up capacity in US to exploit low cost advantage
US Energy Usage (Consumption) Growth expected for several reasons
Oil: Domestic vs. Imported (each barrel represents 10%)
Source: US Energy Information Administration, 2012. Based on estimates from the US Energy Information Administration.
Past (2006)
2012
Potential Future
Domestic Imported

10
US Energy Infrastructure Spending IHS Forecasts nearly $1 Trillion Cumulative Spending from 2014 to 2025
Source: IHS Global Inc. IHS estimated three different scenarios and the chart above applies to their “base case” . “Oil and Natural Gas Transportation and Storage Infrastructure: Status, Trends, and Economic Benefits; December 2013; The economic and market forecasts presented herein are for informational purposes as of the date of this presentation. There can be no assurance that the forecasts will be achieved. Please see additional disclosures at the end of this presentation.
Cumulative Direct Capital Investments

11
0.5 0.4 0.3
0.1
-0.4 -0.6
-0.4
-0.2
0
0.2
0.4
0.6
0.8
1
S&P 500 Crude Oil IG US Bonds Natural Gas US Treasury
Invest in all key beneficiaries of the US Shale Revolution, but with an emphasis on Energy Infrastructure
The portfolio risk management process includes an effort to monitor and manage risk, but does not imply low risk. ¹Source: FactSet, Alerian, GSAM, Data as of June 30, 2014. Correlations are calculated from monthly returns. Energy Infrastructure Universe defined as the Alerian MLP index. IG US Bonds defined as the Barclays US Aggregate Credit-Corporate-Investment Grade. Crude Oil defined as DJ UBS Crude Oil Index. Natural Gas defined as DJ UBS Natural Gas Index. US Treasury defined as BofA Merrill Lynch US Treasuries (10Y) Past correlations are not indicative of future correlations, which may vary.
Attractive yield tied to predictable cash flows – Fee based, long-term contracts with fee escalations – High barriers to entry
Attractive, secular growth – More driven by volume (production and usage trends) than commodity pricing
Historically has provided interest rate and inflation protection Low correlations to traditional asset classes
Correlations of Returns to the Energy Infrastructure Universe¹

12
Favorable Valuations Relative to Fixed Income
Energy Beneficiaries vs. High Yield Bonds (on yield spread basis)
Source: Factset. GSAM Energy Beneficiaries Universe (Weighted Average Dividend Yield) versus Barclays High Yield Index as of June 24, 2014. The Barclays U.S. Corporate High Yield Bond Index is a market value-weighted index which covers the U.S. non-investment grade fixed-rate debt market. Please see appendix for full list of index definitions Past performance does not guarantee future results, which may vary
1.5%
6.4%
0%
2%
4%
6%
8%
10%
12%
14%
16%
18%
20%
1996 1997 1998 1999 2000 2001 2002 2003 2004 2005 2006 2007 2008 2009 2010 2011 2012 2013 2014
Barclays High Yield Index - Energy Beneficiaries Universe Market Cap Weighted Average Yield (Spread) Average
Expensive
Cheap

13
Why GSAM?
Unique investment team & platform covering the full energy value chain
– 6 person dedicated Energy Infrastructure team that operates like a boutique
– 10 additional GSAM Fundamental Equity PMs covering Energy Producers and Users
– Strong trading & risk management resources
Proven franchise and track record
– GSAM is one of the largest managers in the Energy Infrastructure industry with over $12B AUM1
– History of alpha generation going back over 4 years2
Differentiated approach (especially vs. Energy Sector or Global Infrastructure Funds)
– Seeks to capture the benefits of the North American Energy Shale Revolution across all major beneficiaries
– Capture and emphasize Energy Infrastructure since it’s more driven by volume than commodity pricing and unique attributes of yield + growth, interest rate and inflation resiliency, and low correlations
– Seeks to capture the benefits in a more tax sensitive way for offshore investors versus more conventional ways
– A total return approach comprised of yield + growth, with an emphasis on the latter
– Different than energy sector funds that are mostly global and upstream/downstream focused and/or global infrastructure funds that are mostly global and non-energy related
Note: Goldman Sachs does not provide accounting, tax or legal advice. 1eVestment Alliance Database as of June 30, 2014. Past performance does not guarantee future results, which may vary. 2Refers to the first strategy launched by the GSAM Energy & Infrastructure team, the GSAM Master Limited Partnership strategy. Inception Date: November 1, 2009; Please see additional disclosures at the end of this presentation.

14
Investment Team and Platform We Believe Our Team and Structure Presents a Research Advantage Unique to the Industry – Leveraging a Team of 16 Investors that Span the Full Energy Value Chain
1 As of June 30, 2014.
Energy Infrastructure (Midstream)
Energy Producers (Upstream)
Energy Users (Downstream)
6 Energy Infrastructure dedicated professionals1
Lead PMs average over 10 years of industry experience
Led by Kyri Loupis, an early innovator in both MLP investment banking and investing
Leverage additional 5 Equity PMs covering “producers” of energy
Leverage additional 5 Equity PMs covering “users” of energy
Risk Management
Multiple levels of risk management, including Divisional and Firmwide Independent Risk Oversight

15
Investment Process A Unique Investment Approach Premised on Our Competitive Advantages
Note: For illustrative purpose only.
2. Establish Implications for Energy Infrastructure
Top Down Sector Selection
Product & Commodity Exposure
(Oil, Gas, NGL)
Functional Exposure
(Pipelines, Processing, Storage)
Regional Exposure
1. Evaluate Overall Energy Trends
Macro Trend Analysis Energy Production Trends Energy Usage Trends
3. Identify Specific Names for Investment
Bottom-Up Security Selection
Management
Capital allocation
Operational aptitude
Incentives
Balance Sheet
Overall leverage
Complexion of debt
GP ownership
Technicals
Liquidity
Float
Shareholder base
Return Expectations/ Valuation
Expected yield
Expected total return
EV/EBITDA

16
Portfolio Characteristics
Top 10 Holdings by Weight
Source: GSAM, Bloomberg as of June 30, 2014. *1 year expected distribution (dividend) growth reflects growth in distributions of Bloomberg consensus Q4 2014 distribution over actual Q4 2013 distribution paid; 2Yr distribution growth reflects annualized growth in distributions in Bloomberg consensus Q4 2015 distribution over actual Q4 2013 distribution paid.
Portfolio Attributes
Gross Yield 4.1%
Number of Positions 41
% of Assets in Top-10 Holdings 41.5%
Median Market Capitalization $10.1 billion
Weighted Avg. Market Cap $41.9 billion
Energy Infrastructure
57%
Energy Diversified
21%
Energy Users 15%
Energy Producers
7%
Company Weight Market Cap ($mm) Yield (%)
1Y Distribution
Growth*
2Y Distribution
Growth* Function
Williams Companies 6.43% 43,482 3.85 24% 21% Infrastructure
ONEOK 5.48% 14,152 3.29 60% 32% Infrastructure
Spectra Energy Corp 5.44% 28,491 3.15 18% NA Infrastructure
Crescent Point Energy 4.29% 19,859 5.83 7% 3% Producers
Targa Resources Corp 3.47% 5,884 1.86 35% 28% Infrastructure
Teekay Offshore Partners L.P. 3.40% 3,085 5.97 7% 5% Infrastructure
Golar LNG Partners LP 3.27% 2,305 5.67 4% 5% Infrastructure
Pembina Pipeline Corp 3.26% 14,681 3.79 18% 9% Infrastructure
Seadrill Partners LLC 3.23% 2,780 6.12 25% 22% Infrastructure
NiSource 3.23% 12,387 2.64 4% NA Diversified

17
Case Study: Natural Gas Pipeline Owner
As of June 30, 2014. ¹Source: FactSet. For illustrative purposes only. There can be no assurance that the same or similar results to those presented above can or will be achieved. The economic and market forecasts presented herein are for informational purposes as of the date of this presentation. There can be no assurance that the forecasts will be achieved. Past performance does not guarantee future results, which may vary. Please see additional disclosures at the end of this presentation.
Owns one of the longest natural gas pipeline in North America, running from the Gulf Coast to New York
>20% annual dividend growth expected over the next two years.
Dividend yield (June 30, 2014): 3.9%.
100
105
110
115
120
125
130
135
Jul-13 Oct-13 Jan-14 Apr-14
Pric
e in
USD
, reb
ased
to 1
00¹
Security
$0.49
$0.78
$1.20
$1.44
$1.75
$2.11
$0.00
$0.50
$1.00
$1.50
$2.00
$2.50
2010 2011 2012 2013 2014 2015
Cas
h D
ivid
ends
Per
Sha
re²
Actual Expected
Large-scale strategic positions

18
Case Study: Diversified Natural Gas Company
As of June 30, 2014. 1Source: FactSet. For illustrative purposes only. There can be no assurance that the same or similar results to those presented above can or will be achieved. The economic and market forecasts presented herein are for informational purposes as of the date of this presentation. There can be no assurance that the forecasts will be achieved. Past performance does not guarantee future results, which may vary. Please see additional disclosures at the end of this presentation.
Transmits, stores, distributes, gathers and processes natural gas for customers throughout North America.
18% annual dividend growth expected in 2014.
Dividend yield (June 30, 2014): 3.2%.
Impressive asset footprint with significant investment
opportunities
90
95
100
105
110
115
120
Jul-13 Oct-13 Jan-14 Apr-14Pric
e in
USD
, reb
ased
to 1
00¹ Security
In Service
In Execution
Advanced Development
On The Horizon
~$6B
~$7B
~$9B
~$13B+
$35 billion of growth projects over the next decade
$35B+

19
Key Risks
Note: Goldman Sachs does not provide accounting, tax or legal advice.
Meaningful drop in commodity prices which may reduce production level
– Could have a negative impact on energy infrastructure cash flow generation
Regulatory
– Increased regulations and costs due to environmental concerns
Deterioration of the financing environment
– Many energy beneficiary companies depend on the capital markets in order to finance their growth
Sharply rising interest rates
– May impact the cost of capital negatively, but assuming rates go up gradually and for the right reason (economic growth), growth could compensate
Appendix A: Appendix
21
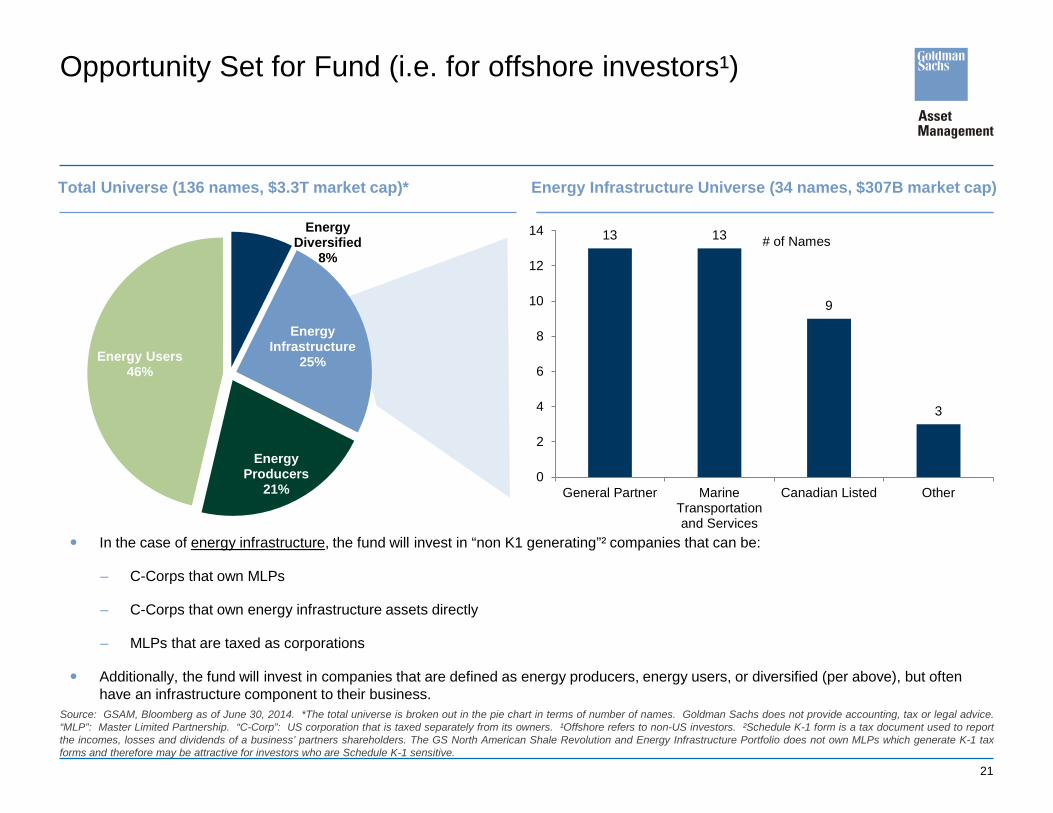
Opportunity Set for Fund (i.e. for offshore investors¹)
Total Universe (136 names, $3.3T market cap)*
In the case of energy infrastructure, the fund will invest in “non K1 generating”² companies that can be:
– C-Corps that own MLPs
– C-Corps that own energy infrastructure assets directly
– MLPs that are taxed as corporations
Additionally, the fund will invest in companies that are defined as energy producers, energy users, or diversified (per above), but often have an infrastructure component to their business.
Source: GSAM, Bloomberg as of June 30, 2014. *The total universe is broken out in the pie chart in terms of number of names. Goldman Sachs does not provide accounting, tax or legal advice. “MLP”: Master Limited Partnership. “C-Corp”: US corporation that is taxed separately from its owners. ¹Offshore refers to non-US investors. ²Schedule K-1 form is a tax document used to report the incomes, losses and dividends of a business’ partners shareholders. The GS North American Shale Revolution and Energy Infrastructure Portfolio does not own MLPs which generate K-1 tax forms and therefore may be attractive for investors who are Schedule K-1 sensitive.
13 13
9
3
0
2
4
6
8
10
12
14
General Partner MarineTransportationand Services
Canadian Listed Other
# of Names
Energy Infrastructure Universe (34 names, $307B market cap)
Energy Diversified
8%
Energy Infrastructure
25%
Energy Producers
21%
Energy Users 46%

22
Characteristic MLP (US investor eligible) C-Corp GPs (offshore investor eligible)
Entity Level Tax No Yes
Tax Items Flow Through Yes No
Tax Deferred Distributions to Investors Yes No, unless reported as return of capital
Tax Reporting Schedule K-1 Form 1099-DIV
Has a General Partner? Yes No
IDRs Yes No
Investor Voting Rights Limited Yes
Source: GSAM
Incentive Distribution Rights (IDRs) – IDRs are a share of cash distributions that flow from the Master Limited Partnership (MLP) to the General Partner (GP)
– As the underlying MLP grows, the GPs take of underlying cash flow also grows often starting at 2% to GP (vs. 98% to LPs) and eventually maxes out at 50%
– This is why GPs tend to offer better cost of capital and stronger growth than MLPs
Energy Infrastructure: US investor eligible vs. offshore investor eligible universes Key differentiating features between MLPs vs C-Corp GPs

23
Source: GSAM, Bloomberg, as of 31-Mar-14. ¹Refers to the Alerian MLP Index. ²Refers to the “Energy Infrastructure” segment of the Energy Beneficiaries Universe, i.e. the full opportunity set for the GS North American Shale Revolution & Energy Infrastructure Portfolio. Market cap weighted total return is based upon current market cap weightings and historical total return; Alerian Data based upon 3/21/14 rebalance; Energy Infrastructure Universe correlation and volatility reflects the market cap weighted daily returns; Sharpe Ratios are calculated using average daily returns over the time period shown and are then annualized; the risk free rate is based upon the yield of on-the-run U.S. 3 month treasury bills.
US Investor Eligible¹ Offshore Eligible²
# Names 50 34
Total Market Cap ($bn) $377.4 $307.3
Average Market Cap ($bn) $7.5 $9.0
Correlation - 1 Yr Rolling (Avg 12/31/09-3/1/14) 78.3%
Market Cap Weighted Average Yield 5.81% 4.12%
Return - 1 Yr Ann (Mkt Cap Weighted) 8.5% 19.8%
Return - 3 Yr Ann (Mkt Cap Weighted) 13.5% 24.0%
Return - 5 Yr Ann (Mkt Cap Weighted) 27.3% 38.8%
Volatility - 3-Month, Ann (Avg 9/1/06-3/31/14) 17.4% 20.1%
Sharpe Ratio - 1 Yr 0.3 1.4
Sharpe Ratio - 3 Yr 0.5 1.3
Sharpe Ratio - 5 Yr 1.3 2.0
Energy Infrastructure: US investor eligible vs. offshore investor eligible universes Very similar results & characteristics but with offshore eligible universe showing a history of better growth

24
0.3%
2.0%
-2%
0%
2%
4%
6%
8%
10%
12%
1996 1997 1998 1999 2000 2001 2002 2003 2004 2005 2006 2007 2008 2009 2010 2011 2012 2013 2014
Wilshire Index - Energy Beneficiaries Universe Market Cap Weighted Average Yield (Spread) Average
Favorable Valuations Relative to Defensive Equities
Source: Factset. GSAM Energy Beneficiaries Universe (Weighted Average Dividend Yield) versus Wilshire US REIT Index (Weighted Average Dividend Yield) as of June 24, 2014. The Wilshire US REIT Index measures U.S. publicly traded Real Estate Investment Trusts. Past performance does not guarantee future results, which may vary
Expensive
Cheap
Energy Beneficiaries vs. US REITs (on yield spread basis)

25
1.8 2.4
-3
-2
-1
0
1
2
3
4
5
6
7
8
1996 1997 1998 1999 2000 2001 2002 2003 2004 2005 2006 2007 2008 2009 2010 2011 2012 2013 2014
S&P 500 Index - Energy Beneficiaries Universe Market Cap Weighted Average EV/EBITDA Multiple (Spread) Average
Expensive Relative to Equities, especially Cyclical Equities
Source: Factset. GSAM Energy Beneficiaries Universe (Weighted Average Dividend Yield) versus S&P 500 Index (EV/EBITDA Multiple) as of June 24, 2014. The S&P 500 Index is the Standard & Poor’s 500 Composite Index of 500 stocks, an unmanaged index of common stock prices. The Index is unmanaged and the figures for the Index do not include any deduction for fees, expenses or taxes. It is not possible to invest directly in an unmanaged index. Past performance does not guarantee future results, which may vary
Cheap
Expensive
Energy Beneficiaries vs S&P500 (on EV/EBITDA multiple spread basis)

26
Technology Has Helped Unearth New Energy Opportunities
Technological Advances Have Resulted in Greater Access and Efficient Drilling
Source: What is Fracking, Energy from Shale (www.energyfromshale.org), January 2014.

27
Protecting the Environment During Hydraulic Fracturing
Source: What is Fracking, Energy from Shale (www.energyfromshale.org), January 2014.

28
US Energy Production Production Growth Forecasts
Crude Oil
Source: Ponderosa Advisors LLC. Assumes September 2013 rig count, constant IP’s, technology & geographic distribution.
Natural Gas Liquids (NGLs) Natural Gas (Dry)

29
Name Title/Responsibility Relevant Focus Industry Experience Education
Kyri Loupis Managing Director – Portfolio Manager
Energy Infrastructure Dedicated 2000
MBA: Harvard Business School B.Sc.: The London School of
Econ.
Ganesh Jois, CFA VP – Portfolio Manager Energy Infrastructure Dedicated 2005
MBA: Zicklin School of Business
B.S.: University of Mumbai
Matthew Cooper VP – Portfolio Manager Energy Infrastructure Dedicated 2005 MBA: University of Chicago
BA: Vanderbilt University
Collin Bell Managing Director - Client Portfolio Manager
Energy Infrastructure /REIT Dedicated 2000 BA: Amherst College
David Bao VP - Trading/Portfolio Construction
Energy Infrastructure Dedicated 2009 B.S. New York University
Akif Irfan Associate - Research Analyst Energy Infrastructure Dedicated 2011 BA: Northwestern University
Vikrum Vora Associate - Trading/Port. Construction
Energy Infrastructure Dedicated 2013 BA: University of Michigan
As of June 30, 2014.
Investment Team Energy Infrastructure Coverage

30
Name Title/Responsibility Relevant Focus Industry Experience Education
John Arege, CFA MD – Portfolio Manager Energy Producers 1997 MBA: Boston University BA: Catholic University
Dolores Bamford, CFA MD – Portfolio Manager Energy Producers 1992 MBA: MIT BA: Wellesley
Diego Lozada-Ghirardi VP – Portfolio Manager Energy Producers 1983 MBA: Harvard B.A.: University of Washington
Gerald Maris VP – Portfolio Manager Energy Producers & Users 1986 MBA: Stanford University B.A.: Duke University
Ward Kruse VP– Research Analyst Energy Producers 1996 BA: Georgetown University
Fujun Wu VP – Research Analyst Energy Producers 2006 MBA: The Wharton School (UPenn) B.S.: Penn State University
Eric Fogarty VP – Portfolio Manager Energy Users (Utilities) 1994 B.S.: Binghamton University
Caroline Green VP – Portfolio Manager Energy Users (Chemical/Ag.) 2007 MBA: University of Pennsylvania B.S.:
Investment Team Energy Producers & Users Coverage
As of June 30, 2014.

31
Energy & Infrastructure Team Bios
Kyri Loupis, Managing Director Kyri is a Managing Director in GSAM, where he is the portfolio manager and head of the Energy & Infrastructure team. Prior to joining Goldman Sachs in 2009, Kyri spent over eight years at Lehman Brothers covering the energy sector in various capacities. From 2000 to 2006, he worked in the Investment Banking Division in equity capital markets. During that period, he executed over 100 lead transactions for energy companies across all sub-sectors and structures, with a particular focus in MLPs and Royalty Trusts. In 2006, he joined the Private Equity group where he co-founded an energy investment fund with over $1bn of assets under management and a particular focus in MLPs (participated in over 25 private investments in public equities and 4 pre-IPO investments) . Kyri has been a frequent contributor in publications like Barron’s on topics like energy and energy infrastructure. Between 1993 and 1998, he held various positions at Deloitte & Touche. He holds an MBA from Harvard Business School and a B.Sc. from The London School of Economics.
Ganesh V. Jois, CFA, Vice President Ganesh is a Vice President in GSAM and is a research analyst for the Energy & Infrastructure Team. Prior to joining Goldman Sachs in 2009, Ganesh was a research analyst at Citigroup Investment Research covering MLPs for nearly four years. During his time at Citigroup, Ganesh helped initiate coverage on several MLPs and had coverage responsibility for nearly 20 MLPs. Between 2003 and 2005, he worked in the Financial Advisory Services practice of Deloitte & Touche. He holds an MBA from the Zicklin School of Business and received a B.S. from the University of Mumbai, India.
Matthew Cooper, Vice President Matthew is a Vice President in GSAM and is a research analyst for the Energy & Infrastructure Team. Prior to joining Goldman Sachs in 2013, Matthew worked in the Commodities Origination and Structuring group at Merrill Lynch beginning in 2011. Between 2007 and 2009 he worked as a buy side research analyst in the Lehman Brothers MLP Opportunity Fund and prior to that worked as an Investment Banker in the Energy and Power Group at Merrill Lynch & Co. Matthew holds an MBA from the University of Chicago Booth School of Business and a BA from Vanderbilt University, where he graduated Magna Cum Laude.
Collin Bell, Managing Director Collin is a senior Client Portfolio Manager for the MLP and REIT teams. Prior to joining, Collin was a research analyst and head client portfolio manager for the Real Estate Securities (REITs) team. Before 2002, he was a senior relationship manager in the Portfolio Advisory Group (PAG) where he worked extensively with private clients helping to expand both the New York and London based efforts. Collin joined the Investment Management Division in July 1997. Prior to joining Goldman Sachs & Co., he received a Bachelors degree from Amherst College.

32
Energy & Infrastructure Team Bios
David Bao, Vice President David is a Vice President in GSAM, where he heads the infrastructure and trading for the Energy & Infrastructure Team. Prior to joining the Energy & Infrastructure Team, David worked in the Goldman Sachs Option Advisory Services (GOAS) Team, where he was the head of infrastructure and was a trader for 3 years and in the Margin Lending / Risk Management Group for 2 years. Before joining Goldman Sachs in 2005, David worked as an Associate Financial Advisor in Private Wealth Management at Morgan Stanley. David received his B.S. in Finance and Marketing in 2001 from the Leonard N. Stern School of Business at New York University where he was a Stern Scholar.
Akif Irfan, Associate Akif is an Associate in GSAM for the Energy & Infrastructure Team. Prior to joining the team, Akif was a financial analyst in Private Wealth Management since joining Goldman Sachs in 2009. Akif received his BA with honors in Economics and a double major in International Studies from Northwestern University in 2009.
Vikrum Vora, Associate Vikrum is an Associate in GSAM for the Energy & Infrastructure team. Prior to joining the team, Vikrum started with Goldman Sachs Execution & Clearing (GSEC) in 2010 as a prime brokerage service representative covering hedge funds and broker-dealers. Previously, he worked as a consumer retail research analyst for Indea Capital and an economic development specialist for the Institute for Research on Labor, Employment, and the Economy (IRLEE). Vikrum received a BA in Political Science from the University of Michigan in 2009.

Appendix B: Supplemental Information

Supplemental Information
The proposed fund, the GS North American Shale Revolution & Energy Infrastructure Portfolio, is shown on slide 35. This fund is currently in-line with the GS North American Energy Infrastructure Fund (Japan domiciled and only available for Japanese investors) presented on slide 36.
The Master Limited Partnership composite performance and Master Limited Partnership Greater Than $25 Million, Cash Funded (Supplemental Information) composite performance are presented on slides 37 and 38 to highlight the long-term track record of the GSAM Energy & Infrastructure Team. Please note that offshore investors cannot invest in the strategy shown in these composites as they are not permitted to own MLPs which generate IRS Schedule K-1 tax forms.
The Master Limited Partnership composite (slide 37) includes all accounts managed to the Master Limited Partnership strategy while the Master Limited Partnership Greater Than $25 Million, Cash Funded (Supplemental Information) composite (slide 38) contains portfolios that are also placed in the Master Limited Partnership composite but only those that were initially funded with at least $25 million in cash.
34

35
Performance of GS North American Shale Revolution & Energy Infrastructure Portfolio (SICAV)¹
Performance – Net of Fees, I-Shares
Source: GSAM. Past performance does not guarantee future results, which may vary ¹The proposed fund is part of the North American Energy Infrastructure composite, which incepted in August 2013. The composite returns presented here are taken from or are additional information to the fully GIPS® compliant North American Energy Infrastructure composite presentation included on slide 40.
Periods Ending August 31, 2014
GS North American Shale Revolution & Energy
Infrastructure Portfolio (%)
Alerian MLP index 50% & Energy Select Sector (IXE) 50% (%) Excess Returns (bps)
Since Inception (14-Apr-14) 17.00 13.32 +368

36
Performance of GS North American Energy Infrastructure Fund (Japan domiciled and only available for Japanese investors)¹
Performance – Net of Fees
Source: GSAM. Past performance does not guarantee future results, which may vary. Returns are in USD. ¹The proposed fund is part of the North American Energy Infrastructure composite, which incepted in August 2013. The composite returns presented here are taken from or are additional information to the fully GIPS® compliant North American Energy Infrastructure composite presentation included on slide 40.
Periods Ending August 31, 2014
GS North American Energy Infrastructure Fund (%)
Alerian MLP index 50% & Energy Select Sector (IXE) 50%
(%) Excess Returns (bps)
YTD 2014 22.76 16.31 +645
Trailing 1 year 32.44 23.93 +851
Since Inception (1-Jul-13) 30.66 21.38 +928

37
Performance of the Master Limited Partnership Strategy1
Annualized Performance – Gross of Fees Calendar Year Performance – Gross of Fees
Source: GSAM. Past performance does not guarantee future results, which may vary 1Benchmark: Alerian MLP Index. The Master Limited Partnership Strategy differs from the GS North American Energy Infrastructure Portfolio in that it is permitted to own MLPs which generate IRS Schedule K-1 tax forms. The proposed fund will not own MLPs which generate K-1 tax forms and therefore may be attractive for investors who are Schedule K-1 sensitive. The returns presented herein are gross and do not reflect the deduction of investment advisory fees, which will reduce returns. Please see our composite for net results and additional disclosures. The composite returns presented here are taken from or are additional information to the fully GIPS® compliant Master Limited Partnership composite presentation on slide 42.
The Master Limited Partnership composite includes all accounts managed to the Master Limited Partnership strategy while the Master Limited Partnership Greater Than $25 Million, Cash Funded (Supplemental Information) composite on the following slide contains portfolios that are also placed in the Master Limited Partnership composite but only those that were initially funded with at least $25 million in cash.
GSAM Master Limited Partnership (Institutional) – standard composite
Periods Ending August 31, 2014
MLP(Core) Strategy(%)
Benchmark (%)1
Excess Return (bps)
Trailing 1 year 40.77 30.76 +1,001
Trailing 2 years 32.91 23.51 +940
Trailing 3 years 30.38 21.84 +853
Since Inception (1-Nov-09) 29.26 24.15 +511
MLP(Core) Strategy(%)
Benchmark (%)1
Excess Return (bps)
YTD (through August 31, 2014) 27.87 21.38 +649 2013 36.34 27.58 +876 2012 12.72 4.80 +792 2011 17.12 13.88 +324 2010 34.80 35.85 -106

38
Performance of the Master Limited Partnership Greater Than $25 Million, Cash Funded Strategy1 (Supplemental Information)
Annualized Performance – Gross of Fees Calendar Year Performance – Gross of Fees
Source: GSAM. Past performance does not guarantee future results, which may vary 1 Benchmark: Alerian MLP Index. The Master Limited Partnership Strategy differs from the GS North American Energy Infrastructure Portfolio in that it is permitted to own MLPs which generate IRS Schedule K-1 tax forms. The proposed fund will not own MLPs which generate K-1 tax forms and therefore may be attractive for investors who are Schedule K-1 sensitive. The returns presented herein are gross and do not reflect the deduction of investment advisory fees, which will reduce returns. Please see our composite for net results and additional disclosures. The composite returns presented here are taken from or are additional information to the fully GIPS® compliant Master Limited Partnership Greater Than $25 Million, Cash Funded (Supplemental Information)composite presentation included on slide 44.
Master Limited Partnership Greater Than $25 Million, Cash Funded (Supplemental Information) (Institutional)
Periods Ending August 31, 2014
Strategy (%)
Benchmark (%)1
Excess Return (bps)
Trailing 1 year 54.89 30.76 +2,413
Trailing 2 years 41.45 23.51 +1,793
Trailing 3 years 37.24 21.84 +1,540
Since Inception (1-May-2010) 32.07 20.47 +1,160
Strategy (%)
Benchmark (%)1
Excess Return (bps)
YTD (through August 31, 2014) 36.55 21.38 +1,517
2013 41.84 27.58 +1,426
2012 17.14 4.80 +1,234
2011 20.81 13.88 +694
The Master Limited Partnership composite on the previous slide includes all accounts managed to the Master Limited Partnership strategy while the Master Limited Partnership Greater Than $25 Million, Cash Funded (Supplemental Information) composite below contains portfolios that are also placed in the Master Limited Partnership composite but only those that were initially funded with at least $25 million in cash.

Appendix C: Composite Presentations

N/A
N/A
Risk Metrics
Standard Deviation - Composite (%) [5] Dispersion (%) [3]
Portfolio Metrics
North American Energy Infrastructure (Institutional)
[1] Composite inception date: 08/01/2013. Returns for periods of less than one year cannot be annualized. Currency used to express end of period assets and composite performance: USD. [2] The composite net of fee returns are calculated by adjusting each monthly gross of fee composite return by the highest applicable fee rate listed in the Form ADV, Part II schedule or internal product fee schedule applicable to the prospective investor type. Actual fees and expenses may differ from those reflected in this composite presentation which would cause performance to differ. Where performance fees exist, the calculation was based on assumptions as to how the rate was applied which could differ from how it was actually charged. The net performance may not reflect the deduction of custody, administrative and other fees and expenses or fund sales loads, if applicable.
[3] Dispersion represents an asset weighted standard deviation of annual portfolio returns. Dispersion is not considered meaningful where less than five portfolios have been in the composite for the entire year and therefore has not been presented in years where an N/A appears. [4] Percentage of Firm assets are presented on an annual basis. Additional Firm asset and % of Firm asset information is available upon request. [5] For annual and YTD periods, the three year annualized ex-post standard deviation is presented as of the date shown. For each period for which an annualized return is presented, the corresponding annualized ex-post standard deviation of the composite is also provided. N/A is shown for periods where historical monthly returns are not available for 36 months or the full time period presented as standard deviation is not considered meaningful in these cases.
Returns Assets
As of: August 31, 2014 Gross Rate of Return (%) Net Rate of Return (%) [2] No. of Portfolios End of Period Assets (MM) Percent of Firm Assets [4]
Annualized Since Inception [1] 29.94 29.11
Years 08/2013-12/2013 8.11 7.82 N/A N/A < 5 368 0.05
08/2014 YTD 22.89 22.38 N/A 10 1,016 N/A
Continued on next page

North American Energy Infrastructure (Institutional) (Continued)
Composite creation date: 10/08/2013
GSAM claims compliance with the Global Investment Performance Standards (GIPS®) and has prepared and presented this report in compliance with the GIPS standards. GSAM has been independently verified for the periods July 1, 2000 through June 30, 2006 by Deloitte & Touche, LLP and for the periods July 1, 2006 through December 31, 2012 by Ernst & Young LLP. The verification reports are available upon request.
Verification assesses whether (1) the Firm has complied with all the composite construction requirements of the GIPS standards on a firm-wide basis and (2) the Firm's policies and procedures are designed to calculate and present performance in compliance with the GIPS standards. Verification does not ensure the accuracy of any specific composite presentation.
Goldman Sachs Asset Management (excluding the following two business units (i) Goldman Sachs Hedge Fund Strategies LLC and (ii) the Private Equity Group), is referred to herein as the 'Firm' or 'GSAM'. Established in 1988, GSAM provides advisory services globally to both individual and institutional clients and is defined as the 'Firm' for purposes of complying with the Global Investment Performance Standards (GIPS®). In July 2011, GSAM acquired Goldman Sachs & Partners, an affiliated Australian investment adviser and Benchmark Asset Management Company, an Indian investment adviser and ETF provider. In May 2012, GSAM acquired Dwight Asset Management Company LLC and retained substantially all the stable value strategies and associated investment team members. Effective October 2012, the Energy and Infrastructure team within Private Wealth Management (PWM), an affiliated investment adviser, moved to GSAM. In April 2014, GSAM acquired Deutsche Asset & Wealth Management Stable Value team and retained substantially all the stable value strategies and associated investment team members. In all instances, unless otherwise noted, GSAM retained substantially all of the assets, historical performance results and key investment team members.
The North American Energy Infrastructure composite consists of portfolios that invest in energy MLP-related securities that are managed with the objective of total return as a result of stable cash flow distributions that grow over time. MLP portfolios reflect the team's proprietary research views and seek an income stream from investing in MLP-related securities in energy infrastructure and logistics mainly in North America. Portfolios primarily invest in MLPs that elect to be taxed as 'C' corporations, 'C' corporations and LLCs that hold interests in MLPs, MLP access vehicles such as ETFs and ETNs, and derivatives. Portfolios are included in the composite with no restrictions on asset size. Portfolios may include institutional accounts, pooled vehicles or private wealth accounts.
These total return figures represent past performance and are not indicative of future returns which may vary. Performance results are calculated utilizing a time-weighted rate of return methodology and include the reinvestment of earnings. Effective April 2010, institutional and private wealth account returns are calculated by applying the true time-weighted return calculation methodology. Previously account returns were calculated applying the Modified BAI calculation methodology based on a monthly valuation and daily weighted cash flows. Accounts are valued pursuant to GSAM's Valuation Procedures and reflect GSAM's good faith estimate of fair market levels for all positions, which may not be realized upon liquidation. The circumstances of the transaction and transaction size will affect the price received upon liquidation.
GSAM's valuation policies are available upon request. Gross performance results are presented before management and custodial fees but after all trading commissions and transaction costs. Net performance results are net of transaction costs and investment management fees as described in Note 2 above. Where composites include mutual fund portfolios, the mutual fund performance is calculated gross of management and other fund fees for all share classes. Gross mutual fund performance is derived from net fund performance, applying the funds' total expense ratio. All relevant funds' share class assets are reflected in the composite and total GSAM assets figures. Each share class is treated as one account.
Account and mutual fund valuation sources and timing may sometimes differ causing dispersion within the composite. The composite may include portfolios of different base currencies which have been redenominated to a common currency using monthly exchange rates obtained from WM Reuters and Financial Times (FT). Composite monthly returns are the size-weighted averages of the portfolios' monthly returns. Composite monthly returns are geometrically linked to calculate composite annual returns. GSAM's policies for calculating performance and preparing compliant presentations are available upon request. Segments of multiple asset class portfolios which have been managed as stand alone portfolios with separately managed cash may be included in the composite. A complete list and description of GSAM's composites is available upon request.
The maximum fee schedule applied for this strategy reflects 65 basis points.
Effective January 1, 2012, GSAM changed its methodology for applying model fees changes for calculation of composite net returns on a prospective basis. When a fee increase occurs mid month, the highest applicable fee rate is applied effective the 1st of that month. When a fee decrease occurs mid month, the lowered fee rate is applied effective the 1st of the following month. Between July 1, 2005 and December 31, 2011, the methodology reflected the application of the highest model fee based on the applicable fee schedule in effect for that calendar year. Prior to July 1, 2005, the current highest fee in the Form ADV, Part II was applied retroactively across all periods. As a result, net returns presented through June 30, 2005 reflect the fees in effect on June 30, 2005.
For the performance period presented, investment professionals may have changed or departed, none of which in the Firm's view have altered the composite's strategy.
A benchmark has not been presented for this composite. There is currently no existing benchmark that the Investment Manager believes is a suitable index for comparison.
Published Final on: 09/16/2014 -111479-

ogundo\home\My Documents\MLP SICAV\Pitch book\Goldman Sachs North American Shale Revolution & Energy Infrastructure Portfolio.pptx Master Limited Partnership (Institutional)
[1] Composite inception date: 11/01/2009. Returns for periods of less than one year cannot be annualized. Where applicable, annual performance for up to 10 years is presented. Additional performance information is available upon request. Currency used to express end of period assets and composite and benchmark performance: USD.
[2] The composite net of fee returns are calculated by adjusting each monthly gross of fee composite return by the highest applicable fee rate listed in the Form ADV, Part II schedule or internal product fee schedule applicable to the prospective investor type. Actual fees and expenses may differ from those reflected in this composite presentation which would cause performance to differ. Where performance fees exist, the calculation was based on assumptions as to how the rate was applied which could differ from how it was actually charged. The net performance may not reflect the deduction of custody, administrative and other fees and expenses or fund sales loads, if applicable.
[3] Dispersion represents an asset weighted standard deviation of annual portfolio returns. Dispersion is not considered meaningful where less than five portfolios have been in the composite for the entire year and therefore has not been presented in years where an N/A appears.
[4] Percentage of Firm assets are presented on an annual basis. Additional Firm asset and % of Firm asset information is available upon request. The presentation of historical Firm assets reflects GSAM assets and does not include Master Limited Partnership (MLP) assets managed by the Energy and Infrastructure team through September 2012. Additional information regarding these assets is available upon request.
[5] Benchmark Source: Markit. The Alerian MLP Index is a composite of the 50 most prominent energy master limited partnerships calculated by Standard & Poor's using a float-adjusted market capitalization methodology. The index is disseminated by the New York Stock Exchange real-time on a price return basis (NYSE: AMZ). The corresponding total return index is calculated and disseminated daily through ticker AMZX.
[6] For annual and YTD periods, the three year annualized ex-post standard deviation is presented as of the date shown. For each period for which an annualized return is presented, the corresponding annualized ex-post standard deviation of the composite and benchmark is also provided. N/A is shown for periods where historical monthly returns are not available for 36 months or the full time period presented as standard deviation is not considered meaningful in these cases.
Returns Risk Metrics Portfolio Metrics Assets
As of: August 31, 2014
Gross Rate of Return (%)
Net Rate of Return (%) [2]
Alerian MLP (Total Return, Unhedged, USD) Benchmark
(%) [5] Gross Excess Return
(bps) Standard Deviation - Composite
(%) [6]
Standard Deviation - Alerian MLP (Total Return, Unhedged, USD)
Benchmark (%) [6] Dispersion (%) [3] No. of Portfolios End of Period Assets (MM)
Percent of Firm Assets [4]
Annualized Since Inception [1] 29.26 28.07 24.15 511 12.49 13.33
Years 11/2009-12/2009 11.51 11.35 13.38 (187) N/A N/A N/A 350 361 0.05
2010 34.80 33.56 35.85 (106) N/A N/A 2.86 1,564 2,005 0.30
2011 17.12 16.03 13.88 324 N/A N/A 3.81 2,082 3,178 0.49
2012 12.72 11.67 4.80 792 12.55 13.37 3.38 2,537 3,986 0.58
2013 36.34 35.08 27.58 876 12.53 13.43 4.14 3,066 6,261 0.84
08/2014 YTD 27.87 27.09 21.38 649 12.92 13.81 N/A 3,328 8,127 N/A
Continued on next page

ogundo\home\My Documents\MLP SICAV\Pitch book\Goldman Sachs North American Shale Revolution & Energy Infrastructure Portfolio.pptx Master Limited Partnership (Institutional) (Continued)
Composite creation date: 09/20/2012
GSAM claims compliance with the Global Investment Performance Standards (GIPS®) and has prepared and presented this report in compliance with the GIPS standards. GSAM has been independently verified for the periods July 1, 2000 through June 30, 2006 by Deloitte & Touche, LLP and for the periods July 1, 2006 through December 31, 2012 by Ernst & Young LLP.
Verification assesses whether (1) the Firm has complied with all the composite construction requirements of the GIPS standards on a firm-wide basis and (2) the Firm's policies and procedures are designed to calculate and present performance in compliance with the GIPS standards. The Master Limited Partnership composite has been examined for the periods January 1, 2012 through December 31, 2012. The verification and performance examination reports are available upon request.
Goldman Sachs Asset Management (excluding the following two business units (i) Goldman Sachs Hedge Fund Strategies LLC and (ii) the Private Equity Group), is referred to herein as the 'Firm' or 'GSAM'. Established in 1988, GSAM provides advisory services globally to both individual and institutional clients and is defined as the 'Firm' for purposes of complying with the Global Investment Performance Standards (GIPS®). In July 2011, GSAM acquired Goldman Sachs & Partners, an affiliated Australian investment adviser and Benchmark Asset Management Company, an Indian investment adviser and ETF provider. In May 2012, GSAM acquired Dwight Asset Management Company LLC and retained substantially all the stable value strategies and associated investment team members. Effective October 2012, the Energy and Infrastructure team within Private Wealth Management (PWM), an affiliated investment adviser, moved to GSAM. In April 2014, GSAM acquired Deutsche Asset & Wealth Management Stable Value team and retained substantially all the stable value strategies and associated investment team members. In all instances, unless otherwise noted, GSAM retained substantially all of the assets, historical performance results and key investment team members.
The Master Limited Partnership (MLP) composite consists of portfolios that invest in energy MLP and MLP-related public equity securities that are managed with the objective of total return as a result of stable cash flow distributions that grow over time. MLP portfolios reflect the team�s proprietary research views and seek an income stream from investing in MLPs in energy infrastructure and logistics. Portfolios are included in the composite with no restrictions on asset size. Portfolios may be cash, securities, or cash and securities funded. Portfolios may include institutional accounts, pooled vehicles or private wealth accounts.
These total return figures represent past performance and are not indicative of future returns which may vary. Performance results are calculated utilizing a time-weighted rate of return methodology and include the reinvestment of earnings. Effective April 2010, institutional and private wealth account returns are calculated by applying the true time-weighted return calculation methodology. Previously account returns were calculated applying the Modified BAI calculation methodology based on a monthly valuation and daily weighted cash flows. Accounts are valued pursuant to GSAM's Valuation Procedures and reflect GSAM's good faith estimate of fair market levels for all positions, which may not be realized upon liquidation. The circumstances of the transaction and transaction size will affect the price received upon liquidation.
GSAM's valuation policies are available upon request. Gross performance results are presented before management and custodial fees but after all trading commissions and transaction costs. Net performance results are net of transaction costs and investment management fees as described in Note 2 above. Where composites include mutual fund portfolios, the mutual fund performance is calculated gross of management and other fund fees for all share classes. Gross mutual fund performance is derived from net fund performance, applying the funds' total expense ratio. All relevant funds' share class assets are reflected in the composite and total GSAM assets figures. Each share class is treated as one account.
Account and mutual fund valuation sources and timing may sometimes differ causing dispersion within the composite. The composite may include portfolios of different base currencies which have been redenominated to a common currency using monthly exchange rates obtained from WM Reuters and Financial Times (FT). Composite monthly returns are the size-weighted averages of the portfolios' monthly returns. Composite monthly returns are geometrically linked to calculate composite annual returns. GSAM's policies for calculating performance and preparing compliant presentations are available upon request. Segments of multiple asset class portfolios which have been managed as stand alone portfolios with separately managed cash may be included in the composite. A complete list and description of GSAM's composites is available upon request.
Performance included in the composite for periods prior to October 2012 represents results achieved by Energy and Infrastructure team members while at Goldman Sachs Private Wealth Management (PWM), an affiliated investment adviser. The team joined the firm in connection with the integration of the energy and infrastructure business. Such performance reflects the performance of all accounts with substantially similar investment objectives, policies and strategies for which the Energy and Infrastructure team had portfolio management responsibility at Goldman Sachs PWM. References to market or composite indices, benchmarks or other measures of relative market performance over a specified period of time (each, an 'index') are provided for your information only. Reference to an index does not imply that the portfolio will achieve returns, volatility or other results similar to the index. The composition of the index may not reflect the manner in which a portfolio is constructed in relation to expected or achieved returns, portfolio guidelines, restrictions, sectors, correlations, concentrations, volatility or tracking error targets, all of which are subject to change over time.
Maximum Fees on Institutional Master Limited Partnership mandates: 95 bps on first $25 million, 80 bps on next $25 million, 70 bps on next $50 million, 65 bps on next $100 million, 60 bps on amounts over $200 million. Minimum fees on a separate account are $150000. Performance based fees are also available in accordance with applicable regulations. Additional information regarding investment management fees is provided in our Form ADV, Part II.
Effective January 1, 2012, GSAM changed its methodology for applying model fees changes for calculation of composite net returns on a prospective basis. When a fee increase occurs mid month, the highest applicable fee rate is applied effective the 1st of that month. When a fee decrease occurs mid month, the lowered fee rate is applied effective the 1st of the following month. Between July 1, 2005 and December 31, 2011, the methodology reflected the application of the highest model fee based on the applicable fee schedule in effect for that calendar year. Prior to July 1, 2005, the current highest fee in the Form ADV, Part II was applied retroactively across all periods. As a result, net returns presented through June 30, 2005 reflect the fees in effect on June 30, 2005.
For the performance period presented, investment professionals may have changed or departed, none of which in the Firm's view have altered the composite's strategy.
Published Final on: 09/15/2014 -111366-

ogundo\home\My Documents\MLP SICAV\Pitch book\Goldman Sachs North American Shale Revolution & Energy Infrastructure Portfolio.pptx Master Limited Partnership Greater Than $25 Million, Cash Funded (Supplemental Information) (Institutional)
[1] Composite inception date: 05/01/2010. Returns for periods of less than one year cannot be annualized. Where applicable, annual performance for up to 10 years is presented. Additional performance information is available upon request. Currency used to express end of period assets and composite and benchmark performance: USD.
[2] The composite net of fee returns are calculated by adjusting each monthly gross of fee composite return by the highest applicable fee rate listed in the Form ADV, Part II schedule or internal product fee schedule applicable to the prospective investor type. Actual fees and expenses may differ from those reflected in this composite presentation which would cause performance to differ. Where performance fees exist, the calculation was based on assumptions as to how the rate was applied which could differ from how it was actually charged. The net performance may not reflect the deduction of custody, administrative and other fees and expenses or fund sales loads, if applicable.
[3] Dispersion represents an asset weighted standard deviation of annual portfolio returns. Dispersion is not considered meaningful where less than five portfolios have been in the composite for the entire year and therefore has not been presented in years where an N/A appears.
[4] Percentage of Firm assets are presented on an annual basis. Additional Firm asset and % of Firm asset information is available upon request. The presentation of historical Firm assets reflects GSAM assets and does not include Master Limited Partnership (MLP) assets managed by the Energy and Infrastructure team through September 2012. Additional information regarding these assets is available upon request.
[5] Benchmark Source: Markit. The Alerian MLP Index is a composite of the 50 most prominent energy master limited partnerships calculated by Standard & Poor's using a float-adjusted market capitalization methodology. The index is disseminated by the New York Stock Exchange real-time on a price return basis (NYSE: AMZ). The corresponding total return index is calculated and disseminated daily through ticker AMZX.
[6] For annual and YTD periods, the three year annualized ex-post standard deviation is presented as of the date shown. For each period for which an annualized return is presented, the corresponding annualized ex-post standard deviation of the composite and benchmark is also provided. N/A is shown for periods where historical monthly returns are not available for 36 months or the full time period presented as standard deviation is not considered meaningful in these cases.
Returns Risk Metrics Portfolio Metrics Assets
As of: August 31, 2014
Gross Rate of Return (%)
Net Rate of Return (%) [2]
Alerian MLP (Total Return, Unhedged, USD) Benchmark
(%) [5] Gross Excess Return
(bps) Standard Deviation - Composite
(%) [6]
Standard Deviation - Alerian MLP (Total Return, Unhedged, USD)
Benchmark (%) [6] Dispersion (%) [3] No. of Portfolios End of Period Assets (MM)
Percent of Firm Assets [4]
Annualized Since Inception [1] 32.07 30.85 20.47 1,160 13.04 13.60
Years 05/2010-12/2010 21.99 21.24 21.39 60 N/A N/A N/A < 5 31 < 0.01
2011 20.81 19.69 13.88 694 N/A N/A N/A < 5 198 0.03
2012 17.14 16.05 4.80 1,234 N/A N/A N/A < 5 246 0.04
2013 41.84 40.54 27.58 1,426 12.22 13.43 N/A < 5 336 0.05
08/2014 YTD 36.55 35.72 21.38 1,517 13.42 13.81 N/A < 5 451 N/A
Continued on next page

ogundo\home\My Documents\MLP SICAV\Pitch book\Goldman Sachs North American Shale Revolution & Energy Infrastructure Portfolio.pptx Master Limited Partnership Greater Than $25 Million, Cash Funded (Supplemental Information) (Institutional) (Continued)
Composite creation date: 04/19/2013
GSAM claims compliance with the Global Investment Performance Standards (GIPS®) and has prepared and presented this report in compliance with the GIPS standards. GSAM has been independently verified for the periods July 1, 2000 through June 30, 2006 by Deloitte & Touche, LLP and for the periods July 1, 2006 through December 31, 2012 by Ernst & Young LLP. The verification reports are available upon request.
Verification assesses whether (1) the Firm has complied with all the composite construction requirements of the GIPS standards on a firm-wide basis and (2) the Firm's policies and procedures are designed to calculate and present performance in compliance with the GIPS standards. Verification does not ensure the accuracy of any specific composite presentation.
Goldman Sachs Asset Management (excluding the following two business units (i) Goldman Sachs Hedge Fund Strategies LLC and (ii) the Private Equity Group), is referred to herein as the 'Firm' or 'GSAM'. Established in 1988, GSAM provides advisory services globally to both individual and institutional clients and is defined as the 'Firm' for purposes of complying with the Global Investment Performance Standards (GIPS®). In July 2011, GSAM acquired Goldman Sachs & Partners, an affiliated Australian investment adviser and Benchmark Asset Management Company, an Indian investment adviser and ETF provider. In May 2012, GSAM acquired Dwight Asset Management Company LLC and retained substantially all the stable value strategies and associated investment team members. Effective October 2012, the Energy and Infrastructure team within Private Wealth Management (PWM), an affiliated investment adviser, moved to GSAM. In April 2014, GSAM acquired Deutsche Asset & Wealth Management Stable Value team and retained substantially all the stable value strategies and associated investment team members. In all instances, unless otherwise noted, GSAM retained substantially all of the assets, historical performance results and key investment team members.
The Master Limited Partnership Greater Than $25 Million, Cash Funded (Supplemental Information) contains portfolios that are also placed in the Master Limited Partnership composite. It represents a subset of the broader composite and reflects portfolios that were initially funded with at least $25 million in cash.
These total return figures represent past performance and are not indicative of future returns which may vary. Performance results are calculated utilizing a time-weighted rate of return methodology and include the reinvestment of earnings. Effective April 2010, institutional and private wealth account returns are calculated by applying the true time-weighted return calculation methodology. Previously account returns were calculated applying the Modified BAI calculation methodology based on a monthly valuation and daily weighted cash flows. Accounts are valued pursuant to GSAM's Valuation Procedures and reflect GSAM's good faith estimate of fair market levels for all positions, which may not be realized upon liquidation. The circumstances of the transaction and transaction size will affect the price received upon liquidation.
GSAM's valuation policies are available upon request. Gross performance results are presented before management and custodial fees but after all trading commissions and transaction costs. Net performance results are net of transaction costs and investment management fees as described in Note 2 above. Where composites include mutual fund portfolios, the mutual fund performance is calculated gross of management and other fund fees for all share classes. Gross mutual fund performance is derived from net fund performance, applying the funds' total expense ratio. All relevant funds' share class assets are reflected in the composite and total GSAM assets figures. Each share class is treated as one account.
Account and mutual fund valuation sources and timing may sometimes differ causing dispersion within the composite. The composite may include portfolios of different base currencies which have been redenominated to a common currency using monthly exchange rates obtained from WM Reuters and Financial Times (FT). Composite monthly returns are the size-weighted averages of the portfolios' monthly returns. Composite monthly returns are geometrically linked to calculate composite annual returns. GSAM's policies for calculating performance and preparing compliant presentations are available upon request. Segments of multiple asset class portfolios which have been managed as stand alone portfolios with separately managed cash may be included in the composite. A complete list and description of GSAM's composites is available upon request.
Performance included in the composite for periods prior to October 2012 represents results achieved by Energy and Infrastructure team members while at Goldman Sachs Private Wealth Management (PWM), an affiliated investment adviser. The team joined the firm in connection with the integration of the energy and infrastructure business. Such performance reflects the performance of all accounts with substantially similar investment objectives, policies and strategies for which the Energy and Infrastructure team had portfolio management responsibility at Goldman Sachs PWM. References to market or composite indices, benchmarks or other measures of relative market performance over a specified period of time (each, an 'index') are provided for your information only. Reference to an index does not imply that the portfolio will achieve returns, volatility or other results similar to the index. The composition of the index may not reflect the manner in which a portfolio is constructed in relation to expected or achieved returns, portfolio guidelines, restrictions, sectors, correlations, concentrations, volatility or tracking error targets, all of which are subject to change over time.
Maximum Fees on Institutional Master Limited Partnership Greater Than $25 Million, Cash Funded (Supplemental Information) mandates: 95 bps on first $25 million, 80 bps on next $25 million, 70 bps on next $50 million, 65 bps on next $100 million, 60 bps on amounts over $200 million. Minimum fees on a separate account are $150000. Performance based fees are also available in accordance with applicable regulations. Additional information regarding investment management fees is provided in our Form ADV, Part II.
Effective January 1, 2012, GSAM changed its methodology for applying model fees changes for calculation of composite net returns on a prospective basis. When a fee increase occurs mid month, the highest applicable fee rate is applied effective the 1st of that month. When a fee decrease occurs mid month, the lowered fee rate is applied effective the 1st of the following month. Between July 1, 2005 and December 31, 2011, the methodology reflected the application of the highest model fee based on the applicable fee schedule in effect for that calendar year. Prior to July 1, 2005, the current highest fee in the Form ADV, Part II was applied retroactively across all periods. As a result, net returns presented through June 30, 2005 reflect the fees in effect on June 30, 2005.
For the performance period presented, investment professionals may have changed or departed, none of which in the Firm's view have altered the composite's strategy.
The performance presented is Supplemental Information shown for illustrative purposes to be used in consideration with the Master Limited Partnership composite presentation.
Performance fee structures may vary among accounts; therefore, actual fees may differ from the model fees as stated in the Form ADV, Part II Form which have been used to calculate net returns.
Published Final on: 09/15/2014 -111332-

46
General Disclosures
This material is provided at your request for informational purposes only and does not constitute a solicitation in any jurisdiction in which such a solicitation is unlawful or to any person to whom it is unlawful. It only contains selected information with regards to the fund and does not constitute an offer to buy shares in the fund. Prior to an investment, prospective investors should carefully read the latest Key Investor Information Document (KIID) as well as the offering documentation, including but not limited to the fund’s prospectus which contains inter alia a comprehensive disclosure of applicable risks. The relevant articles of association, prospectus, supplement, KIID and latest annual/semi-annual report are available free of charge from the fund’s paying and information agent and/or from your financial adviser.
Shares of the fund may not be registered for public distribution in a number of jurisdictions (including but not limited to any Latin American, African or Asian countries). Therefore, the shares of the fund must not be marketed or offered in or to residents of any such jurisdictions unless such marketing or offering is made in compliance with applicable exemptions for the private placement of collective investment schemes and other applicable jurisdictional rules and regulations.
Financial advisers generally suggest a diversified portfolio of investments. The fund described herein does not represent a diversified investment by itself. An investor should only invest if he/she has the necessary financial resources to bear a complete loss of this investment.
This material must not be construed as investment or tax advice. Prospective investors should consult their financial and tax adviser before investing in order to determine whether an investment would be suitable for them.
This information discusses general market activity, industry or sector trends, or other broad-based economic, market or political conditions. It also pertains to past performance or is the basis for previously-made discretionary investment decisions. This information should not be construed as a current recommendation, research or investment advice. It should not be assumed that investment decisions made in the future will be profitable or will equal the performance of investments discussed in this document. Any mention of an investment decision is intended only to illustrate our investment approach or strategy, and is not indicative of the performance of our strategy as a whole. Any such illustration is not necessarily representative of other investment decisions. A complete list of past recommendations may be available on request. Please see additional disclosures.
This material has been prepared by GSAM and is not a product of Goldman Sachs Global Investment Research. The views and opinions expressed may differ from the views and opinions expressed by Goldman Sachs Global Investment Research or other departments or divisions of Goldman Sachs and its affiliates. Investors are urged to consult with their financial advisors before buying or selling any securities. This information should not be relied upon in making an investment decision. GSAM has no obligation to provide any updates or changes.
References to indices, benchmarks or other measures of relative market performance over a specified period of time are provided for your information only and do not imply that the portfolio will achieve similar results. The index composition may not reflect the manner in which a portfolio is constructed. While an adviser seeks to design a portfolio which reflects appropriate risk and return features, portfolio characteristics may deviate from those of the benchmark.
Any reference to a specific company or security listed herein does not constitute a recommendation to buy, sell or hold securities of such company nor does it constitute a recommendation to invest directly in any such company. This information should not be construed as research or investment advice regarding a particular security and should not be relied upon in whole or in part in making an investment decision.
Although certain information has been obtained from sources believed to be reliable, we do not guarantee its accuracy, completeness or fairness. We have relied upon and assumed without independent verification, the accuracy and completeness of all information available from public sources.
Views and opinions expressed are for informational purposes only and do not constitute a recommendation by GSAM to buy, sell, or hold any security. Views and opinions are current as of the date of this presentation and may be subject to change, they should not be construed as investment advice.
Index Benchmarks
Indices are unmanaged. The figures for the index reflect the reinvestment of all income or dividends, as applicable, but do not reflect the deduction of any fees or expenses which would reduce returns. Investors cannot invest directly in indices. The indices referenced herein have been selected because they are well known, easily recognized by investors, and reflect those indices that the Investment Manager believes, in part based on industry practice, provide a suitable benchmark against which to evaluate the investment or broader market described herein. The exclusion of “failed” or closed hedge funds may mean that each index overstates the performance of hedge funds generally.

47
General Disclosures
Past performance does not guarantee future results, which may vary.
The value of investments and the income derived from investments will fluctuate and can go down as well as up. A loss of principal may occur.
Master Limited Partnerships ("MLPs") may be generally less liquid than other publicly traded securities and as such can be more volatile and involve higher risk. MLPs may also involve substantially different tax treatment than other equity-type investments, and such tax treatment could be disadvantageous to certain types of investors, such as retirement plans, mutual funds, charitable accounts, foreign investors, retirement accounts or charitable entities. In addition, investments in MLPs may trigger state tax reporting requirements.
“Alerian MLP Index”, “Alerian MLP Total Return Index”, “AMZ” and “AMZX” are trademarks of Alerian and their use is granted under a license from Alerian or “Source: Alerian ”The Alerian MLP Index is a composite of the 50 most prominent energy MLPs calculated by Standards & Poor’s using a float-adjusted market capitalization methodology. The Cushing ® Royalty Trust and Upstream MLP Indices (CRTY and CRTYTR) are market capitalization weighted indices that (respectively) reflect the Price and Total Return performance of Royalty Trusts and MLPs (Master Limited Partnerships) involved in the following main business segments: Exploration & Production and Natural Resources. This includes Royalty Trusts that are structured as MLPs.
Goldman Sachs does not provide accounting, tax, or legal advice. Notwithstanding anything in this document to the contrary, and except as required to enable compliance with applicable securities law, you may disclose to any person the US federal and state income tax treatment and tax structure of the transaction and all materials of any kind (including tax opinions and other tax analyses) that are provided to you relating to such tax treatment and tax structure, without Goldman Sachs imposing any limitation of any kind. Investors should be aware that a determination of the tax consequences to them should take into account their specific circumstances and that the tax law is subject to change in the future or retroactively and investors are strongly urged to consult with their own tax advisor regarding any potential strategy, investment or transaction.
As the GSAM: MLPs Core Strategy trades MLPs (which may generate UBTI for certain types of investors) and other equity securities, clients of Goldman Sachs should obtain their own independent tax advice based on their particular circumstances. Entities referred to as MLPs are generally structured as LPs but also can be structured as LLCs and receive partnership taxation treatment. Some MLPs may choose different taxation treatment or choose to be structured differently. Differently structured entities may not have all the characteristics of a typical MLP.
Generally, a master limited partnership (“MLP”) is treated as a partnership for Federal income tax purposes. Therefore, investors in an MLP may be subject to certain taxes in addition to Federal income taxes, including state and local income taxes imposed by the various jurisdictions in which the MLP conducts business or owns property. In addition, certain tax-exempt investors in an MLP, such as tax-exempt foundations and charitable lead trusts, may incur unrelated business taxable income (“UBTI”) with respect to their investment. UBTI may result in increased Federal, and possibly state and local, tax costs, and may also result in additional filing requirements for tax exempt investors. Non-U.S. investors may be subject to U.S. taxation on a net income basis and have U.S. filing obligations as a result of investing in MLPs or US Royalty Trusts. The tax reporting information for MLPs generally is provided to investors on an annual IRS Schedule K-1, rather than an IRS Form 1099. To the extent the Schedule K-1 is delivered after April 15, you may be required to request an extension to file your tax returns.
Economic and market forecasts presented herein reflect a series of assumptions and judgments as of the date of this presentation and are subject to change without notice. These forecasts do not take into account the specific investment objectives, restrictions, tax and financial situation or other needs of any specific client. Actual data will vary and may not be reflected here. These forecasts are subject to high levels of uncertainty that may affect actual performance. Accordingly, these forecasts should be viewed as merely representative of a broad range of possible outcomes. These forecasts are estimated, based on assumptions, and are subject to significant revision and may change materially as economic and market conditions change. Goldman Sachs has no obligation to provide updates or changes to these forecasts. Case studies and examples are for illustrative purposes only.
Confidentiality
No part of this material may, without GSAM’s prior written consent, be (i) copied, photocopied or duplicated in any form, by any means, or (ii) distributed to any person that is not an employee, officer, director, or authorized agent of the recipient.
© 2014 Goldman Sachs. All rights reserved. Compliance Code: 132236.OSF.TMPL/6/2014