goldman sachs variable insurance trust sachs variable insurance trust u.s. equity insights fund...
TRANSCRIPT
GoldmanSachs Variable Insurance Trust
Goldman SachsU.S. Equity Insights Fund
Annual ReportDecember 31, 2017

G O L D M A N S A C H S V A R I A B L E I N S U R A N C E T R U S T U . S . E Q U I T Y I N S I G H T S F U N D
I N V E S T M E N T O B J E C T I V E
The Fund seeks long-term growth of capital and dividend income.
Portfolio Management Discussion and AnalysisBelow, the Goldman Sachs Quantitative Investment Strategies (“QIS”) Team discusses the Goldman Sachs Variable Insurance Trust —
Goldman Sachs U.S. Equity Insights Fund’s (the “Fund”) performance and positioning for the 12-month period ended December 31, 2017
(the “Reporting Period”).
How did the Fund perform during the Reporting Period?
During the Reporting Period, the Fund’s Institutional and Service Shares generated average annual total returns of 24.07% and
23.80%, respectively. These returns compare to the 21.83% average annual total return of the Fund’s benchmark, the Standard &
Poor’s 500® Index (with dividends reinvested) (the “S&P 500® Index”) during the same time period.
What economic and market factors most influenced the equity markets as a whole during the Reporting Period?
Representing the U.S. equity market, the S&P 500® Index gained 21.83% during the Reporting Period. It was a banner year for
U.S. equities, with the S&P 500® Index advancing for 12 consecutive months in 2017, a feat that had previously never been
accomplished in a single calendar year. Overall, stocks were boosted by a combination of accelerating economic growth, rising
corporate earnings and a general lack of negative financial headlines. U.S. equity market volatility was at historic lows.
U.S. equities rallied to new highs at the start of 2017 on prospects of deregulation, tax reform and infrastructure spending as well as
on stronger economic data. In March 2017, the U.S. Federal Reserve (the “Fed”) raised interest rates for the third time since the
2008 global financial crisis, which was met with dovish market reaction. (Dovish tends to suggest lower interest rates; opposite of
hawkish.) U.S. equities were virtually flat, albeit positive, in March 2017 and then continued to climb higher in April 2017 on
strong earnings results and receding European political risk. Although the labor market remained strong, economic activity and
inflation moderated during the second calendar quarter. In the third calendar quarter, U.S. economic activity and labor market data
showed consistent strength, with a reversal of five consecutive downside inflation surprises. Progress on tax reform and strong
economic activity data remained supportive for U.S. equities in October and November 2017. The Fed delivered the third rate hike
of 2017 in December as had been widely expected, having done similarly in June 2017, and maintained its projections for three
additional interest rate hikes in 2018. U.S. equities gained additional momentum toward the end of the Reporting Period from the
passage of a tax reform bill that reduced the corporate tax rate from 35% to 21%. The fourth quarter of 2017 marked the ninth
consecutive quarter of positive returns for the S&P 500® Index, its strongest quarterly advance in four years.
For the Reporting Period overall, information technology, materials and consumer discretionary were the best performing sectors in
the S&P 500® Index, as measured by total return. The weakest performing sectors in the S&P 500® Index were telecommunication
services and energy, the only two to post negative absolute returns, followed by real estate, which was comparatively weak but
generated a positive return during the Reporting Period.
Within the U.S. equity market, there was significant disparity in performance not only among sectors but also among the various
capitalization and style segments. While all capitalization segments posted positive returns, large-cap stocks, as measured by the
Russell 1000® Index, performed best, followed by mid-cap stocks, as measured by the Russell Midcap® Index, and then at some
distance by small-cap stocks, as measured by the Russell 2000® Index. From a style perspective, growth-oriented stocks significantly
outpaced value-oriented stocks across the capitalization spectrum. (All as measured by the Russell indices.)
What key factors were responsible for the Fund’s performance during the Reporting Period?
During the Reporting Period, the Fund outperformed the S&P 500® Index largely due to stock selection driven by our quantitative
model and five of our quantitative model’s six investment themes.
What impact did the Fund’s investment themes have on performance during the Reporting Period?
As expected, and in keeping with our investment approach, our quantitative model and its six investment themes — Valuation,
Profitability, Quality, Management, Momentum and Sentiment — had the greatest impact on relative performance. We use these
themes to take a long-term view of market patterns and look for inefficiencies, selecting stocks for the Fund and overweighting or
underweighting the ones chosen by the model. Over time and by design, the performance of any one of the model’s investment
1
G O L D M A N S A C H S V A R I A B L E I N S U R A N C E T R U S T U . S . E Q U I T Y I N S I G H T S F U N D
themes tends to have a low correlation with the model’s other themes, demonstrating the diversification benefit of the Fund’s
theme-driven quantitative model. The variance in performance supports our research indicating that the diversification provided by
the Fund’s different investment themes has been a significant investment advantage over the long term, even though the Fund may
experience underperformance in the short term. Of course, diversification does not protect an investor from market risk nor does it
ensure a profit.
During the Reporting Period, five of our six investment themes contributed positively to relative returns. Momentum contributed
most positively to relative performance, followed by Valuation and Quality. The Profitability and Management themes also
contributed positively, albeit to a lesser extent. The Momentum theme seeks to predict drifts in stock prices caused by delayed
investor reaction to company-specific information and information about related companies. The Valuation theme attempts to
capture potential mispricings of securities, typically by comparing a measure of the company’s intrinsic value to its market value.
The Quality theme assesses both firm and financial quality. The Profitability theme assesses whether a company is earning more
than its cost of capital. The Management theme assesses the characteristics, policies and strategic decisions of company
managements.
The Sentiment theme was the only one that detracted from the Fund’s relative returns during the Reporting Period. The Sentiment
theme reflects selected investment views and decisions of individuals and financial intermediaries.
How did the Fund’s sector and industry allocations affect relative performance?
In constructing the Fund’s portfolio, we focus on picking stocks rather than making industry or sector bets. Consequently, the Fund
is similar to its benchmark, the S&P 500® Index, in terms of its industry and sector allocation and style. We manage the Fund’s
industry and sector exposure by including industry factors in our risk model and by explicitly penalizing industry and sector
deviations from the benchmark index in optimization. Sector weights or changes in sector weights generally do not have a
meaningful impact on relative performance.
Did stock selection help or hurt Fund performance during the Reporting Period?
We seek to outpace the S&P 500® Index by overweighting stocks that we expect to outperform and underweighting those that we
think may lag. We also build positions based on our thematic views. For example, the Fund aims to hold a basket of stocks with
more favorable Momentum characteristics than the benchmark index. During the Reporting Period, stock selection overall
contributed positively to the Fund’s relative performance.
Effective stock selection in the energy, consumer discretionary and industrials sectors contributed most positively to the Fund’s
results relative to the S&P 500® Index. Relative allocation positioning in energy, one of the two weakest sectors in the S&P 500®
Index during the Reporting Period, also helped. Partially offsetting these positive contributors was stock selection in the
information technology, consumer staples and utilities sectors, which detracted from the Fund’s results relative to the S&P 500®
Index during the Reporting Period. Relative allocation positioning in utilities, which lagged the S&P 500® Index, also hurt.
Which individual stock positions contributed the most to the Fund’s relative returns during the ReportingPeriod?
The Fund benefited most from an underweight position in diversified industrial and financial services conglomerate General
Electric and from overweight positions in aerospace and defense company Boeing and semiconductor company Applied Materials.
We chose to underweight General Electric due to our negative view on Sentiment. The Fund was overweight Boeing given our
positive view on Quality. The overweight in Applied Materials was established because of our positive views on Sentiment and
Momentum.
Which individual positions detracted from the Fund’s results during the Reporting Period?
Detracting most from the Fund’s results relative to the S&P 500® Index were overweight positions in utilities company PG&E,
advertising agencies and marketing services companies organization Interpublic Group of Cos. and beer producer Molson Coors
Brewing. We chose to overweight PG&E due to our positive views on Value, Sentiment and Profitability. The Fund had an
overweight position in Interpublic Group of Cos. based on our positive view on Sentiment. Our positive view on Sentiment also
drove the Fund’s overweight in Molson Coors Brewing.
How did the Fund use derivatives during the Reporting Period?
During the Reporting Period, we did not use derivatives as part of an active management strategy to add value to the Fund’s results.
However, we used equity index futures contracts, on an opportunistic basis, to equitize the Fund’s excess cash holdings. In other
words, we put the Fund’s excess cash holdings to work by using them as collateral for the purchase of stock futures. The use of
these futures contracts did not have a material impact on the Fund’s performance during the Reporting Period.
2
G O L D M A N S A C H S V A R I A B L E I N S U R A N C E T R U S T U . S . E Q U I T Y I N S I G H T S F U N D
Did you make any enhancements to your quantitative models during the Reporting Period?
We continuously look for ways to improve our investment process. During the Reporting Period, we made numerous enhancements
to our models. As example, we made two enhancements to our Sentiment theme. The first enhancement introduced a signal in the
U.S. region, which looks at characteristics of a company’s Credit Default Swaps term structure to infer investor expectations
regarding the health of that company. Secondly, we introduced an enhancement in the U.S. region that looks at the 10-K and
10-Q filings of companies as an indicator of stock price movements. We use natural language processing techniques to parse
through quarterly filings in an effort to gauge various aspects of a company related to management sentiment, their outlook and
their thoughts on upcoming risks.
During the fourth quarter of 2017, we introduced new signals within the Profitability theme that use various alternative data sources
to identify companies benefiting from consumer spending. The first signal, introduced in the U.S. region, aims to forecast sales
growth trends not just for the upcoming quarter but for multiple quarters ahead by looking for underlying trends. The second signal,
also introduced in the U.S. region, analyzes profitability of retailers by assessing customer traffic in the retailer’s location. The third
signal aims to predict the profitability of developed market companies outside the U.S. by mapping U.S. consumer spending data in
various segments to non-U.S. companies engaged in these business segments, as our research has shown that consumer behavior
across developed markets are correlated.
We also introduced new signals within our Momentum theme that help us create economic links between companies with similar
businesses. The first signal, introduced in all regions, identifies companies linked by a common theme based on company
descriptions. The second signal, introduced in the U.S. region, looks at searches made on the same day for regulatory filings of
multiple companies to identify linked companies.
Additionally, we introduced an Environmental, Social and Governance (“ESG”) signal within our Management theme that helps us
quantify reputational risk. The signal, introduced in all regions except Canada, looks at ESG risk events to form a view of the peak
risk of the company from an ESG perspective.
What was the Fund’s sector positioning relative to its benchmark index at the end of the Reporting Period?
As of December 31, 2017, the Fund was overweight the real estate, energy and health care sectors relative to the S&P 500® Index.
The Fund was underweight consumer staples, telecommunication services, financials and industrials and was rather neutrally
weighted in utilities, materials, information technology and consumer discretionary compared to the benchmark index on the same
date.
Were there any changes to the Fund’s portfolio management team during the Reporting Period?
During the Reporting Period, one Vice President left the Equity Alpha team and two Vice Presidents joined the team. QIS employs
a globally integrated team of more than 90 professionals, with an additional 75-plus professionals dedicated to trading, information
technology and development of analytical tools.
What is your strategy going forward for the Fund?
Looking ahead, we continue to believe that less expensive stocks may outpace more expensive stocks, and stocks with good
momentum are likely to outperform those with poor momentum. We intend to maintain our focus on seeking companies about
which fundamental research analysts are becoming more positive as well as profitable companies with sustainable earnings and a
track record of using their capital to enhance shareholder value. As such, we anticipate remaining fully invested with long-term
performance likely to be the result of stock selection rather than sector or capitalization allocations.
We stand behind our investment philosophy that sound economic investment principles, coupled with a disciplined quantitative
approach, can provide strong, uncorrelated returns over the long term. Our research agenda is robust, and we continue to enhance
our existing models, add new proprietary forecasting signals and improve our trading execution as we seek to provide the most
value to our shareholders.
3
G O L D M A N S A C H S V A R I A B L E I N S U R A N C E T R U S T U . S . E Q U I T Y I N S I G H T S F U N D
Index Definitions
S&P 500® Index is the Standard & Poor’s 500 Composite Index of 500 stocks, an unmanaged index of common stock prices. The
figures for the index do not include any deduction for fees, expenses or taxes. It is not possible to invest directly in an index.
Russell 2000® Index is an unmanaged index of common stock prices that measures the performance of the 2000 smallest companies
in the Russell 3000® Index. The figures for the index do not include any deduction for fees, expenses or taxes. It is not possible to
invest directly in an index.
Russell Midcap® Index measures the performance of the 800 smallest companies in the Russell 1000® Index, which represents
approximately 25% of the total market capitalization of the Russell 1000 Index. It is not possible to invest directly in an index.
Russell 1000® Index measures the performance of the 1,000 largest companies in the Russell 3000® Index, which represents
approximately 92% of the total market capitalization of the Russell 3000 Index. It is not possible to invest directly in an index.
4
F U N D B A S I C S
U.S. Equity Insights Fundas of December 31, 2017
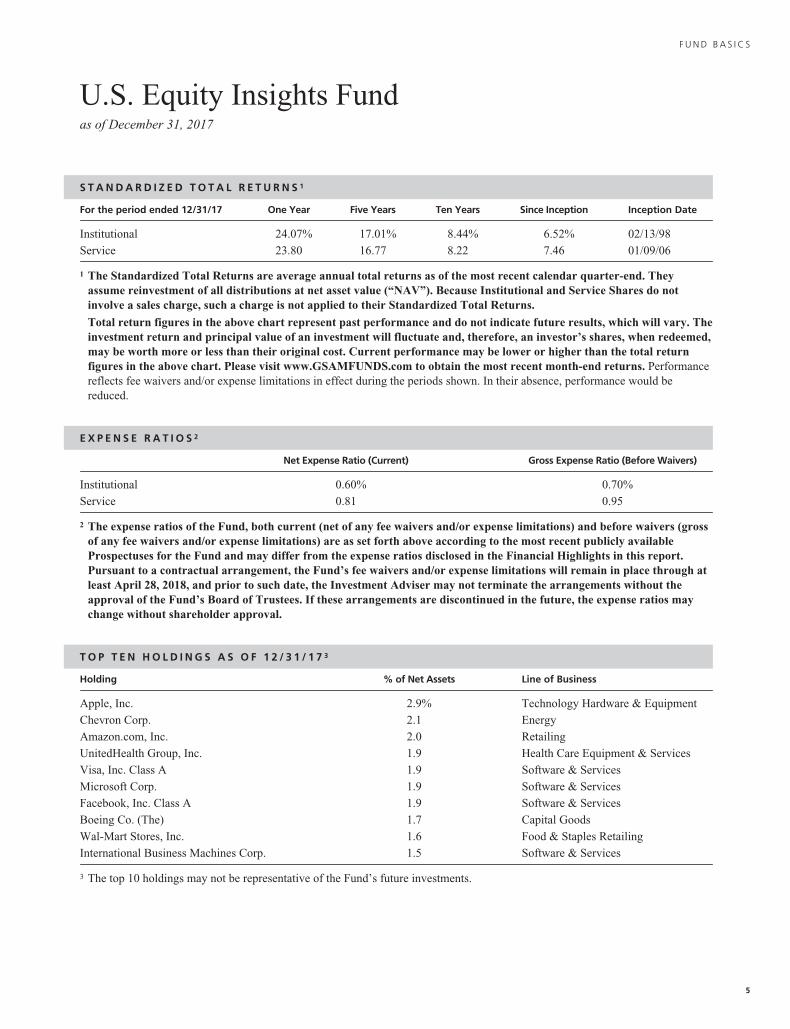
S T A N D A R D I Z E D T O T A L R E T U R N S 1
For the period ended 12/31/17 One Year Five Years Ten Years Since Inception Inception Date
Institutional 24.07% 17.01% 8.44% 6.52% 02/13/98
Service 23.80 16.77 8.22 7.46 01/09/06
1 The Standardized Total Returns are average annual total returns as of the most recent calendar quarter-end. Theyassume reinvestment of all distributions at net asset value (“NAV”). Because Institutional and Service Shares do notinvolve a sales charge, such a charge is not applied to their Standardized Total Returns.
Total return figures in the above chart represent past performance and do not indicate future results, which will vary. Theinvestment return and principal value of an investment will fluctuate and, therefore, an investor’s shares, when redeemed,may be worth more or less than their original cost. Current performance may be lower or higher than the total returnfigures in the above chart. Please visit www.GSAMFUNDS.com to obtain the most recent month-end returns. Performancereflects fee waivers and/or expense limitations in effect during the periods shown. In their absence, performance would bereduced.
E X P E N S E R A T I O S 2
Net Expense Ratio (Current) Gross Expense Ratio (Before Waivers)
Institutional 0.60% 0.70%
Service 0.81 0.95
2 The expense ratios of the Fund, both current (net of any fee waivers and/or expense limitations) and before waivers (grossof any fee waivers and/or expense limitations) are as set forth above according to the most recent publicly availableProspectuses for the Fund and may differ from the expense ratios disclosed in the Financial Highlights in this report.Pursuant to a contractual arrangement, the Fund’s fee waivers and/or expense limitations will remain in place through atleast April 28, 2018, and prior to such date, the Investment Adviser may not terminate the arrangements without theapproval of the Fund’s Board of Trustees. If these arrangements are discontinued in the future, the expense ratios maychange without shareholder approval.
T O P T E N H O L D I N G S A S O F 1 2 / 3 1 / 1 7 3
Holding % of Net Assets Line of Business
Apple, Inc. 2.9% Technology Hardware & Equipment
Chevron Corp. 2.1 Energy
Amazon.com, Inc. 2.0 Retailing
UnitedHealth Group, Inc. 1.9 Health Care Equipment & Services
Visa, Inc. Class A 1.9 Software & Services
Microsoft Corp. 1.9 Software & Services
Facebook, Inc. Class A 1.9 Software & Services
Boeing Co. (The) 1.7 Capital Goods
Wal-Mart Stores, Inc. 1.6 Food & Staples Retailing
International Business Machines Corp. 1.5 Software & Services
3 The top 10 holdings may not be representative of the Fund’s future investments.
5

F U N D B A S I C S
F U N D v s . B E N C H M A R K S E C T O R A L L O C A T I O N S 4
As of December 31, 2017
0%
10%
15%
5%
20%
30%
Fund S&P 500® Index
Info
rmat
ion
Tech
no
log
y23
.7%
23.0
%
Fin
anci
als
14.8
%
13.6
%
10.3
%In
du
stri
als
9.0%
2.9%
Rea
l Est
ate
5.8%
Tele
com
mu
nic
atio
nSe
rvic
es
0.0%
2.1%
Uti
litie
s2.
9%3.7%
Hea
lth
Car
e13
.8%15
.9%
Co
nsu
mer
Dis
cret
ion
ary
12.2
%
11.3
%
Ener
gy
6.1%
8.3%
Co
nsu
mer
Sta
ple
s8.
2%
5.8%
Mat
eria
ls3.
0%3.6%
25%
4 The Fund is actively managed and, as such, its composition may differ over time. Consequently, the Fund’s overall sectorallocations may differ from percentages contained in the graph above. The graph categorizes investments using Global IndustryClassification Standard (“GICS”), however, the sector classifications used by the portfolio management team may differ fromGICS. The percentage shown for each investment category reflects the value of investments in that category as a percentage ofmarket value. The graph depicts the Fund’s investments but may not represent the Fund’s market exposure due to the exclusion ofcertain derivatives, if any, as listed in the Additional Investment Information section of the Schedule of Investments.
6

G O L D M A N S A C H S V A R I A B L E I N S U R A N C E T R U S T U . S . E Q U I T Y I N S I G H T S F U N D
Performance SummaryDecember 31, 2017
The following graph shows the value, as of December 31, 2017, of a $10,000 investment made on January 1, 2008 in the
Institutional Shares at NAV. For comparative purposes, the performance of the Fund’s benchmark, the S&P 500® Index, is shown.
This performance data represents past performance and should not be considered indicative of future performance, which will
fluctuate with changes in market conditions. These performance fluctuations may cause an investor’s shares, when redeemed, to be
worth more or less than their original cost. Performance reflects Fund level expenses but does not reflect fees and expenses
associated with any variable annuity contract or variable life insurance policy that uses the Fund as an investment option for any
contract or policy. Had performance reflected all of those fees and expenses, performance would have been reduced. Performance
reflects applicable fee waivers and/or expense limitations in effect during the periods shown, and in their absence, performance
would be reduced. Performance of Service Shares will vary from Institutional Shares due to differences in class specific fees. In
addition to the Investment Adviser’s decisions regarding issuer/industry investment selection and allocation, other factors may
affect Fund performance. These factors include, but are not limited to, Fund operating fees and expenses, portfolio turnover, and
subscription and redemption cash flows affecting the Fund.
U.S. Equity Insights Fund’s 10 Year Performance
Performance of a $10,000 investment, with distributions reinvested, from January 1, 2008 through December 31, 2017.
12/1712/1612/1512/1412/1312/1212/1112/1012/0912/081/1/08
Institutional Shares
$25,000
$22,504$22,603
$20,000
$15,000
$10,000
$5,000
S&P 500® Index
Average Annual Total Return through December 31, 2017 One Year Five Years Ten Years Since Inception
Institutional (Commenced February 13, 1998) 24.07% 17.01% 8.44% 6.52%
Service (Commenced January 9, 2006) 23.80% 16.77% 8.22% 7.46%
7

G O L D M A N S A C H S V A R I A B L E I N S U R A N C E T R U S T U . S . E Q U I T Y I N S I G H T S F U N D
Schedule of InvestmentsDecember 31, 2017
Shares Description Value
Common Stocks – 99.2%
Automobiles & Components – 1.9%22,508 Aptiv plc $ 1,909,35418,826 BorgWarner, Inc. 961,82080,390 General Motors Co. 3,295,18610,586 Gentex Corp. 221,7778,036 Lear Corp. 1,419,640
7,807,777
Banks – 6.4%35,983 Bank of America Corp. 1,062,218
112,286 Citizens Financial Group, Inc. 4,713,76652,892 Comerica, Inc. 4,591,554
154,226 Fifth Third Bancorp 4,679,21724,939 JPMorgan Chase & Co. 2,666,977
233,799 KeyCorp 4,715,72689,733 Regions Financial Corp. 1,550,5868,806 SVB Financial Group* 2,058,579
11,593 Wells Fargo & Co. 703,347
26,741,970
Capital Goods – 6.2%80,255 Allison Transmission Holdings, Inc. 3,456,58343,329 AMETEK, Inc. 3,140,05324,684 Boeing Co. (The) 7,279,55939,249 Caterpillar, Inc. 6,184,8575,444 Fortune Brands Home & Security,
Inc. 372,587103,614 Masco Corp. 4,552,799
3,711 PACCAR, Inc. 263,77814,488 Toro Co. (The) 945,052
26,195,268
Commercial & Professional Services – 1.0%56,915 IHS Markit Ltd.* 2,569,71229,088 KAR Auction Services, Inc. 1,469,2353,451 Waste Management, Inc. 297,821
4,336,768
Consumer Durables & Apparel – 1.3%21,840 DR Horton, Inc. 1,115,3696,710 Lennar Corp. Class A 424,340
134 Lennar Corp. Class B 6,925126 NVR, Inc.* 442,036
108,321 PulteGroup, Inc. 3,601,673
5,590,343
Consumer Services – 2.4%16,494 Hilton Worldwide Holdings, Inc. 1,317,21122,047 International Game Technology plc 584,46651,970 Las Vegas Sands Corp. 3,611,3953,461 Marriott International, Inc. Class A 469,762
84,437 MGM Resorts International 2,819,3515,637 Royal Caribbean Cruises Ltd. 672,3818,257 Yum Brands, Inc. 673,854
10,148,420
Shares Description Value
Common Stocks – (continued)
Diversified Financials – 4.3%146,804 Ally Financial, Inc. $ 4,280,805
2,747 Ameriprise Financial, Inc. 465,53471,140 Bank of New York Mellon Corp.
(The) 3,831,60013,848 Berkshire Hathaway, Inc. Class B* 2,744,95120,681 Leucadia National Corp. 547,84015,181 S&P Global, Inc. 2,571,66185,050 Synchrony Financial 3,283,7819,958 Voya Financial, Inc. 492,622
18,218,794
Energy – 8.3%12,075 Andeavor 1,380,65629,449 Cabot Oil & Gas Corp. 842,24170,002 Chevron Corp. 8,763,5505,801 Cimarex Energy Co. 707,780
15,058 EOG Resources, Inc. 1,624,90930,586 Exxon Mobil Corp. 2,558,21331,269 HollyFrontier Corp. 1,601,59859,179 Marathon Oil Corp. 1,001,90173,555 Marathon Petroleum Corp. 4,853,15920,555 National Oilwell Varco, Inc. 740,3918,041 Newfield Exploration Co.* 253,533
50,926 Phillips 66 5,151,16556,299 Valero Energy Corp. 5,174,441
34,653,537
Food & Staples Retailing – 1.8%10,441 Walgreens Boots Alliance, Inc. 758,22670,003 Wal-Mart Stores, Inc. 6,912,796
7,671,022
Food, Beverage & Tobacco – 1.9%120,016 Conagra Brands, Inc. 4,521,003
4,854 General Mills, Inc. 287,7933,639 Hershey Co. (The) 413,063
33,913 Molson Coors Brewing Co. Class B 2,783,240
8,005,099
Health Care Equipment & Services – 8.6%23,340 Anthem, Inc. 5,251,73326,780 Baxter International, Inc. 1,731,05971,942 Boston Scientific Corp.* 1,783,44222,384 Centene Corp.* 2,258,09822,477 Cigna Corp. 4,564,8542,672 Cooper Cos., Inc. (The) 582,175
55,396 Danaher Corp. 5,141,85719,923 Humana, Inc. 4,942,2997,500 Medtronic plc 605,625
36,995 UnitedHealth Group, Inc. 8,155,9185,942 WellCare Health Plans, Inc.* 1,194,996
36,212,056
Household & Personal Products – 2.0%72,162 Colgate-Palmolive Co. 5,444,62322,043 Kimberly-Clark Corp. 2,659,709
8 The accompanying notes are an integral part of these financial statements.
G O L D M A N S A C H S V A R I A B L E I N S U R A N C E T R U S T U . S . E Q U I T Y I N S I G H T S F U N D
Shares Description Value
Common Stocks – (continued)
Household & Personal Products – (continued)3,481 Procter & Gamble Co. (The) $ 319,834
8,424,166
Insurance – 2.8%47,647 Allstate Corp. (The) 4,989,11721,760 Aon plc 2,915,8406,894 Assured Guaranty Ltd. 233,5005,281 Athene Holding Ltd. Class A* 273,081
27,082 Principal Financial Group, Inc. 1,910,90621,807 Progressive Corp. (The) 1,228,170
11,550,614
Materials – 3.5%7,444 Eastman Chemical Co. 689,612
11,760 Freeport-McMoRan, Inc.* 222,96980,329 Graphic Packaging Holding Co. 1,241,08344,969 LyondellBasell Industries NV Class A 4,960,9809,234 PPG Industries, Inc. 1,078,716
23,183 Sealed Air Corp. 1,142,92239,000 Steel Dynamics, Inc. 1,682,0709,437 Westlake Chemical Corp. 1,005,324
45,180 WestRock Co. 2,855,828
14,879,504
Media – 0.3%23,779 Comcast Corp. Class A 952,34912,358 News Corp. Class A 200,323
1,152,672
Pharmaceuticals, Biotechnology & Life Sciences – 7.2%20,561 AbbVie, Inc. 1,988,4548,995 Alexion Pharmaceuticals, Inc.* 1,075,712
31,049 Allergan plc 5,078,99633,729 Amgen, Inc. 5,865,47316,307 Biogen, Inc.* 5,194,92135,955 Celgene Corp.* 3,752,26420,747 Exelixis, Inc.* 630,7091,374 Jazz Pharmaceuticals plc* 185,009
20,381 Johnson & Johnson 2,847,6333,402 Mettler-Toledo International, Inc.* 2,107,6079,827 Vertex Pharmaceuticals, Inc.* 1,472,674
30,199,452
Real Estate – 5.8%138,499 American Homes 4 Rent Class A
(REIT) 3,024,81837,216 American Tower Corp. (REIT) 5,309,60719,136 CBRE Group, Inc. Class A* 828,7807,322 Equinix, Inc. (REIT) 3,318,4772,770 Equity LifeStyle Properties, Inc.
(REIT) 246,5855,663 Gaming and Leisure Properties, Inc.
(REIT) 209,531219,816 Host Hotels & Resorts, Inc. (REIT) 4,363,348
2,436 Jones Lang LaSalle, Inc. 362,79320,317 Kimco Realty Corp. (REIT) 368,754
Shares Description Value
Common Stocks – (continued)
Real Estate – (continued)21,069 Prologis, Inc. (REIT) $ 1,359,16146,280 Realogy Holdings Corp. 1,226,42023,017 SBA Communications Corp. (REIT)* 3,760,057
24,378,331
Retailing – 5.3%7,306 Amazon.com, Inc.* 8,544,148
28,121 Best Buy Co., Inc. 1,925,4451,736 Expedia, Inc. 207,921
53,937 Lowe’s Cos., Inc. 5,012,9057,838 Netflix, Inc.* 1,504,5824,742 Pool Corp. 614,800
861 Priceline Group, Inc. (The)* 1,496,19436,184 Ross Stores, Inc. 2,903,766
22,209,761
Semiconductors & Semiconductor Equipment – 3.0%86,596 Applied Materials, Inc. 4,426,7887,103 Broadcom Ltd. 1,824,7615,325 Lam Research Corp. 980,173
24,991 Maxim Integrated Products, Inc. 1,306,52997,752 Micron Technology, Inc.* 4,019,562
12,557,813
Software & Services – 14.7%32,919 Adobe Systems, Inc.* 5,768,7263,068 Alliance Data Systems Corp. 777,6775,995 Alphabet, Inc. Class A* 6,315,1335,827 Alphabet, Inc. Class C* 6,097,373
65,021 Cadence Design Systems, Inc.* 2,719,17815,418 Citrix Systems, Inc.* 1,356,7849,804 Conduent, Inc.* 158,433
457 CoStar Group, Inc.* 135,70622,076 Electronic Arts, Inc.* 2,319,30544,121 Facebook, Inc. Class A* 7,785,59241,452 International Business Machines
Corp. 6,359,56630,548 Intuit, Inc. 4,819,86393,838 Microsoft Corp. 8,026,9034,775 PayPal Holdings, Inc.* 351,5354,139 Sabre Corp. 84,8496,104 Total System Services, Inc. 482,765
71,220 Visa, Inc. Class A 8,120,504
61,679,892
Technology Hardware & Equipment – 5.1%70,914 Apple, Inc. 12,000,77617,495 F5 Networks, Inc.* 2,295,69433,706 Flex Ltd.* 606,37152,453 HP, Inc. 1,102,03744,221 Jabil, Inc. 1,160,80155,788 Western Digital Corp. 4,436,820
21,602,499
Telecommunication Services – 0.0%1,647 AT&T, Inc. 64,035
The accompanying notes are an integral part of these financial statements. 9

G O L D M A N S A C H S V A R I A B L E I N S U R A N C E T R U S T U . S . E Q U I T Y I N S I G H T S F U N D
Schedule of Investments (continued)December 31, 2017
Shares Description Value
Common Stocks – (continued)
Transportation – 1.7%92,995 CSX Corp. $ 5,115,6558,840 Kansas City Southern 930,1453,366 Old Dominion Freight Line, Inc. 442,7976,437 Ryder System, Inc. 541,802
7,030,399
Utilities – 3.7%303,885 AES Corp. 3,291,07534,641 CMS Energy Corp. 1,638,51960,572 Exelon Corp. 2,387,14230,692 MDU Resources Group, Inc. 825,00179,391 PG&E Corp. 3,559,09994,393 SCANA Corp. 3,754,9542,585 Vistra Energy Corp.* 47,357
15,503,147
TOTAL INVESTMENTS – 99.2%(Cost $349,815,140) $416,813,339
OTHER ASSETS IN EXCESS OFLIABIL IT IES – 0.8% 3,348,839
NET ASSETS – 100.0% $420,162,178
The percentage shown for each investment categoryreflects the value of investments in that category as apercentage of net assets.* Non-income producing security.
Investment Abbreviation:REIT—Real Estate Investment Trust
A D D I T I O N A L I N V E S T M E N T I N F O R M A T I O N
FUTURES CONTRACTS — At December 31, 2017, the Fund had the following futures contracts:
DescriptionNumber ofContracts
ExpirationDate
NotionalAmount
UnrealizedAppreciation/(Depreciation)
Long position contracts:S&P 500 E-Mini Index 7 03/16/2018 $936,600 $4,030
10 The accompanying notes are an integral part of these financial statements.
G O L D M A N S A C H S V A R I A B L E I N S U R A N C E T R U S T U . S . E Q U I T Y I N S I G H T S F U N D
Statement of Assets and LiabilitiesDecember 31, 2017
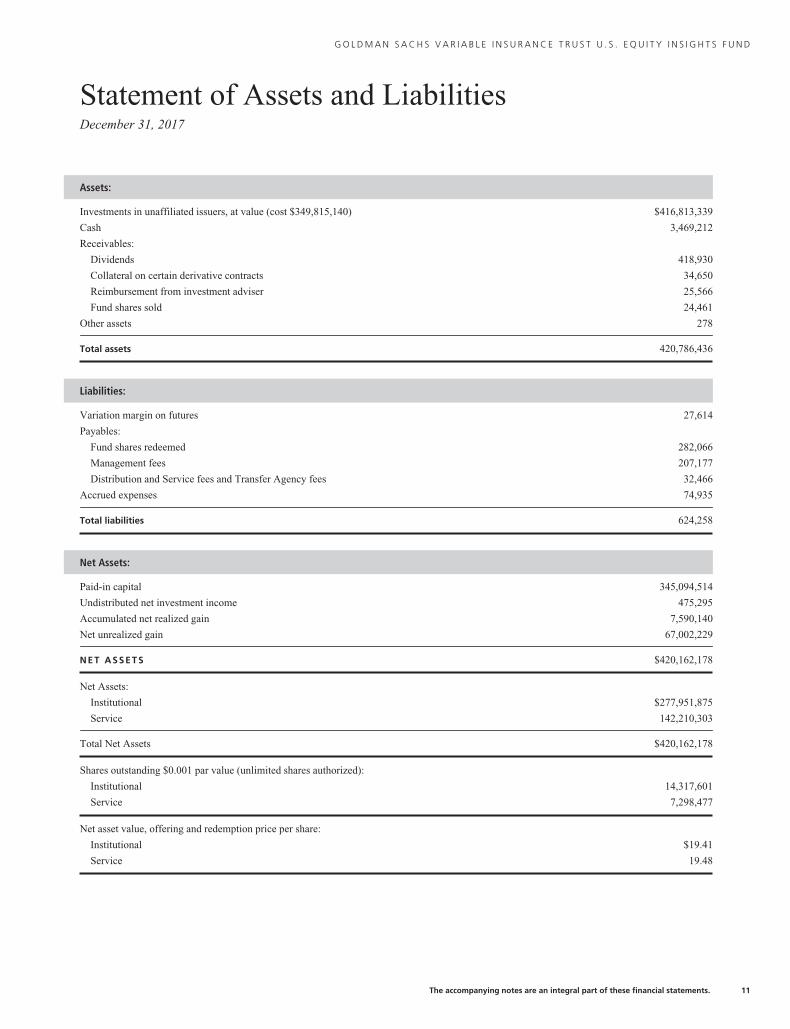
Assets:
Investments in unaffiliated issuers, at value (cost $349,815,140) $416,813,339
Cash 3,469,212
Receivables:
Dividends 418,930
Collateral on certain derivative contracts 34,650
Reimbursement from investment adviser 25,566
Fund shares sold 24,461
Other assets 278
Total assets 420,786,436
Liabilities:
Variation margin on futures 27,614
Payables:
Fund shares redeemed 282,066
Management fees 207,177
Distribution and Service fees and Transfer Agency fees 32,466
Accrued expenses 74,935
Total liabilities 624,258
Net Assets:
Paid-in capital 345,094,514
Undistributed net investment income 475,295
Accumulated net realized gain 7,590,140
Net unrealized gain 67,002,229
NET ASSETS $420,162,178
Net Assets:
Institutional $277,951,875
Service 142,210,303
Total Net Assets $420,162,178
Shares outstanding $0.001 par value (unlimited shares authorized):
Institutional 14,317,601
Service 7,298,477
Net asset value, offering and redemption price per share:
Institutional $19.41
Service 19.48
The accompanying notes are an integral part of these financial statements. 11
G O L D M A N S A C H S V A R I A B L E I N S U R A N C E T R U S T U . S . E Q U I T Y I N S I G H T S F U N D
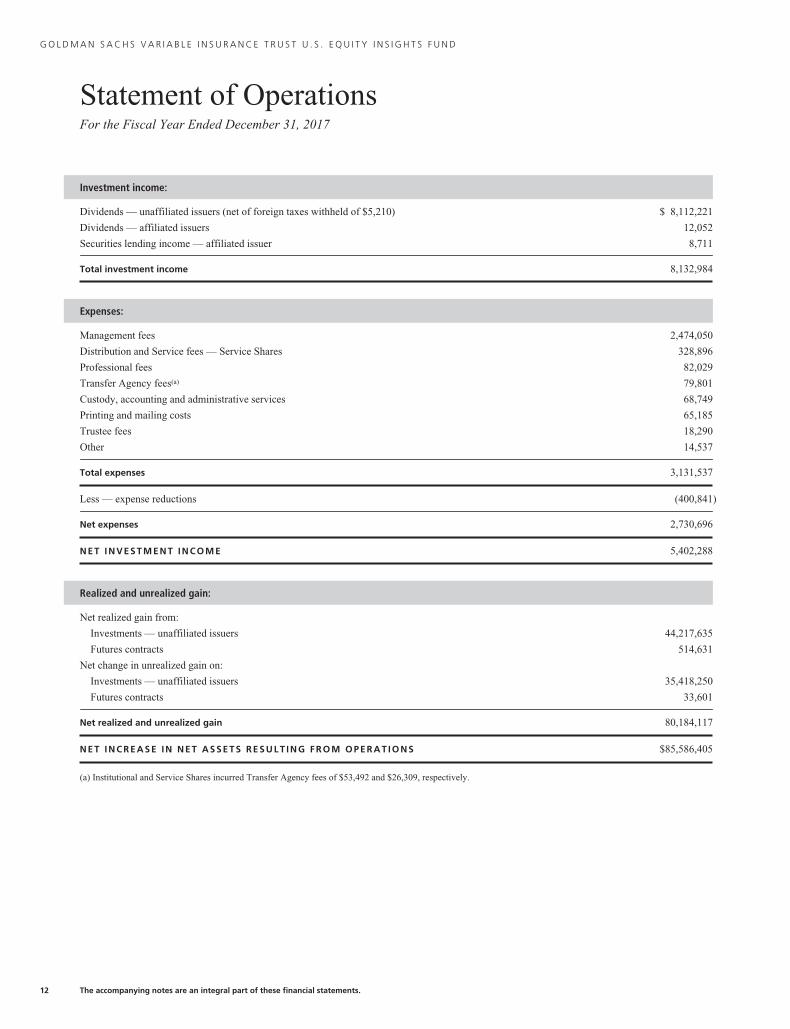
Statement of OperationsFor the Fiscal Year Ended December 31, 2017
Investment income:
Dividends — unaffiliated issuers (net of foreign taxes withheld of $5,210) $ 8,112,221
Dividends — affiliated issuers 12,052
Securities lending income — affiliated issuer 8,711
Total investment income 8,132,984
Expenses:
Management fees 2,474,050
Distribution and Service fees — Service Shares 328,896
Professional fees 82,029
Transfer Agency fees(a) 79,801
Custody, accounting and administrative services 68,749
Printing and mailing costs 65,185
Trustee fees 18,290
Other 14,537
Total expenses 3,131,537
Less — expense reductions (400,841)
Net expenses 2,730,696
NET INVESTMENT INCOME 5,402,288
Realized and unrealized gain:
Net realized gain from:
Investments — unaffiliated issuers 44,217,635
Futures contracts 514,631
Net change in unrealized gain on:
Investments — unaffiliated issuers 35,418,250
Futures contracts 33,601
Net realized and unrealized gain 80,184,117
NET INCREASE IN NET ASSETS RESULT ING FROM OPERAT IONS $85,586,405
(a) Institutional and Service Shares incurred Transfer Agency fees of $53,492 and $26,309, respectively.
12 The accompanying notes are an integral part of these financial statements.
G O L D M A N S A C H S V A R I A B L E I N S U R A N C E T R U S T U . S . E Q U I T Y I N S I G H T S F U N D
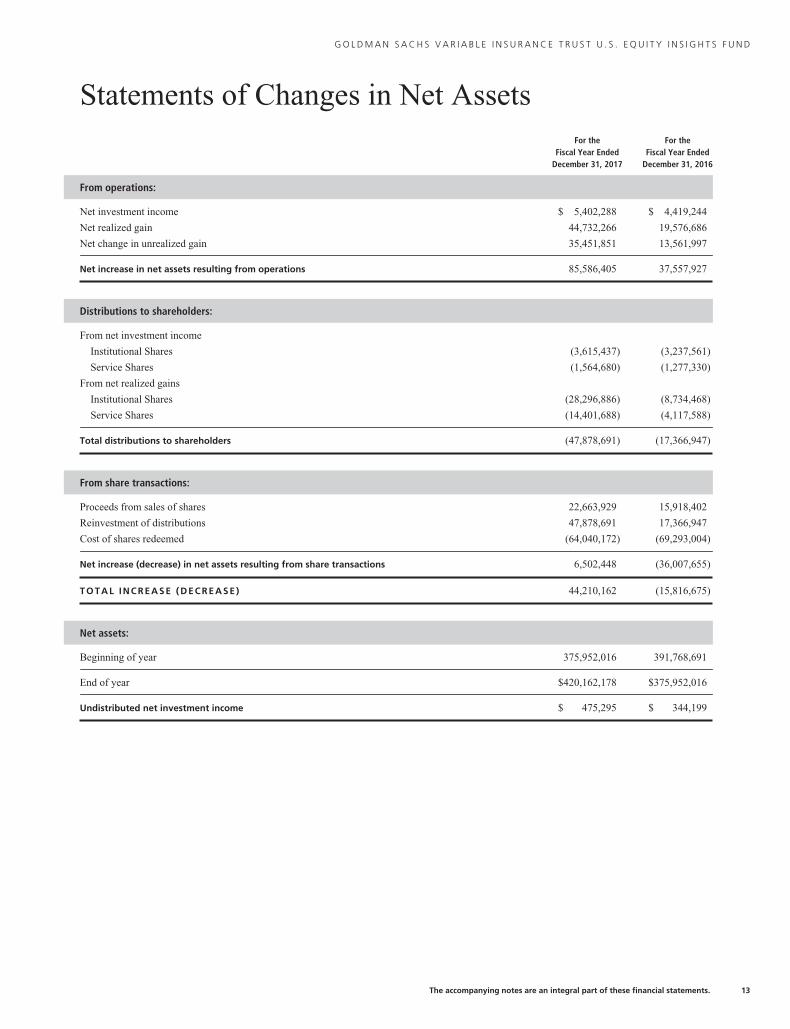
Statements of Changes in Net AssetsFor the
Fiscal Year EndedDecember 31, 2017
For theFiscal Year Ended
December 31, 2016
From operations:
Net investment income $ 5,402,288 $ 4,419,244
Net realized gain 44,732,266 19,576,686
Net change in unrealized gain 35,451,851 13,561,997
Net increase in net assets resulting from operations 85,586,405 37,557,927
Distributions to shareholders:
From net investment income
Institutional Shares (3,615,437) (3,237,561)
Service Shares (1,564,680) (1,277,330)
From net realized gains
Institutional Shares (28,296,886) (8,734,468)
Service Shares (14,401,688) (4,117,588)
Total distributions to shareholders (47,878,691) (17,366,947)
From share transactions:
Proceeds from sales of shares 22,663,929 15,918,402
Reinvestment of distributions 47,878,691 17,366,947
Cost of shares redeemed (64,040,172) (69,293,004)
Net increase (decrease) in net assets resulting from share transactions 6,502,448 (36,007,655)
TOTAL INCREASE (DECREASE) 44,210,162 (15,816,675)
Net assets:
Beginning of year 375,952,016 391,768,691
End of year $420,162,178 $375,952,016
Undistributed net investment income $ 475,295 $ 344,199
The accompanying notes are an integral part of these financial statements. 13
GO
LD
MA
NS
AC
HS
VA
RIA
BL
EIN
SU
RA
NC
ET
RU
ST
U.S
.E
QU
ITY
INS
IGH
TS
FU
ND
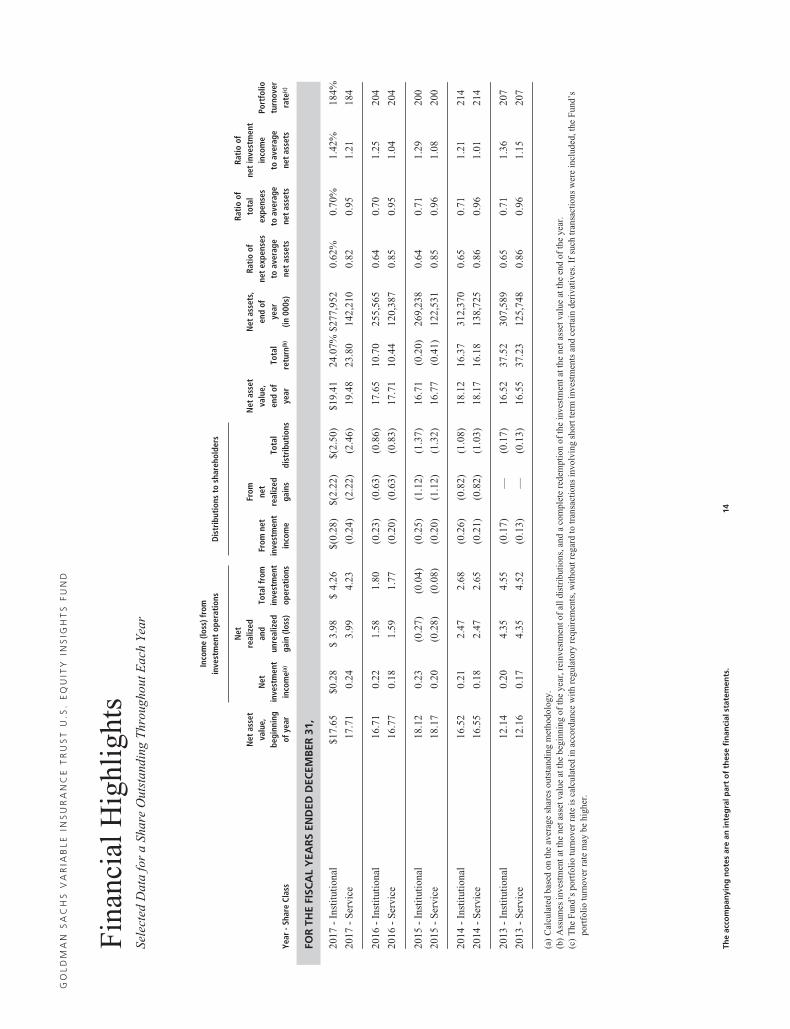
Fin
anci
alH
ighl
ight
sSe
lect
edD
ata
for
aSh
are
Out
stan
ding
Thr
ough
outE
ach
Yea
r
Inco
me
(loss
)fro
min
vest
men
top
erat
ions
Dis
trib
utio
nsto
shar
ehol
ders
Year
-Sha
reCl
ass
Net
asse
tva
lue,
begi
nnin
gof
year
Net
inve
stm
ent
inco
me(
a)
Net
real
ized
and
unre
aliz
edga
in(lo
ss)
Tota
lfro
min
vest
men
top
erat
ions
From
net
inve
stm
ent
inco
me
From ne
tre
aliz
edga
ins
Tota
ldi
stri
buti
ons
Net
asse
tva
lue,
end
ofye
arTo
tal
retu
rn(b
)
Net
asse
ts,
end
ofye
ar(in
000s
)
Rati
oof
net
expe
nses
toav
erag
ene
tas
sets
Rati
oof
tota
lex
pens
esto
aver
age
net
asse
ts
Rati
oof
net
inve
stm
ent
inco
me
toav
erag
ene
tas
sets
Port
folio
turn
over
rate
(c)
FOR
THE
FISC
AL
YEA
RS
END
EDD
ECEM
BER
31,
2017
-In
stit
utio
nal
$17.
65$0
.28
$3.
98$
4.26
$(0.
28)
$(2.
22)
$(2.
50)
$19.
4124
.07%
$277
,952
0.62
%0.
70%
1.42
%18
4%
2017
-S
ervi
ce17
.71
0.24
3.99
4.23
(0.2
4)(2
.22)
(2.4
6)19
.48
23.8
014
2,21
00.
820.
951.
2118
4
2016
-In
stit
utio
nal
16.7
10.
221.
581.
80(0
.23)
(0.6
3)(0
.86)
17.6
510
.70
255,
565
0.64
0.70
1.25
204
2016
-S
ervi
ce16
.77
0.18
1.59
1.77
(0.2
0)(0
.63)
(0.8
3)17
.71
10.4
412
0,38
70.
850.
951.
0420
4
2015
-In
stit
utio
nal
18.1
20.
23(0
.27)
(0.0
4)(0
.25)
(1.1
2)(1
.37)
16.7
1(0
.20)
269,
238
0.64
0.71
1.29
200
2015
-S
ervi
ce18
.17
0.20
(0.2
8)(0
.08)
(0.2
0)(1
.12)
(1.3
2)16
.77
(0.4
1)12
2,53
10.
850.
961.
0820
0
2014
-In
stit
utio
nal
16.5
20.
212.
472.
68(0
.26)
(0.8
2)(1
.08)
18.1
216
.37
312,
370
0.65
0.71
1.21
214
2014
-S
ervi
ce16
.55
0.18
2.47
2.65
(0.2
1)(0
.82)
(1.0
3)18
.17
16.1
813
8,72
50.
860.
961.
0121
4
2013
-In
stit
utio
nal
12.1
40.
204.
354.
55(0
.17)
—(0
.17)
16.5
237
.52
307,
589
0.65
0.71
1.36
207
2013
-S
ervi
ce12
.16
0.17
4.35
4.52
(0.1
3)—
(0.1
3)16
.55
37.2
312
5,74
80.
860.
961.
1520
7
(a)
Cal
cula
ted
base
don
the
aver
age
shar
esou
tsta
ndin
gm
etho
dolo
gy.
(b)
Ass
umes
inve
stm
enta
tthe
neta
sset
valu
eat
the
begi
nnin
gof
the
year
,rei
nves
tmen
tof
alld
istr
ibut
ions
,and
aco
mpl
ete
rede
mpt
ion
ofth
ein
vest
men
tatt
hene
tass
etva
lue
atth
een
dof
the
year
.(c
)T
heF
und’
spo
rtfo
lio
turn
over
rate
isca
lcul
ated
inac
cord
ance
wit
hre
gula
tory
requ
irem
ents
,wit
hout
rega
rdto
tran
sact
ions
invo
lvin
gsh
ortt
erm
inve
stm
ents
and
cert
ain
deri
vati
ves.
Ifsu
chtr
ansa
ctio
nsw
ere
incl
uded
,the
Fun
d’s
port
foli
otu
rnov
erra
tem
aybe
high
er.
The
acco
mp
anyi
ng
no
tes
are
anin
teg
ralp
art
of
thes
efi
nan
cial
stat
emen
ts.
14
G O L D M A N S A C H S V A R I A B L E I N S U R A N C E T R U S T U . S . E Q U I T Y I N S I G H T S F U N D
Notes to Financial StatementsDecember 31, 2017
1 . O R G A N I Z A T I O N
Goldman Sachs Variable Insurance Trust (the “Trust” or “VIT”) is a Delaware statutory trust registered under the Investment
Company Act of 1940, as amended (the “Act”), as an open-end management investment company. The Trust includes the Goldman
Sachs U.S. Equity Insights Fund (the “Fund”). The Fund is a diversified portfolio under the Act offering two classes of shares —
Institutional and Service Shares. Shares of the Trust are offered to separate accounts of participating life insurance companies for
the purpose of funding variable annuity contracts and variable life insurance policies.
Goldman Sachs Asset Management, L.P. (“GSAM”), an affiliate of Goldman Sachs & Co. LLC (formerly, Goldman, Sachs &
Co.) (“Goldman Sachs”), serves as investment adviser to the Fund pursuant to a management agreement (the “Agreement”) with
the Trust.
2 . S I G N I F I C A N T A C C O U N T I N G P O L I C I E S
The financial statements have been prepared in accordance with accounting principles generally accepted in the United States of
America (“GAAP”) and require management to make estimates and assumptions that may affect the reported amounts and
disclosures. Actual results may differ from those estimates and assumptions.
A. Investment Valuation — The Fund’s valuation policy is to value investments at fair value.
B. Investment Income and Investments — Investment income includes interest income, dividend income, and securities
lending income. Interest income is accrued daily and adjusted for amortization of premiums and accretion of discounts. Dividend
income is recognized on ex-dividend date or, for certain foreign securities, as soon as such information is obtained subsequent to
the ex-dividend date. Investment transactions are reflected on trade date. Realized gains and losses are calculated using identified
cost. Investment transactions are recorded on the following business day for daily net asset value (“NAV”) calculations. Investment
income is recorded net of any foreign withholding taxes, less any amounts reclaimable. The Fund may file withholding tax reclaims
in certain jurisdictions to recover a portion of amounts previously withheld. Any foreign capital gains tax is accrued daily based
upon net unrealized gains, and is payable upon sale of such investments. Distributions received from the Fund’s investments in
United States (“U.S.”) real estate investment trusts (“REITs”) may be characterized as ordinary income, net capital gain or a return
of capital. A return of capital is recorded by the Fund as a reduction to the cost basis of the REIT.
For derivative contracts, realized gains and losses are recorded upon settlement of the contract.
C. Class Allocations and Expenses — Investment income, realized and unrealized gain (loss), if any, and non-class specific
expenses of the Fund are allocated daily based upon the proportion of net assets of each class. Non-class specific expenses directly
incurred by the Fund are charged to the Fund, while such expenses incurred by the Trust are allocated across the Fund on a straight-
line and/or pro-rata basis depending upon the nature of the expenses. Class specific expenses, where applicable, are borne by the
respective share classes and include Distribution and Service and Transfer Agency fees.
D. Federal Taxes and Distributions to Shareholders — It is the Fund’s policy to comply with the requirements of the
Internal Revenue Code of 1986, as amended (the “Code”), applicable to regulated investment companies (mutual funds) and to
distribute each year substantially all of its investment company taxable income and capital gains to its shareholders. Accordingly,
the Fund is not required to make any provisions for the payment of federal income tax. Distributions to shareholders are recorded
on the ex-dividend date. Income and capital gains distributions, if any, are declared and paid annually.
Net capital losses, if any, are carried forward to future fiscal years and may be used to the extent allowed by the Code to offset
any future capital gains. Losses that are carried forward will retain their character as either short-term or long-term capital losses.
Utilization of capital loss carryforwards will reduce the requirement of future capital gains distributions.
The characterization of distributions to shareholders for financial reporting purposes is determined in accordance with federal
income tax rules, which may differ from GAAP. The source of the Fund’s distributions may be shown in the accompanying
financial statements as either from net investment income, net realized gain or capital. Certain components of the Fund’s net assets
on the Statement of Assets and Liabilities reflect permanent GAAP/tax differences based on the appropriate tax character.
15
G O L D M A N S A C H S V A R I A B L E I N S U R A N C E T R U S T U . S . E Q U I T Y I N S I G H T S F U N D
Notes to Financial Statements (continued)December 31, 2017
3 . I N V E S T M E N T S A N D F A I R V A L U E M E A S U R E M E N T S
U.S. GAAP defines the fair value of a financial instrument as the amount that would be received to sell an asset or paid to transfer a
liability in an orderly transaction between market participants at the measurement date (i.e., the exit price); the Fund’s policy is to
use the market approach. GAAP establishes a fair value hierarchy that prioritizes the inputs to valuation techniques used to measure
fair value. The hierarchy gives the highest priority to unadjusted quoted prices in active markets for identical assets or liabilities
(Level 1 measurements) and the lowest priority to unobservable inputs (Level 3 measurements). The levels used for classifying
investments are not necessarily an indication of the risk associated with investing in these investments. The three levels of the fair
value hierarchy are described below:
Level 1 — Unadjusted quoted prices in active markets that are accessible at the measurement date for identical, unrestricted
assets or liabilities;
Level 2 — Quoted prices in markets that are not active or financial instruments for which significant inputs are observable
(including, but not limited to, quoted prices for similar investments, interest rates, foreign exchange rates, volatility and credit
spreads), either directly or indirectly;
Level 3 — Prices or valuations that require significant unobservable inputs (including GSAM’s assumptions in determining
fair value measurement).
Changes in valuation techniques may result in transfers into or out of an assigned level within the hierarchy. In accordance with the
Fund’s policy, transfers between different levels of the fair value hierarchy resulting from such changes are deemed to have
occurred as of the beginning of the reporting period.
The Board of Trustees (“Trustees”) has approved Valuation Procedures that govern the valuation of the portfolio investments
held by the Fund, including investments for which market quotations are not readily available. The Trustees have delegated to
GSAM day-to-day responsibility for implementing and maintaining internal controls and procedures related to the valuation of the
Fund’s investments. To assess the continuing appropriateness of pricing sources and methodologies, GSAM regularly performs
price verification procedures and issues challenges as necessary to third party pricing vendors or brokers, and any differences are
reviewed in accordance with the Valuation Procedures.
A. Level 1 and Level 2 Fair Value Investments — The valuation techniques and significant inputs used in determining the fair
values for investments classified as Level 1 and Level 2 are as follows:
Equity Securities — Equity securities traded on a U.S. securities exchange or the NASDAQ system, or those located on certain
foreign exchanges, including but not limited to the Americas, are valued daily at their last sale price or official closing price on the
principal exchange or system on which they are traded. If there is no sale or official closing price or such price is believed by
GSAM to not represent fair value, equity securities are valued at the last bid price for long positions and at the last ask price for
short positions. To the extent these investments are actively traded, they are classified as Level 1 of the fair value hierarchy,
otherwise they are generally classified as Level 2.
Unlisted equity securities for which market quotations are available are valued at the last sale price on the valuation date, or if
no sale occurs, at the last bid price. Unlisted equities are generally classified as Level 2 (fair valued and single source broker
securities may be treated differently).
Money Market Funds — Investments in the Goldman Sachs Financial Square Government Fund (“Underlying Fund”) are
valued at the NAV of the Institutional Share class on the day of valuation. These investments are generally classified as Level 1 of
the fair value hierarchy. For information regarding an Underlying Fund’s accounting policies and investment holdings, please see
the Underlying Fund’s shareholder report.
Derivative Contracts — A derivative is an instrument whose value is derived from underlying assets, indices, reference rates or a
combination of these factors. The Fund enters into derivative transactions to hedge against changes in interest rates, securities
prices, and/or currency exchange rates, to increase total return, or to gain access to certain markets or attain exposure to other
underliers.
16
G O L D M A N S A C H S V A R I A B L E I N S U R A N C E T R U S T U . S . E Q U I T Y I N S I G H T S F U N D
3 . I N V E S T M E N T S A N D F A I R V A L U E M E A S U R E M E N T S ( c o n t i n u e d )
Exchange-traded derivatives, including futures and options contracts, are valued at the last sale or settlement price and
typically fall within Level 1 of the fair value hierarchy. Over-the-counter (“OTC”) and centrally cleared derivatives are valued
using market transactions and other market evidence, including market-based inputs to models, calibration to market-clearing
transactions, broker or dealer quotations, or other alternative pricing sources. Where models are used, the selection of a particular
model to value OTC and centrally cleared derivatives depends upon the contractual terms of, and specific risks inherent in, the
instrument, as well as the availability of pricing information in the market. Valuation models require a variety of inputs, including
contractual terms, market prices, yield curves, credit curves, measures of volatility, voluntary and involuntary prepayment rates,
loss severity rates and correlations of such inputs. For OTC and centrally cleared derivatives that trade in liquid markets, model
inputs can generally be verified and model selection does not involve significant management judgment. OTC and centrally cleared
derivatives are classified within Level 2 of the fair value hierarchy when significant inputs are corroborated by market evidence.
i. Futures Contracts — Futures contracts are contracts to buy or sell a standardized quantity of a specified commodity or
security and are valued based on exchanged settlement prices or independent market quotes. Futures contracts are valued at the
last settlement price, or in the absence of a sale, the last bid price for long positions and at the last ask price for short positions,
at the end of each day on the board of trade or exchange upon which they are traded. Upon entering into a futures contract, the
Fund deposits cash or securities in an account on behalf of the broker in an amount sufficient to meet the initial margin
requirement. Subsequent payments are made or received by the Fund equal to the daily change in the contract value and are
recorded as variation margin receivable or payable with a corresponding offset to unrealized gains or losses. For financial
reporting purposes, cash collateral that has been pledged to cover obligations of the Fund and cash collateral received, if any,
is reported separately on the Statement of Assets and Liabilities as receivables/payables for collateral on certain derivative
contracts. Non-cash collateral pledged by the Fund, if any, is noted in the Schedule of Investments.
B. Level 3 Fair Value Investments — To the extent that significant inputs to valuation models and other alternative pricing
sources are unobservable, or if quotations are not readily available, or if GSAM believes that such quotations do not accurately
reflect fair value, the fair value of the Fund’s investments may be determined under Valuation Procedures approved by the
Trustees. GSAM, consistent with its procedures and applicable regulatory guidance, may make an adjustment to the most recent
valuation prices of either domestic or foreign securities in light of significant events to reflect what it believes to be the fair value of
the securities at the time of determining the Fund’s NAV. Significant events which could affect a large number of securities in a
particular market may include, but are not limited to: significant fluctuations in U.S. or foreign markets; market dislocations;
market disruptions; or unscheduled market closings. Significant events which could also affect a single issuer may include, but are
not limited to: corporate actions such as reorganizations, mergers and buy-outs; ratings downgrades; and bankruptcies.
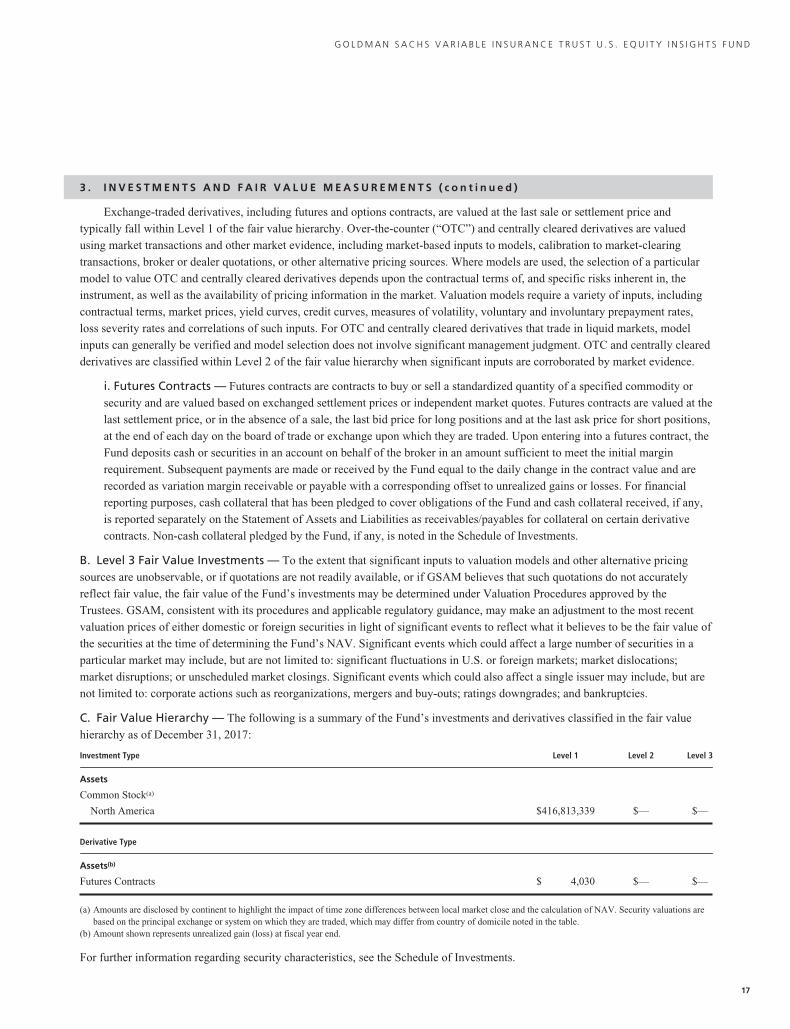
C. Fair Value Hierarchy — The following is a summary of the Fund’s investments and derivatives classified in the fair value
hierarchy as of December 31, 2017:
Investment Type Level 1 Level 2 Level 3
Assets
Common Stock(a)
North America $416,813,339 $— $—
Derivative Type
Assets(b)
Futures Contracts $ 4,030 $— $—
(a) Amounts are disclosed by continent to highlight the impact of time zone differences between local market close and the calculation of NAV. Security valuations arebased on the principal exchange or system on which they are traded, which may differ from country of domicile noted in the table.
(b) Amount shown represents unrealized gain (loss) at fiscal year end.
For further information regarding security characteristics, see the Schedule of Investments.
17

G O L D M A N S A C H S V A R I A B L E I N S U R A N C E T R U S T U . S . E Q U I T Y I N S I G H T S F U N D
Notes to Financial Statements (continued)December 31, 2017
4 . I N V E S T M E N T S I N D E R I V A T I V E S
The following table sets forth, by certain risk types, the gross value of derivative contracts (not considered to be hedging
instruments for accounting disclosure purposes) as of December 31, 2017. These instruments were used as part of the Fund’s
investment strategies and to obtain and/or manage exposure related to the risks below. The values in the table below exclude the
effects of cash collateral received or posted pursuant to these derivative contracts, and therefore are not representative of the Fund’s
net exposure.
Risk Statement of Assets and Liabilities Assets(a) Statement of Assets and Liabilities Liabilities
Equity Variation margin on futures $4,030 — $—
(a) Includes unrealized gain (loss) on futures contracts described in the Additional Investment Information section of the Schedule of Investments. Only the variationmargin as of December 31, 2017 is reported within the Statement of Assets and Liabilities.
The following table sets forth, by certain risk types, the Fund’s gains (losses) related to these derivatives and their indicative
volumes for the fiscal year ended December 31, 2017. These gains (losses) should be considered in the context that these derivative
contracts may have been executed to create investment opportunities and/or economically hedge certain investments, and
accordingly, certain gains (losses) on such derivative contracts may offset certain (losses) gains attributable to investments. These
gains (losses) are included in “Net realized gain (loss)” or “Net change in unrealized gain (loss)” on the Statement of Operations:
Risk Statement of Operations
NetRealized
Gain (Loss)
Net Change inUnrealizedGain (Loss)
AverageNumber ofContracts(a)
Equity Net realized gain (loss) from futures contracts/Net change in unrealized gain (loss) on futurescontracts $514,631 $33,601 30
(a) Average number of contracts is based on the average of month end balances for the fiscal year ended December 31, 2017.
5 . A G R E E M E N T S A N D A F F I L I A T E D T R A N S A C T I O N S
A. Management Agreement — Under the Agreement, GSAM manages the Fund, subject to the general supervision of the
Trustees.
As compensation for the services rendered pursuant to the Agreement, the assumption of the expenses related thereto and
administration of the Fund’s business affairs, including providing facilities, GSAM is entitled to a management fee, accrued daily
and paid monthly, equal to an annual percentage rate of the Fund’s average daily net assets.
For the fiscal year ended December 31, 2017, contractual and effective net management fees with GSAM were at the
following rates:
Contractual Management Rate
Effective NetManagement Rate^
First$1 billion
Next$1 billion
Next$3 billion
Next$3 billion
Over$8 billion
EffectiveRate
0.62% 0.59% 0.56% 0.55% 0.54% 0.62% 0.59%*
^ Effective Net Management Rate includes the impact of management fee waivers of affiliated Underlying Funds, if any.* GSAM agreed to waive a portion of its management fee in order to achieve a net management rate, as defined in the Fund’s most recent prospectus. This waiver will
be effective through at least April 28, 2018, and prior to such date GSAM may not terminate the arrangement without approval of the Trustees. For the fiscal yearended December 31, 2017, GSAM waived $109,764 of its management fee.
The Fund invests in Institutional Shares of the Goldman Sachs Financial Square Government Fund, which is an affiliated
Underlying Fund. GSAM has agreed to waive a portion of its management fee payable by the Fund in an amount equal to the
management fee it earns as an investment adviser to the affiliated Underlying Fund in which the Fund invests, except those
management fees it earns from the Fund’s investments of cash collateral received in connection with securities lending transactions
in the Goldman Sachs Financial Square Government Fund. For the fiscal year ended December 31, 2017, GSAM waived $2,862 of
the Fund’s management fee.
18
G O L D M A N S A C H S V A R I A B L E I N S U R A N C E T R U S T U . S . E Q U I T Y I N S I G H T S F U N D
5 . A G R E E M E N T S A N D A F F I L I A T E D T R A N S A C T I O N S ( c o n t i n u e d )
B. Distribution and/or Service (12b-1) Plan — The Trust, on behalf of Service Shares of the Fund, has adopted a Distribution
and Service Plan subject to Rule 12b-1 under the Act. Under the Distribution and Service Plan, Goldman Sachs, which serves as
distributor, is entitled to a fee accrued daily and paid monthly, for distribution services and personal and account maintenance
services, which may then be paid by Goldman Sachs to authorized dealers, equal to, on an annual basis, 0.25% of the Fund’s
average daily net assets attributable to Service Shares. Goldman Sachs has agreed to waive distribution and service fees so as not to
exceed an annual rate of 0.21% of average daily net assets attributable to Service Shares. This distribution and service fee waiver
will remain in place through at least April 28, 2018, and prior to such date Goldman Sachs may not terminate the arrangement
without the approval of the Trustees. For the fiscal year ended December 31, 2017, Goldman Sachs waived $52,624 in distribution
and service fees for the Fund’s Service Shares.
C. Transfer Agency Agreement — Goldman Sachs also serves as the transfer agent of the Fund for a fee pursuant to the
Transfer Agency Agreement. The fees charged for such transfer agency services are accrued daily and paid monthly at an annual
rate of 0.02% of the average daily net assets of Institutional and Service Shares.
D. Other Expense Agreements and Affiliated Transactions — GSAM has agreed to limit certain “Other Expenses” of the
Fund (excluding acquired fund fees and expenses, transfer agency fees and expenses, service fees and shareholder administration
fees (as applicable), taxes, interest, brokerage fees, expenses of shareholder meetings, litigation and indemnification, and
extraordinary expenses) to the extent such expenses exceed, on an annual basis, a percentage rate of the average daily net assets of
the Fund. Such Other Expense reimbursements, if any, are accrued daily and paid monthly. In addition, the Fund is not obligated to
reimburse GSAM for prior fiscal year expense reimbursements, if any. The Other Expense limitation as an annual percentage rate
of average daily net assets for the Fund is 0.004%. The Other Expense limitation will remain in place through at least April 28,
2018, and prior to such date GSAM may not terminate the arrangement without the approval of the Trustees. For the fiscal year
ended December 31, 2017, GSAM reimbursed $230,686 to the Fund. In addition, the Fund has entered into certain offset
arrangements with the custodian and the transfer agent, which may result in a reduction of the Fund’s expenses and are received
irrespective of the application of the “Other Expense” limitation described above. For the fiscal year ended December 31, 2017,
custody fee credits were $4,905.
E. Line of Credit Facility — As of December 31, 2017, the Fund participated in a $1,100,000,000 committed, unsecured
revolving line of credit facility (the “facility”) together with other funds of the Trust and certain registered investment companies
having management agreements with GSAM or its affiliates. This facility is to be used for temporary emergency purposes, or to
allow for an orderly liquidation of securities to meet redemption requests. The interest rate on borrowings is based on the federal
funds rate. The facility also requires a fee to be paid by the Fund based on the amount of the commitment that has not been utilized.
For the fiscal year ended December 31, 2017, the Fund did not have any borrowings under the facility.
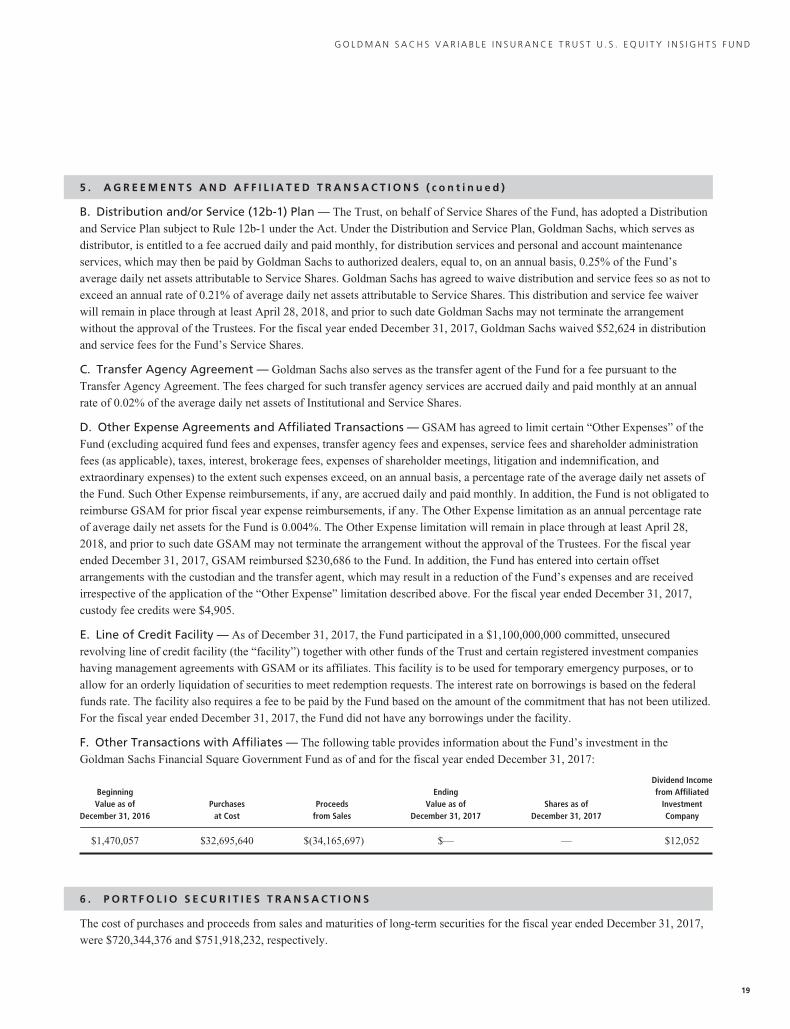
F. Other Transactions with Affiliates — The following table provides information about the Fund’s investment in the
Goldman Sachs Financial Square Government Fund as of and for the fiscal year ended December 31, 2017:
BeginningValue as of
December 31, 2016Purchases
at CostProceeds
from Sales
EndingValue as of
December 31, 2017Shares as of
December 31, 2017
Dividend Incomefrom Affiliated
InvestmentCompany
$1,470,057 $32,695,640 $(34,165,697) $— — $12,052
6 . P O R T F O L I O S E C U R I T I E S T R A N S A C T I O N S
The cost of purchases and proceeds from sales and maturities of long-term securities for the fiscal year ended December 31, 2017,
were $720,344,376 and $751,918,232, respectively.
19

G O L D M A N S A C H S V A R I A B L E I N S U R A N C E T R U S T U . S . E Q U I T Y I N S I G H T S F U N D
Notes to Financial Statements (continued)December 31, 2017
7 . S E C U R I T I E S L E N D I N G
Pursuant to exemptive relief granted by the Securities and Exchange Commission (“SEC”) and the terms and conditions contained
therein, the Fund may lend its securities through a securities lending agent, Goldman Sachs Agency Lending (“GSAL”), a wholly-
owned subsidiary of Goldman Sachs, to certain qualified borrowers including Goldman Sachs and affiliates. In accordance with the
Fund’s securities lending procedures, the Fund receives cash collateral at least equal to the market value of the securities on loan.
The market value of the loaned securities is determined at the close of business of the Fund, at their last sale price or official closing
price on the principal exchange or system on which they are traded, and any additional required collateral is delivered to the Fund
on the next business day. As with other extensions of credit, the Fund may experience delay in the recovery of its securities or incur
a loss should the borrower of the securities breach its agreement with the Fund or become insolvent at a time when the collateral is
insufficient to cover the cost of repurchasing securities on loan. Dividend income received from securities on loan may not be
subject to withholding taxes and therefore withholding taxes paid may differ from the amounts listed in the Statement of
Operations. Loans of securities are terminable at any time and as such 1) the remaining contractual maturities of the outstanding
securities lending transactions are considered to be overnight and continuous and 2) the borrower, after notice, is required to return
borrowed securities within the standard time period for settlement of securities transactions.
The Fund invests the cash collateral received in connection with securities lending transactions in the Goldman Sachs
Financial Square Government Fund (“Government Money Market Fund”), an affiliated series of the Trust. The Government Money
Market Fund is registered under the Act as an open end investment company, is subject to Rule 2a-7 under the Act, and is managed
by GSAM, for which GSAM may receive a management fee of up to 0.205% on an annualized basis of the average daily net assets
of the Government Money Market Fund.
In the event of a default by a borrower with respect to any loan, GSAL will exercise any and all remedies provided under the
applicable borrower agreement to make the Fund whole. These remedies include purchasing replacement securities by applying the
collateral held from the defaulting broker against the purchase cost of the replacement securities. If GSAL is unable to purchase
replacement securities, GSAL will indemnify the Fund by paying the Fund an amount equal to the market value of the securities loaned
minus the value of cash collateral received from the borrower for the loan, subject to an exclusion for any shortfalls resulting from a loss
of value in such cash collateral due to reinvestment risk. The Fund’s loaned securities were all subject to enforceable Securities Lending
Agreements and the value of the collateral was at least equal to the value of the cash received. The amounts of the Fund’s overnight and
continuous agreements represent the gross amounts of recognized liabilities for securities lending transactions outstanding as of
December 31, 2017 are disclosed as “Payable upon return of securities loaned” on the Statement of Assets and Liabilities, where
applicable. The Fund did not have securities on loan as of December 31, 2017.
Both the Fund and GSAL received compensation relating to the lending of the Fund’s securities. The amounts earned, if any,
by the Fund for the fiscal year ended December 31, 2017, are reported under Investment Income on the Statement of Operations.
The table below details securities lending activity with affiliates of Goldman Sachs:
For the fiscal year ended December 31, 2017
Earnings of GSALRelating toSecuritiesLoaned
Amounts Receivedby the Fund
from Lending toGoldman Sachs
Amounts Payable toGoldman SachsUpon Return of
Securities Loaned as of12-31-17
$91 $— $—
The following table provides information about the Fund’s investment in the Government Money Market Fund for the fiscal
year ended December 31, 2017:
BeginningValue as of
December 31, 2016Purchases
at CostProceeds
from Sales
EndingValue as of
December 31, 2017Shares as of
December 31, 2017
$— $5,701,075 $(5,701,075) $— —
20
G O L D M A N S A C H S V A R I A B L E I N S U R A N C E T R U S T U . S . E Q U I T Y I N S I G H T S F U N D
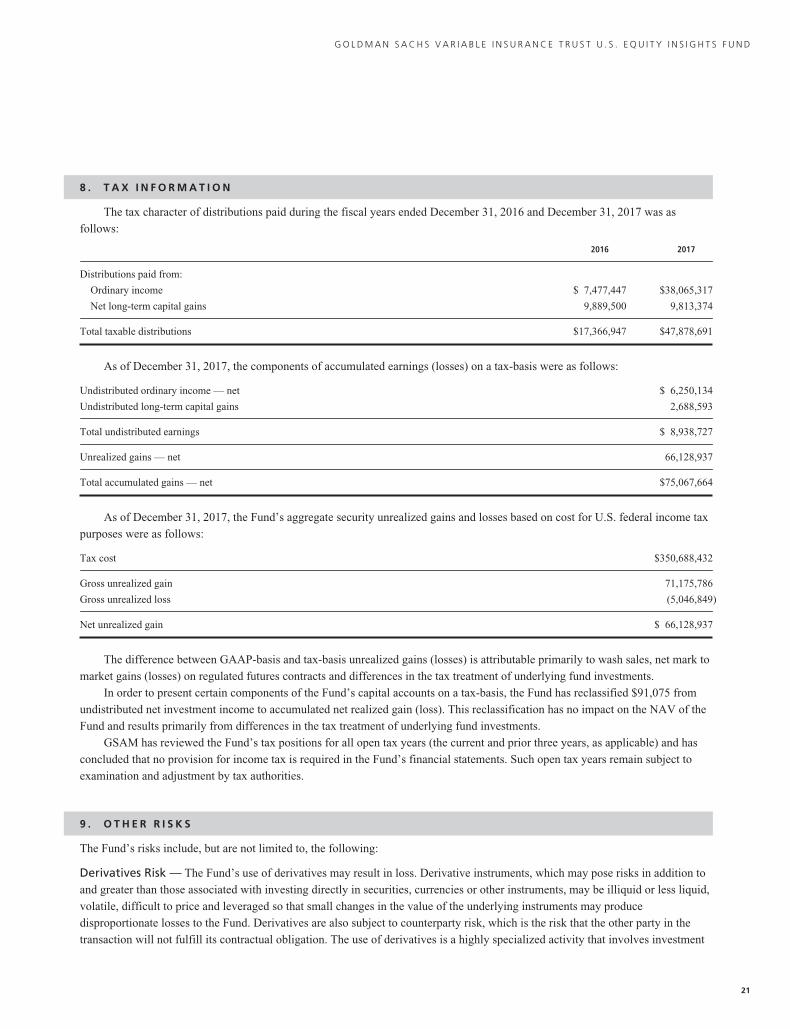
8 . T A X I N F O R M A T I O N
The tax character of distributions paid during the fiscal years ended December 31, 2016 and December 31, 2017 was as
follows:
2016 2017
Distributions paid from:
Ordinary income $ 7,477,447 $38,065,317
Net long-term capital gains 9,889,500 9,813,374
Total taxable distributions $17,366,947 $47,878,691
As of December 31, 2017, the components of accumulated earnings (losses) on a tax-basis were as follows:
Undistributed ordinary income — net $ 6,250,134
Undistributed long-term capital gains 2,688,593
Total undistributed earnings $ 8,938,727
Unrealized gains — net 66,128,937
Total accumulated gains — net $75,067,664
As of December 31, 2017, the Fund’s aggregate security unrealized gains and losses based on cost for U.S. federal income tax
purposes were as follows:
Tax cost $350,688,432
Gross unrealized gain 71,175,786
Gross unrealized loss (5,046,849)
Net unrealized gain $ 66,128,937
The difference between GAAP-basis and tax-basis unrealized gains (losses) is attributable primarily to wash sales, net mark to
market gains (losses) on regulated futures contracts and differences in the tax treatment of underlying fund investments.
In order to present certain components of the Fund’s capital accounts on a tax-basis, the Fund has reclassified $91,075 from
undistributed net investment income to accumulated net realized gain (loss). This reclassification has no impact on the NAV of the
Fund and results primarily from differences in the tax treatment of underlying fund investments.
GSAM has reviewed the Fund’s tax positions for all open tax years (the current and prior three years, as applicable) and has
concluded that no provision for income tax is required in the Fund’s financial statements. Such open tax years remain subject to
examination and adjustment by tax authorities.
9 . O T H E R R I S K S
The Fund’s risks include, but are not limited to, the following:
Derivatives Risk — The Fund’s use of derivatives may result in loss. Derivative instruments, which may pose risks in addition to
and greater than those associated with investing directly in securities, currencies or other instruments, may be illiquid or less liquid,
volatile, difficult to price and leveraged so that small changes in the value of the underlying instruments may produce
disproportionate losses to the Fund. Derivatives are also subject to counterparty risk, which is the risk that the other party in the
transaction will not fulfill its contractual obligation. The use of derivatives is a highly specialized activity that involves investment
21
G O L D M A N S A C H S V A R I A B L E I N S U R A N C E T R U S T U . S . E Q U I T Y I N S I G H T S F U N D
Notes to Financial Statements (continued)December 31, 2017
9 . O T H E R R I S K S ( c o n t i n u e d )
techniques and risks different from those associated with investments in more traditional securities and instruments. Losses from
derivatives can also result from a lack of correlation between changes in the value of derivative instruments and the portfolio assets
(if any) being hedged.
Investments in Other Investment Companies Risk — As a shareholder of another investment company, including an
exchange-traded fund (“ETF”), the Fund will indirectly bear its proportionate share of any net management fees and other expenses
paid by such other investment companies, in addition to the fees and expenses regularly borne by the Fund. ETFs are subject to
risks that do not apply to conventional mutual funds, including but not limited to the following: (i) the market price of the ETF’s
shares may trade at a premium or a discount to their NAV; and (ii) an active trading market for an ETF’s shares may not develop or
be maintained.
Large Shareholder Transactions Risk — The Fund may experience adverse effects when certain large shareholders, such as
other funds, participating insurance companies, accounts and Goldman Sachs affiliates, purchase or redeem large amounts of shares
of the Fund. Such large shareholder redemptions may cause the Fund to sell portfolio securities at times when it would not
otherwise do so, which may negatively impact the Fund’s NAV and liquidity. These transactions may also accelerate the realization
of taxable income to shareholders if such sales of investments resulted in gains, and may also increase transaction costs. In addition,
a large redemption could result in the Fund’s current expenses being allocated over a smaller asset base, leading to an increase in
the Fund’s expense ratio. Similarly, large Fund share purchases may adversely affect the Fund’s performance to the extent that the
Fund is delayed in investing new cash and is required to maintain a larger cash position than it ordinarily would.
Liquidity Risk — The Fund may make investments that are illiquid or that may become less liquid in response to market
developments or adverse investor perceptions. Illiquid investments may be more difficult to value. Liquidity risk may also refer to
the risk that the Fund will not be able to pay redemption proceeds within the allowable time period because of unusual market
conditions, an unusually high volume of redemption requests, or other reasons. To meet redemption requests, the Fund may be
forced to sell investments at an unfavorable time and/or under unfavorable conditions.
Market and Credit Risks — In the normal course of business, the Fund trades financial instruments and enters into financial
transactions where risk of potential loss exists due to changes in the market (market risk). Additionally, the Fund may also be
exposed to credit risk in the event that an issuer or guarantor fails to perform or that an institution or entity with which the Fund has
unsettled or open transactions defaults.
1 0 . I N D E M N I F I C A T I O N S
Under the Trust’s organizational documents, its Trustees, officers, employees and agents are indemnified, to the extent permitted by
the Act and state law, against certain liabilities that may arise out of performance of their duties to the Fund. Additionally, in the
course of business, the Fund enters into contracts that contain a variety of indemnification clauses. The Fund’s maximum exposure
under these arrangements is unknown, as this would involve future claims that may be made against the Fund that have not yet
occurred. However, GSAM believes the risk of loss under these arrangements to be remote.
1 1 . S U B S E Q U E N T E V E N T S
Subsequent events after the Statement of Assets and Liabilities date have been evaluated, and GSAM has concluded that there is no
impact requiring adjustment or disclosure in the financial statements.
22

G O L D M A N S A C H S V A R I A B L E I N S U R A N C E T R U S T U . S . E Q U I T Y I N S I G H T S F U N D
1 2 . S U M M A R Y O F S H A R E T R A N S A C T I O N S
Share activity is as follows:
For the Fiscal Year EndedDecember 31, 2017
For the Fiscal Year EndedDecember 31, 2016
Shares Dollars Shares Dollars
Institutional Shares
Shares sold 358,460 $ 6,845,622 316,144 $ 5,403,266
Reinvestment of distributions 1,635,690 31,912,323 671,831 11,972,029
Shares redeemed (2,153,338) (42,049,816) (2,619,254) (44,715,813)
(159,188) (3,291,871) (1,631,279) (27,340,518)
Service Shares
Shares sold 801,197 15,818,307 615,221 10,515,136
Reinvestment of distributions 815,443 15,966,368 301,729 5,394,918
Shares redeemed (1,114,105) (21,990,356) (1,427,118) (24,577,191)
502,535 9,794,319 (510,168) (8,667,137)
NET INCREASE (DECREASE) 343,347 $ 6,502,448 (2,141,447) $(36,007,655)
23
Report of Independent Registered PublicAccounting Firm
To the Board of Trustees ofGoldman Sachs Variable Insurance Trust and Shareholders of the Goldman Sachs U.S. Equity Insights Fund
Opinion on the Financial Statements
We have audited the accompanying statement of assets and liabilities, including the schedule of investments, of theGoldman Sachs U.S. Equity Insights Fund (the “Fund”) as of December 31, 2017, the related statement of operations for theyear ended December 31, 2017, the statements of changes in net assets for each of the two years in the period endedDecember 31, 2017, including the related notes, and the financial highlights for each of the five years in the period endedDecember 31, 2017 (collectively referred to as the “financial statements”). In our opinion, the financial statements presentfairly, in all material respects, the financial position of the Fund as of December 31, 2017, the results of its operations for theyear then ended, the changes in its net assets for each of the two years in the period ended December 31, 2017 and thefinancial highlights for each of the five years in the period ended December 31, 2017 in conformity with accountingprinciples generally accepted in the United States of America.
Basis for Opinion
These financial statements are the responsibility of the Fund’s management. Our responsibility is to express an opinion onthe Fund’s financial statements based on our audits. We are a public accounting firm registered with the Public CompanyAccounting Oversight Board (United States) (“PCAOB”) and are required to be independent with respect to the Fund inaccordance with the U.S. federal securities laws and the applicable rules and regulations of the Securities and ExchangeCommission and the PCAOB.
We conducted our audits of these financial statements in accordance with the standards of the PCAOB. Those standardsrequire that we plan and perform the audit to obtain reasonable assurance about whether the financial statements are free ofmaterial misstatement, whether due to error or fraud.
Our audits included performing procedures to assess the risks of material misstatement of the financial statements, whetherdue to error or fraud, and performing procedures that respond to those risks. Such procedures included examining, on a testbasis, evidence regarding the amounts and disclosures in the financial statements. Our audits also included evaluating theaccounting principles used and significant estimates made by management, as well as evaluating the overall presentation ofthe financial statements. Our procedures included confirmation of securities owned as of December 31, 2017 bycorrespondence with the custodian and brokers; when replies were not received from brokers, we performed other auditingprocedures. We believe that our audits provide a reasonable basis for our opinion.
PricewaterhouseCoopers LLP
Boston, MassachusettsFebruary 14, 2018
We have served as the auditor of one or more investment companies in the Goldman Sachs Fund complex since 2000.
24
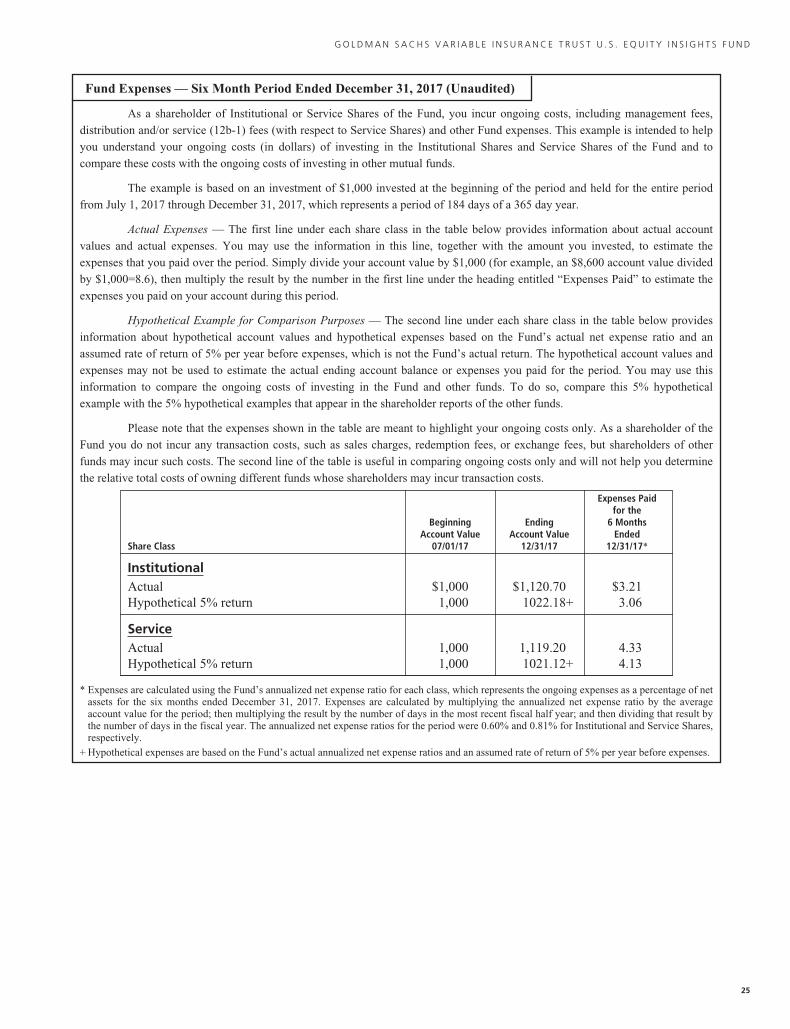
G O L D M A N S A C H S V A R I A B L E I N S U R A N C E T R U S T U . S . E Q U I T Y I N S I G H T S F U N D
Fund Expenses — Six Month Period Ended December 31, 2017 (Unaudited)
As a shareholder of Institutional or Service Shares of the Fund, you incur ongoing costs, including management fees,
distribution and/or service (12b-1) fees (with respect to Service Shares) and other Fund expenses. This example is intended to help
you understand your ongoing costs (in dollars) of investing in the Institutional Shares and Service Shares of the Fund and to
compare these costs with the ongoing costs of investing in other mutual funds.
The example is based on an investment of $1,000 invested at the beginning of the period and held for the entire period
from July 1, 2017 through December 31, 2017, which represents a period of 184 days of a 365 day year.
Actual Expenses — The first line under each share class in the table below provides information about actual account
values and actual expenses. You may use the information in this line, together with the amount you invested, to estimate the
expenses that you paid over the period. Simply divide your account value by $1,000 (for example, an $8,600 account value divided
by $1,000=8.6), then multiply the result by the number in the first line under the heading entitled “Expenses Paid” to estimate the
expenses you paid on your account during this period.
Hypothetical Example for Comparison Purposes — The second line under each share class in the table below provides
information about hypothetical account values and hypothetical expenses based on the Fund’s actual net expense ratio and an
assumed rate of return of 5% per year before expenses, which is not the Fund’s actual return. The hypothetical account values and
expenses may not be used to estimate the actual ending account balance or expenses you paid for the period. You may use this
information to compare the ongoing costs of investing in the Fund and other funds. To do so, compare this 5% hypothetical
example with the 5% hypothetical examples that appear in the shareholder reports of the other funds.
Please note that the expenses shown in the table are meant to highlight your ongoing costs only. As a shareholder of the
Fund you do not incur any transaction costs, such as sales charges, redemption fees, or exchange fees, but shareholders of other
funds may incur such costs. The second line of the table is useful in comparing ongoing costs only and will not help you determine
the relative total costs of owning different funds whose shareholders may incur transaction costs.
Share Class
BeginningAccount Value
07/01/17
EndingAccount Value
12/31/17
Expenses Paidfor the
6 MonthsEnded
12/31/17*
InstitutionalActual $1,000 $1,120.70 $3.21Hypothetical 5% return 1,000 1022.18+ 3.06
ServiceActual 1,000 1,119.20 4.33Hypothetical 5% return 1,000 1021.12+ 4.13
* Expenses are calculated using the Fund’s annualized net expense ratio for each class, which represents the ongoing expenses as a percentage of netassets for the six months ended December 31, 2017. Expenses are calculated by multiplying the annualized net expense ratio by the averageaccount value for the period; then multiplying the result by the number of days in the most recent fiscal half year; and then dividing that result bythe number of days in the fiscal year. The annualized net expense ratios for the period were 0.60% and 0.81% for Institutional and Service Shares,respectively.
+ Hypothetical expenses are based on the Fund’s actual annualized net expense ratios and an assumed rate of return of 5% per year before expenses.
25
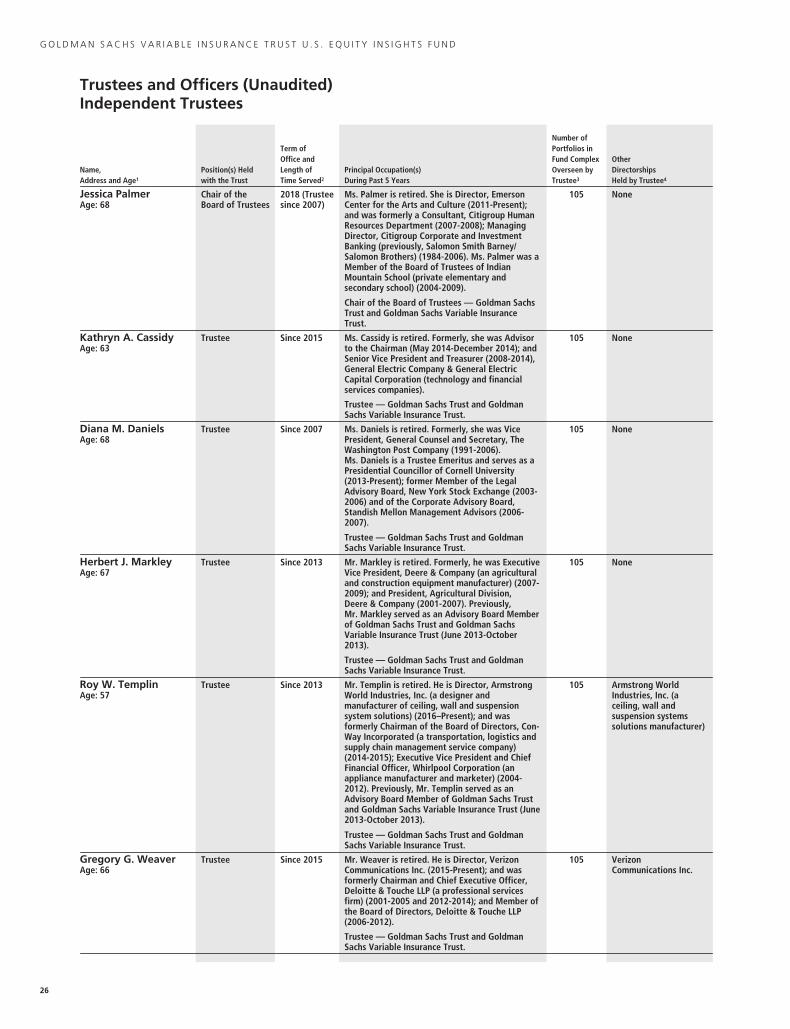
G O L D M A N S A C H S V A R I A B L E I N S U R A N C E T R U S T U . S . E Q U I T Y I N S I G H T S F U N D
Trustees and Officers (Unaudited)Independent Trustees
Name,Address and Age1
Position(s) Heldwith the Trust
Term ofOffice andLength ofTime Served2
Principal Occupation(s)During Past 5 Years
Number ofPortfolios inFund ComplexOverseen byTrustee3
OtherDirectorshipsHeld by Trustee4
Jessica PalmerAge: 68
Chair of theBoard of Trustees
2018 (Trusteesince 2007)
Ms. Palmer is retired. She is Director, EmersonCenter for the Arts and Culture (2011-Present);and was formerly a Consultant, Citigroup HumanResources Department (2007-2008); ManagingDirector, Citigroup Corporate and InvestmentBanking (previously, Salomon Smith Barney/Salomon Brothers) (1984-2006). Ms. Palmer was aMember of the Board of Trustees of IndianMountain School (private elementary andsecondary school) (2004-2009).
Chair of the Board of Trustees — Goldman SachsTrust and Goldman Sachs Variable InsuranceTrust.
105 None
Kathryn A. CassidyAge: 63
Trustee Since 2015 Ms. Cassidy is retired. Formerly, she was Advisorto the Chairman (May 2014-December 2014); andSenior Vice President and Treasurer (2008-2014),General Electric Company & General ElectricCapital Corporation (technology and financialservices companies).
Trustee — Goldman Sachs Trust and GoldmanSachs Variable Insurance Trust.
105 None
Diana M. DanielsAge: 68
Trustee Since 2007 Ms. Daniels is retired. Formerly, she was VicePresident, General Counsel and Secretary, TheWashington Post Company (1991-2006).Ms. Daniels is a Trustee Emeritus and serves as aPresidential Councillor of Cornell University(2013-Present); former Member of the LegalAdvisory Board, New York Stock Exchange (2003-2006) and of the Corporate Advisory Board,Standish Mellon Management Advisors (2006-2007).
Trustee — Goldman Sachs Trust and GoldmanSachs Variable Insurance Trust.
105 None
Herbert J. MarkleyAge: 67
Trustee Since 2013 Mr. Markley is retired. Formerly, he was ExecutiveVice President, Deere & Company (an agriculturaland construction equipment manufacturer) (2007-2009); and President, Agricultural Division,Deere & Company (2001-2007). Previously,Mr. Markley served as an Advisory Board Memberof Goldman Sachs Trust and Goldman SachsVariable Insurance Trust (June 2013-October2013).
Trustee — Goldman Sachs Trust and GoldmanSachs Variable Insurance Trust.
105 None
Roy W. TemplinAge: 57
Trustee Since 2013 Mr. Templin is retired. He is Director, ArmstrongWorld Industries, Inc. (a designer andmanufacturer of ceiling, wall and suspensionsystem solutions) (2016–Present); and wasformerly Chairman of the Board of Directors, Con-Way Incorporated (a transportation, logistics andsupply chain management service company)(2014-2015); Executive Vice President and ChiefFinancial Officer, Whirlpool Corporation (anappliance manufacturer and marketer) (2004-2012). Previously, Mr. Templin served as anAdvisory Board Member of Goldman Sachs Trustand Goldman Sachs Variable Insurance Trust (June2013-October 2013).
Trustee — Goldman Sachs Trust and GoldmanSachs Variable Insurance Trust.
105 Armstrong WorldIndustries, Inc. (aceiling, wall andsuspension systemssolutions manufacturer)
Gregory G. WeaverAge: 66
Trustee Since 2015 Mr. Weaver is retired. He is Director, VerizonCommunications Inc. (2015-Present); and wasformerly Chairman and Chief Executive Officer,Deloitte & Touche LLP (a professional servicesfirm) (2001-2005 and 2012-2014); and Member ofthe Board of Directors, Deloitte & Touche LLP(2006-2012).
Trustee — Goldman Sachs Trust and GoldmanSachs Variable Insurance Trust.
105 VerizonCommunications Inc.
26
G O L D M A N S A C H S V A R I A B L E I N S U R A N C E T R U S T U . S . E Q U I T Y I N S I G H T S F U N D
Trustees and Officers (Unaudited) (continued)Interested Trustee*
Name,Address and Age1
Position(s) Heldwith the Trust
Term ofOffice andLength ofTime Served2
Principal Occupation(s)During Past 5 Years
Number ofPortfolios inFund ComplexOverseen byTrustee3
OtherDirectorshipsHeld by Trustee4
James A. McNamaraAge: 55
President andTrustee
Since 2007 Managing Director, Goldman Sachs (January2000-Present); Director of Institutional FundSales, GSAM (April 1998-December 2000); andSenior Vice President and Manager, DreyfusInstitutional Service Corporation (January 1993-April 1998).
President and Trustee — Goldman Sachs Trust;Goldman Sachs Variable Insurance Trust; GoldmanSachs Trust II; Goldman Sachs MLP IncomeOpportunities Fund; Goldman Sachs MLP andEnergy Renaissance Fund; Goldman Sachs ETFTrust; Goldman Sachs Private Markets Fund 2018LLC; Goldman Sachs Private Markets Fund 2018(A) LLC; and Goldman Sachs Private Markets Fund2018 (B) LLC.
146 None
* Mr. McNamara is considered to be an “Interested Trustee” because he holds positions with Goldman Sachs and owns securities issued by The Goldman Sachs Group,Inc. Mr. McNamara holds comparable positions with certain other companies of which Goldman Sachs, GSAM or an affiliate thereof is the investment adviser,administrator and/or distributor.
1 Each Trustee may be contacted by writing to the Trustee, c/o Goldman Sachs, 200 West Street, New York, New York, 10282, Attn: Caroline Kraus. Information isprovided as of December 31, 2017.
2 Subject to such policies as may be adopted by the Board from time-to-time, each Trustee holds office for an indefinite term, until the earliest of: (a) the election of hisor her successor; (b) the date the Trustee resigns or is removed by the Board or shareholders, in accordance with the Trust’s Declaration of Trust; or (c) thetermination of the Trust. The Board has adopted policies which provide that (a) no Trustee shall hold office for more than 15 years and (b) a Trustee shall retire as ofDecember 31st of the calendar year in which he or she reaches his or her 74th birthday, unless a waiver of such requirement shall have been adopted by a majority ofthe other Trustees. These policies may be changed by the Trustees without shareholder vote.
3 The Goldman Sachs Fund Complex includes certain other companies listed above for each respective Trustee. As of December 31, 2017, Goldman Sachs Trustconsisted of 91 portfolios (90 of which offered shares to the public); Goldman Sachs Variable Insurance Trust consisted of 14 portfolios; Goldman Sachs Trust IIconsisted of 17 portfolios (16 of which offered shares to the public); Goldman Sachs BDC, Inc., Goldman Sachs Private Middle Market Credit LLC, Goldman SachsMLP Income Opportunities Fund, Goldman Sachs MLP and Energy Renaissance Fund, Goldman Sachs Private Markets Fund 2018 LLC, Goldman Sachs PrivateMarkets Fund 2018 (A) LLC and Goldman Sachs Private Markets Fund 2018 (B) LLC each consisted of one portfolio; and Goldman Sachs ETF Trust consisted of19 portfolios (12 of which offered shares to the public). Goldman Sachs Private Middle Market Credit LLC, Goldman Sachs Private Markets Fund 2018 LLC,Goldman Sachs Private Markets Fund 2018 (A) LLC and Goldman Sachs Private Markets Fund 2018 (B) LLC do not offer shares to the public.
4 This column includes only directorships of companies required to report to the Securities and Exchange Commission under the Securities Exchange Act of 1934(i.e., “public companies”) or other investment companies registered under the Act.
Additional information about the Trustees is available in the Fund’s Statement of Additional Information, which can be obtained from Goldman Sachs free of charge bycalling this toll-free number (in the United States of America): 1-800-526-7384.
27
G O L D M A N S A C H S V A R I A B L E I N S U R A N C E T R U S T U . S . E Q U I T Y I N S I G H T S F U N D
Trustees and Officers (Unaudited) (continued)Officers of the Trust*
Name, Address and Age1
Position(s) Heldwith the Trust
Term ofOffice andLength ofTime Served2 Principal Occupation(s) During Past 5 Years
James A. McNamara200 West StreetNew York, NY 10282Age: 55
Trustee andPresident
Since 2007 Managing Director, Goldman Sachs (January 2000-Present); Director of Institutional Fund Sales,GSAM (April 1998-December 2000); and Senior Vice President and Manager, DreyfusInstitutional Service Corporation (January 1993-April 1998).
President and Trustee — Goldman Sachs Trust; Goldman Sachs Variable Insurance Trust;Goldman Sachs Trust II; Goldman Sachs MLP Income Opportunities Fund; Goldman Sachs MLPand Energy Renaissance Fund; Goldman Sachs ETF Trust; Goldman Sachs Private Markets Fund2018 LLC; Goldman Sachs Private Markets Fund 2018 (A) LLC; and Goldman Sachs PrivateMarkets Fund 2018 (B) LLC.
Caroline L. Kraus200 West StreetNew York, NY 10282Age: 40
Secretary Since 2012 Managing Director, Goldman Sachs (January 2016-Present); Vice President, Goldman Sachs(August 2006-December 2015); Associate General Counsel, Goldman Sachs (2012-Present);Assistant General Counsel, Goldman Sachs (August 2006-December 2011); and Associate, Weil,Gotshal & Manges, LLP (2002-2006).
Secretary — Goldman Sachs Trust (previously Assistant Secretary (2012)); Goldman SachsVariable Insurance Trust (previously Assistant Secretary (2012)); Goldman Sachs Trust II;Goldman Sachs BDC, Inc.; Goldman Sachs Private Middle Market Credit LLC; Goldman SachsMiddle Market Lending Corp.; Goldman Sachs MLP Income Opportunities Fund; Goldman SachsMLP and Energy Renaissance Fund; Goldman Sachs ETF Trust; Goldman Sachs Private MarketsFund 2018 LLC; Goldman Sachs Private Markets Fund 2018 (A) LLC; and Goldman Sachs PrivateMarkets Fund 2018 (B) LLC.
Scott M. McHugh200 West StreetNew York, NY 10282Age: 46
Treasurer, SeniorVice President andPrincipal FinancialOfficer
Since 2009(PrincipalFinancialOfficersince 2013)
Managing Director, Goldman Sachs (January 2016-Present); Vice President, Goldman Sachs(February 2007-December 2015); Assistant Treasurer of certain mutual funds administered byDWS Scudder (2005-2007); and Director (2005-2007), Vice President (2000-2005), and AssistantVice President (1998-2000), Deutsche Asset Management or its predecessor (1998-2007).
Treasurer, Senior Vice President and Principal Financial Officer — Goldman Sachs Trust;Goldman Sachs Variable Insurance Trust; Goldman Sachs Trust II; Goldman Sachs MLP IncomeOpportunities Fund; Goldman Sachs MLP and Energy Renaissance Fund; Goldman Sachs ETFTrust; Goldman Sachs Private Markets Fund 2018 LLC; Goldman Sachs Private Markets Fund2018 (A) LLC; and Goldman Sachs Private Markets Fund 2018 (B) LLC.
Joseph F. DiMaria30 Hudson StreetJersey City, NJ 07302Age: 49
Assistant Treasurerand PrincipalAccounting Officer
Since 2016(PrincipalAccountingOfficersince 2017)
Managing Director, Goldman Sachs (November 2015-Present) and Vice President — MutualFund Administration, Columbia Management Investment Advisers, LLC(May 2010-October 2015).
Assistant Treasurer and Principal Accounting Officer — Goldman Sachs Trust; Goldman SachsVariable Insurance Trust; Goldman Sachs Trust II; Goldman Sachs MLP Income OpportunitiesFund; Goldman Sachs MLP and Energy Renaissance Fund; Goldman Sachs ETF Trust; GoldmanSachs Private Markets Fund 2018 LLC; Goldman Sachs Private Markets Fund 2018 (A) LLC; andGoldman Sachs Private Markets Fund 2018 (B) LLC.
* Represents a partial list of officers of the Trust. Additional information about all the officers is available in the Fund’s Statement of Additional Information, which canbe obtained from Goldman Sachs free of charge by calling this toll-free number (in the United States): 1-800-526-7384.
1 Information is provided as of December 31, 2017.2 Officers hold office at the pleasure of the Board of Trustees or until their successors are duly elected and qualified. Each officer holds comparable positions with
certain other companies of which Goldman Sachs, GSAM or an affiliate thereof is the investment adviser, administrator and/or distributor.
28

G O L D M A N S A C H S V A R I A B L E I N S U R A N C E T R U S T U . S . E Q U I T Y I N S I G H T S F U N D
Goldman Sachs Variable Insurance Trust — Tax Information (Unaudited)For the year ended December 31, 2017, 22.36% of the dividends paid from net investment company taxable income bythe U.S. Equity Insights Fund qualify for the dividends received deduction available to corporations.
Pursuant to Section 852 of the Internal Revenue Code, the U.S. Equity Insights Fund designates $9,813,374, or, ifdifferent, the maximum amount allowable, as capital gain dividends paid during the year ended December 31, 2017.
29
TRUSTEES OFFICERSJessica Palmer, Chair James A. McNamara, PresidentKathryn A. Cassidy Scott M. McHugh, Treasurer, Senior ViceDiana M. Daniels President and Principal Financial OfficerHerbert J. Markley Joseph F. DiMaria, Assistant Treasurer and
Principal Accounting OfficerCaroline L. Kraus, Secretary
James A. McNamaraRoy W. TemplinGregory G. Weaver
GOLDMAN SACHS & CO. LLCDistributor and Transfer Agent
GOLDMAN SACHS ASSET MANAGEMENT, L.P.Investment Adviser200 West Street, New YorkNew York 10282
Visit our web site at www.GSAMFUNDS.com to obtain the most recent month-end returns.
The reports concerning the Fund included in this shareholder report may contain certain forward-looking statements about the factors thatmay affect the performance of the Fund in the future. These statements are based on Fund management’s predictions and expectationsconcerning certain future events and their expected impact on the Fund, such as performance of the economy as a whole and of specificindustry sectors, changes in the levels of interest rates, the impact of developing world events, and other factors that may influence thefuture performance of the Fund. Management believes these forward-looking statements to be reasonable, although they are inherentlyuncertain and difficult to predict. Actual events may cause adjustments in portfolio management strategies from those currently expected tobe employed.A description of the policies and procedures that the Fund uses to determine how to vote proxies relating to portfolio securities andinformation regarding how the Fund voted proxies relating to portfolio securities for the 12-month period ended December 31 is available(i) without charge, upon request by calling 1-800-621-2550; and (ii) on the Securities and Exchange Commission (“SEC”) web site athttp://www.sec.gov.The Fund files its complete schedule of portfolio holdings with the SEC for the first and third quarters of each fiscal year on Form N-Q. TheFund’s Form N-Qs are available on the SEC’s web site at http://www.sec.gov within 60 days after the Fund’s first and third fiscal quarters.The Fund’s Form N-Qs may be reviewed and copied at the SEC’s Public Reference Room in Washington, D.C. and information on theoperation of the Public Reference Room may also be obtained by calling 1-800-SEC-0330. Form N-Qs may be obtained upon request andwithout charge by calling 1-800-621-2550.Views and opinions expressed are for informational purposes only and do not constitute a recommendation by GSAM to buy, sell, or holdany security. Views and opinions are current as of the date of this presentation and may be subject to change, they should not be construedas investment advice.Goldman Sachs & Co. LLC (“Goldman Sachs”) does not provide legal, tax or accounting advice. Any statement contained in thiscommunication (including any attachments) concerning U.S. tax matters was not intended or written to be used, and cannot be used, for thepurpose of avoiding penalties under the Internal Revenue Code, and was written to support the promotion or marketing of transaction ormatter addressed. Clients of Goldman Sachs should obtain their own independent tax advice based on their particular circumstances.The website links provided are for your convenience only and are not an endorsement or recommendation by GSAM of any of these websitesor the products or services offered. GSAM is not responsible for the accuracy and validity of the content of these websites.Fund holdings and allocations shown are as of December 31, 2017 and may not be representative of future investments. Fund holdingsshould not be relied on in making investment decisions and should not be construed as research or investment advice regarding particularsecurities. Current and future holdings are subject to risk.References to indices, benchmarks or other measures of relative market performance over a specified period of time are provided for yourinformation only and do not imply that the portfolio will achieve similar results. The index composition may not reflect the manner in which aportfolio is constructed. While an adviser seeks to design a portfolio which reflects appropriate risk and return features, portfoliocharacteristics may deviate from those of the benchmark.The Global Industry Classification Standard (“GICS”) was developed by and is the exclusive property and a service mark of Morgan StanleyCapital International Inc. (“MSCI”) and Standard & Poor’s, a division of The McGraw-Hill Companies, Inc. (“S&P”) and is licensed for use byGoldman Sachs. Neither MSCI, S&P nor any other party involved in making or compiling the GICS or any GICS classifications makes anyexpress or implied warranties or representations with respect to such standard or classification (or the results to be obtained by the usethereof), and all such parties hereby expressly disclaim all warranties of originality, accuracy, completeness, merchantability or fitness for aparticular purpose with respect to any of such standard or classification. Without limiting any of the foregoing, in no event shall MSCI, S&P,any of their affiliates or any third party involved in making or compiling the GICS or any GICS classifications have any liability for any direct,indirect, special, punitive, consequential or any other damages (including lost profits) even if notified of the possibility of such damages.The portfolio risk management process includes an effort to monitor and manage risk, but does not imply low risk.Shares of the Goldman Sachs VIT Funds are offered to separate accounts of participating life insurance companies for the purpose offunding variable annuity contracts and variable life insurance policies. Shares of the Fund are not offered directly to the general public.The variable annuity contracts and variable life insurance policies are described in the separate prospectuses issued by participatinginsurance companies. You should refer to those prospectuses for information about surrender charges, mortality and expense risk feesand other charges that may be assessed by participating insurance companies under the variable annuity contracts or variable lifeinsurance policies. Such fees or charges, if any, may affect the return you may realize with respect to your investments. Ask yourrepresentative for more complete information. Please consider a fund’s objectives, risks and charges and expenses, and read theprospectus carefully before investing. The prospectus contains this and other information about the Fund.This material is not authorized for distribution to prospective investors unless preceded or accompanied by a current prospectus orsummary prospectus, if applicable. Investors should consider the Fund’s objective, risks, and charges and expenses, and read thesummary prospectus, if available, and/or the prospectus carefully before investing or sending money. The summary prospectus, ifavailable, and the prospectus contain this and other information about the Fund and may be obtained from your authorized dealer orfrom Goldman Sachs & Co. LLC by calling 1-800-621-2550.THIS MATERIAL IS FOR INFORMATIONAL PURPOSES ONLY AND IS PROVIDED SOLELY ON THE BASIS THAT IT WILL NOT CONSTITUTEINVESTMENT OR OTHER ADVICE OR A RECOMMENDATION RELATING TO ANY PERSON’S OR PLAN’S INVESTMENT OR OTHERDECISIONS, AND GOLDMAN SACHS IS NOT A FIDUCIARY OR ADVISOR WITH RESPECT TO ANY PERSON OR PLAN BY REASON OFPROVIDING THE MATERIAL OR CONTENT HEREIN INCLUDING UNDER THE EMPLOYEE RETIREMENT INCOME SECURITY ACT OF 1974 ORDEPARTMENT OF LABOR REGULATIONS. PLAN SPONSORS AND OTHER FIDUCIARIES SHOULD CONSIDER THEIR OWN CIRCUMSTANCESIN ASSESSING ANY POTENTIAL COURSE OF ACTION.This report is prepared for the general information of contract owners and is not an offer of shares of the Goldman Sachs Variable InsuranceTrust — Goldman Sachs U.S. Equity Insights Fund.
© 2018 Goldman Sachs. All rights reserved.
VITUSAR-18/119279-OTU-698905/8K